
Group Contribution Revisited: The Enthalpy of Formation of Organic Compounds with “Chemical Accuracy” Part II


Abstract
:1. Introduction
j = 1,N
2. Methods
2.1. Experimental Data and Computational Methods
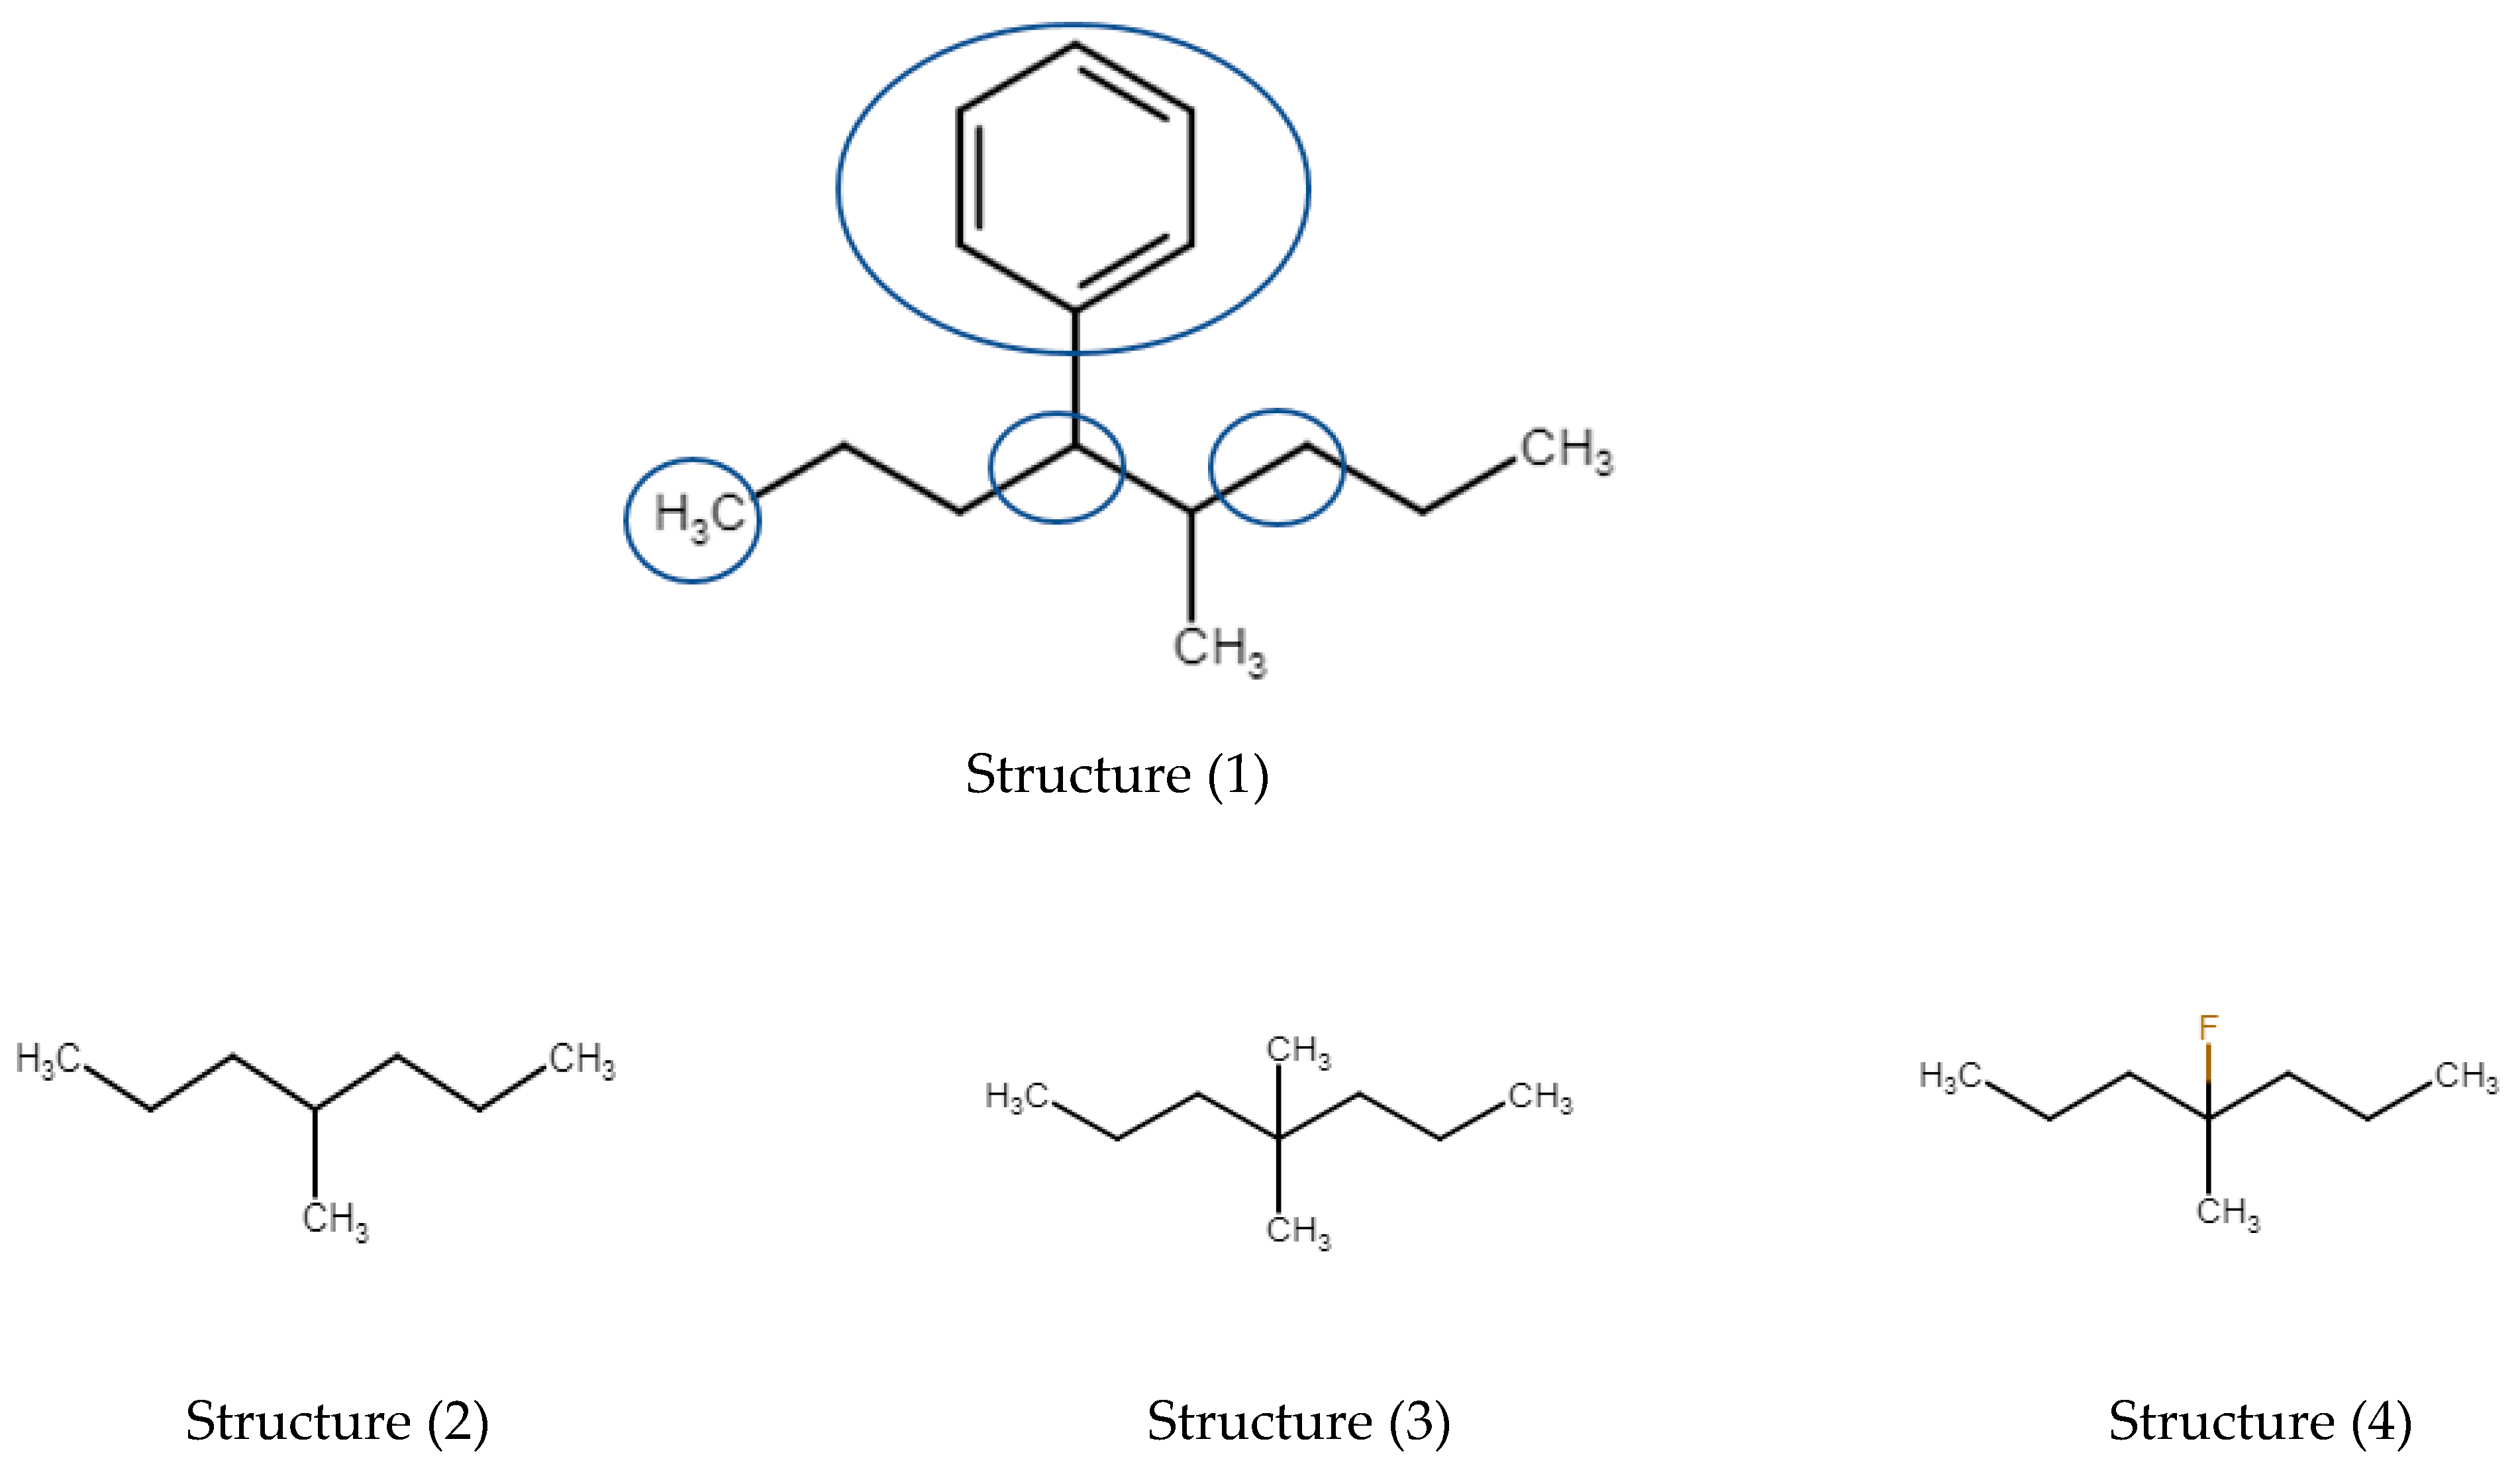
2.2. On Corrections beyond the Isolated Group Approach

| Tri-Substituted Alkylbenzenes | Rossini | Model dHf | Model-Exp | ABS (Model-Exp) | Specific Correction 1,2,3-1,2,4-1,3,5-2,3,4-2,3,5-2,4,5 Substitution |
|---|---|---|---|---|---|
| benzene, 1,2,4-trimethyl- | −13.9 | −12.58 | 1.32 | 1.32 | 1.42 |
| benzene, 1,2,3-trimethyl- | −9.6 | −12.58 | −2.98 | 2.98 | 0.42 |
| benzene, 1,3,5-trimethyl- | −16.08 | −12.58 | 3.50 | 3.50 | 1.10 |
| benzene, 1-ethyl-2,4-dimethyl- (=1,3-dimethyl-5-ethylbenzene) | −35.59 | −33.21 | 2.38 | 2.38 | 0.02 |
| benzene, 1-ethyl-3,5-dimethyl- | −35.6 | −33.21 | 2.39 | 2.39 | 0.01 |
| benzene, 2-ethyl-1,3-dimethyl- | −29.8 | −33.21 | −3.41 | 3.41 | 0.01 |
| 1,3·dimethyl-4-ethylbenzene | −33.12 | −33.21 | −0.09 | 0.09 | 0.01 |
| benzene, 2-ethyl-1,4-dimethyl- | −33.12 | −33.21 | −0.09 | 0.09 | 0.01 |
| benzene, 3-ethyl-1,2-dimethyl- | −29.77 | −33.21 | −3.44 | 3.44 | 0.04 |
| benzene, 4-ethyl-1,2-dimethyl- | −33.12 | −33.21 | −0.09 | 0.09 | 0.01 |
| averaged absolute difference | 1.97 | 0.30 | |||
3. Results
3.1. Alkyl-Substituted Alkanes: Introduction
3.1.1. Mono-Methyl Alkanes
3.1.2. Dimethyl Alkanes
3.1.3. Tri-, Tetra-, and Pentamethyl Alkanes
3.1.4. Methyl-Ethyl and (iso)Propyl-Alkanes
3.1.5. Summary Alkylalkanes
3.2. Alkyl-Alcohols
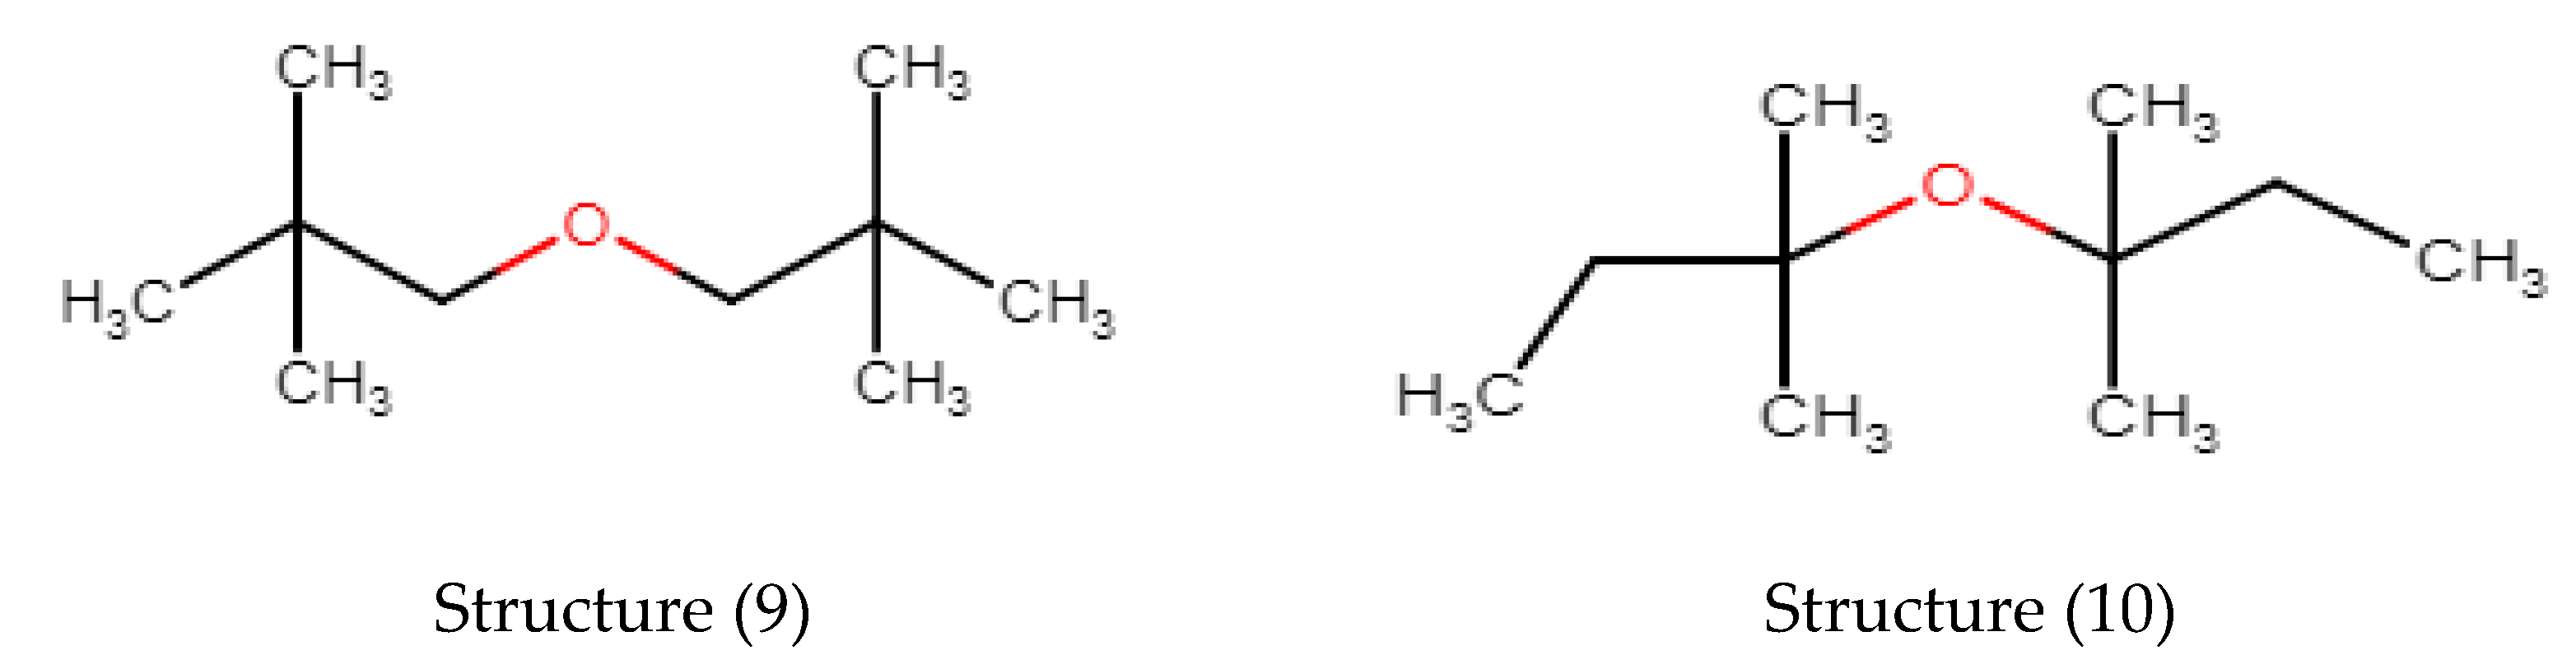
3.3. Alkylethers
| Methyl-Alkyl-Ethers | Verevkin 2002 | Model dHf | Model-Exp | ABS (Model-Exp) | Ether Group Constitution | GC Value Ether Group | COC Valence Angle |
|---|---|---|---|---|---|---|---|
| dimethylether | −184.1 | −184.1 | 0.00 | 0.00 | Me-O-Me | −184.1 | 112.7 |
| methyl ethyl ether | −216.4 | −217.36 | −0.96 | 0.96 | Me-O-C-R | −175 | 113.1 |
| methyl propyl ether | −238.4 | −237.99 | 0.41 | 0.41 | Me-O-C-R | 113.1 | |
| methyl n-butyl ether | −258.3 | −258.62 | −0.32 | 0.32 | Me-O-C-R | 113.1 | |
| methyl decyl ether | −381.1 | −382.4 | −1.30 | 1.30 | Me-O-C-R | 113.1 | |
| methyl isopropyl ether | −252 | −252.72 | −0.72 | 0.72 | Me-O-CRR′ | −168 | 115.1 |
| methyl t-butylether | −283.4 | −282.08 | 1.32 | 1.32 | Me-O-CRR′R″ | −156 | 118.4 |
| methyl t-amylether | −301.1 | −302.71 | −1.61 | 1.61 | Me-O-CRR′R″ | 118.7 | |
| averaged absolute difference | 0.83 | ||||||
| Di-Alkyl Ethers | Verevkin 2002 | Model dHf | Model-Exp | ABS (Model-Exp) | Ether Group Constitution | GC Value Ether Group | COC Valence Angle |
| diethylether | −252.1 | −252.72 | −0.62 | 0.62 | R-COC-R′ | −168 | 113.5 |
| ethyl propyl ether | −272.4 | −273.35 | −0.95 | 0.95 | R-COC-R′ | 113.5 | |
| ethyl butyl ether | −293.98 | R-COC-R′ | 113.5 | ||||
| di-n-propylether | −293.1 | −293.98 | −0.88 | 0.88 | R-COC-R′ | 113.5 | |
| di-n-butylether | −332.9 | −335.24 | −2.34 | 2.34 | R-COC-R′ | 113.7 | |
| di-n-pentylether | −380.4 | −376.5 | 3.90 | 3.90 | R-COC-R′ | 113.4 | |
| ethyl t-amylether | −333.5 | −336.07 | −2.57 | 2.57 | R-COC-R′R″R‴ | −146 | 119.4 |
| butyl t-amylether | −375.7 | −377.33 | −1.63 | 1.63 | R-COC-R′R″R‴ | 119.1 | |
| ethyl t-butylether | −316.8 | −315.44 | 1.36 | 1.36 | R-COC-R′R″R‴ | 118.8 | |
| propyl t-butylether | −339.3 | −336.07 | 3.23 | 3.23 | R-COC-R′R″R‴ | 118.7 | |
| n-butyl t-butylether | −360.1 | −356.7 | 3.40 | 3.40 | R-COC-R′R″R‴ | 118.6 | |
| amyl t-butylether | −380.6 | −377.33 | 3.27 | 3.27 | R-COC-R′R″R‴ | 118.6 | |
| di-i-propylether | −319.4 | −318.44 | 0.96 | 0.96 | RR′-COC-R″R‴ | −149 | 116 |
| di-sec-butylether | −361.3 | −359.7 | 1.60 | 1.60 | RR′-COC-R″R‴ | 116.5 | |
| t-butyl s-butylether | −379 | −381.43 | −2.43 | 2.43 | RR′-COC-R″R‴R⁗ | −149 | 119.8 |
| t-butyl i-propylether | −360.1 | −360.8 | −0.70 | 0.70 | RR′-COC-R″R‴R⁗ | 119.9 | |
| t-butyl i-butylether | −367.9 | −364.8 | 3.10 | 3.10 | RR′-COC-R″R‴R⁗ | 119 | |
| di- t-butylether | −361.2 | −361.16 | 0.04 | 0.04 | tBU-COC-tBu | −107 | 128 |
| averaged absolute difference | 1.94 | ||||||
3.4. Dienes
- -
- Double bonds are isolated if they are separated by two or more single bonds so that they cannot interact with each other;
- -
- Double bonds are conjugated if they are separated by just one single bond. Because of the interaction between the double bonds, systems containing conjugated double bonds are more stable than similar systems with isolated double bonds;
- -
- Successive double bonds with no intervening single bonds are called cumulated double bonds. Systems containing cumulated double bonds are less stable than similar systems with isolated double bonds.
- terminal C=C- +62.5 kJ/mol
- trans R-C=C-R’ +73.5 kJ/mol
- cis R-C=C-R’ +78 kJ/mol
- C=C=C +205 kJ/mol
- and a conjugation correction of −17 kJ/mol for all conjugated species (up till and including 1,3-butadiene). Whereas these parameters generally provide suitable model values (within chemical accuracy from the experiment), initially, there were two exceptions, namely propadiene and 2,3-pentadiene. For propadiene, the reason is that we have defined C=C=C- as a group [1], but propadiene does not have a further bond; it is simply C=C=C. When we compare the group value −62.5 kJ/mol for C=C- with ethylene 52.4 kJ/mol, the C=C group value for the non-bonded species is 10 kJ/mol lower. When we apply such a correction to propadiene, in fact, we will adopt −11 kJ/mol as this is more consistent with what comes next (2,3-pentadiene), and it provides a better agreement between model and experimental value for propadiene, we obtain the suitable model value shown in Table 3. Similarly, for 2,3-pentadiene, the suitable value in Table 3 was obtained after an additional correction of +11 kJ/mol, which is the difference between the double bond group value of 62.5 kJ/mol previously established for 1-alkenes C=C- and 73.5 kJ/mol for disubstituted double bonds R-C=C-R’.
4. Final Discussion and Conclusions
Supplementary Materials
Funding
Institutional Review Board Statement
Informed Consent Statement
Data Availability Statement
Acknowledgments
Conflicts of Interest
References
- Meier, R.J. Group Contribution Revisited: The Enthalpy of Formation of Organic Compounds with “Chemical Accuracy”. ChemEngineering 2021, 5, 24. [Google Scholar] [CrossRef]
- Van Krevelen, D.W.; Chermin, H.A.G. Estimation of the free enthalpy (Gibbs free energy) of formation of organic compounds from group contributions. Chem. Eng. Sci. 1951, 1, 66–80. [Google Scholar] [CrossRef]
- Pijpers, A.P.; Meier, R.J. Core level photoelectron spectroscopy for polymer and catalyst characterisation. Chem. Soc. Rev. 1999, 28, 233–238. [Google Scholar] [CrossRef]
- Marrero, J.; Gani, R. Group-contribution based estimation of pure component properties. Fluid Phase Equilibria 2001, 183–184, 183–208. [Google Scholar] [CrossRef]
- Proped (Property Prediction) Module Version 4.7 in ICAS23. Available online: https://www.kt.dtu.dk/english/research/kt-consortium/software (accessed on 10 November 2021).
- Hukkerikar, A.S.; Meier, R.J.; Sin, G.; Gani, R. A method to estimate the enthalpy of formation of organic compounds with chemical accuracy. Fluid Phase Equilibria 2013, 348, 23–32. [Google Scholar] [CrossRef]
- Kadda, A.; Mustapha, B.A.; Yahiaoui, A.; Toubal Khaled, T.; Hadji, D. Enthalpy of Formation Modeling Using Third Order Group Contribution Technics and Calculation by DFT Method. Int. J. Thermodyn. 2020, 23, 34–41. [Google Scholar] [CrossRef]
- Das, G.; dos Ramos, M.C.; McCabe, C. Accurately modeling benzene and alkylbenzenes using a group contribution based SAFT approach. Fluid Phase Equilibria 2014, 362, 242–251. [Google Scholar] [CrossRef]
- Verevkin, S.P.; Emel’yanenko, V.N.; Diky, V.; Muzny, C.D.; Chirico, R.D.; Frenkel, M. New Group-Contribution Approach to Thermochemical Properties of Organic Compounds: Hydrocarbons and Oxygen-Containing Compounds. J. Phys. Chem. Ref. Data 2013, 42, 033102. [Google Scholar] [CrossRef] [Green Version]
- Mathieu, D. Atom Pair Contribution Method: Fast and General Procedure to Predict Molecular Formation Enthalpies. J. Chem. Inf. Model. 2018, 58, 12–26. [Google Scholar] [CrossRef]
- Available online: https://webbook.nist.gov/ (accessed on 10 November 2021).
- Nielsen, T.; Abildskov, J.; Harper, P.; Papaeconomou, I.; Gani, R. The CAPEC Data Base. J. Chem. Eng. Data 2001, 46, 1041–1044. [Google Scholar] [CrossRef]
- Spartan ’10; Wavefunction Inc.: Irvine, CA, USA. Available online: www.wavefun.com (accessed on 10 November 2021).
- Prosen, E.J.; Johnson, W.H.; Rossini, F.D. Heats of combustion and formation at 25 °C of the alkylbenzenes through C10H14. and of the higher normal monoalkylbenzenes. J. Res. Natl. Bur. Stand. 1946, 36, 455–461. [Google Scholar] [CrossRef]
- Hukkerikar, A.S. Development of Pure Component Property Models for Chemical Product-Process Design and Analysis. Ph.D. Thesis, Danish Technical University (DTU), Kgs. Lyngby, Denmark, 2013. Available online: https://backend.orbit.dtu.dk/ws/portalfiles/portal/59650003/Amol+S.+Hukkerikar_PEC13-42.pdf (accessed on 10 November 2021).
- Rüchardt, C.; Beckhaus, H.-D. Consequences of Strain for the Structure of Aliphatic Molecules. Angew. Chem. Int. Ed. Engl. 1985, 24, 529–538. [Google Scholar] [CrossRef] [Green Version]
- Rüchardt, C.; Beckhaus, H.-D. Steric and Electronic Substituent Effects on the Carbon-Carbon Bond. Top. Curr. Chem. 1986, 130, 1–22. [Google Scholar]
- Prosen, E.J.; Rossini, F.D. Heats of combustion and formation of the paraffin hydrocarbons at 25 °C. J. Res. Natl. Bur. Stand. 1945, 34, 263–269. [Google Scholar] [CrossRef]
- Labbauf, A.; Greenshields, J.B.; Rossini, F.D. Heats of formation, combustion, and vaporization of the 35 nonanes and 75 decanes. J. Chem. Eng. Data 1961, 6, 261–263. [Google Scholar] [CrossRef]
- Smith, D.W. Carbon.carbon π-antibonding effects on the thermochemistry of alkanes, elucidated by angular overlap and MO calculations. Phys. Chem. Chem. Phys. 2001, 3, 3562–3568. [Google Scholar] [CrossRef]
- Roganov, G.N.; Pisarev, P.N.; Emel’yanenko, V.N.; Verevkin, S.P. Measurement and Prediction of Thermochemical Properties. Improved Benson-Type Increments for the Estimation of Enthalpies of Vaporization and Standard Enthalpies of Formation of Aliphatic Alcohols. J. Chem. Eng. Data 2005, 50, 1114–1124. [Google Scholar] [CrossRef]
- Verevkin, S.P. Improved Benson Increments for the Estimation of Standard Enthalpies of Formation and Enthalpies of Vaporization of Alkyl Ethers, Acetals, Ketals, and Ortho Esters. J. Chem. Eng. Data 2002, 47, 1071–1097. [Google Scholar] [CrossRef]
- Kilpatrick, J.E.; Beckett, C.W.; Prosen, E.; Pitzer, K.S.; Rossini, F.D. Heats, Equilibrium Constants, and Free Energies of Formation of the C3 to C5 Diolefins, Styrene, and the Methylstyrenes. J. Res. Natl. Bur. Stand. 1949, 42, 225–240. [Google Scholar] [CrossRef]
- Prosen, E.J.; Maron, F.W.; Rossini, F.D. Heats of combustion, formation, and insomerization of ten C4 hydrocarbons. J. Res. Natl. Bur. Stand. 1951, 46, 106–112. [Google Scholar] [CrossRef]
- Fraser, F.M.; Prosen, E.J. Heats of Combustion and Isomerization of Six Pentadienes and Spiropentane. J. Res. Natl. Bur. Stand. 1955, 54, 143–148. [Google Scholar] [CrossRef]
- Fang, W.; Rogers, D.W. Enthalpy of hydrogenation of the hexadienes and cis- and trans-1,3,5-hexatriene. J. Org. Chem. 1992, 57, 2294–2297. [Google Scholar] [CrossRef]


| Dienes | Rossini 1949 | Prosen, Maron, and Rossini 1951 | Fraser and Prosen 1955 | Fang and Rogers 1992 | Model dHf | Model-Exp | ABS (Model-Exp) |
|---|---|---|---|---|---|---|---|
| 1,4-pentadiene | 105.5 | 106.4 | 104.37 | −2.03 | 2.03 | ||
| 1,4-hexadiene | 77 | 73.01 | −3.99 | 3.99 | |||
| 1,5-hexadiene | 85 | 83.74 | −1.26 | 1.26 | |||
| cis-1,3-hexadiene | 59 | 60.51 | 1.51 | 1.51 | |||
| trans-1,3-hexadiene | 54 | 56.01 | 2.01 | 2.01 | |||
| cis 1,3-pentadiene, (Z)- | 82.8 | 81.14 | −1.66 | 1.66 | |||
| trans 1,3-pentadiene | 75.8 | 76.64 | 0.84 | 0.84 | |||
| trans-2,4-hexadiene | 44 | 45.28 | 1.28 | 1.28 | |||
| 1,3-butadiene | 112 | 108.9 | 108 | −0.90 | 0.9 | ||
| Propadiene | 192.3 | 194 | 1.70 | 1.7 | |||
| 1,2-butadiene | 165.6 | 162.3 | 162.64 | 0.34 | 0.34 | ||
| 1,2-pentadiene | 145.7 | 140.85 | 142.01 | 1.16 | 1.16 | ||
| 2,3-pentadiene | 138.6 | 133.1 | 131.28 | −1.82 | 1.82 | ||
| averaged absolute difference | 1.58 | ||||||
Publisher’s Note: MDPI stays neutral with regard to jurisdictional claims in published maps and institutional affiliations. |
© 2021 by the author. Licensee MDPI, Basel, Switzerland. This article is an open access article distributed under the terms and conditions of the Creative Commons Attribution (CC BY) license (https://creativecommons.org/licenses/by/4.0/).
Share and Cite
Meier, R.J. Group Contribution Revisited: The Enthalpy of Formation of Organic Compounds with “Chemical Accuracy” Part II. AppliedChem 2021, 1, 111-129. https://doi.org/10.3390/appliedchem1020009
Meier RJ. Group Contribution Revisited: The Enthalpy of Formation of Organic Compounds with “Chemical Accuracy” Part II. AppliedChem. 2021; 1(2):111-129. https://doi.org/10.3390/appliedchem1020009
Chicago/Turabian StyleMeier, Robert J. 2021. "Group Contribution Revisited: The Enthalpy of Formation of Organic Compounds with “Chemical Accuracy” Part II" AppliedChem 1, no. 2: 111-129. https://doi.org/10.3390/appliedchem1020009
APA StyleMeier, R. J. (2021). Group Contribution Revisited: The Enthalpy of Formation of Organic Compounds with “Chemical Accuracy” Part II. AppliedChem, 1(2), 111-129. https://doi.org/10.3390/appliedchem1020009