1. Introduction
Education policies assist in establishing priorities, allocating resources and establishing standards for a country’s educational system. As a result, education policies play an essential role in determining a society’s future by defining the educational landscape and guaranteeing the quality of education offered to future citizens [
1]. Furthermore, education policies can contribute to addressing societal issues of equity and justice, for example by ensuring that all students, regardless of socioeconomic origin, have access to a high-quality education and an opportunity to progress [
2].
Given the importance of education polices, it is essential that policymakers and educators are aware of the impact of the implemented policies and continually evaluate and revise them to ensure they achieve their goals [
3]. Unfortunately, the actual impact of education policies is not easy to assess reliably and objectively [
4]; even the most modern and detailed education policy implementation guidelines put the emphasis on smart design and strong stakeholder involvement, lacking the safety and additional optimisation a “review and revise” step might provide [
5].
In an attempt to overcome this, in this work we focus on remedial teaching, an education policy currently being implemented in Greece. Inequality in education is something well established internationally [
6] and Greece is no exception. As a response to this, the remedial teaching policy has been established in elementary education, aimed at providing additional support to less privileged students, so that they also have the opportunity to progress and excel. The policy has been implemented via a huge investment in both economic and human resources, has been heralded as a huge success and is now being extended to high school.
In this work we make use of the data recorded in the school information system and conduct an objective, data based assessment of the impact and efficiency of the policy. Although the data recorded in the system do not contain information aimed specifically to monitor the implementation of the remedial teaching policy, we follow a “black box” approach that allows us to evaluate the effectiveness of the policy even in the absence of more specific data. We achieve this by looking at the education system as a whole and assessing whether it has acquired the equality characteristics that remedial teaching was intended to introduce. An important aspect of our work is that the examination is not limited to a single point in time but instead we track students over a period of three consecutive years, which gives us the opportunity to examine whether the short-term effects of the policy are maintained in the longer term or not.
This work is an extension of earlier work, in which we presented the data set and examined how demographic characteristics such as parents’ occupation correlate with students’ academic performance [
7]. In the current work we take a further step, for the first time looking specifically at a particular education policy, that of remedial teaching.
Our findings partially contradict the widely held view that remedial teaching is an extremely successful policy, underlining the importance of objective, data based evaluations. They also suggest the need and prove the potential to use school information system data in order to evaluate other policies as they are implemented. Finally, they provide motivation to strengthen the data gathering efforts, so that future works can achieve even more detailed assessments of implemented policies.
The remainder of the article is organised as follows: In
Section 2 we briefly present the remedial teaching education policy, as it is currently implemented in Greece.
Section 3 presents the data set that this work is based on together with the pre-processing that was performed in order to facilitate the analysis that will follow. Moving on to the core part of our work, in
Section 4 we delve into the data, assessing different aspects of the short- and long- term impact of the remedial teaching policy. Finally, in
Section 5 we discuss our findings, their implications and their limitations, and in
Section 6 we list our concluding remarks.
2. Remedial Teaching
The Greek Ministry of Education has set a goal of creating a school system of equal opportunities, in which every child has a fair chance to do well, progress and excel, setting the bases for future academic, professional, social and personal success.
On the other hand, it is well established in the literature that parents’ occupation and social status are strongly correlated with children’s academic prospects and performance [
8]. Particularly for the case of Greece, in our earlier work it was established that children whose parents are professionals tend to perform much better in school than children whose parents work in elementary occupations. In the rest of this article we will refer to children whose parental occupation is correlated to strong childrens’ academic performance as “privileged” and to children whose parental occupation is correlated to weak academic performance as “disadvantaged”; we cannot stress enough that this is a notation used in this text only for convenience and simplicity, without implying that parents’ occupation alone determines whether someone is privileged or disadvantaged in education and in life.
In accordance with the overall goal of providing education of equal opportunities, in an effort to address the aforementioned barrier of parental occupation, the ministry has introduced the education policy of remedial teaching in primary school. According to this policy, surplus teachers are present at each school with the purpose of providing additional support to those pupils who are struggling. As it is mainly disadvantaged pupils who are struggling, the measure is meant to target them primarily.
In the implementation of remedial teaching, struggling students are removed from the class during some of the courses that are considered less important academically (e.g., arts or physical education) and instead work on a one-on-one basis with the remedial teacher, revising or working further on core subjects such as mathematics, language and science. In theory, this additional support should help students not only do better in their core subjects, but also help them gain confidence and build a stronger academic background that will help them do better in all other courses as well. The complete list of courses for which remedial teaching is offered in each grade is presented in
Table 1.
Remedial teaching has been a flagship policy, employing approximately 3930 additional teachers and costing the state approximately EUR 31.9 million per year. It is a measure that has been welcomed by parents and teachers alike and has been heralded as exceptionally successful. As a result, it is now in the process of being extended to include more courses and also cover high school. This extension is hoped to take the school system even closer to being a system of equal opportunities, and will also augment the already huge investment in workforce and money spent.
The already huge investment of resources, together with the planned additional investment, makes the assessment of the effectiveness of the policy even more important, so that any weaknesses are identified and addressed in a timely and efficient manner.
3. The Data Set
During the 2015–2016 school year, the Ministry of Education in Greece launched a new integrated Educational Management Information System (EMIS) known as “myschool”. This EMIS holds all data on students attending all 14 levels of primary and secondary education. School principals across the country are responsible for entering the data. Information recorded in EMIS includes:
Demographic characteristics of the students and their families, such as age, gender, profession of parents, nationality, religious affiliation, etc.
Records of the students’ academic performance, such as grades per subject, attendance and absences in class, and notes on behaviour.
Information regarding the teaching staff, such as their contractual status, their contact information, the classes they teach, the number of hours they teach each week, the qualifications they possess, their historical teaching and employment records, etc.
Data regarding the schools, such as their address, the contact person, facilities and resources available, requests they have submitted for the recruitment of additional teachers, etc.
For this study, we have been provided with a segment of this data set. Specifically, we have been provided with demographic and academic records for all students attending the fifth grade of elementary school, the sixth grade of elementary school and the first level of high school during three consecutive years (2016–2017, 2017–2018 and 2018–2019).
The data set is anonymised, i.e., it is not possible to identify any specific student. It contains pseudo-identifiers (the same unique id is associated with all the records that are related to the same student) which allow for students’ progress to be tracked from year to year.
There are in total 317,918 records in the data set, each one corresponding to a pupil’s records for a whole year and including the grades for each course and each term, the absences, the notes on behaviour, the demographic information, etc. We are honoured and humbled that we are the first and to the this day only research team to have been given access to this data set, which is considerably larger than any other data set regarding the Greek educational system that has been made available to researchers in the past and the only one that contains data from consecutive years.
A brief presentation of the data set and a first look at the conclusions that can be drawn from analysing it have been included in our earlier work [
7].
3.1. Pre-Processing and Earlier Work
As we have already mentioned, in this work we aim to track the pupils’ progress over a period of three years, starting from the fifth grade in elementary school during academic year 2016–2017 and going up to the first grade in high school during academic year 2018–2019. But not all pupils progress in the same way. Some are forced to repeat a year, some drop out of school, some move abroad, others come from abroad and join directly in some grade without having the records of their previous years of study in the system. As a result, not all records are part of a “normal” three year progression.
As a first pre-processing step, the pseudo-identifiers are used to associate the records of the three years that correspond to the same students. The remaining records (those for which we do not have records of the students’ performance for all three examined academic years) are discarded. As shown in
Table 2, this process produced more than 85,000 complete records to be considered in the next steps of our examination.
A further issue to consider is that the three academic years considered in our study do not include exactly the same courses in their curriculum.
Even when records are consolidated and students are successfully tracked from year to year, the comparison of a single student’s performance from year to year is not straightforward due to the differences in the structure of the curriculum. In
Table 3 we summarise the courses taught in each grade. Firstly, we observe that there are differences in the core courses offered. For example elementary school has “Social and Political Education” that is not offered in high school and similarly high school has “Ancient Greek Language” which is not offered in elementary school. Moreover, there are courses that are not offered to all. Examples are “Italian language”, that is only offered in a very small number of schools due to the existence of only a few teachers for it, and “Religious Education” for which some students request and receive an exemption.
As a result, academic performance records are not easy to compare from year to year, or even from student to student within the same year. In order to overcome this, the students’ GPA is calculated and is used as the core parameter based on which we assess academic performance and track progress from year to year.
Then, there is the issue of how academic performance is scored. While in elementary school scores are in the 1–10 range (elementary school grading range
https://www.et.gr/api/DownloadFeksApi/?fek_pdf=20170204358, accessed on 1 June 2023), in high school they are in the 0–20 range (high school grading range
https://www.esos.gr/arthra/65546/meta-tis-giortes-i-agonia-ton-mathiton-gia-tis-vathmologies-toy-tetraminoy, accessed on 1 June 2023) as per Greek legislation. Moreover, as part of another implemented education policy that aims to award effort in early education years and achievements in more mature years, high performance scores are harder to get as students move to higher education grades; this is in accordance with practices in other countries as well [
9]. As a consequence, even in elementary school where scoring is in the same range, students that are maintaining the same level of performance might appear to have lower academic scores as they move from fifth to sixth grade.
In order to overcome these issues, the approach of [
7] is followed. According to this approach, the GPAs of all students attending the same year are clustered into different performance groups using fuzzy c-means. Interestingly, it is found that exactly four academic performance groups exist in all examined years; we label them as A: excellent academic performance, B: strong academic performance, C: weak academic performance and D: very weak academic performance.
The identified fuzzy clusters are summarised in
Table 4. We then classify each GPA to the group with which it has the best match. Since this classification takes into account the way GPA scores are distributed only within the same academic grade, it overcomes the issues mentioned in the previous paragraph regarding different scoring in different grades. So, continuing from the earlier example, even if students’ numerical scores seem to have dropped from fifth to sixth grade, if the students have the same academic performance they will remain in the same performance group.
3.2. Extending Our Earlier Work
Since the main goal of the remedial teaching policy is to support disadvantaged students, before anything else we need to define which students fall into that category. In our earlier work we examined how the profession of parents and caretakers correlates with the children’s academic performance. Some interesting findings are summarised in
Table 5. We should note that this table reports on 69,349 out of 85,680 students in the data set, as for the remaining 16,331 the parental occupation is not included in the data.
In the table we see, for each parental profession, how the rate at which the children are present in the class of excellent (class A) or very weak (class D) students compares to a uniform distribution. In the first line, for example, we see that in class A, 20.72% more children of professionals are found than what would be the case if the parent’s profession did not affect academic performance and students were distributed homogeneously in the academic performance classes. Similarly, in class D we find 8.28% fewer children whose parents are professionals. So, based on the data, we label children of professionals as privileged since they are over-represented in the excellent student class and under-represented in the weak one. In contrast, we observe that children of those with elementary occupations are under-represented in class A and over-represented in class D. Consequently, they are labeled as disadvantaged.
Examining all occupations in a similar manner, we construct the classes of privileged and disadvantaged students based on parental occupation, as shown in
Table 6.
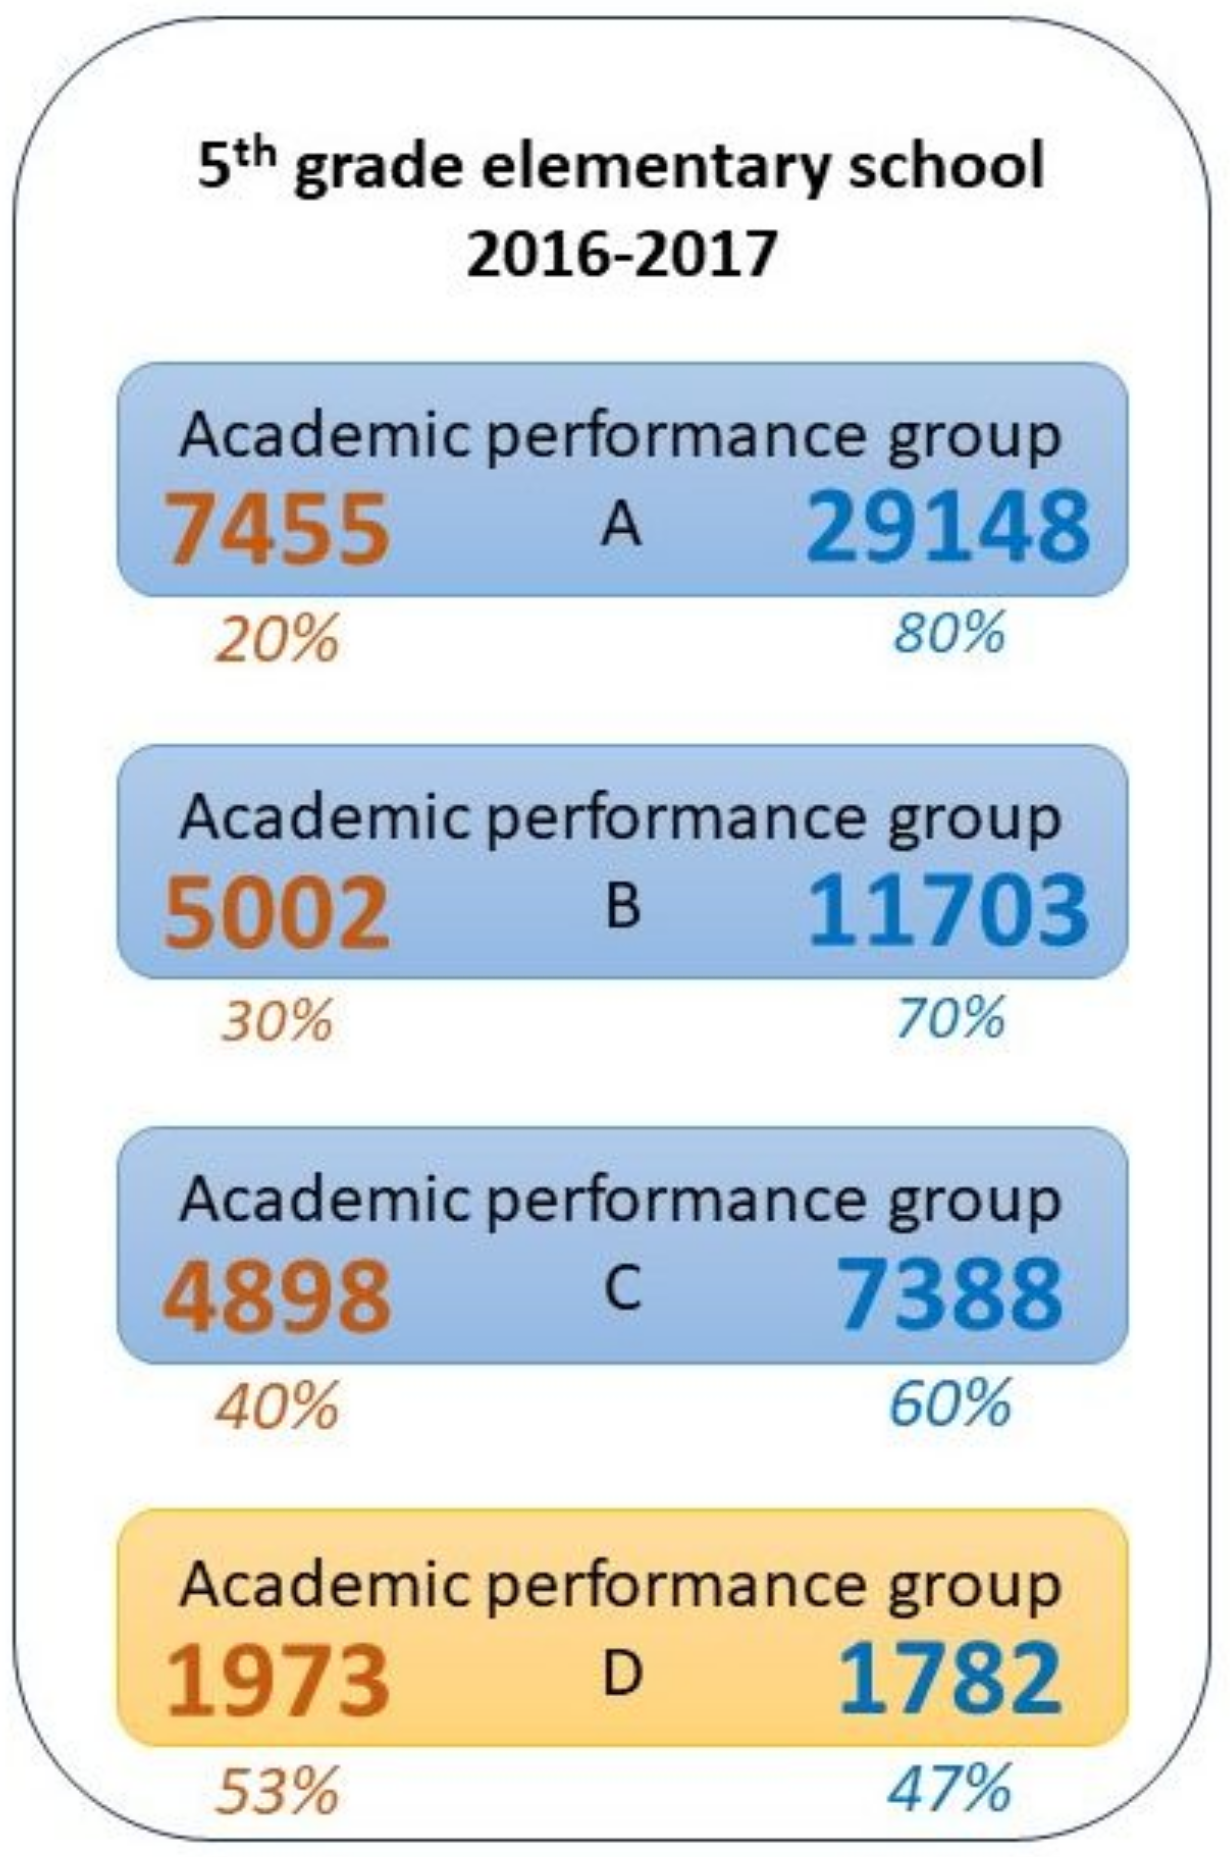
Grouping the students based on their “privileged” or “disadvantaged” classification makes the differences more evident. In
Figure 1 we visualise how the privileged and disadvantaged students are distributed among the academic performance classes. We observe that, whilst the distribution of privileged students is heavily skewed towards the higher performance groups, disadvantaged students have a relatively higher participation in the lower performance groups.
What we have presented in this subsection is not a verbatim copy of earlier work. The classification of students into privileged and disadvantaged groups based on parental occupation as driven by the data may be based on calculations performed before, but it is a fresh view that is first introduced here. Although it is part of the current work’s contribution, we have opted to present it in this section, keeping the fundamentally new ideas separate in the following section, in order to facilitate the reader.
4. Assessing the Remedial Education Policy
4.1. Black Box Evaluation of an Education Policy
Education systems are very complex institutions, with multilevel administrative structures. Their governance is guided by the implementation of education policies which are concurrent in implementation, often overlapping and at times even contradicting. It had been that way historically [
10], it has been that way recently [
11,
12,
13] and it remains that way to this day [
14,
15].
For example, in the Greek education system that we examine herein, together with the remedial education policy that is the focus of the current work the ministry implements a policy to make the school society more open and receptive to other cultures and backgrounds [
16,
17], a policy to welcome children of immigrants [
18], a policy to support children with special physical and developmental needs [
19], a policy to reduce school drop out rates for the Roma population [
20,
21,
22], a policy to promote STEAM [
23,
24,
25], a policy to promote the development of soft skills [
26,
27] and many more.
An important question, both for research and for application, is how to objectively, i.e., based not on intuition but rather on data, evaluate the effectiveness and efficiency of a given policy, considering that the observed output of the education system is the result of the concurrent implementation of many other policies as well.
In the ideal research setting, we would observe the operation of the educational system with a configuration that we would define as conventional, i.e., ground truth, and then again with the addition of only the examined policy. But this is not possible because:
The education system is too big and complex to recreate in simulation, so only in vivo examination is possible;
It is neither legal nor ethical to implement different education policies for different portions of the school population; therefore, it is not possible to have a comparison against a ground truth;
The operation of the education system is affected by external factors such as developments in society, so observations from different years are sometimes not directly comparable even if the same education policies are implemented;
The teaching population changes from year to year (some retire, others are hired); therefore, the skills and attitudes of the teachers, which obviously affect the operation of the schools, are not static;
Etc.
Therefore, an alternative approach is needed. We will follow a black box approach that we will explain using the example of a car. In our example the education system is represented as the car and the remedial teaching policy that aims to support disadvantaged students is represented as the braking system that aims to help the car stop quickly. Ideally, we would like to assess the effectiveness of the brake system by testing it independently from other systems on the car. When that is not possible, we cannot be certain to what extent the braking distance is affected by the braking system and to what extent it is affected by other components such as the tyres, the engine, the suspension, the driver’s skills, etc.
The way to overcome this is to examine the whole car from the point of view of the goal of the braking system. If we test the car and we find that it stops quickly enough, then the test is successful. This is sufficient because our true interest is in the stopping distance; the brake system is merely a tool, not a goal in itself. In that case we can conclude that the car overall works in an acceptable manner regarding braking and therefore no further changes to the braking system are needed. If, on the other hand, the car does not stop in time, then we conclude that the goals of the braking system are not met and changes are required. Clearly this is a rough test that does not give us more details that would explain how and why the brakes work, but it is enough to indicate whether such additional tests are needed or not.
We follow a similar approach in order to assess the effectiveness of the remedial teaching policy. Since the goal of the policy is the support of the disadvantaged students, we study the data regarding the overall operation of the school system looking for indications regarding the extent to which disadvantaged students are supported. If we find that disadvantaged students are supported, then we will conclude that the goals of remedial teaching are met. If, on the other hand, we find that disadvantaged students are not sufficiently supported, then we will conclude that the goals of remedial teaching are not met, and consequently that changes to its design and implementation are needed.
4.2. Immediate Effectiveness of the Policy
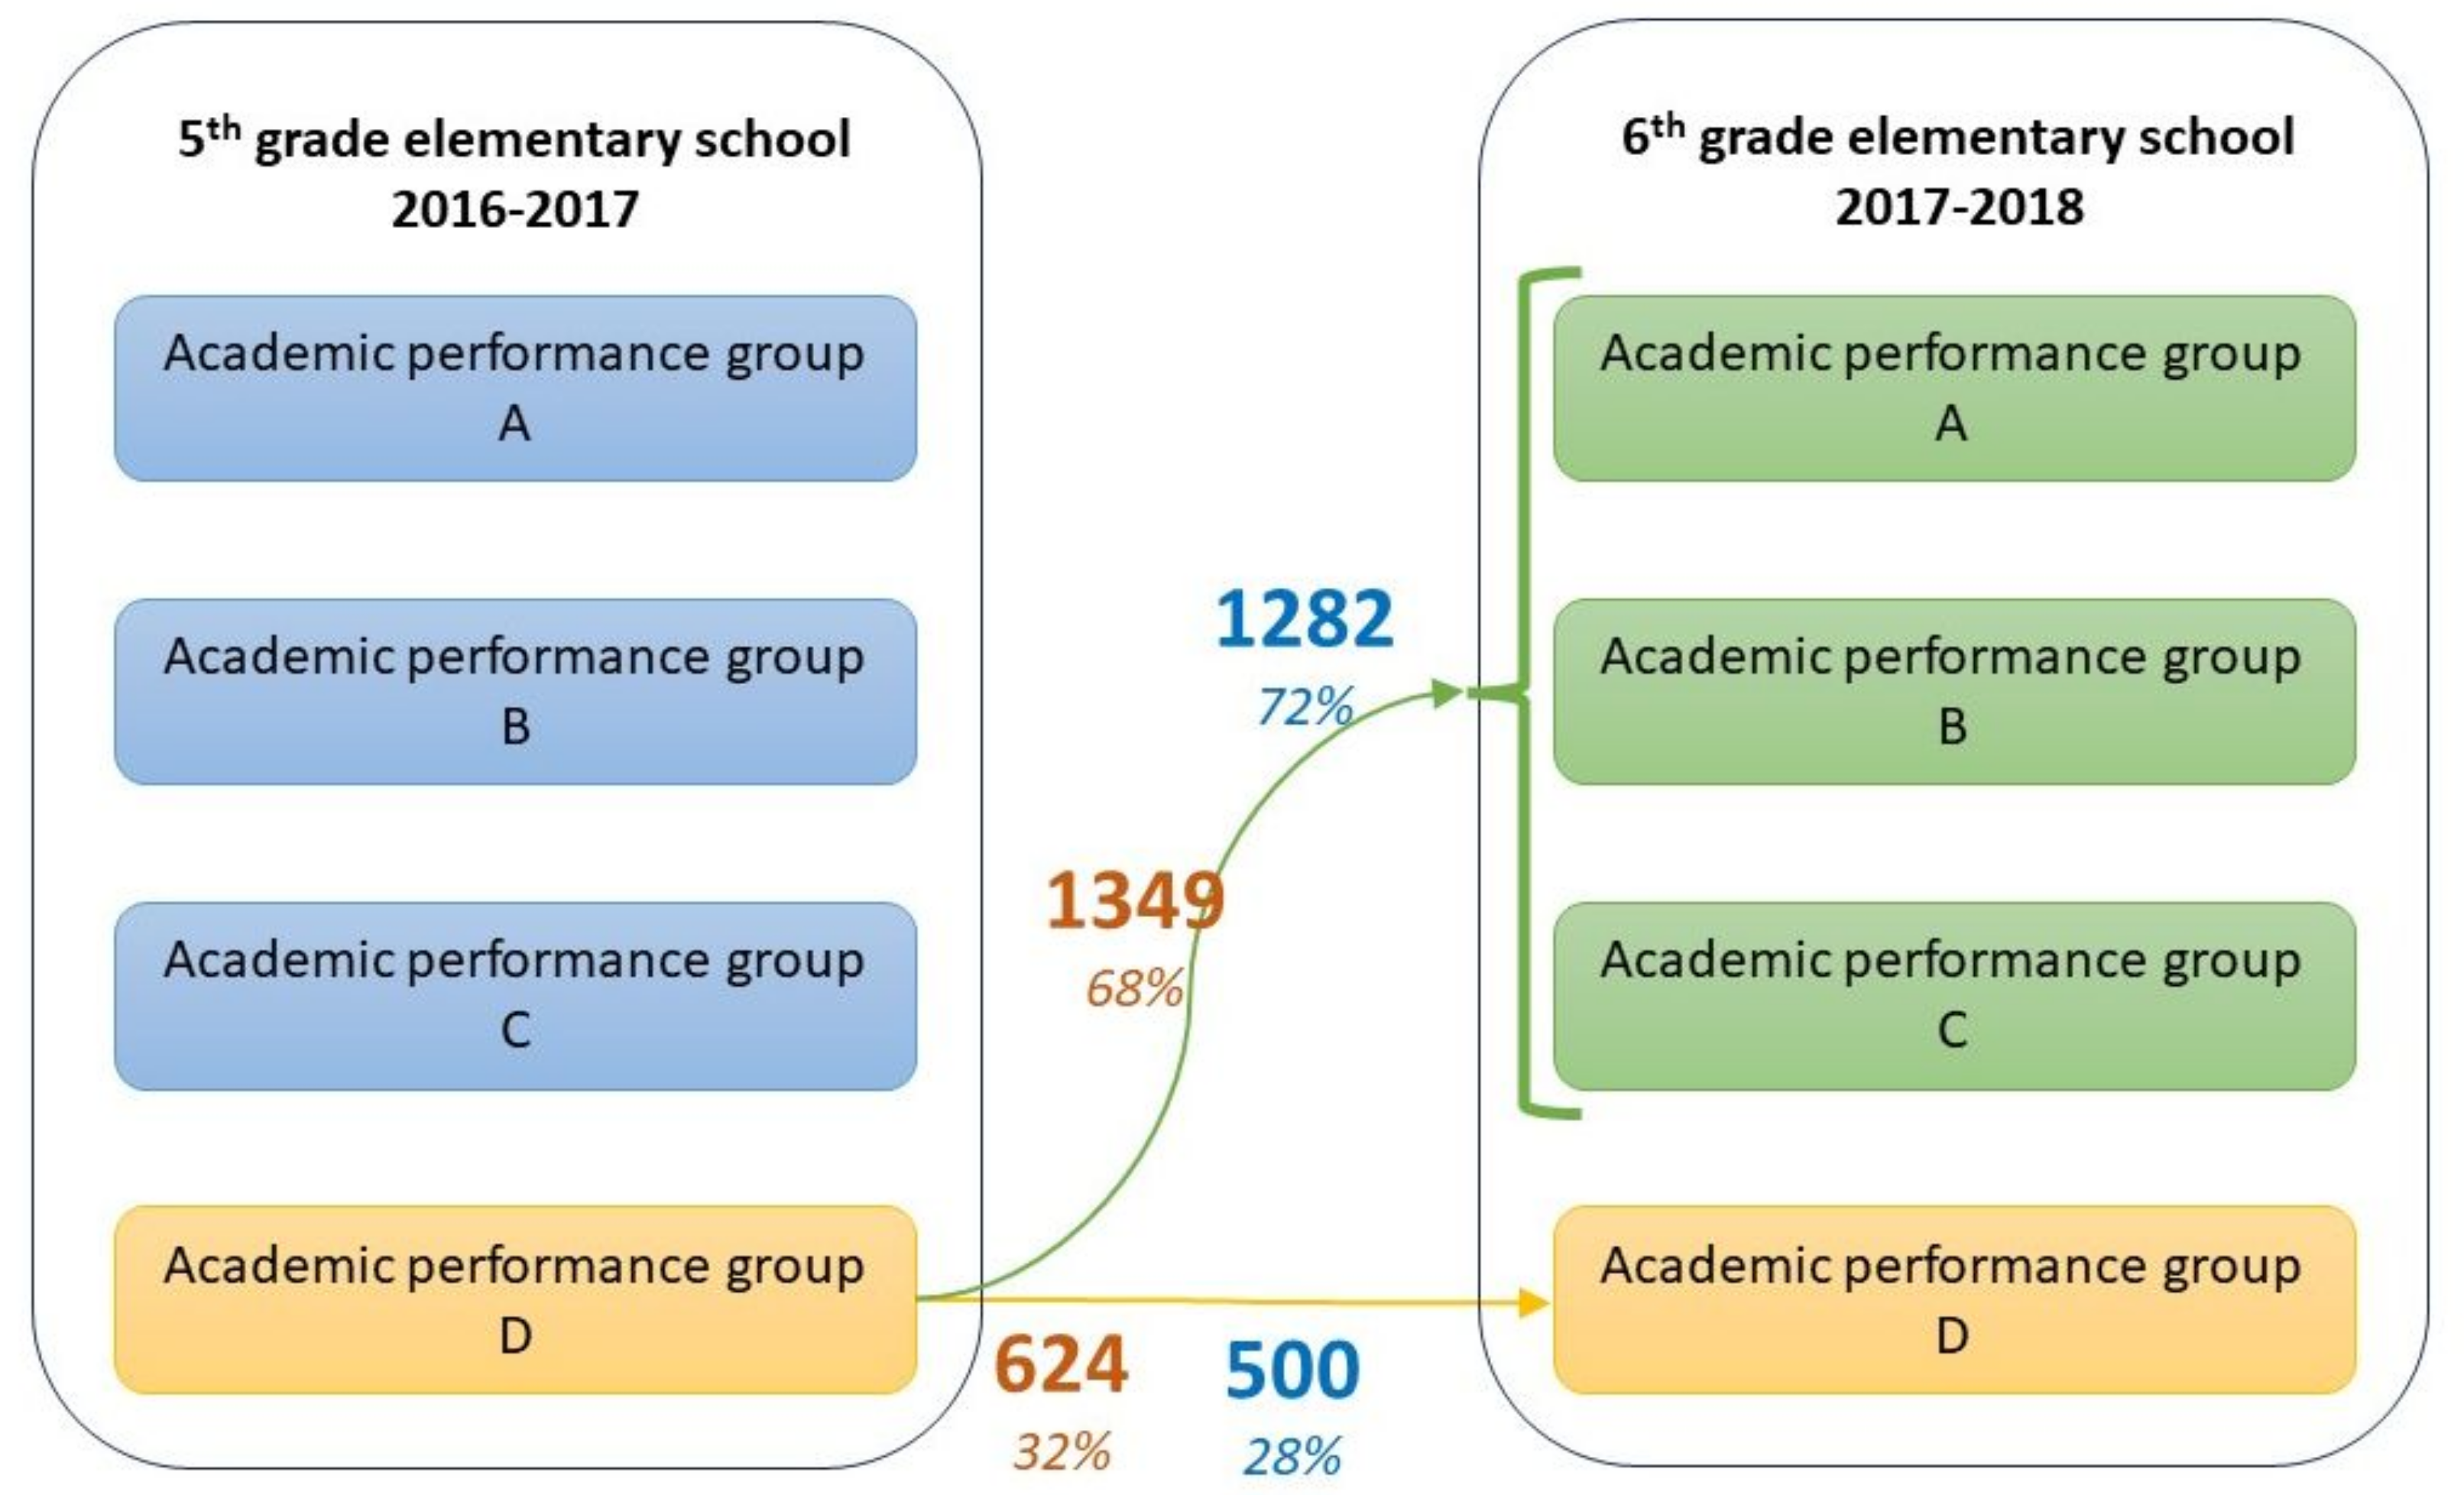
Since remedial teaching aims to assist disadvantaged students with a very weak academic performance, we focus our study on the students that are classified in the D group of academic performance. We examine students that were in the fifth grade of elementary school in the year 2016–2017, so that we can track their progress for two more years based on the data set we have been given. This group contains 3755 students, i.e., approximately 5% of the total 69,349 students in the data set for whom the parental occupation is known. In
Figure 2 we use
brown colour to signify disadvantaged students and
blue colour to signify privileged students. We will use the same notation in the rest of the article, to facilitate the reader.
In order to assess the impact of the remedial teaching policy, we examine how the very weak students have fared when progressing to the next year. We consider the students to have been supported adequately if they have moved away from group D of very weak academic performance to one of the better performing groups. We summarise this progression in
Figure 3.
We observe that 2631 students, i.e., 70%, of the very weak students have enhanced their academic performance enough to be included in a higher performance group. This is a very high rate of mobility between groups, as we have established in earlier work that students generally do not move from one academic performance group to another [
7]. For reference, only 7% of the students with excellent performance have moved to a different academic performance group.
This finding is consistent with the opinion that remedial teaching is an effective measure that succeeds in assisting weak students to enhance their academic performance. Furthermore, the extent to which students are helped certainly exceeds expectations, as it was not expected to see more than half of the very weak students improve their performance.
But is this support in line with the goals of the remedial teaching policy? More specifically, is it really the disadvantaged students that are receiving this benefit? In order to assess this, we examine the parental occupations of the students that managed to escape academic performance group D and climb to a higher level. In
Figure 4 we see that privileged and disadvantaged students enjoy a similar mobility towards higher academic performance groups.
In other words, although remedial teaching succeeds in assisting students to enhance their academic performance, it does little to meet the original goal of the policy which was to specifically support disadvantaged students. If anything, privileged students seem to enjoy a slightly higher boost (72% compared to 68% for disadvantaged students).
4.3. Long-Term Effectiveness of the Policy
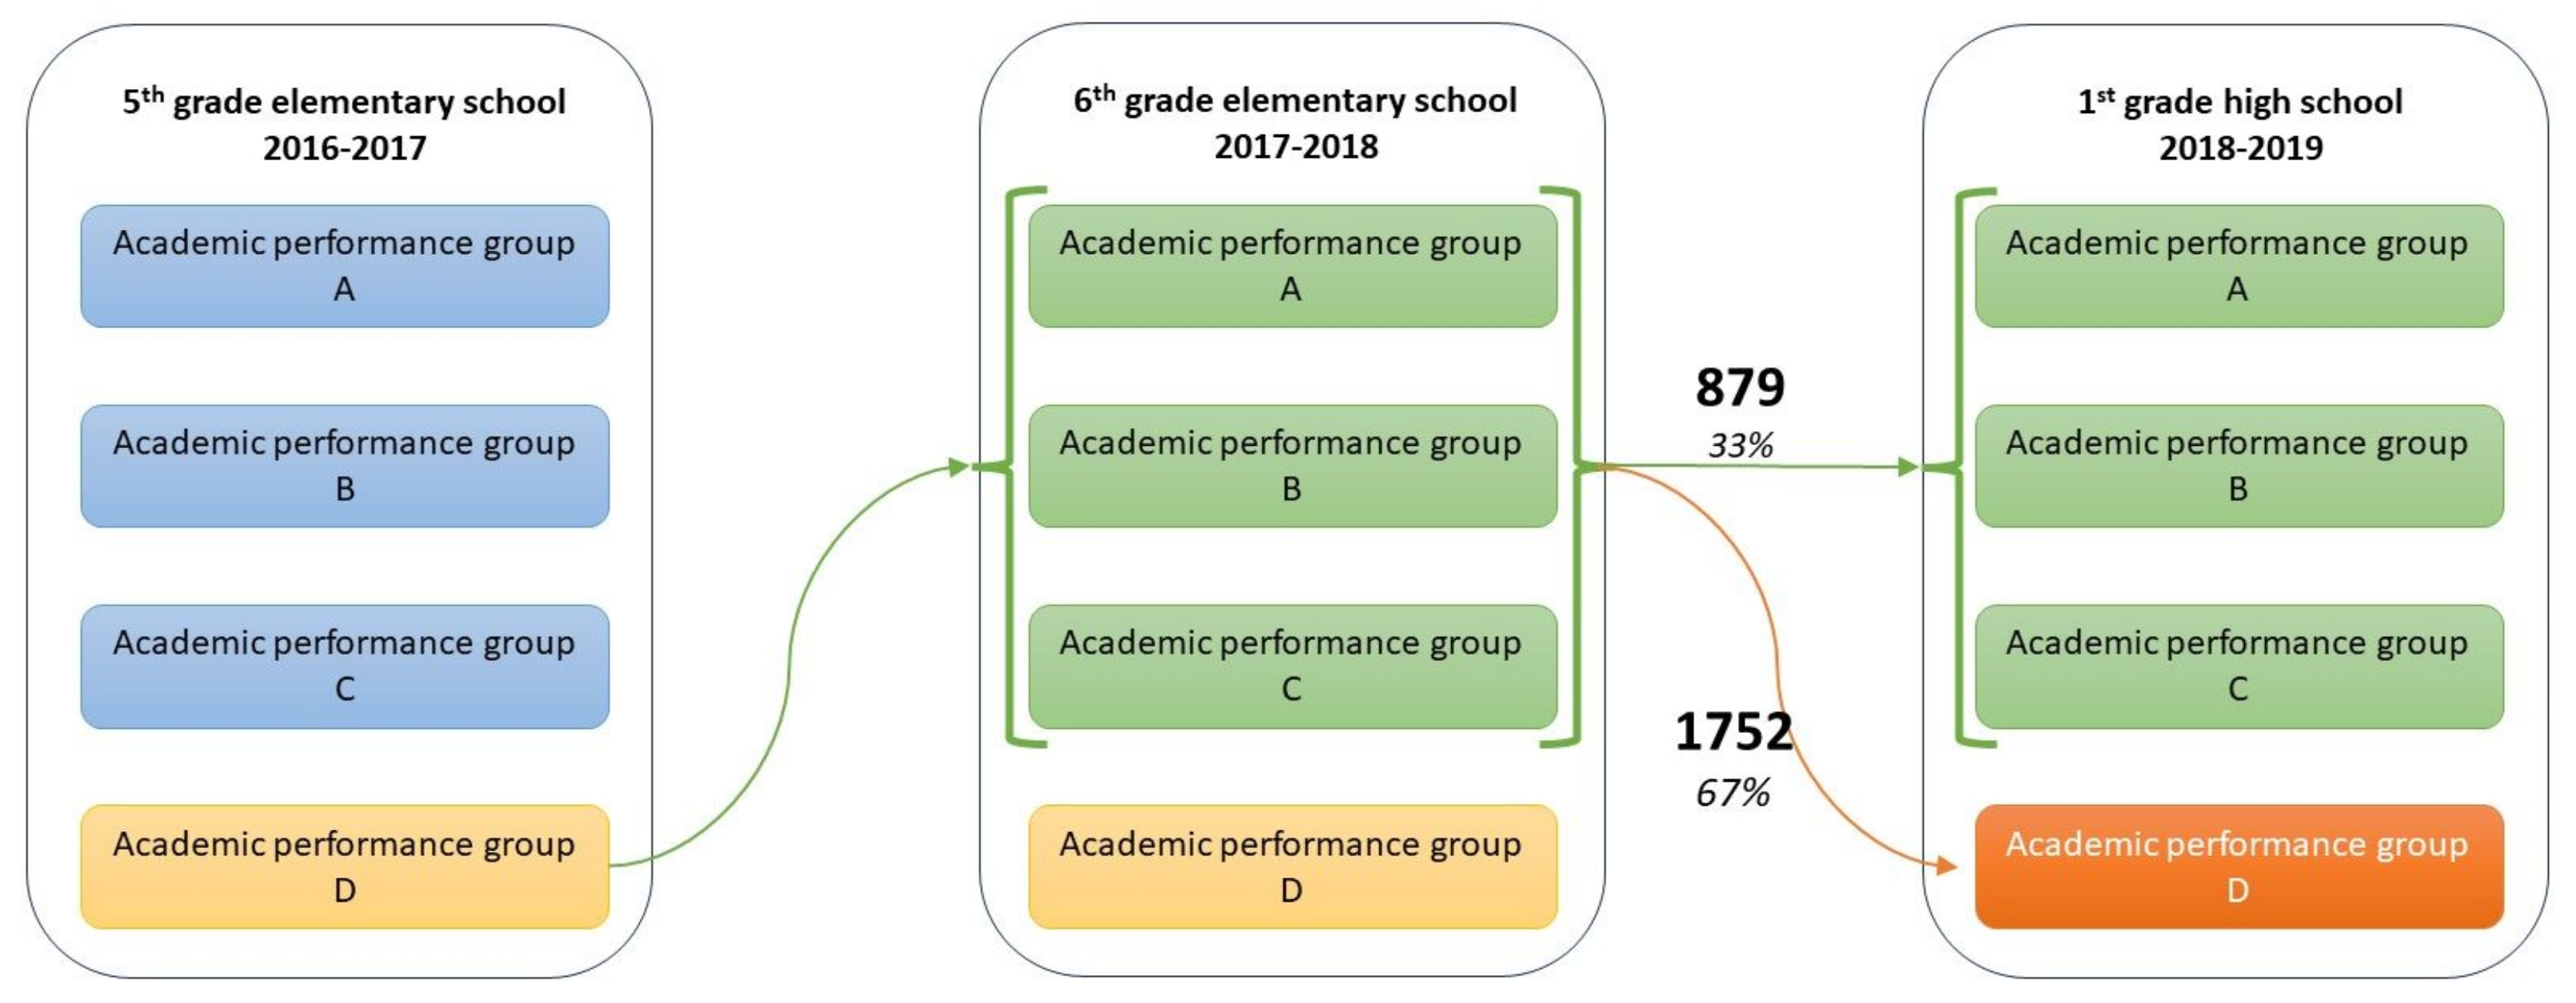
In the previous subsection we examined how the remedial teaching policy assists students to escape the lowest group of academic performance. But is this indicative of a meaningful, long lasting change in the student’s academic skills and potential? In order to examine this, in this section we will track how the students fared a year on from receiving the support of remedial teaching. Did they manage to remain in the higher academic performance groups or did they revert to their original lower performance?
The data is summarised in
Figure 5. There we see that the majority of formerly very weak students that had enhanced their academic performance, presumably as a result of the remedial teaching policy, have unfortunately returned to the group of very weak students. Still, one out of three students manages to remain in higher academic performance level groups, which is no trivial achievement. Overall, out of the 3755 students that were classified as very weak at the fifth grade of elementary school, an impressive 879, i.e., 23%, have moved upwards into a group of higher academic performance and have also managed to remain there. This is on top of students that may have remained in group D at the sixth grade of elementary school but fared better at the first grade of high school.
Considering that in general students remain in the same groups of academic performance during their path through the school system, the fact that almost one out of every four very weak students manages to enhance their academic performance in a way that is sustainable in the long term is a very impressive positive result that in the absence of other obvious contributing factors can be attributed to remedial teaching.
Once again, though, we need to consider that remedial teaching, as a policy, was not originally established with the intent to help weak students but rather to provide more opportunities to disadvantaged students. Therefore, in order to assess now effective the policy has been with respect to its goals, we continue our evaluation by examining how parental occupation correlates with the students’ ability to maintain a higher academic performance.
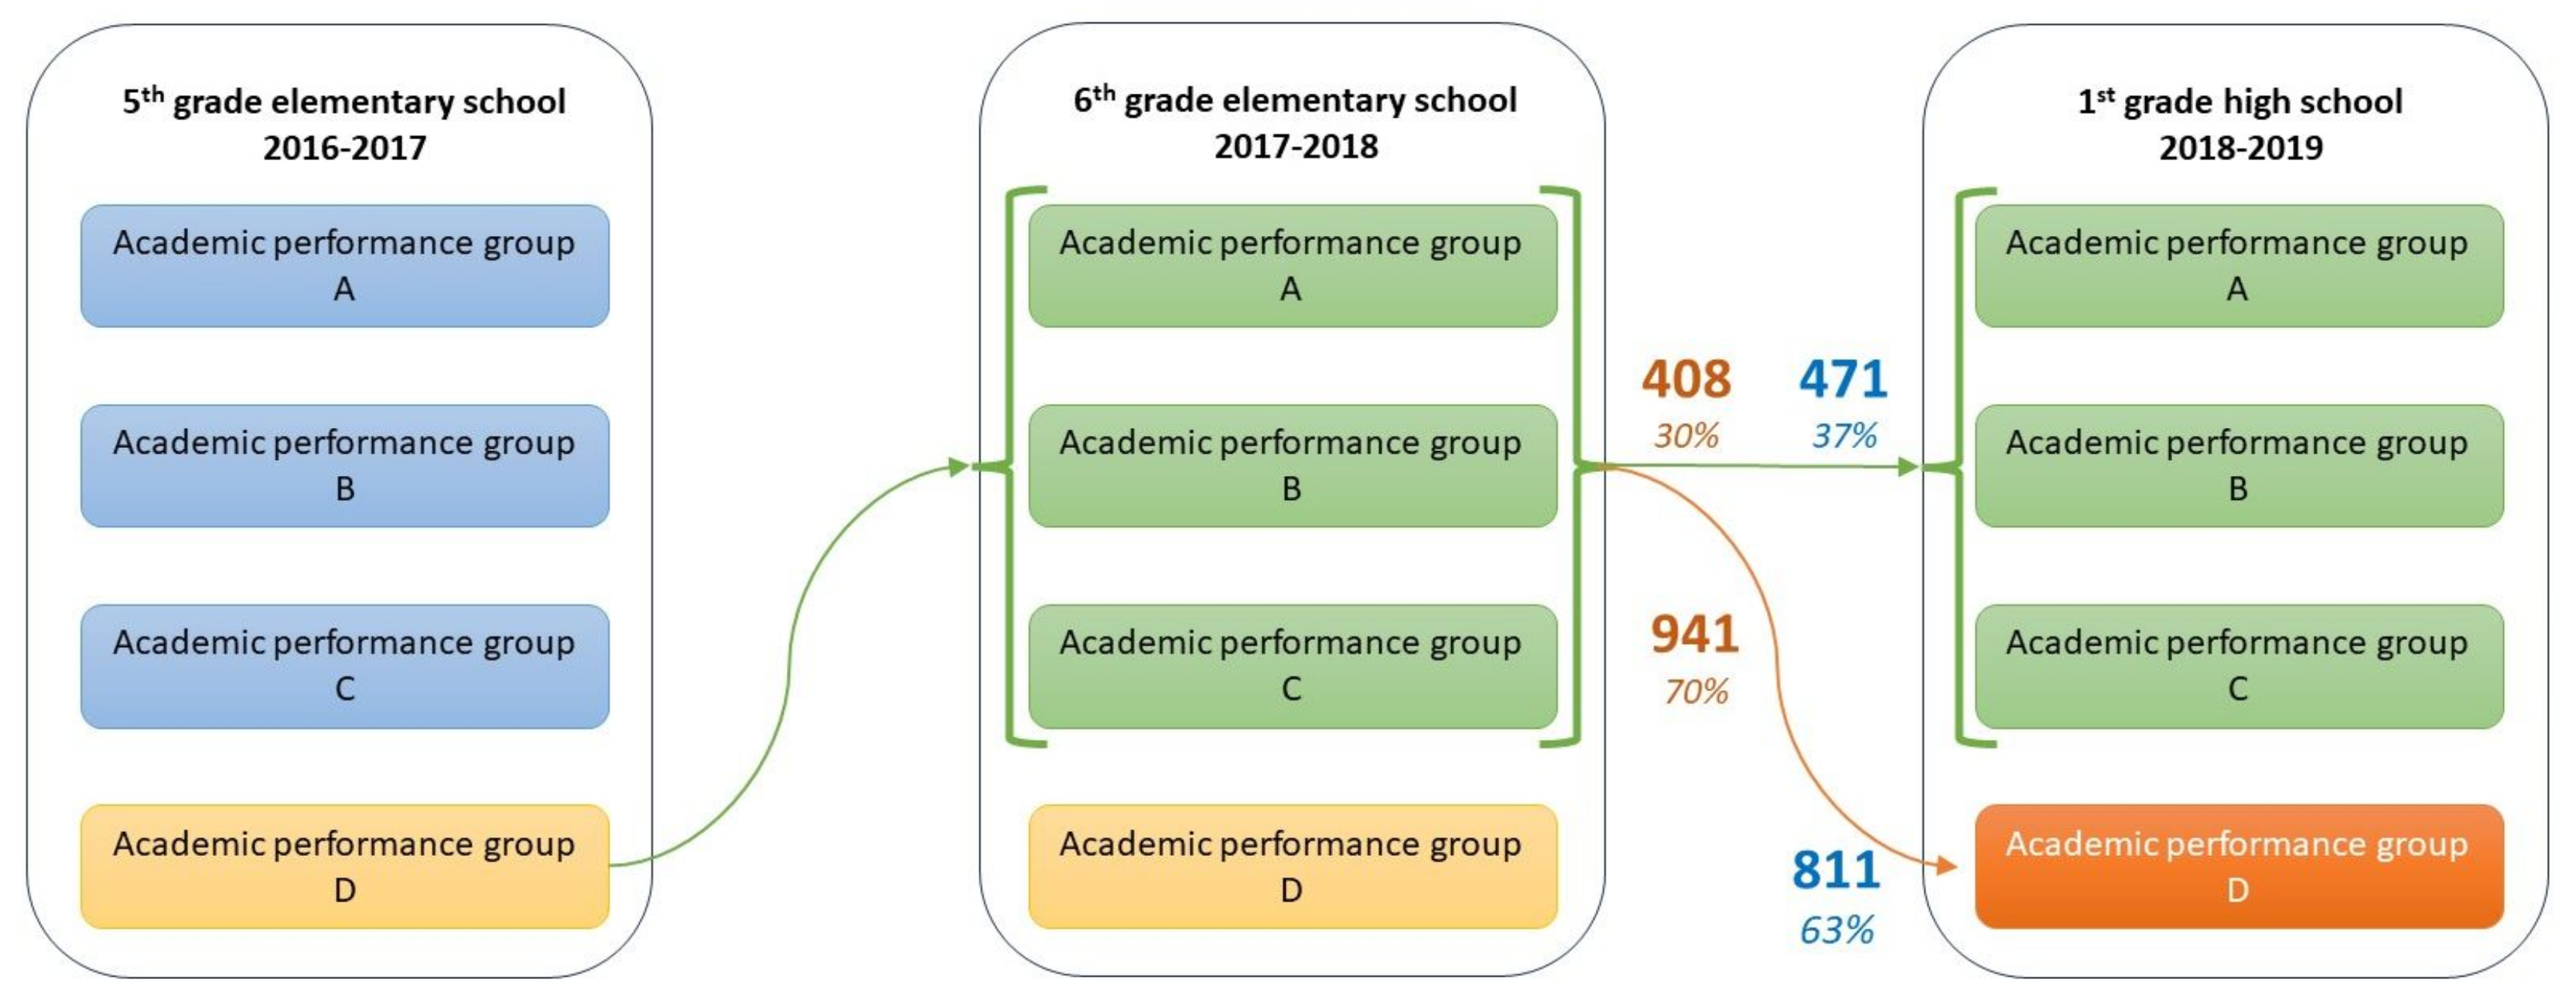
In
Figure 6 we see how privileged and disadvantaged students that were originally helped by the remedial teaching policy fare in the second year after receiving the additional support. We see that, unfortunately and contrary to the hoped and advertised focus of the remedial teaching policy, it is again the privileged students who have a better chance of maintaining their higher academic performance (37% compared to 30% for disadvantaged students).
5. Discussion
Most countries have integrated educational data from various administrative sources [
28]. Still, despite the existence of such rich sources of information, the majority of educational data analytics efforts are based on independently gathered smaller data samples, which makes it more difficult to generalise the findings [
29]. One of the reasons that the much larger data sets held by ministries of education are not used extensively is their generic nature; it is a widely held view that without specialised data it is not possible to perform any meaningful analysis [
30].
When it comes specifically to the evaluation of education policies, one additional reason that they are difficult to evaluate without specialised data is the lack of appropriate metrics. Education policies often aim to improve student achievement but measuring this outcome can be complex. Without appropriate metrics, it is difficult to determine the effectiveness of education policies [
30].
Another challenge is the potential for confounding factors. Education policies often operate in complex environments that involve multiple stakeholders, including teachers, students, parents and administrators. Confounding factors, such as changes in teaching methods or student demographics, can make it difficult to isolate the impact of a given policy. Without specialised data, it is challenging to account for these confounding factors, which can lead to inaccurate conclusions about the effectiveness of a policy [
31].
The work presented herein has taken a step to address all of these issues, paving the way for broader utilisation of the data held by education administrations and providing a path for the evaluation of distinct education policies.
5.1. Findings
Following a black box approach and based on a voluminous data set provided by the Greek Ministry of Education, we took a closer look at the education policy of remedial education. It is a much advertised education policy that constitutes a huge investment from the Greek state and aims to introduce social equity in the school system by supporting disadvantaged students. The examination of the data has produced a number of results that contradict the prevalent opinion regarding the effectiveness of the policy. We summarise them here.
First of all, regarding the immediate impact of the policy, we find that an astonishing 70% of the very weak students manage to improve their performance adequately to move to a higher academic performance group. This exceeds the expectations.
Moreover, one third of these students retains this enhanced academic performance even when they have stopped receiving the support of the remedial teaching. This is a confirmation of the effectiveness of the policy to meaningfully help students do better in school.
On the other hand, both in the short term and in the long term, it is the privileged students that are receiving the most support from the policy. In the short term, privileged students enhance their performance having received the help of remedial teaching more often than disadvantaged ones. And in the long term, it is mainly privileged students that manage to maintain the enhanced academic performance.
Consequently, contrary to what is believed, the remedial teaching policy does not assist in creating a school of equal opportunities. If anything, it works in the opposite direction, being one more aspect of the education system that benefits the privileged students more than the disadvantaged ones.
5.2. Implications
The implications of the presented work are three-fold. Firstly, our assessment indicates that, whilst the policy does have some impressive positive impact, both in the short term and in the long term, it does not achieve its stated goals. Considering the huge investment of financial and human resources that go into the implementation of the policy, more would be expected. Therefore, our results point towards a need to study further, adjust and re-configure the policy instead of continuing to implement it in the same semi-successful manner.
Secondly, the utilisation of the data stored in the school management system for the objective evaluation of a specific education policy highlights the value that exists in that data. Following a similar approach, the effectiveness of more education policies can be assessed by comparing their goals to the observed results. Moreover, the fact that the results acquired in the case of the remedial teaching policy contradict the pre-existing, subjective, intuition based assessment, underlines the need to use an objective, data driven approach in the evaluation of education policies. We hope that these findings will take us a step closer to a paradigm shift in which policies are only evaluated objectively, based on data, and not subjectively, based on hope and intuition.
Thirdly, whilst we are happy to have achieved some evaluation of the examined education policy, we should not forget that we have based our evaluation on data gathered via a procedure that did not aim to assess the effectiveness of education policies. As expected, this has hindered the detail in which the policy could be examined. Understandably, the ministry has been reluctant to include more information in the school management system, as there was no obvious benefit and the recording of any additional data generates considerable administrative overhead. Now that the value of having and using such data has been proven, we can hope that school administration will consider expanding the range of data gathered.
More specifically, we suggest that the administrations consider
- 1.
Studying which data it could be most useful to gather;
- 2.
Enriching the recorded data based on the findings of 1;
- 3.
Providing this data to researchers or, equivalently, building an internal data science task force to analyse the data in order to assess policy implementation and provide feedback as needed.
This will allow administrators to receive essential assistance towards both effective and efficient administration of the education system, positively impacting the next generations while at the same time optimising the expenditure of public funds.
5.3. Limitations
Any study that is based on data can only go as far as the data will permit it. Any limitation in the available data will automatically translate itself into a limitation in the study. This study is no exception.
Many countries have strong legal barriers that prevent the use of administrative data for non-administrative purposes. Providing access to data for researchers is subject to political caution due to privacy concerns and the presence of strong personal data protection movements [
28]. This is the reason that we have only been given access to a subset of the data, limited both in volume (we were only provided with records of three specific grades and years) and in range (we were provide with student grades and demographics, but no information about the schools and the teachers).
Consequently, our study is limited with respect to the duration during which the student progress is tracked, as we only have data for three consecutive years. Moreover, we do not have the opportunity to confirm our results by examining whether we would produce the same findings when examining how the next generations of fifth grade students progress through the school system with the support of the remedial teaching policy.
6. Conclusions
The remedial teaching policy is a flagship education policy of the Greek Ministry of Education that aims to create a school of equal opportunities by providing additional support to students from disadvantaged social backgrounds. It is a huge investment as it employs approximately 3930 teachers and costs the state approximately EUR 31.9 million per year.
In this work we have utilised a data set provided by the Ministry of Education, followed a black box approach and built on previous results in order to achieve the first ever objective, i.e., based on data, evaluation of the remedial teaching policy. Our findings indicate that, whilst the policy is successful in supporting students both in the short and in the long term, it does little to achieve its original goals as it is primarily the privileged students that receive the benefits. Consequently, the policy has the opposite impact to what it was designed to do.
The implications of the work are wide and far reaching. Most important among them, the realisation that the remedial teaching policy is in need for immediate redesign, if it is to meet its important and ambitious goals. Secondarily, we have proven that there is value to be extracted from the data stored in the Educational Management Information System, if analysed properly. We can only hope that this will start a paradigm shift, towards a future in which educational data are not simply gathered, stored and forgotten, but rather analysed and exploited in order to support more effective and efficient administration of the educational system.
Author Contributions
Conceptualisation, M.W. and I.P.; methodology, V.P. and I.P.; validation, M.W., C.V. and G.L.; resources, I.P.; data curation, V.P.; writing—original draft preparation, M.W. and I.P.; writing—review and editing, V.P., C.V., G.L. and N.P.; visualisation, M.W., N.P. and I.P.; supervision, M.W. All authors have read and agreed to the published version of the manuscript.
Funding
This research received no external funding.
Institutional Review Board Statement
The data collection procedure was accomplished in accordance with the guidelines of the Declaration of Helsinki for the protection of human research subjects.
Informed Consent Statement
Not applicable.
Data Availability Statement
Restrictions apply to the availability of these data. Data were obtained from the Greek Ministry of Education and are available with the permission of the Greek Ministry of Education.
Conflicts of Interest
I.P. is Head of Administrative Directorate of the Regional Education Directorate of Peloponnese. The other authors declare no conflicts of interest.
References
- Banathy, B.H. Systems Design of Education: A Journey to Create the Future; Educational Technology Publications: Englewood Cliffs, NJ, USA, 1991. [Google Scholar]
- Pinar, W.F. What Is Curriculum Theory? Routledge: Oxfordshire, UK, 2012. [Google Scholar]
- Slavin, R.E. Evidence-based education policies: Transforming educational practice and research. Educ. Res. 2022, 31, 15–21. [Google Scholar] [CrossRef] [Green Version]
- Simpson, A. The misdirection of public policy: Comparing and combining standardised effect sizes. J. Educ. Policy 2017, 32, 450–466. [Google Scholar] [CrossRef] [Green Version]
- Viennet, R.; Pont, B. Education Policy Implementation: A Literature Review and Proposed Framework; OECD Education Working Papers, No. 162; OECD Publishing: Paris, France, 2017. [Google Scholar] [CrossRef]
- Holsinger, D.B.; Jacob, W.J.; Mason, M. (Eds.) Inequality in Education: Comparative and International Perspectives; Springer: Dordrecht, The Netherlands, 2009. [Google Scholar]
- Papadogiannis, I.; Wallace, M.; Poulopoulos, V.; Karountzou, G.; Ekonomopoulos, D. A First Ever Look into Greece’s Vast Educational Data: Interesting Findings and Policy Implications. Educ. Sci. 2021, 11, 489. [Google Scholar] [CrossRef]
- Le Donné, N. European Variations in Socioeconomic Inequalities in Students’ Cognitive Achievement: The Role of Educational Policies. Eur. Sociol. Rev. 2014, 30, 329–343. [Google Scholar] [CrossRef]
- Randall, J.; Engelhard, G. Differences between Teachers’ Grading Practices in Elementary and Middle Schools. J. Educ. Res. 2009, 102, 175–186. [Google Scholar] [CrossRef]
- Birman, B.F. Problems of Overlap between Title I and P. L. 94–142: Implications for the Federal Role in Education. Educ. Eval. Policy Anal. 1981, 3, 5–19. [Google Scholar] [CrossRef]
- Bradley, S.; Migali, G. An Evaluation of Multiple Overlapping Policies in a Multi-Level Framework: The Case of Secondary Education Policies in the UK, (with S. Bradley). Educ. Econ. 2012, 20, 322–342. [Google Scholar] [CrossRef] [Green Version]
- Braun, A.; Maguire, M.; Ball, S.J. Policy enactments in the UK secondary school: Examining policy, practice and school positioning. J. Educ. Policy 2010, 25, 547–560. [Google Scholar] [CrossRef]
- Maroy, C. Convergences and hybridization of educational policies around “post-bureaucratic” models of regulation. Compare 2009, 39, 71–84. [Google Scholar] [CrossRef]
- Bellei, C.; Munoz, G. Models of regulation, education policies, and changes in the education system: A long-term analysis of the Chilean case. J. Educ. Chang. 2023, 24, 49–76. [Google Scholar] [CrossRef]
- Hall, D.; Grimaldi, E.; Gunter, H.M.; Møller, J.; Serpieri, R.; Skedsmo, G. Educational reform and modernisation in Europe: The role of national contexts in mediating the new public management. Eur. Educ. Res. J. 2015, 14, 487–507. [Google Scholar] [CrossRef] [Green Version]
- Spinthourakis, J.A.; Karakatsanis, D. The Multicultural Class in Greece. In Cultural Diversity in the Classroom; Spinthourakis, J., Lalor, J., Berg, W., Eds.; VS Verlag für Sozialwissenschaften: Wiesbaden, Germany, 2011. [Google Scholar]
- Karountzou, G.; Papadogiannis, I.; Wallace, M. Achieving Intercultural Education and Language Awareness and Intercultural Communication in School of Inclusion Using ICT. In Proceedings of the IAIE 2021 Intercultural Conference, Online, 27–30 June 2021. [Google Scholar]
- Escaño, C.; Mesías-Lema, J.M.; Julia Mañero, J. Empowerment of the refugee migrant community through a cooperation project on art education in Greece. Dev. Pract. 2022, 32, 912–927. [Google Scholar] [CrossRef]
- Miller, K.J.; Morfidi, E.; Soulis, S. Teachers’ perceptions of greek special education policies and practices. J. Int. Spec. Needs Educ. 2013, 16, 53–65. [Google Scholar] [CrossRef]
- Gkofa, P. Promoting Social Justice and Enhancing Educational Success: Suggestions from Twenty Educationally Successful Roma in Greece. Urban Rev. 2017, 49, 443–462. [Google Scholar] [CrossRef]
- Wallace, M.; Poulopoulos, V.; Papavramidou, Z.; Tzioras, I.; Liaperdos, J. ANTS: From History of Science to Future of Science. In Proceedings of the 8th International Euro-Mediterranean Conference (EuroMed), Online, 2–5 November 2020. [Google Scholar]
- Nikolaou, G. Teacher training on Roma education in Greece: A discussion about the results of INSETRom experience in two Greek schools. Intercult. Educ. 2009, 20, 549–557. [Google Scholar] [CrossRef]
- Matthaios, P.; Paraskevi Iatrou, P. Implementation of STEM tinkering approaches in primary school education in Greece. Sino-US Engl. Teach. 2019, 16, 510–516. [Google Scholar]
- Chaidi, E.; Kefalis, C.; Papagerasimou, Y.; Drigas, A. Educational Robotics in Primary Education. A Case in Greece. Res. Soc. Dev. 2021, 10, e17110916371. [Google Scholar] [CrossRef]
- Spyropoulou, C.; Wallace, M.; Vassilakis, C.; Poulopoulos, V. Examining the use of STEAM Education in Preschool Education. Eur. J. Eng. Technol. Res. 2020. [Google Scholar] [CrossRef]
- Cinque, M. “Lost in translation”. Soft Skills Development in European Countries. Tuning J. High. Educ. 2016, 3, 389–427. [Google Scholar] [CrossRef] [Green Version]
- Demetroulis, E.A.; Wallace, M. Educational robotics as a tool for the development of collaboration skills. In Using Educational Robotics to Facilitate Student Learning; Papadakis, S., Kalogiannakis, M., Eds.; IGI Global: Hershey, PA, USA, 2020. [Google Scholar]
- Golden, G. Education Policy Evaluation: Surveying the OECD Landscape; OECD Education Working Papers, No. 236; OECD Publishing: Paris, France, 2020. [Google Scholar] [CrossRef]
- Papadogıannıs, I.; Poulopoulos, V.; Wallace, M. A Critical Review of Data Mining for Education: What has been done, what has been learnt and what remains to be seen. Int. J. Educ. Res. Rev. 2020, 5, 353–372. [Google Scholar] [CrossRef]
- Schildkamp, K.; Kuiper, W. Data-Driven Curriculum Reform: Which Data, What Purposes, and Promoting and Hindering Factors. Teach. Teach. Educ. 2010, 26, 482–496. [Google Scholar] [CrossRef] [Green Version]
- Dimitrov, D.M.; Rumrill, P.D., Jr. Pretest-posttest designs and measurement of change. Work 2003, 20, 159–165. [Google Scholar] [PubMed]
| Disclaimer/Publisher’s Note: The statements, opinions and data contained in all publications are solely those of the individual author(s) and contributor(s) and not of MDPI and/or the editor(s). MDPI and/or the editor(s) disclaim responsibility for any injury to people or property resulting from any ideas, methods, instructions or products referred to in the content. |
© 2023 by the authors. Licensee MDPI, Basel, Switzerland. This article is an open access article distributed under the terms and conditions of the Creative Commons Attribution (CC BY) license (https://creativecommons.org/licenses/by/4.0/).


 ,
, 


