
Review

A Review of Non-Destructive Technologies for Quality Assessment in Aquaculture

by
Guoxiang Huang
1,*,
Kunlapat Thongkaew
1,2 and
Supapan Chaiprapat
1,2
1
Department of Industrial and Manufacturing Engineering, Faculty of Engineering, Prince of Songkla University, Songkhla 90110, Thailand
2
Smart Industrial Research Center, Faculty of Engineering, Prince of Songkla University, Songkhla 90110, Thailand
*
Author to whom correspondence should be addressed.
Aquac. J. 2026, 6(1), 3; https://doi.org/10.3390/aquacj6010003
Submission received: 30 October 2025 / Revised: 23 December 2025 / Accepted: 23 January 2026 / Published: 30 January 2026

Abstract

Aquatic animal products are vital to global food security and nutrition, necessitating accurate, scalable, and non-destructive methods for quality assessment in aquaculture. Conventional techniques such as dissection and biochemical analysis are invasive, labor-intensive, and unsuitable for real-time or high-throughput decision-making. This review synthesizes six major categories of non-destructive technologies—electrical, spectroscopic, natural sensory, acoustic, radiographic, and infrared and microwave—classified by their underlying sensing mechanisms and therefore differing measurement capabilities and deployment feasibilities. To support objective technology selection, an Analytic Hierarchy Process (AHP) framework was developed using general performance criteria (cost, accuracy, speed, usability) and one decision-critical application-specific criterion (non-invasiveness), and was demonstrated for ovarian maturation staging in mud crabs by ranking 19 candidate techniques. Accuracy had the highest weight (0.416), but non-invasiveness (0.224) and usability (0.197) substantially influenced the final ranking, illustrating how operational and welfare constraints could shift preferred solutions despite differences in analytical accuracy. Based on the global priority weights (GA), computer vision (CV) was identified as the most suitable option (GA = 0.076), balancing affordability, throughput, ease of deployment, and animal welfare compatibility, whereas high-end modalities such as nuclear magnetic resonance (NMR; GA = 0.073) and computed tomography (CT; GA = 0.070) were constrained by cost and operational complexity. Overall, this review–AHP–case study pipeline provides a transparent and reproducible decision-support basis for selecting non-destructive technologies across aquaculture species and quality targets.

1. Introduction

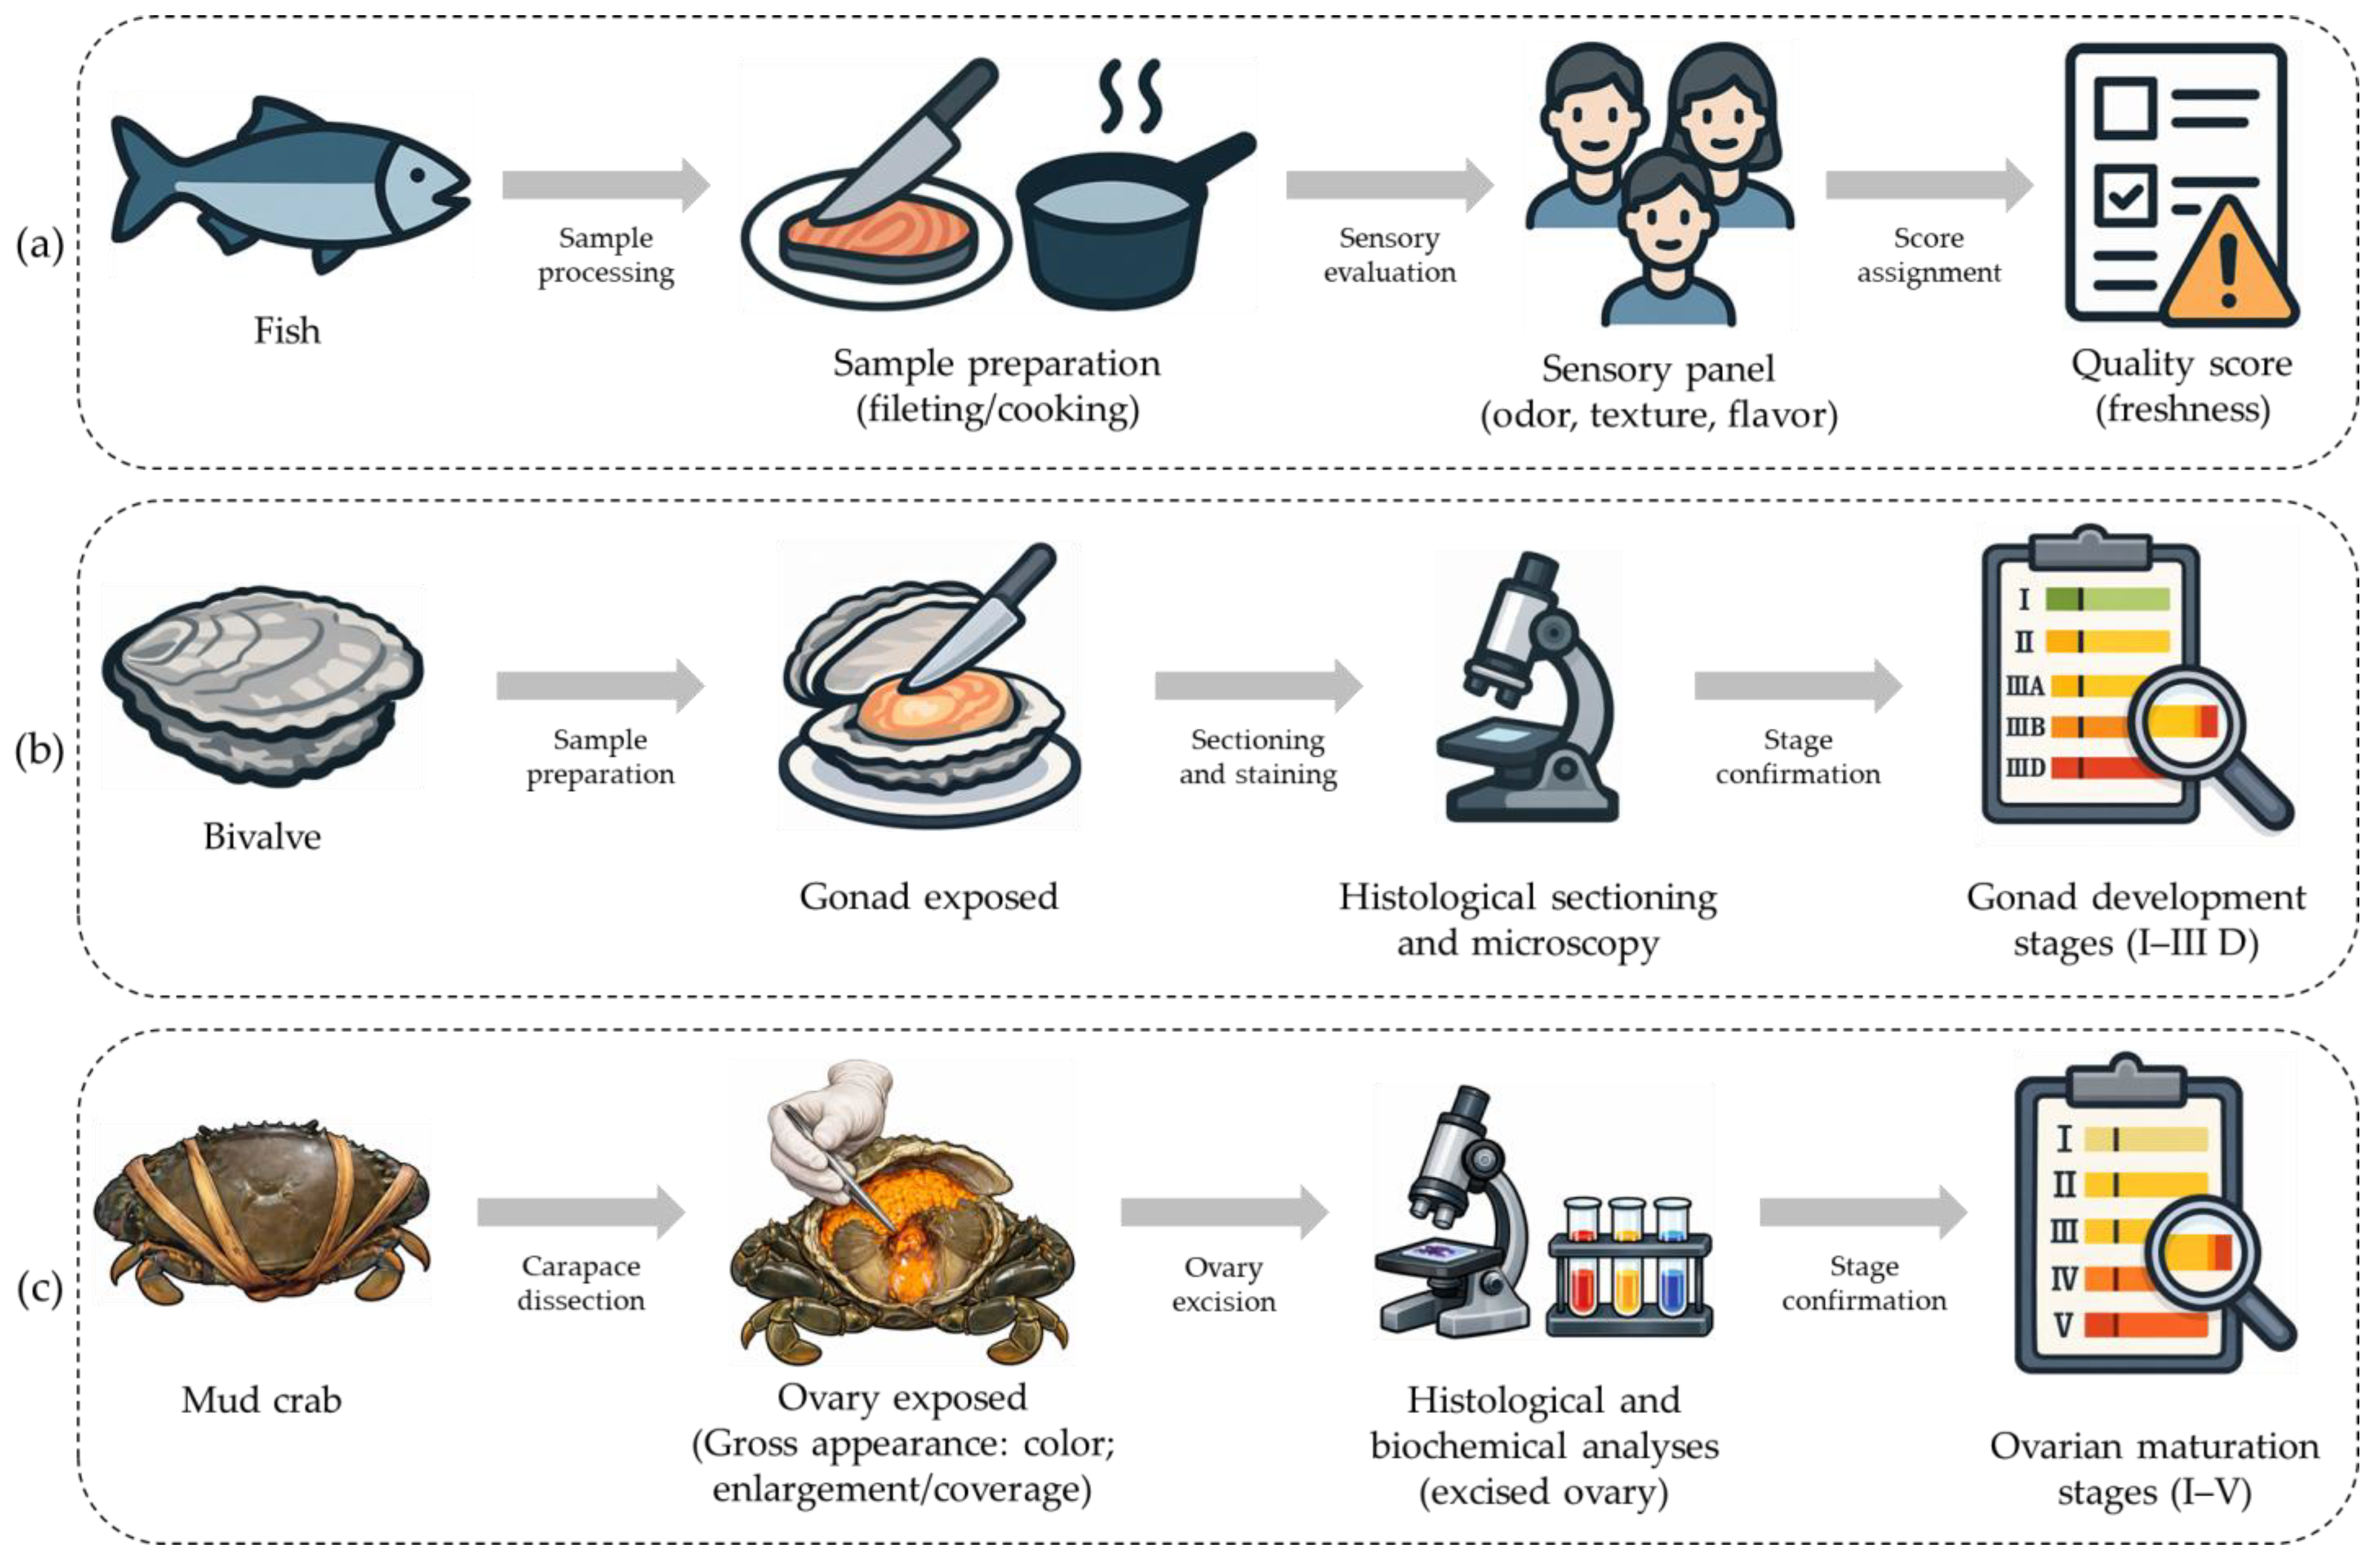
Ensuring reliable quality evaluation of aquatic animal products remains a critical challenge in global aquaculture. As demand grows and regulatory and market requirements for safety and quality become increasingly stringent across aquatic food value chains, scalable assessment systems are needed to maintain consistent quality from production through processing and distribution [1,2,3]. However, conventional quality evaluation approaches in aquaculture often rely on destructive sampling and laboratory-based analyses, which limit real-time monitoring, repeated measurements, and large-scale implementation [4,5,6]. For instance, fish freshness evaluation protocols such as the Torry scheme commonly require sample preparation (e.g., fileting) and, in some cases, cooking for sensory assessment (Figure 1a) [4]. In bivalves, gonadal development is staged through tissue excision followed by histological sectioning and microscopic examination (Figure 1b) [5]. Ovarian maturation staging in mud crabs involves carapace dissection and ovary excision, with subsequent histological examination and biochemical analyses of ovarian tissue (Figure 1c) [6]. These limitations motivate the development of non-destructive technologies that enable rapid, objective, and repeatable assessment while preserving product integrity and supporting sustainable aquaculture management.
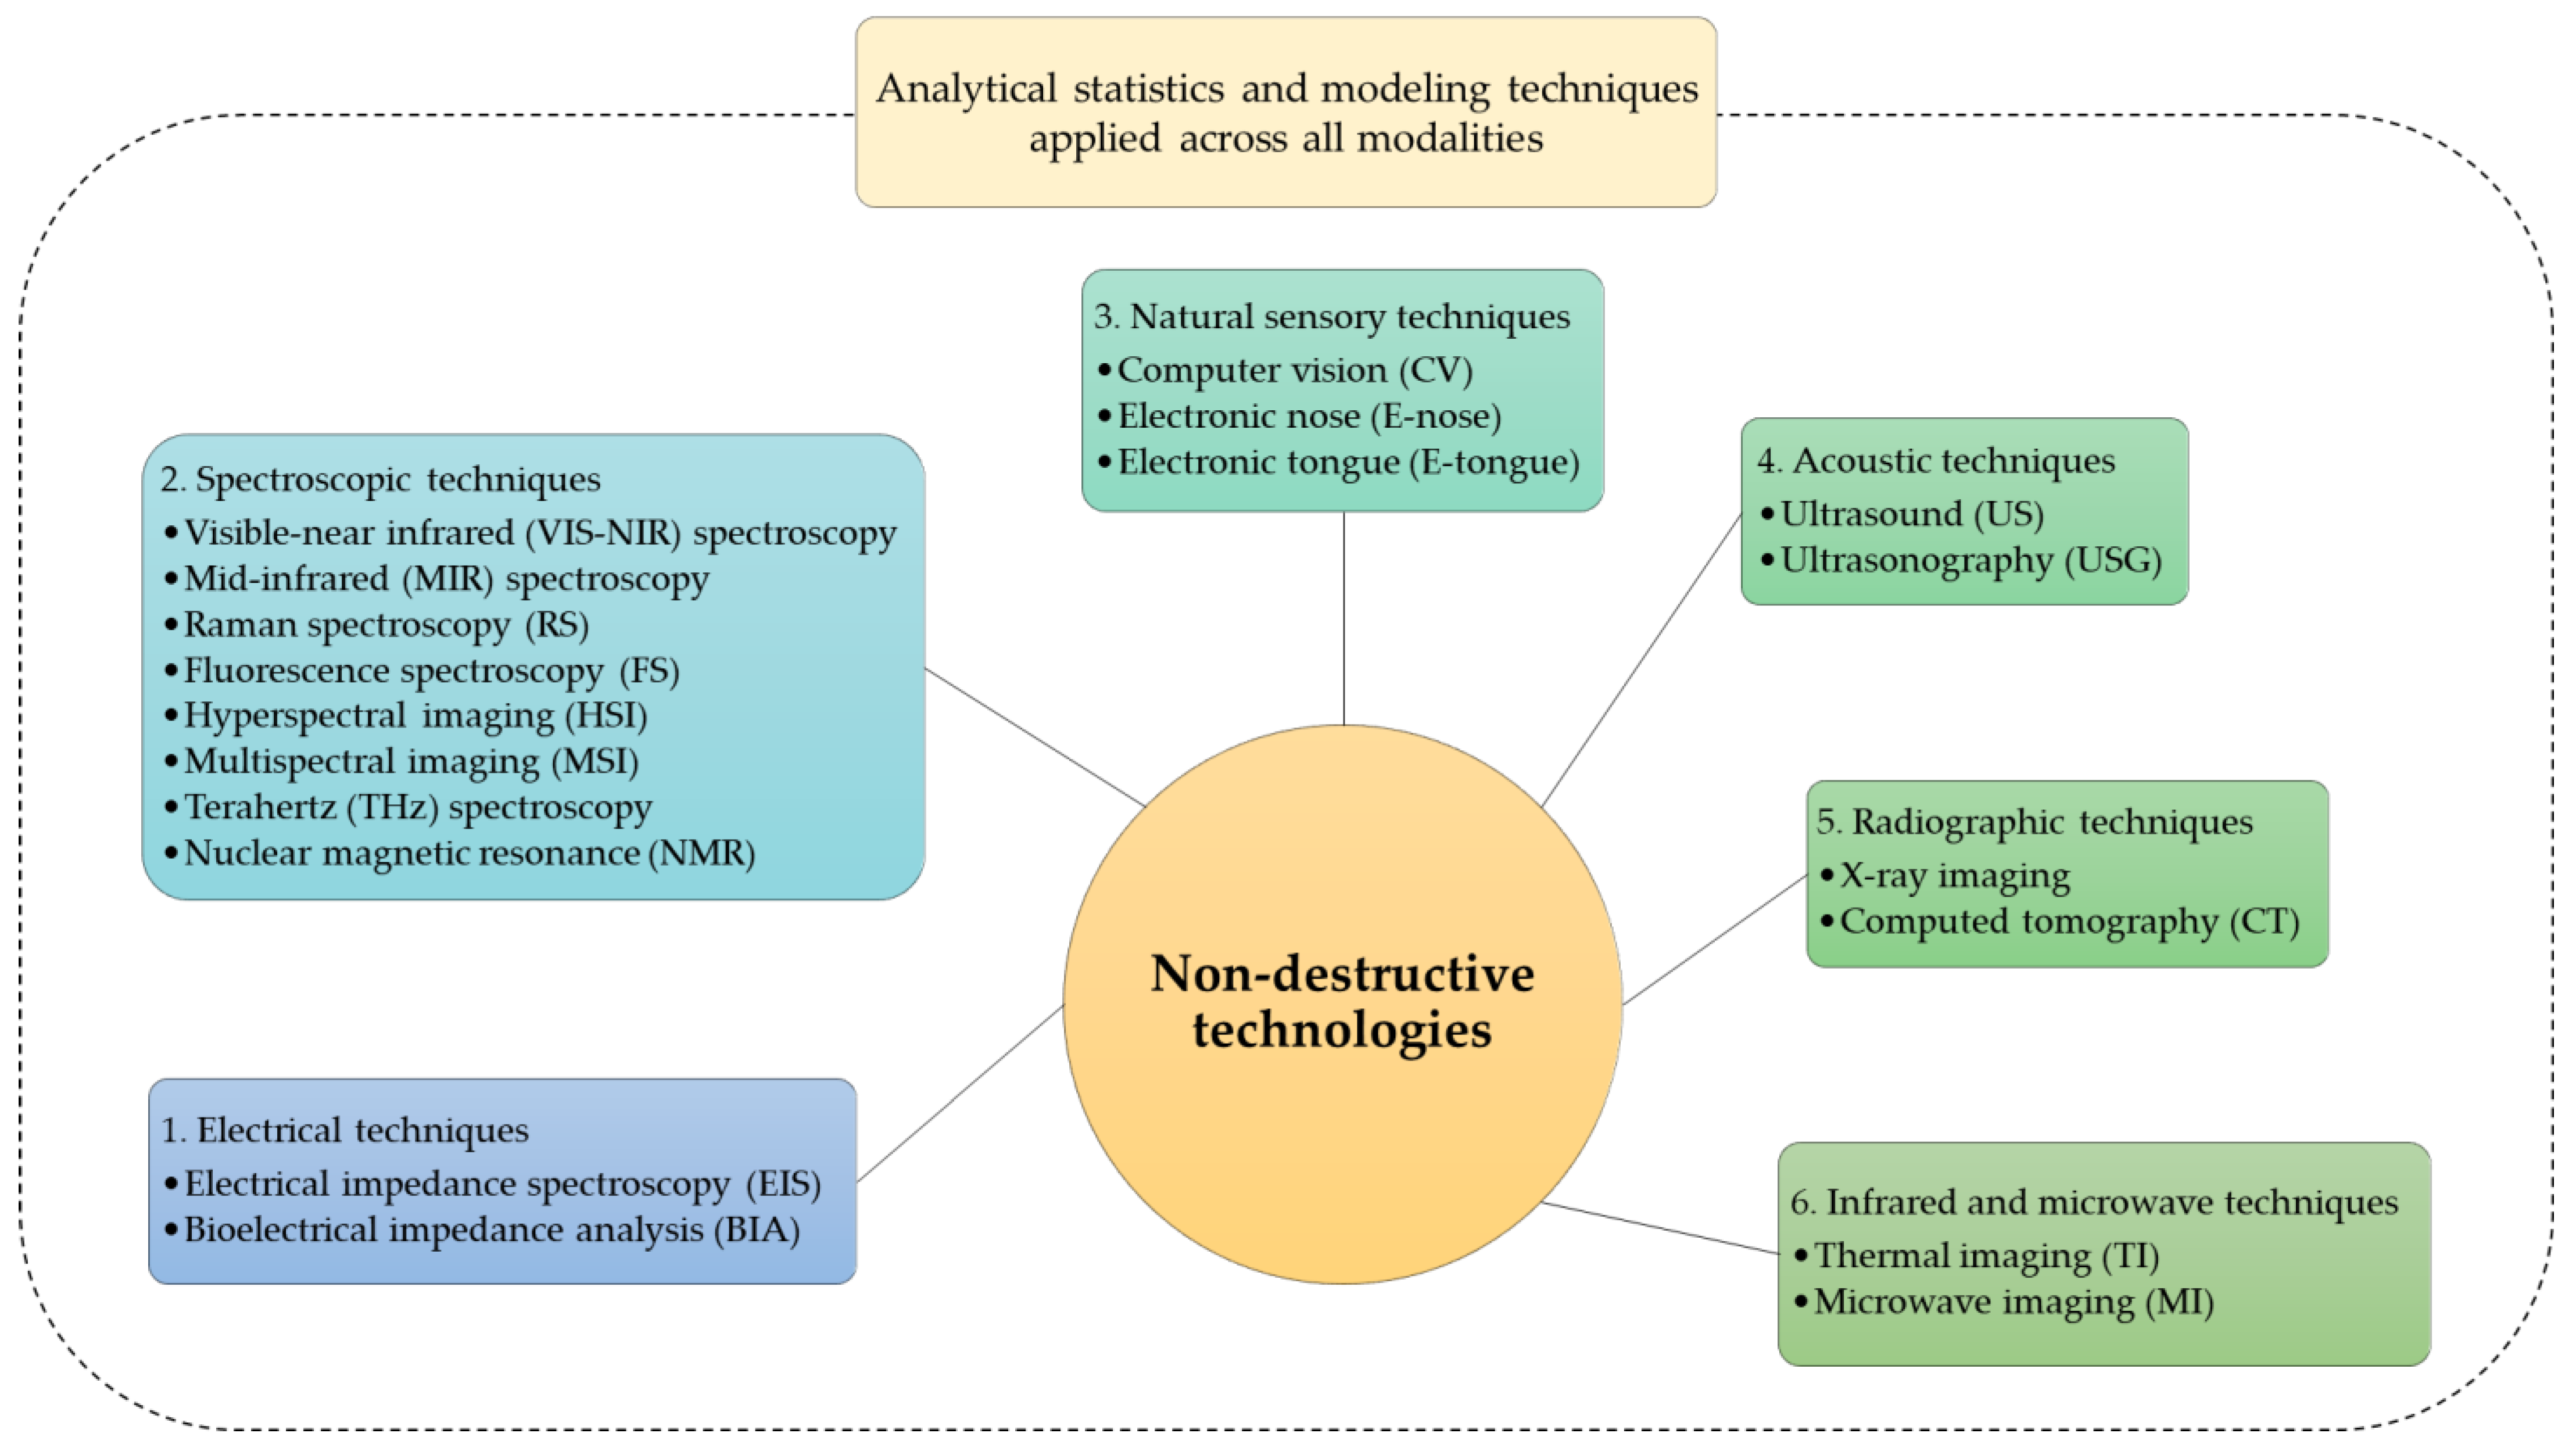
Recent advances in non-destructive technologies provide promising approaches for assessing internal and external quality attributes without sacrificing animals or products [1]. In aquaculture systems, these methods can enable repeatable monitoring and support operational decisions (e.g., broodstock selection, feeding adjustments, and harvest timing) while reducing animal stress and economic loss associated with destructive sampling. Based on sensing mechanisms, non-destructive technologies can be broadly classified into six principal categories: (1) electrical techniques (e.g., electrical impedance spectroscopy (EIS)) [1]; (2) spectroscopic techniques (e.g., hyperspectral imaging (HSI) [1]; (3) natural sensory techniques (e.g., electronic nose (E-nose)) [1]; (4) acoustic techniques (e.g., Ultrasonography (USG)) [7]; (5) radiographic techniques (e.g., X-ray imaging) [8,9]; and (6) infrared and microwave imaging techniques (e.g., thermal imaging (TI)) [10,11]. These six categories will be reviewed in detail in Section 2.
Non-destructive technologies, though promising, exhibit performance variability influenced by target species, production conditions, and application-specific requirements. The selection of appropriate technologies involves trade-offs among accuracy, cost, speed, usability, and system integration feasibility [12]. Technology families differ in sampling depth and operational demands. Spectroscopic and natural sensory approaches (e.g., visible–near-infrared (VIS-NIR) spectroscopy and computer vision (CV)) enable rapid, non-contact screening but typically provide surface or shallow subsurface information, whereas acoustic and radiographic methods can interrogate deeper structures but often require controlled positioning and greater operator skill. Species morphology (e.g., shells or calcified exoskeletons) further constrains penetration and contact quality, thereby influencing achievable performance and method suitability. For example, near-infrared (NIR) spectroscopy can estimate internal meat content in crabs, but its performance may be affected by shell color, thickness, and translucency [13]. Similarly, ultrasound imaging has been used for internal organ assessment and maturation monitoring in fish. However, its effectiveness may be reduced in species with complex anatomies or heavily calcified exoskeletons, which can interfere with signal penetration [7]. This context dependence makes technology selection a multi-criteria decision problem, requiring structured evaluation of both general performance and application-specific suitability.
In response to these multifaceted challenges, multi-criteria decision-making (MCDM) frameworks have been widely adopted for systematic prioritization and technology selection in aquaculture and related fields. Prominent MCDM methods include Elimination and Choice Expressing Reality (ELECTRE) [14], the Technique for Order of Preference by Similarity to Ideal Solution (TOPSIS) [15], and the Analytic Hierarchy Process (AHP) [16]. While TOPSIS and ELECTRE have been applied successfully in various industries, they rely on quantitative data sets and complex mathematical models. This reliance can limit their practicality in expert-driven contexts such as aquaculture, where empirical data may be limited or qualitative in nature [17,18]. In contrast, AHP provides a structured hierarchical framework that decomposes complex decisions into goals, criteria, and alternatives, allowing for expert judgments to be incorporated through pairwise comparisons while ensuring consistency and transparency [19]. AHP has been widely applied in aquaculture to define breeding objectives and genetic gains in fish [20], evaluate shrimp farming technologies for small-scale farmers [21], and assess water quality management strategies [22].
Among aquaculture quality assessment tasks, mud crab ovarian maturation staging provides a practical case for applying structured decision-making. In this study, we apply an AHP-based framework to prioritize non-destructive technologies for assessing ovarian maturation stages in mud crabs, thereby supporting broodstock selection, feeding adjustments, and harvest timing in mud crab farming. Therefore, this study aims to (1) systematically review and critically evaluate the principal non-destructive technologies for the quality assessment of aquatic animal products, highlighting their sensing mechanisms, operational characteristics, technical merits, and inherent limitations; and (2) implement an AHP-based decision-making framework to prioritize these technologies in a case study focused on assessing ovarian maturation stages in mud crabs. This integrated approach provides both a generalized review and context-specific application, supporting evidence-based decision-making in sustainable aquaculture. Section 2 reviews the six technology families; Section 3 details the AHP framework; Section 4 presents the mud crab application and results; and Section 5 discusses implications, limitations, and future work.

2. Non-Destructive Technologies for Quality Assessment of Aquatic Animal Products

This section provides a structured review of non-destructive technologies for quality assessment of aquatic animal products and highlights representative aquaculture applications across production, processing, and distribution. It summarizes operating principles, typical system configurations, performance characteristics, limitations, and application contexts, including assessment of key quality attributes such as freshness, composition (e.g., fat content), and physiological maturity. Section 2.1, Section 2.2, Section 2.3, Section 2.4, Section 2.5 and Section 2.6 follow the classification framework shown in Figure 2, which outlines six technology families and representative techniques and highlights analytical statistics and modeling techniques (e.g., principal component analysis (PCA), partial least squares (PLS), and support vector machines (SVMs)) as a cross-cutting layer used to interpret data across all modalities.

2.1. Electrical Techniques

Electrical methods, including electrical impedance spectroscopy (EIS) and bioelectrical impedance analysis (BIA), are widely used to evaluate the quality of aquatic animal products. EIS quantifies the frequency-dependent complex impedance of tissues, which is influenced by changes in water content, cell integrity, and ionic composition [23]. Under controlled protocols, repeated BIA-derived lipid estimates in Atlantic salmon parr showed low short-term variability (~0.64% over 1 min), whereas variability increased at longer intervals (average ~6.43% at 1.5, 3, and 6 h) [24]. In European squid (Loligo vulgaris) stored at 4 ± 1 °C, impedance magnitude and phase were measured at 200 frequencies (100 Hz–100 MHz). The phase at 1 MHz enabled grouping of post-rigor samples into three storage-stage classes, supporting non-destructive shelf-life assessment [25]. In raw white shrimp, Bactometer impedance (I-value; the initial impedance recorded after 30 min) was strongly correlated with sensory odor score (r = 0.89), and an I-value ≥ 2175 was indicated spoilage [26].
Systems for EIS [27] and BIA [28] typically share a similar architecture, comprising an impedance analyzer, a switching module for multi-site measurements, and an electrode array connected to a computer for data acquisition and analysis (Figure 3). In a typical measurement, an alternating electrical signal is applied to the tissue over a defined frequency range, and the resulting voltage and current responses are recorded to obtain frequency-dependent impedance spectra. Impedance magnitude and phase (or resistance and reactance) are subsequently analyzed to characterize tissue electrical properties. Calibration and correction procedures, together with consistent electrode placement, are essential to minimize measurement error [29].
EIS and BIA are relatively low-cost and fast, with compact instrumentation that supports routine monitoring in aquatic product processing. However, performance depends on stable electrode coupling and well-defined current pathways, and poor contact can compromise repeatability. Standardized measurement protocols and, where appropriate, optimized electrode designs or integration with complementary non-destructive modalities can improve robustness and reproducibility.

2.2. Spectroscopic Techniques

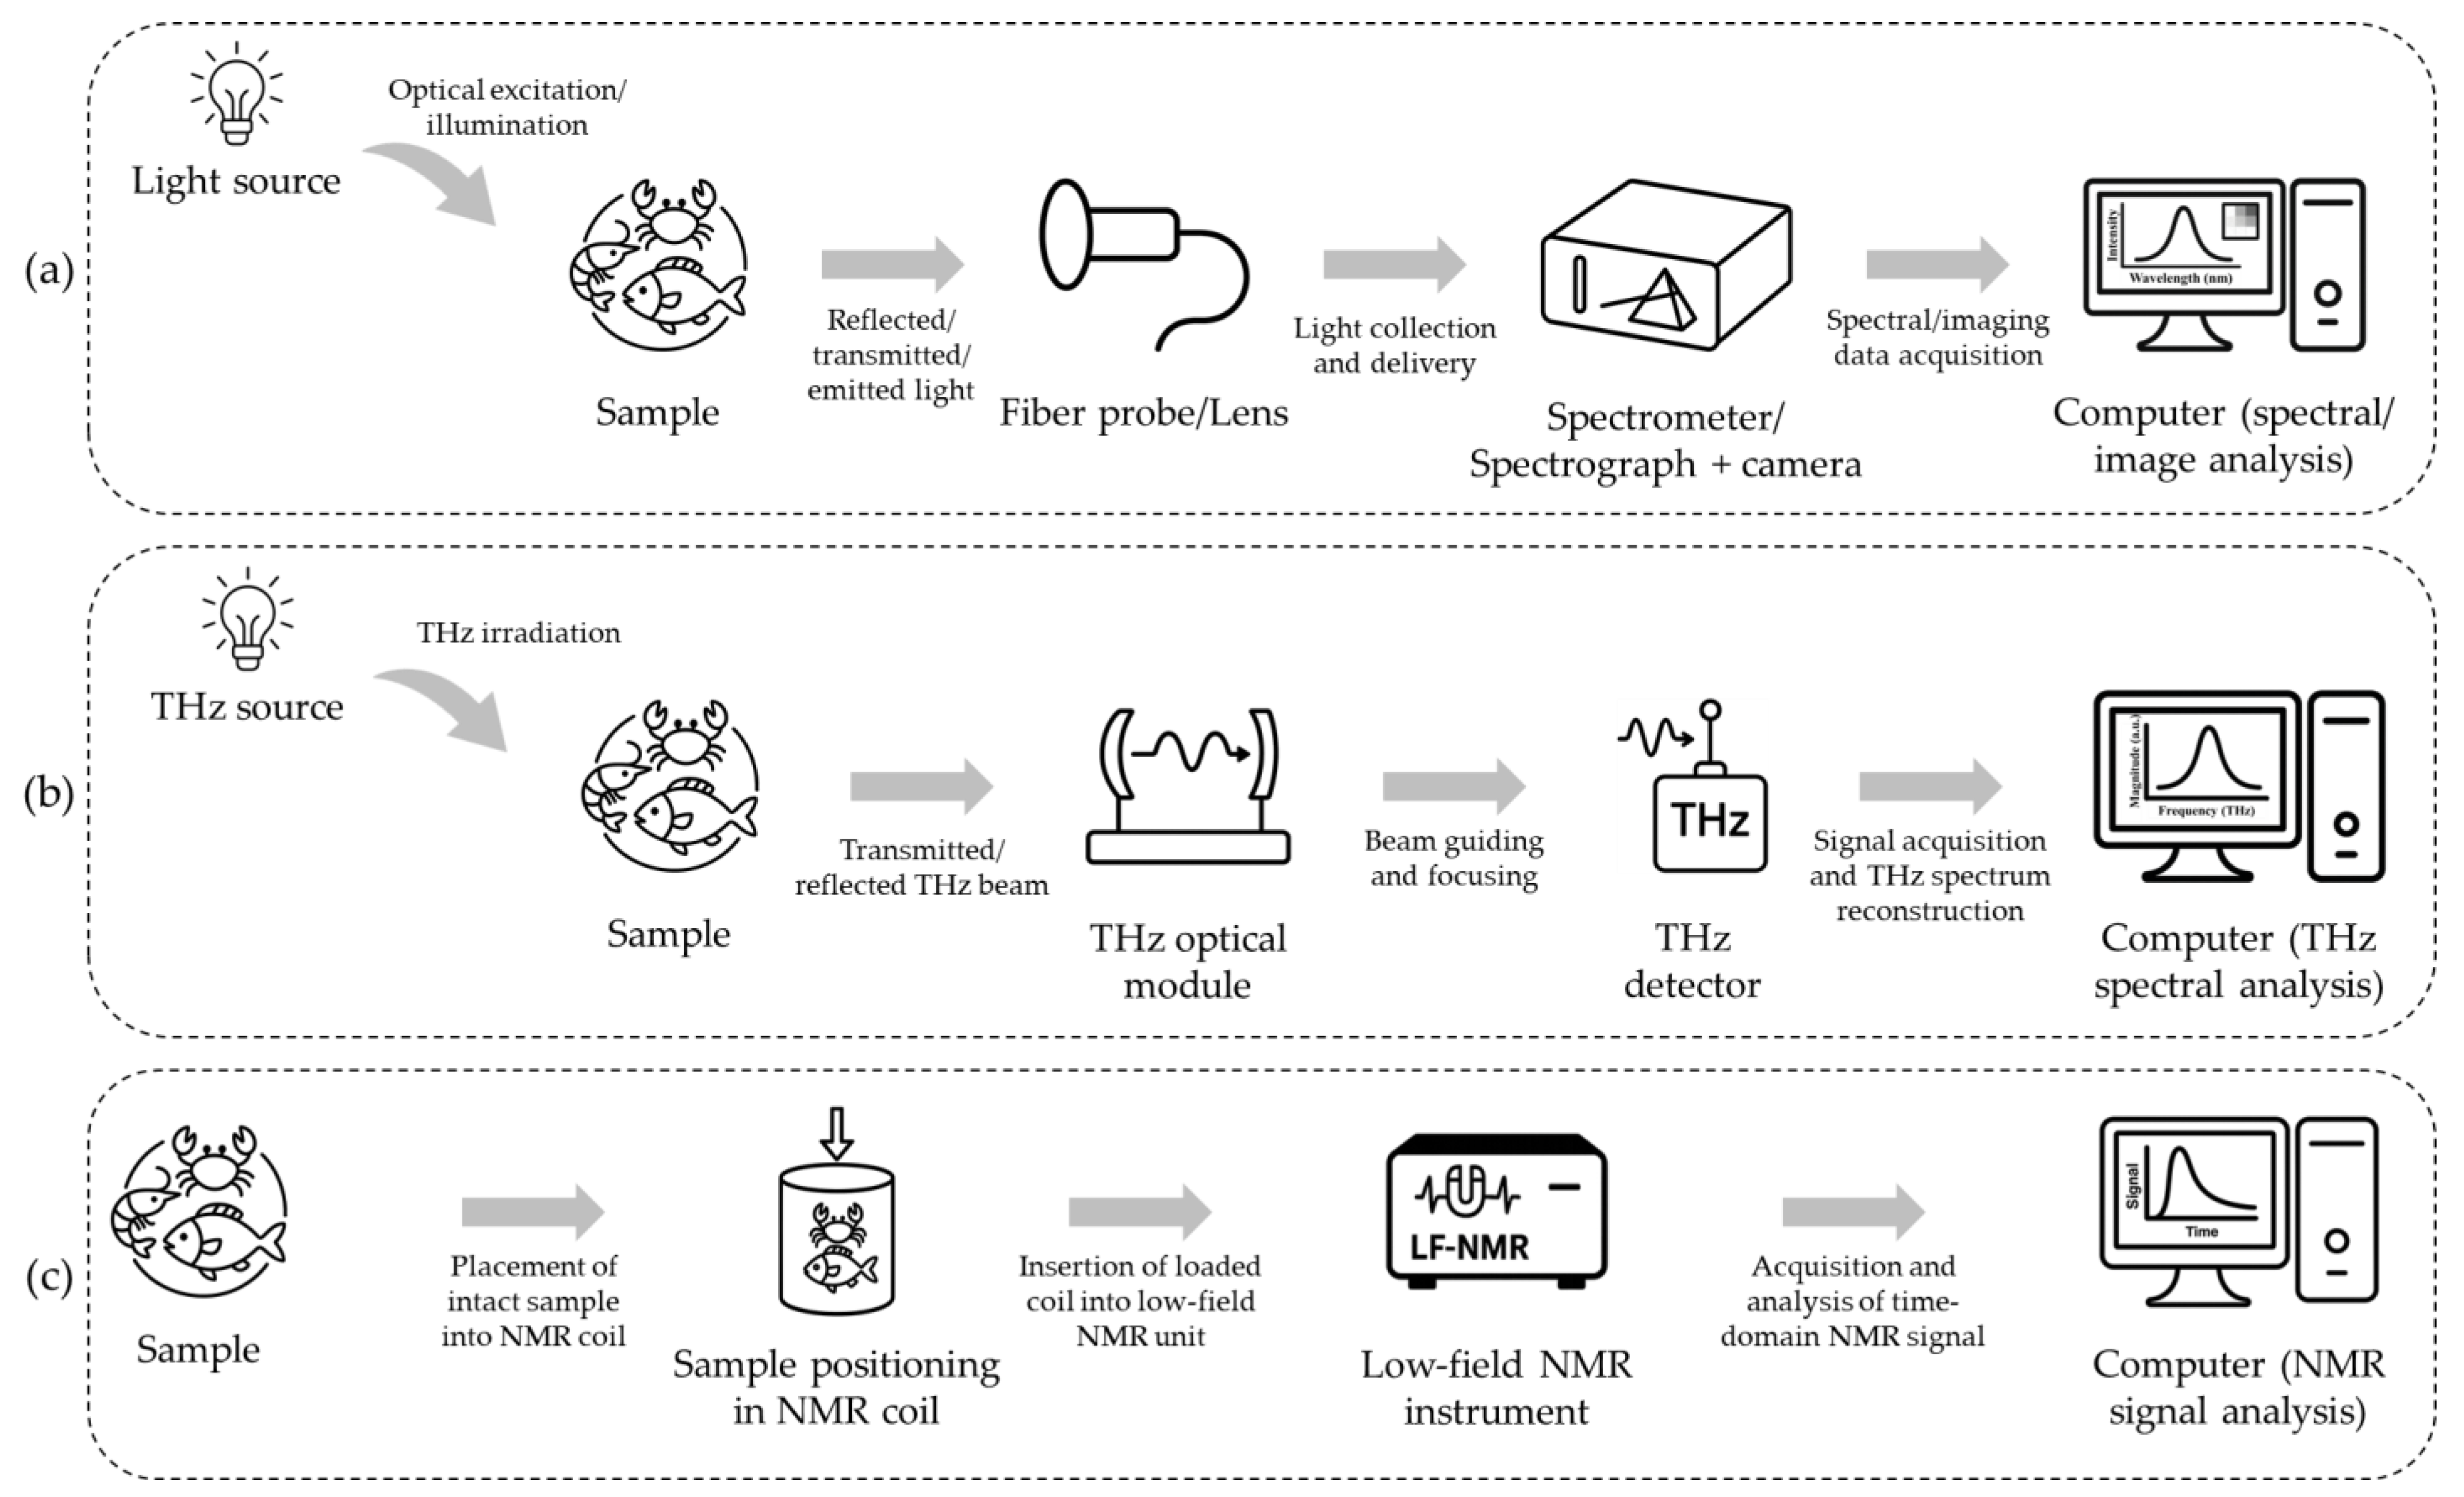
Spectroscopic techniques evaluate the chemical, structural, and physical properties of aquatic animal products through light–matter interactions, providing information on both internal and external quality attributes. These methods are commonly classified based on system configuration and underlying spectral mechanisms. A typical optical spectroscopic system (Figure 4a) consists of a light source, spectrometer or spectrograph, optical components (e.g., lenses and filters), detectors, and a data processing unit. In contrast, terahertz (THz) and nuclear magnetic resonance (NMR) spectroscopy require fundamentally distinct instrumentation. THz spectroscopy employs specialized sources and detectors to probe low-energy vibrational modes (Figure 4b), whereas NMR relies on strong magnetic fields and radiofrequency coils to generate molecular-level data (Figure 4c). Spectroscopic technologies can thus be grouped into three major configurations (Figure 4) [30]: (a) typical optical spectroscopy systems (VIS-NIR, MIR, RS, FS, HSI, and MSI), (b) THz spectroscopy systems, and (c) NMR spectroscopy systems. The principal spectroscopic methods for aquatic animal product quality assessment are summarized below.
Visible–near-infrared (VIS-NIR) spectroscopy assesses freshness and fat content by analyzing light interactions in the visible and near-infrared ranges with molecular vibrations. However, its sensitivity to environmental conditions can affect accuracy [31].
Mid-infrared (MIR) spectroscopy utilizes mid-infrared light to excite molecular bonds, enabling precise chemical analysis for detecting fat content and microplastics. It requires specialized calibration to ensure reliable results [32].
Raman spectroscopy (RS) relies on inelastic scattering of monochromatic light (the Raman effect) to produce molecular fingerprints. It enables highly sensitive applications, such as detecting fish adulteration [33] and evaluating shrimp freshness [34,35]. However, high costs and limited penetration depth constrain its broader use.
Fluorescence spectroscopy (FS) detects fluorescent emissions from specific molecules upon excitation with ultraviolet or visible light, offering high sensitivity and rapid monitoring of shrimp freshness [36]. Its main limitation is shallow penetration depth.
Hyperspectral imaging (HSI) and multispectral imaging (MSI) combine spectral and spatial data by capturing images across multiple wavelength bands. HSI delivers detailed spectral information for fish freshness assessment but faces barriers such as high cost and computational demands [37]. MSI, a simpler alternative, supports species identification and microbiological quality assessment, though with reduced spectral detail [38,39].
Terahertz (THz) spectroscopy probes low-energy vibrational modes to detect spoilage. Its adoption is limited by the need for costly, specialized instrumentation [40].
Nuclear magnetic resonance (NMR) spectroscopy provides molecular-level insights into water and fat content and enables metabolic profiling. Despite its analytical power, its high cost and operational complexity restrict routine use [41].
Spectroscopic techniques enable non-destructive assessment of multiple quality attributes, although suitability is context dependent, particularly with respect to sample type, penetration depth, measurement conditions, and operational requirements. VIS-NIR spectroscopy supports rapid and relatively low-cost screening but is often sensitive to acquisition conditions and calibration robustness, whereas MIR spectroscopy and RS provide higher chemical specificity at higher instrument cost and typically limited penetration depth. HSI integrates spatial information to address tissue heterogeneity, increasing hardware cost and computational demand. Additional approaches (FS, MSI, THz, and NMR) are briefly discussed to illustrate alternative options and their typical feasibility constraints, particularly the high cost and operational complexity of THz and NMR.

2.3. Natural Sensory Techniques

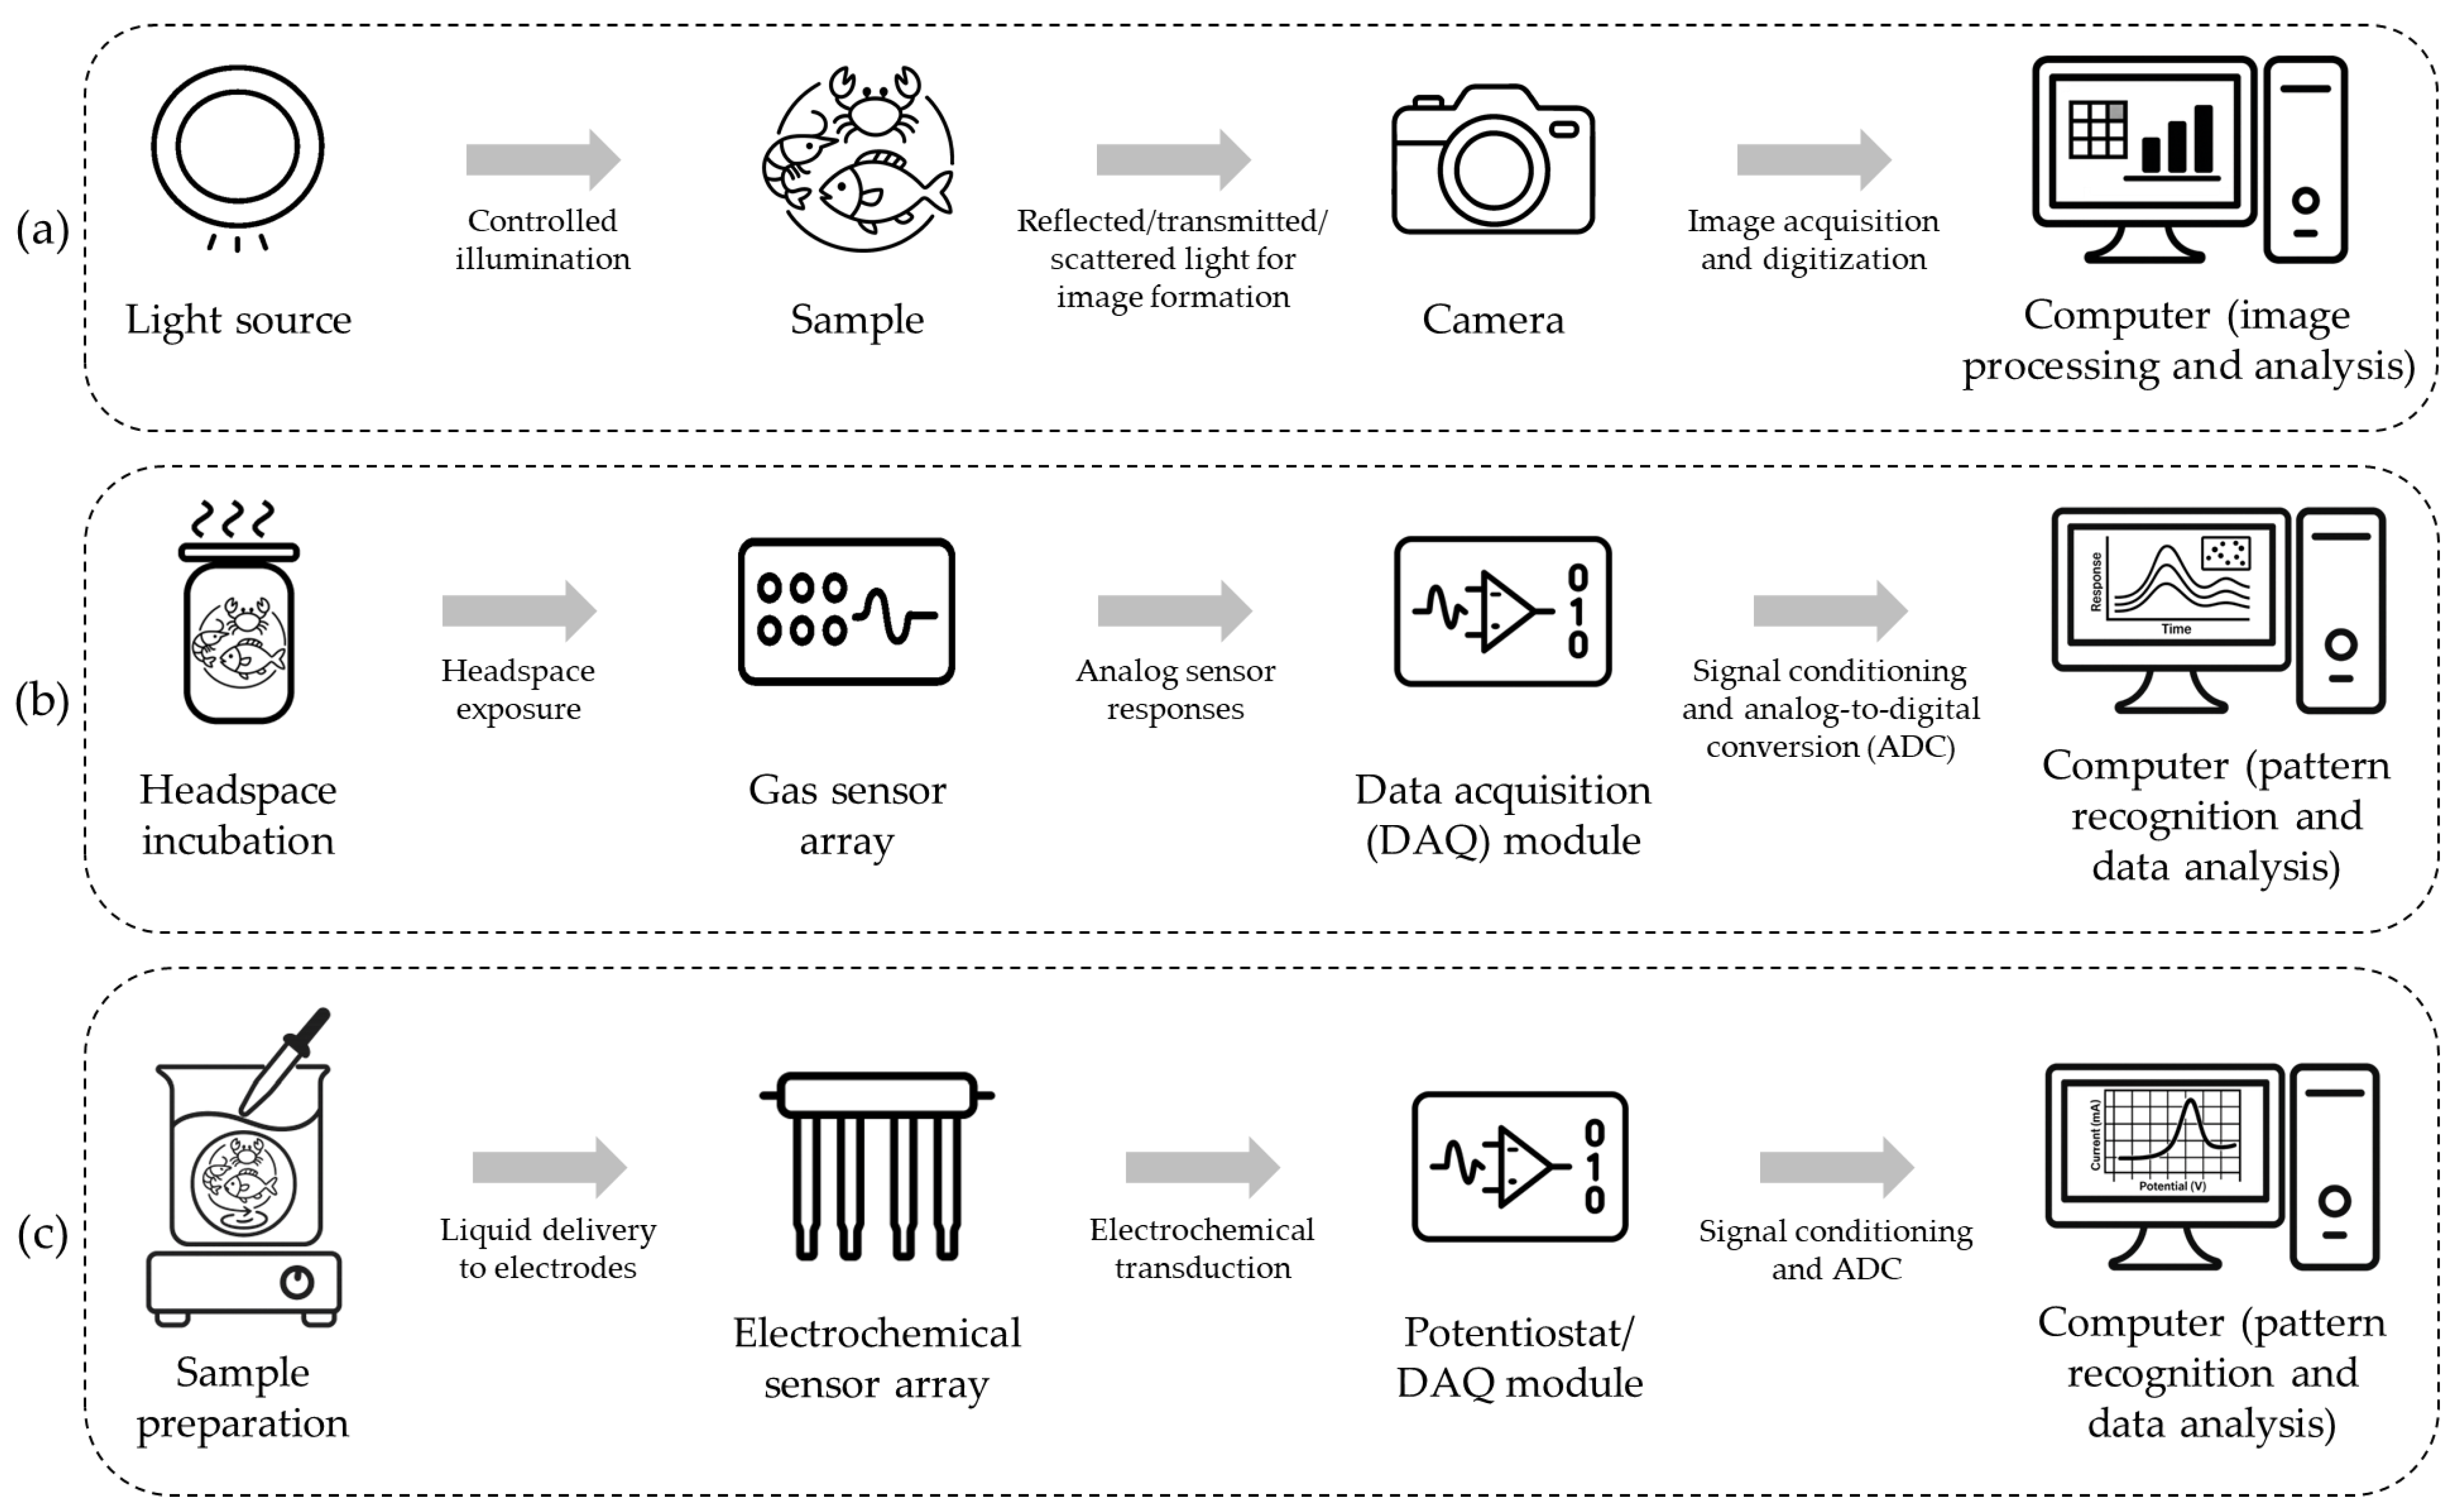
Natural sensory systems aim to replicate human sensory modalities, such as vision, smell, and taste, to provide objective, reproducible, and quantitative assessments of quality attributes in aquatic animal products. These systems typically integrate sensor arrays, signal acquisition modules, and data processing units to generate measurable responses comparable to human perception. Representative techniques include computer vision (CV) for visual inspection, electronic nose (E-nose) for odor profiling, and electronic tongue (E-tongue) for taste evaluation (Figure 5). These technologies have been widely investigated for seafood quality monitoring [42,43,44,45]. The principal natural sensory methods for aquatic animal product quality assessment are described below.
A typical CV system (Figure 5a) integrates a controlled illumination module, a camera, and a computer for image processing and analysis. CV is widely applied to quantify external visual characteristics, such as color, shape, texture, and surface defects. It has been used for automated grading and classification of fish, squid, and crab [46,47,48], oyster sorting [49], and weight estimation of sea cucumber [50]. CV enables high-throughput, non-invasive monitoring of visual traits, facilitating automation and standardization in aquatic animal product processing. Robust CV models require large, diverse, and well-annotated datasets that capture variation in species, size, posture, and imaging conditions. Small or class-imbalanced datasets increase overfitting and reduce cross-site generalization. These limitations can be mitigated through standardized labeling, data augmentation or transfer learning, and validation using independent test sets.
An E-nose system (Figure 5b) typically comprises a headspace incubation unit, a gas sensor array, a data acquisition module, and a computer for pattern recognition and data analysis. It characterizes volatile profiles to assess freshness and spoilage in aquatic animal products and has been applied to quality monitoring in fish, shrimp, squid, and other species [51]. Performance can be influenced by sensor drift and variability in ambient conditions, particularly temperature and humidity. Controlled headspace sampling and gas delivery, together with periodic calibration or model updating, are commonly used to improve measurement stability and repeatability [52].
An E-tongue system (Figure 5c) includes a liquid sample vessel, an electrochemical sensor array, a data acquisition module, and a computer for pattern recognition and data analysis. In Pontic shad (Alosa pontica), a voltammetric E-tongue discriminated freshness states using principal component analysis and partial least squares–discriminant analysis [53]. E-tongue responses are sensitive to measurement conditions (e.g., temperature and humidity), which can contribute to sensor drift. Controlled measurement conditions and appropriate calibration or model maintenance are required to ensure repeatable sensor responses [54].
Natural sensory techniques enable objective and non-destructive assessment of external appearance and sensory-related attributes in aquatic animal products, supporting rapid screening and real-time monitoring. Reliable deployment requires standardized acquisition and sampling protocols, routine calibration, and quality control procedures to maintain stable sensor performance under variable operating conditions. Although scalability can be limited by equipment cost, maintenance requirements, and technical expertise, validated implementations can improve the consistency and efficiency of quality control across aquaculture supply chains.

2.4. Acoustic Techniques

Acoustic methods utilize the propagation and interaction of sound waves within biological tissues to non-destructively evaluate internal structures and properties of aquatic animal products. Two commonly used approaches are ultrasound (US), which analyzes acoustic signal characteristics, and ultrasonography (USG), which produces real-time cross-sectional images. The principal acoustic methods for aquatic animal product quality assessment are described below.
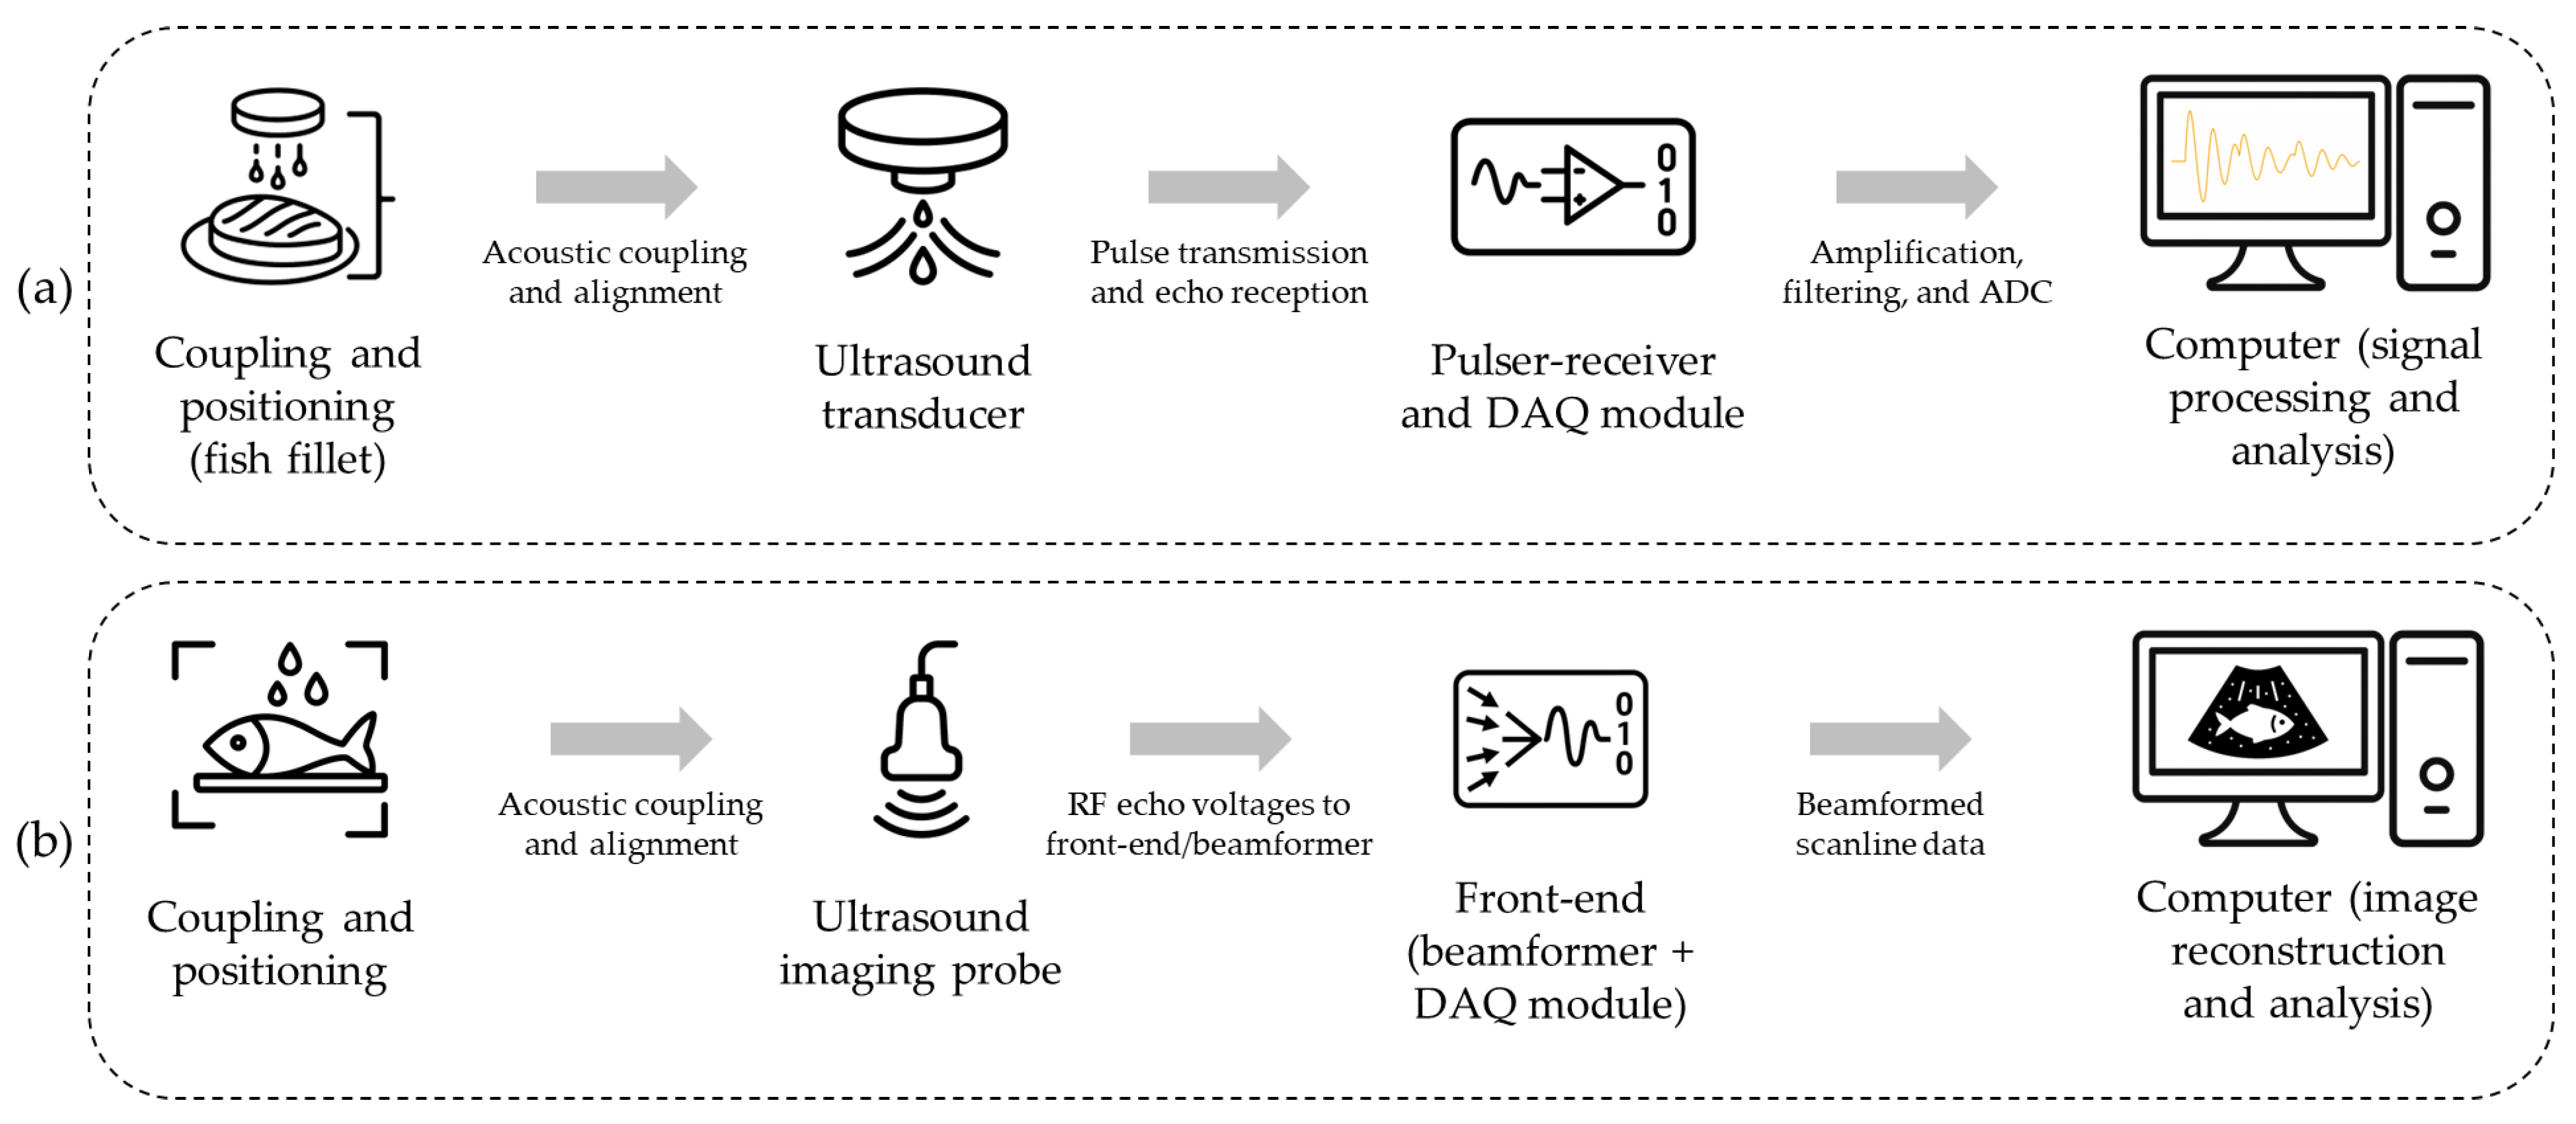
US involves the use of low-frequency sound waves to induce mechanical vibrations within tissues [55]. The resultant acoustic signals, transmitted, reflected, or attenuated, are analyzed to infer quality attributes such as fish freshness [56]. For example, an ultrasonication disk system (Figure 6a) has been used for mechanical testing of fish meat [57]. Due to its rapid, non-destructive nature and low equipment cost, ultrasound is suitable for routine quality screening in fish processing environments. However, the ability of ultrasound-derived features to distinguish subtle quality differences can be limited, and signal interpretation is affected by tissue heterogeneity and operator-dependent measurement conditions. Standardized probe placement, controlled coupling, and repeated measurements can improve repeatability.
USG employs high-frequency sound waves (typically above 2 MHz) that reflect at tissue boundaries to generate real-time cross-sectional images, enabling visualization of internal organs, fat distribution, and gonadal development [7,59]. A high-resolution USG setup (Figure 6b) exemplifies this approach for visualizing fish internal structures [58]. USG enables non-invasive and real-time visualization of internal anatomy for quality and maturity assessment, but practical use can be limited by equipment cost and operator-dependent image acquisition and interpretation [58,59,60]. Standardized scanning protocols, training with reference images, and automated image analysis can improve consistency and efficiency [7].
Acoustic techniques enable rapid, non-destructive quality assessment of aquatic animal products, and portable systems are well suited for in-field use. Performance can be influenced by biological variability, tissue heterogeneity, and operator-dependent acquisition and interpretation, particularly in species with dense or irregular tissues. In crustaceans, exoskeleton thickness can reduce acoustic penetration. Accordingly, appropriate probe selection and standardized acquisition protocols are important to maintain measurement reliability.

2.5. Radiographic Techniques

Radiographic analyses employ X-ray-based imaging techniques to non-destructively evaluate the internal structure and composition of aquatic animal products. The two principal methods, conventional X-ray imaging and computed tomography (CT), differ fundamentally in dimensionality and analytical depth. Conventional X-ray imaging generates a two-dimensional radiograph from a single projection, whereas CT acquires multiple X-ray projections from different angles and reconstructs them computationally into high-resolution three-dimensional images. The principal radiographic methods for aquatic animal product quality assessment are described below.
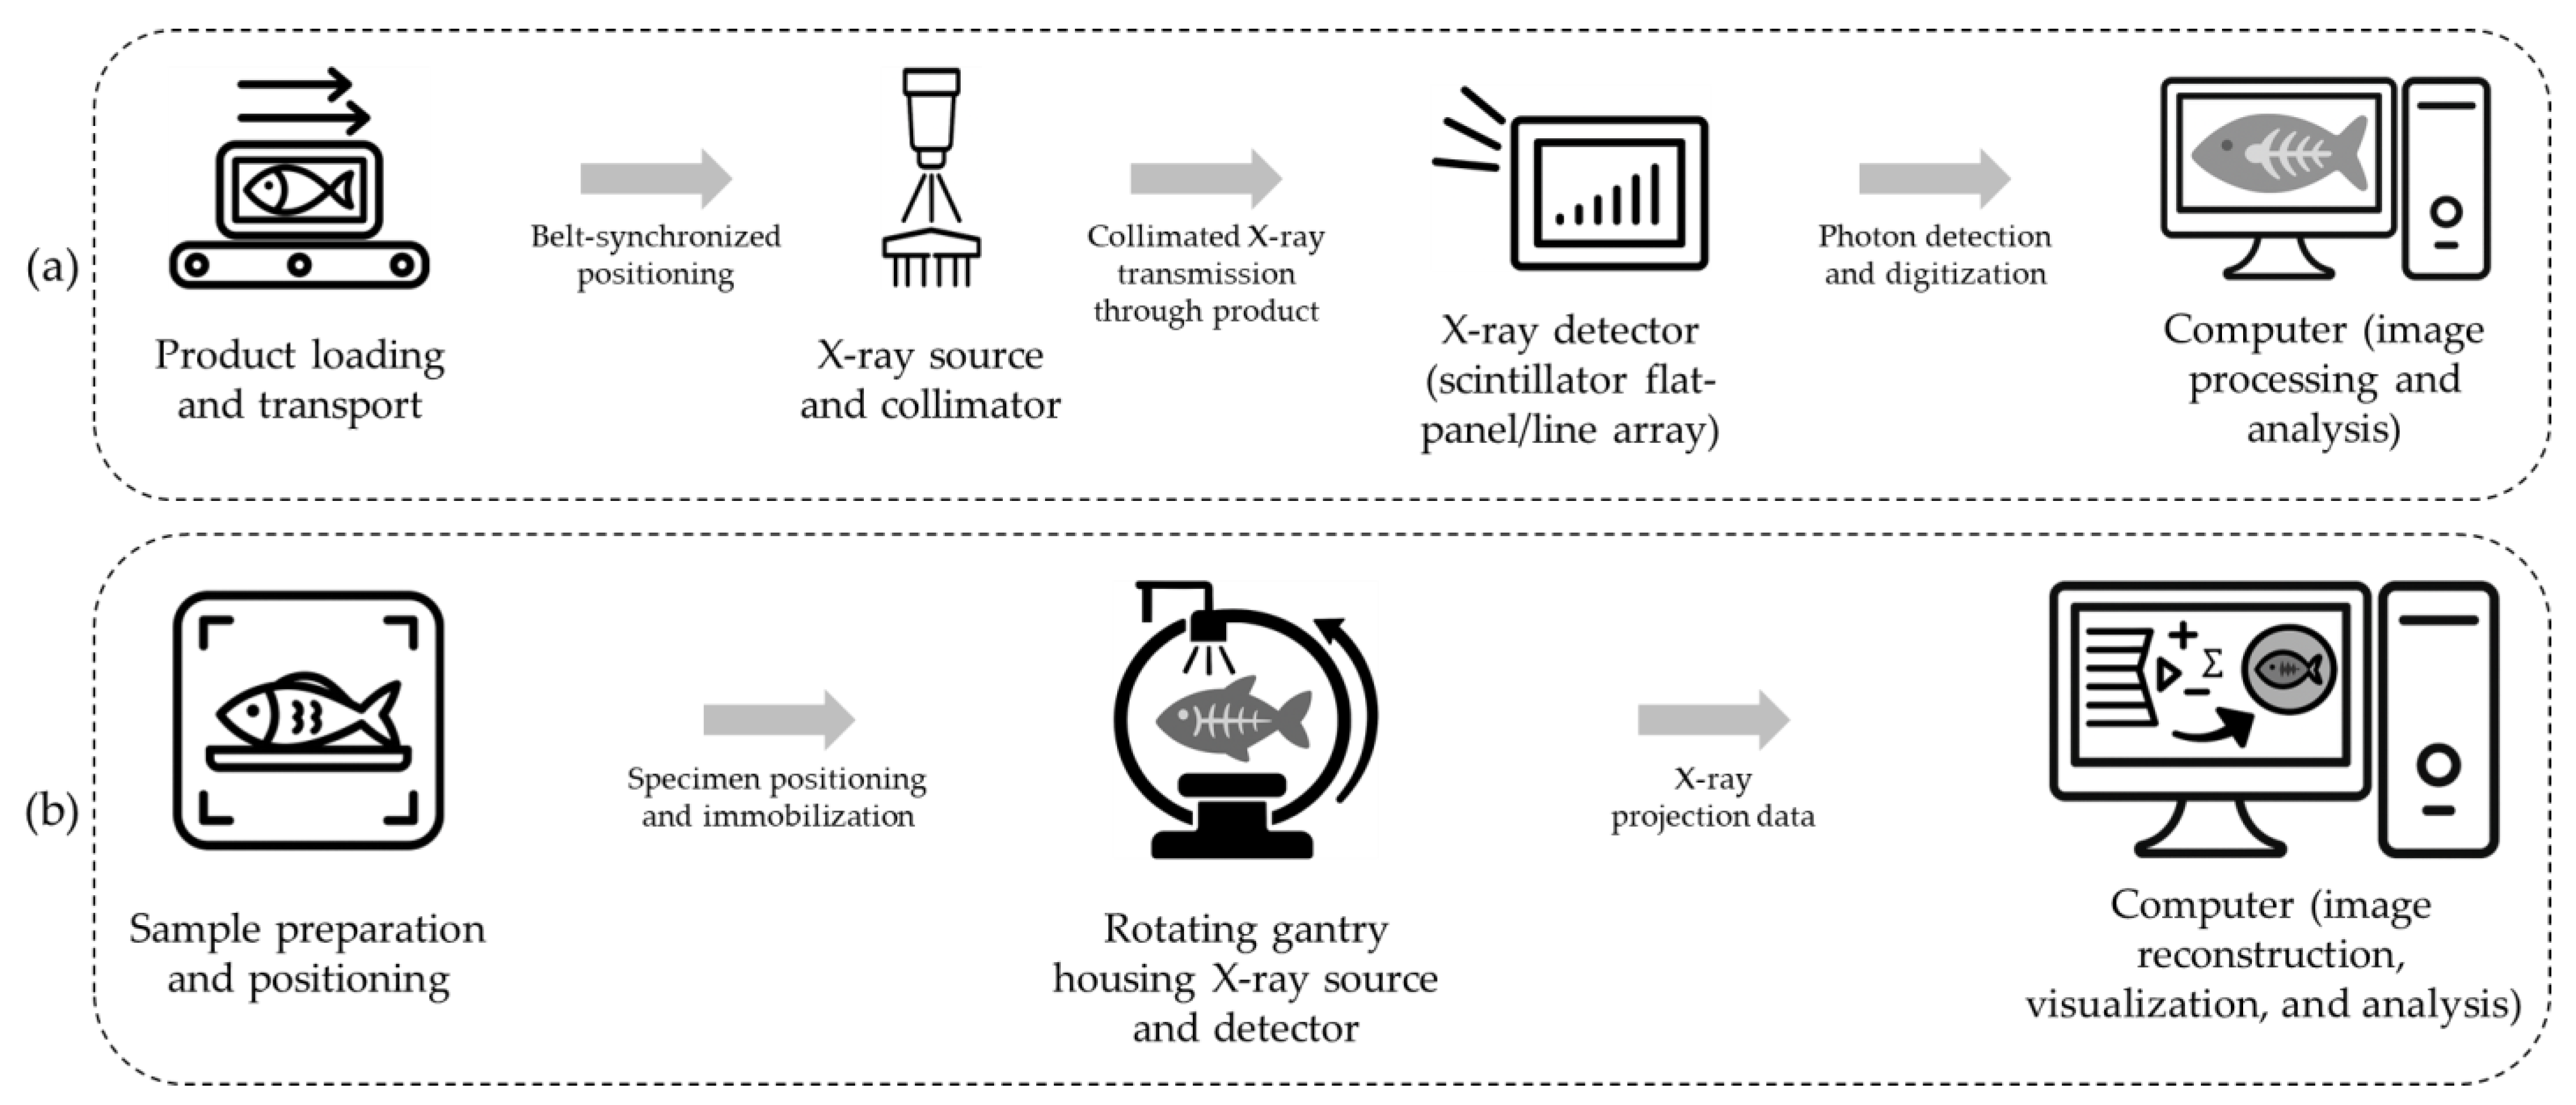
X-ray imaging transmits high-energy electromagnetic waves through the sample, producing a two-dimensional radiograph where denser tissues attenuate more radiation and appear brighter, enhancing contrast [61]. This technique is particularly effective for detecting foreign objects, skeletal defects, or bone fragments in processed seafood. A typical conventional X-ray imaging configuration (Figure 7a) comprises a sample positioning unit, an X-ray source, a detector array, and a computer for image acquisition, processing, and analysis [62].
CT extends the X-ray imaging principle by acquiring multiple projections at various angles and reconstructing them computationally into three-dimensional volumetric images with high spatial resolution [8]. CT enables detailed visualization of internal fat distribution, muscle structure, and organ morphology, offering superior analytical capability compared to conventional X-ray imaging. A typical CT system setup (Figure 7b) includes a sample positioning unit, a rotating gantry that houses an X-ray source and a detector, and a computer for tomographic reconstruction and analysis [63].
While radiographic methods provide high accuracy and excellent spatial resolution, their high equipment cost, operational complexity, and time-intensive data processing limit their feasibility for routine industrial applications. In addition, because X-ray imaging and CT involve ionizing radiation, deployment typically requires compliance with applicable radiation protection regulations (including dose limits and optimization requirements) and the implementation of standard engineering and administrative controls (e.g., shielding, interlocks, controlled access, and trained operators) to keep exposures as low as reasonably achievable (ALARA) [64,65]. Consequently, these techniques are generally confined to research facilities or specialized quality control laboratories, although continued reductions in system cost and faster reconstruction workflows may support broader industrial adoption for aquatic animal product quality control.

2.6. Infrared and Microwave Techniques

Infrared and microwave-based techniques leverage the interaction between electromagnetic radiation and biological tissues to assess surface and internal quality attributes of aquatic animal products. The two principal methods are thermal imaging (TI), which detects surface temperature distributions via emitted infrared radiation, and microwave imaging (MI), which probes internal structures by analyzing the interaction of low-energy microwaves. The primary infrared and microwave methods for aquatic animal product quality assessment are described below.
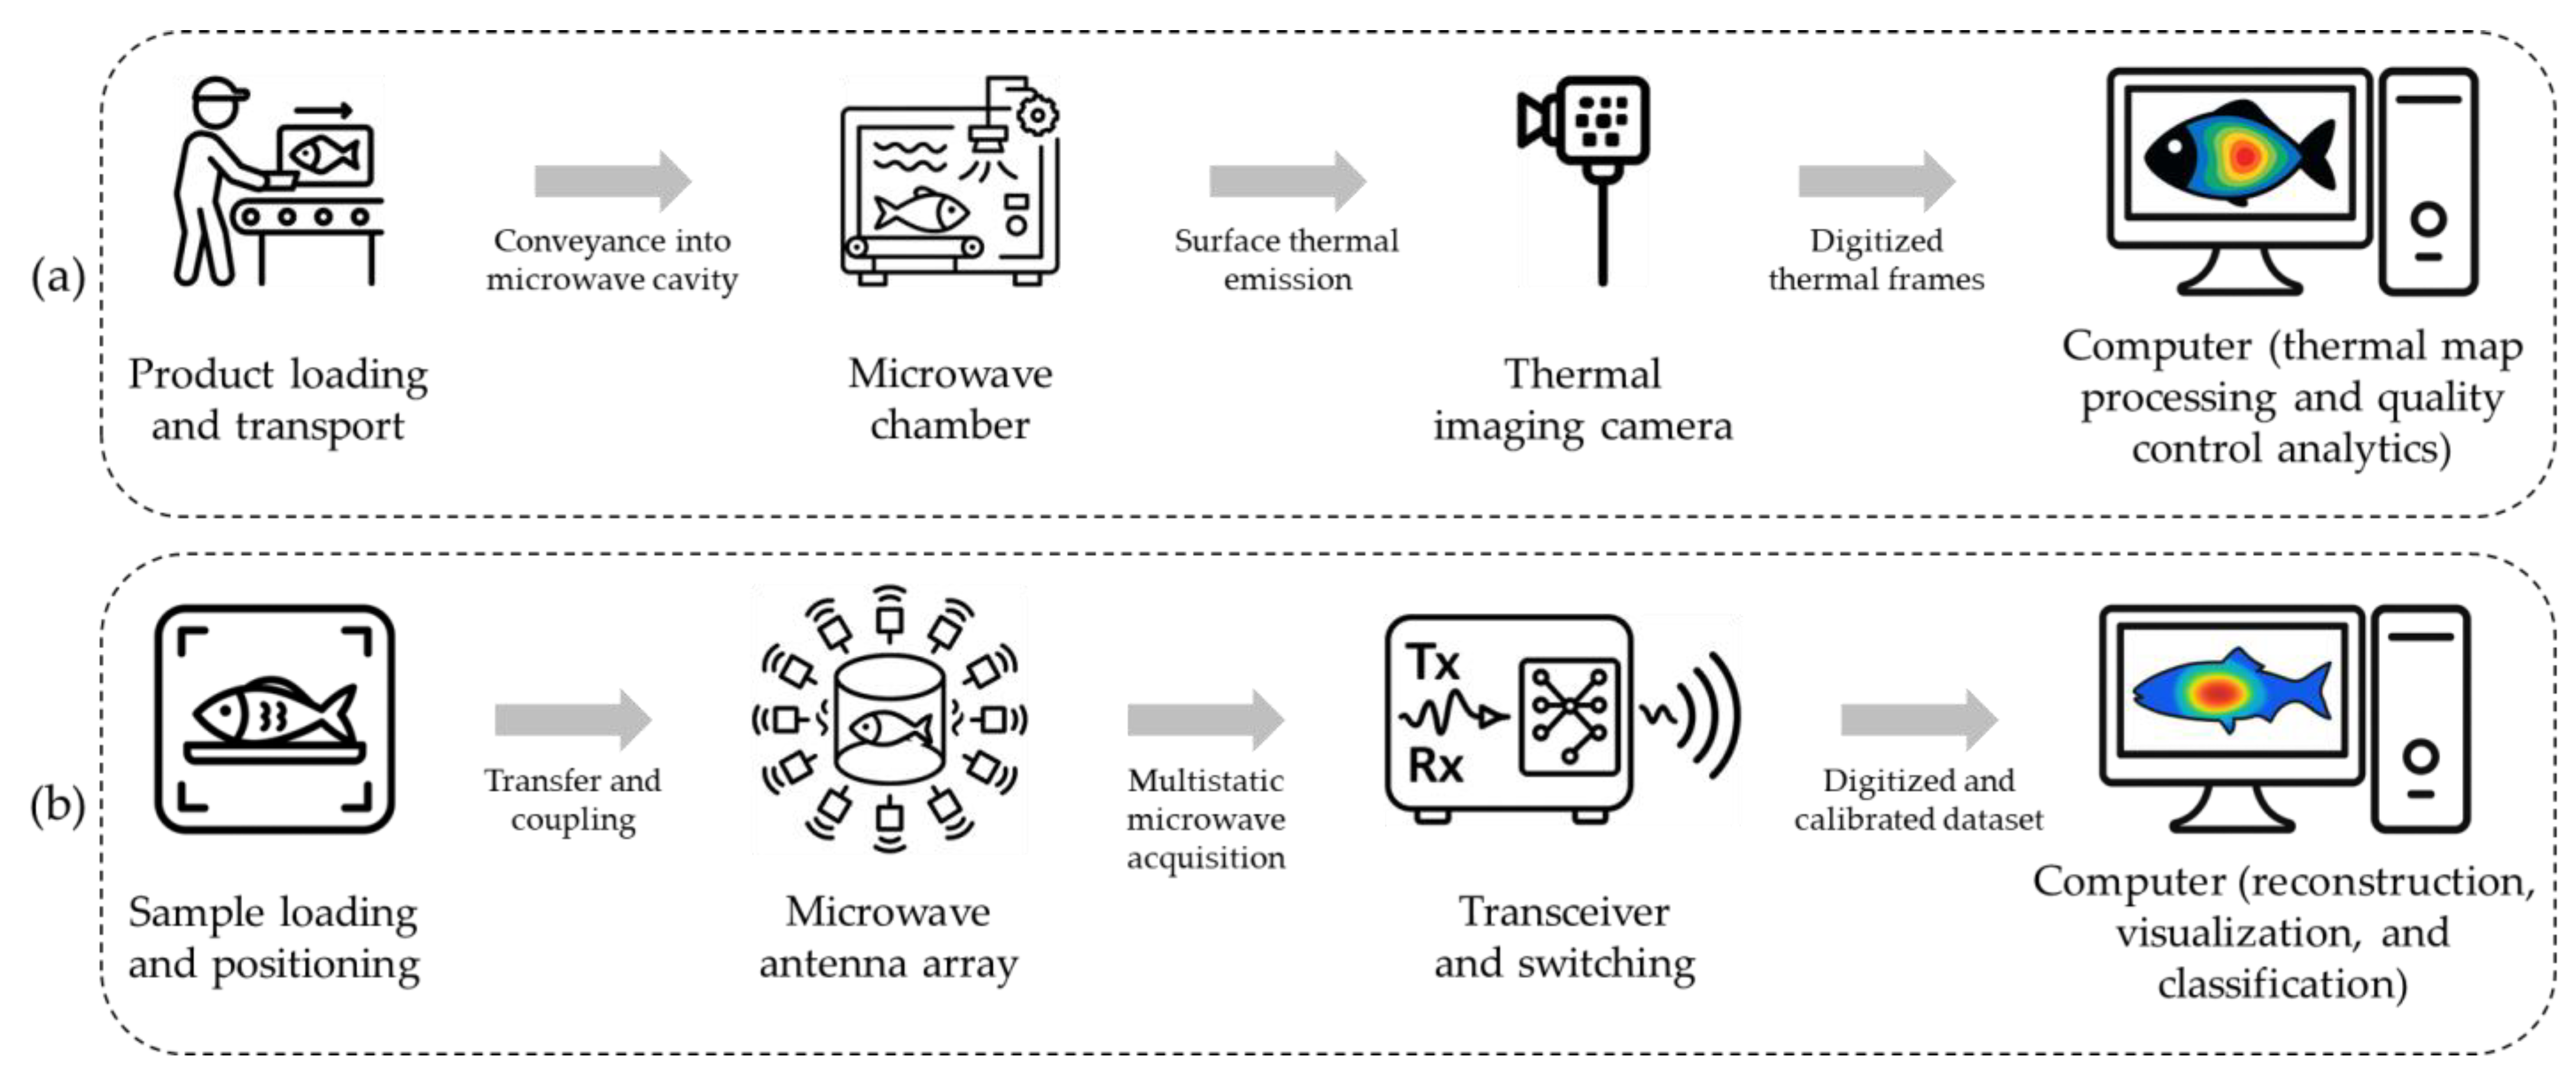
TI detects infrared radiation naturally emitted from object surfaces, with emission intensity proportional to surface temperature. By capturing this radiation, thermal imaging cameras generate color-coded thermal maps that visualize surface temperature distributions and thermal anomalies [66]. An example of an industrial microwave system integrated with a thermal imaging camera is shown in Figure 8a [67]. TI is portable and real-time, making it valuable for detecting temperature heterogeneity along processing lines or for monitoring thermal treatments. A recent study demonstrated the potential of TI for rapid on-site freshness assessment of shrimp and fish by integrating colorimetric and photothermal signals [11].
MI transmits low-energy microwaves into biological tissues and measures the reflected or transmitted signals to infer dielectric properties such as permittivity and conductivity, which correlate with water content, tissue composition, and internal structural integrity [10,69]. A simplified block diagram of an automated MI system is shown in Figure 8b [68]. MI enables deeper tissue penetration than infrared techniques, facilitating non-destructive assessment of internal features not accessible via surface imaging.
While both TI and MI offer promising non-destructive solutions for surface and internal quality monitoring, challenges remain for widespread industrial adoption. These include high equipment costs, specialized operational requirements, and sensitivity to environmental interference. However, ongoing advances in sensor miniaturization, signal processing, and calibration algorithms are expected to enhance the feasibility of these techniques for large-scale seafood quality control.

3. Prioritization of Non-Destructive Technologies for Aquatic Animal Product Quality Assessment

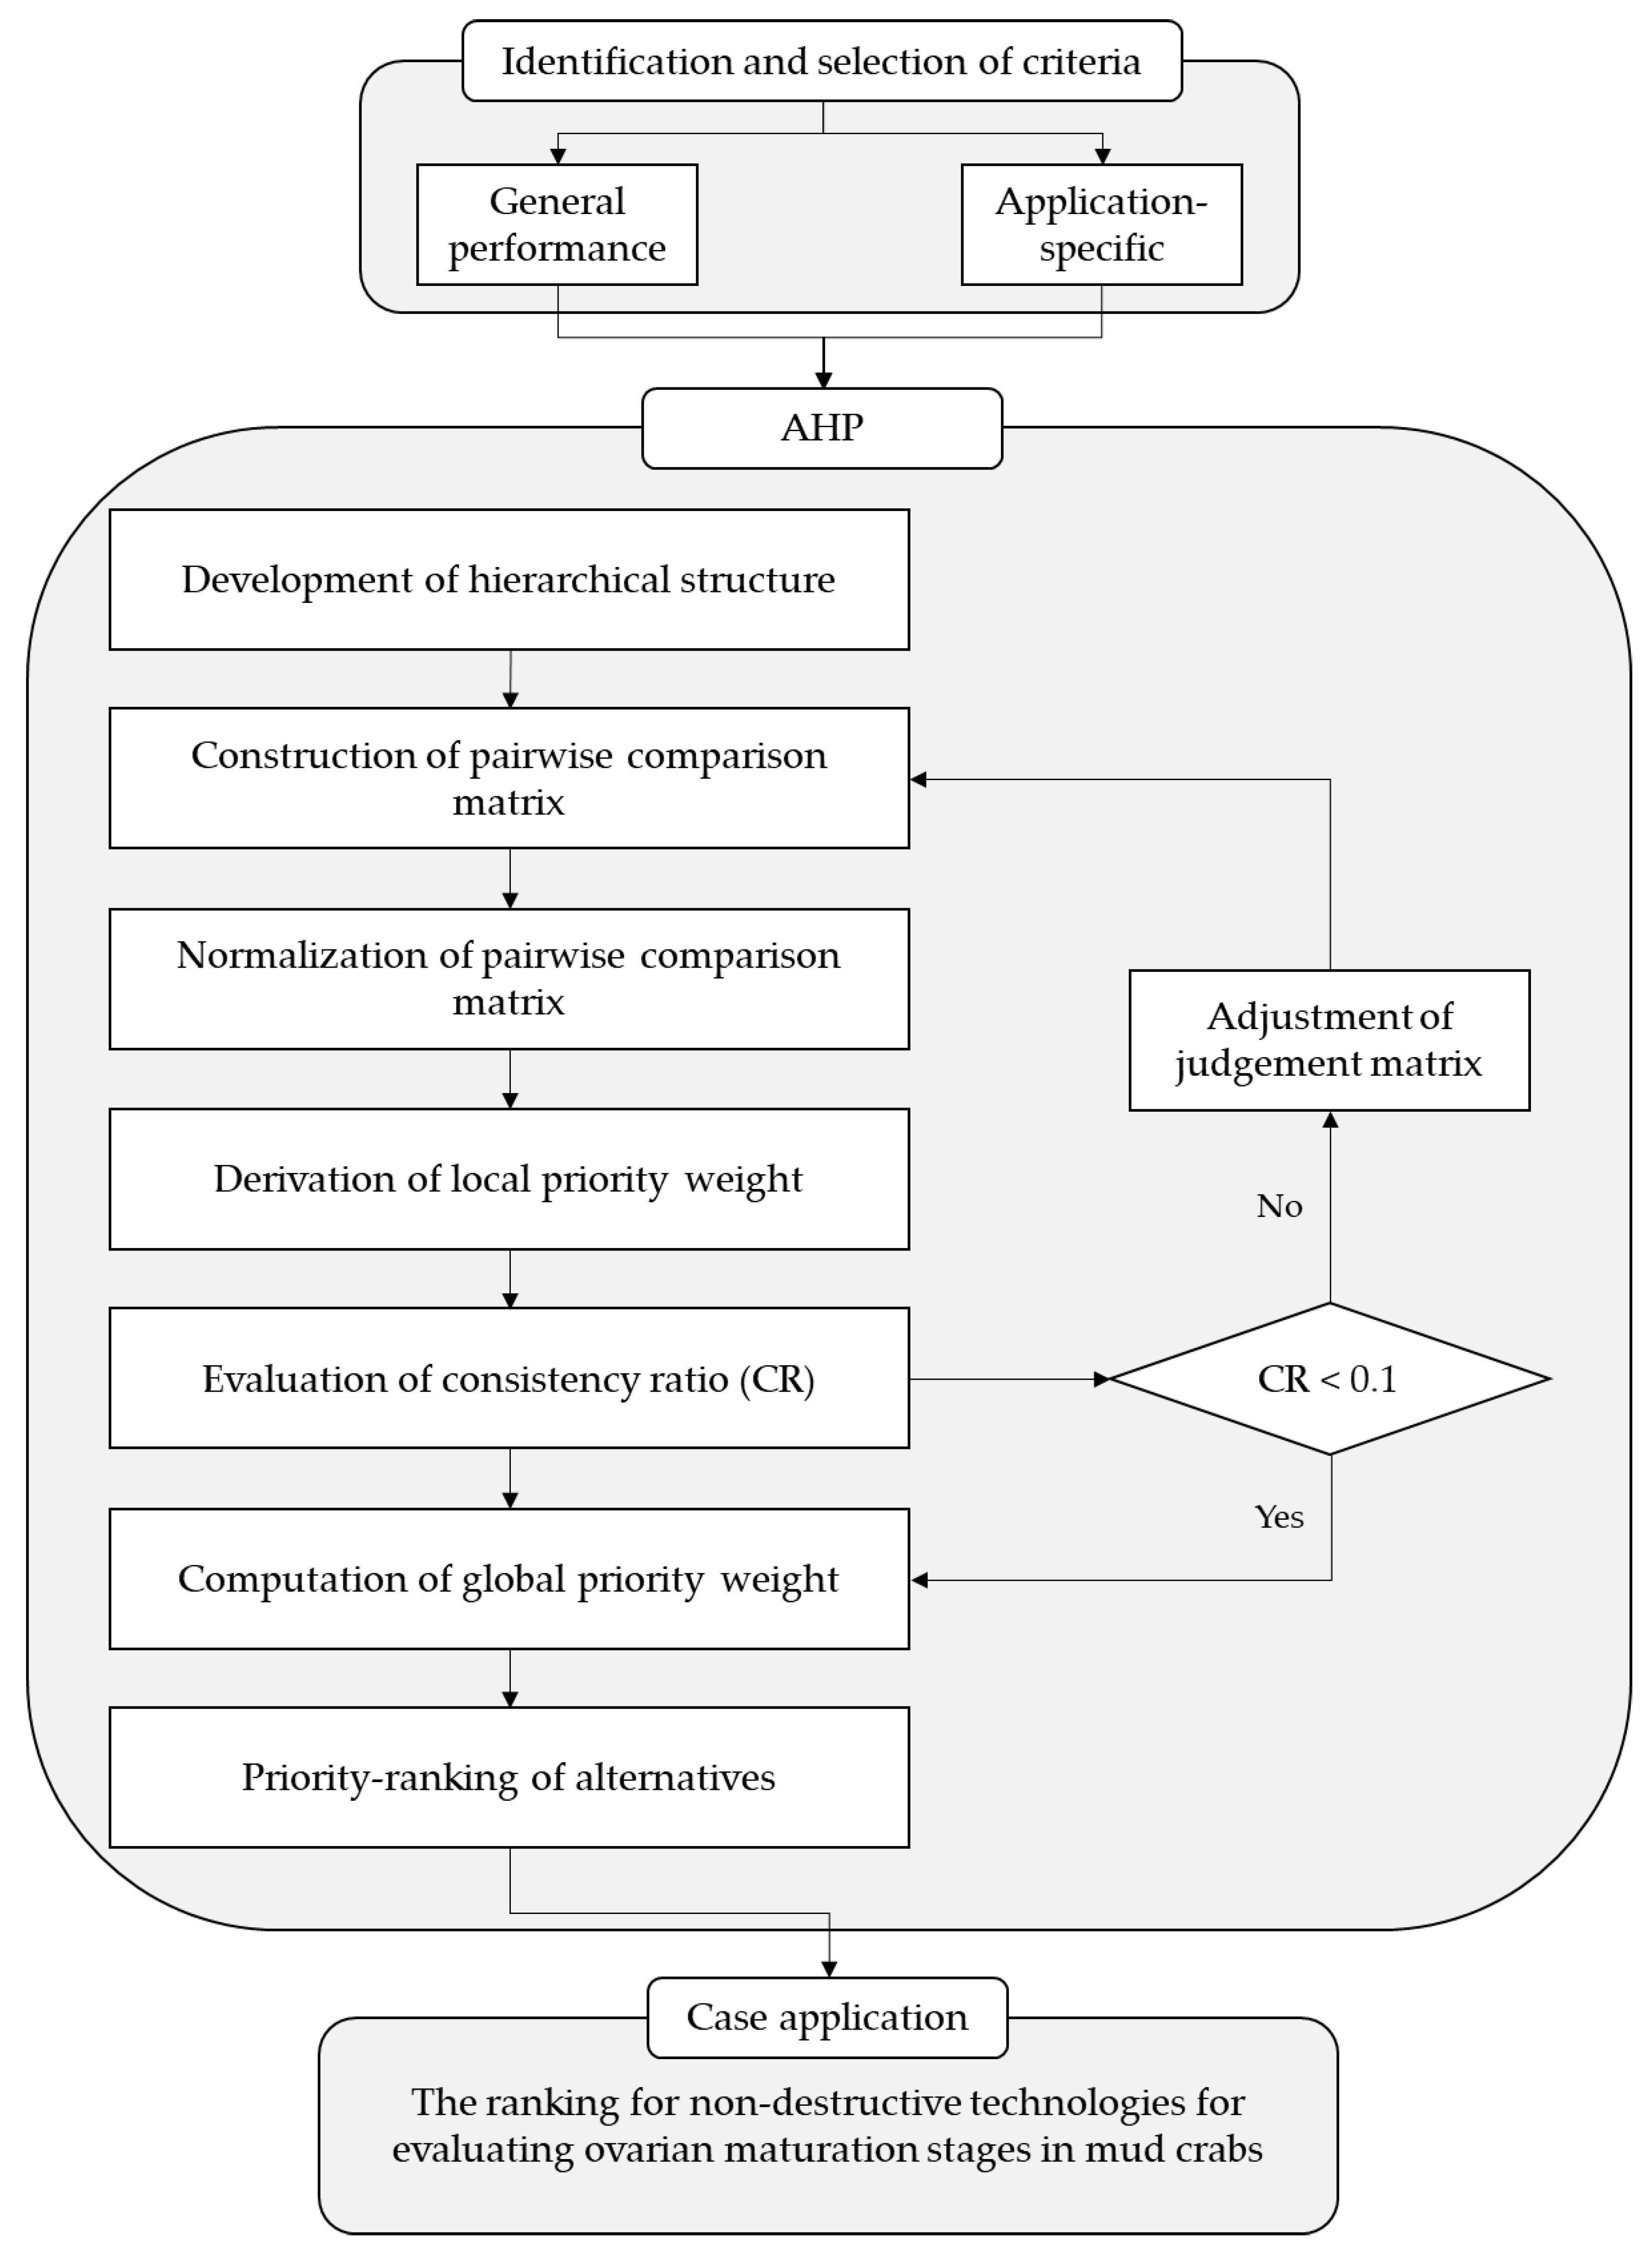
This section presents a structured AHP-based MCDM framework for prioritizing non-destructive technologies in aquatic animal product quality assessment. As shown in Figure 9, the methodology begins with the identification and selection of evaluation criteria, including both general performance and application-specific criteria, through literature review and expert consultation (Section 3.1). These criteria are then organized within a three-level decision hierarchy comprising the overall decision goal, the evaluation criteria, and the candidate technologies (alternatives). The AHP procedure involves constructing pairwise comparison matrices for the criteria and for the alternatives under each criterion, normalizing the matrices, deriving local priority weights, evaluating the consistency ratio (CR), and computing global priority weights for final ranking (Section 3.2). This structured approach supports transparent, objective, and reproducible decision-making in technology evaluation. To demonstrate its practical utility, the framework is applied to a case study focused on identifying the most suitable non-destructive technology for assessing ovarian maturation stages in mud crabs (Section 4).

3.1. Identification of Evaluation Criteria for Non-Destructive Technologies

A structured set of evaluation criteria was established to enable systematic and transparent prioritization of non-destructive technologies for aquatic animal product quality assessment. Candidate criteria were derived from a comprehensive review of peer-reviewed literature and refined through consultation with an 11-member expert panel comprising five university academics and six aquaculture specialists from a coastal aquaculture research and development center in Thailand. All panel members had at least seven years of relevant professional experience in aquaculture production, aquatic animal product quality assessment, and non-destructive sensing.
The finalized criteria were grouped into two categories: general performance (cost, accuracy, speed, usability) and application-specific (scalability, portability, integration feasibility, environmental impact, non-invasiveness). The general performance criteria enable consistent comparison across technologies, whereas the application-specific criteria capture constraints relevant to aquaculture production and field deployment. Table 1 defines each criterion and specifies a four-level qualitative rating scale (Low (L), Moderate (M), High (H), Very high (VH)) to standardize interpretation among assessors. Using this scale, a preliminary qualitative comparison based on the general performance criteria is presented to provide a baseline overview across technologies (Table 2). In subsequent AHP case applications, application-specific criteria are scenario-dependent; therefore, only decision-critical application-specific criteria are incorporated into the AHP matrices, while the remainder are reported as implementation considerations to ensure transparency.

3.2. AHP-Based Prioritization Framework

The AHP methodology was applied to systematically prioritize non-destructive technologies for aquatic animal product quality assessment, using the evaluation criteria identified in Section 3.1. AHP enables transparent and reproducible comparisons by integrating expert judgments. The model was structured in a three-level hierarchy: the overall goal (selecting the most suitable non-destructive technology) at the top, the nine evaluation criteria (including general performance and application-specific criteria) in the middle, and the candidate technologies (e.g., EIS, CV, and X-ray) at the bottom. Expert evaluations were obtained through pairwise comparisons using Saaty’s 1–9 scale, as shown in Table 3 [87], forming the basis for constructing comparison matrices. Local priority weights were calculated from these matrices, and CR values were computed to assess judgment consistency. Only matrices with CR < 0.1 were considered acceptable. The validated global priority weights were then used to rank the candidate technologies, supporting transparent and evidence-based decision-making in aquaculture technology selection.
The implementation of AHP methodology followed a structured six-step procedure, as detailed below.
(1) Development of hierarchical structure
The decision problem is organized into a hierarchical framework, with the primary objective at the top level, followed by the nine evaluation criteria and the candidate technology options at the bottom level.
(2) Construction of pairwise comparison matrix (aij)
A pairwise comparison matrix is typically developed using expert judgments to determine the relative significance of the elements under evaluation, either among the criteria or among the alternatives under each criterion. Each matrix entry aij in the matrix A represents the relative preference of element i compared to element j, as assessed by experts using Saaty’s 1–9 scale provided in Table 3. Each expert’s judgments are structured into a square pairwise comparison matrix of dimension n × n, where n is the number of elements being compared. As defined by the pairwise comparison matrix A (Equation (1)), only the upper triangular portion of the matrix is completed by the respondents. The lower triangular part is automatically derived as the reciprocal of the upper triangle (i.e., aji = 1/aij for all i, j from 1, 2, …, n). The diagonal elements are all equal to 1, reflecting that each element is equally important when compared to itself (i.e., aii = 1).
A = [ 1 a 12 a 1 n a 21 1 a i j 1 a j i = 1 / a i j 1 a n 1 1 ]
(3) Normalization of comparison matrix (Nij)
The values in each matrix are normalized by dividing each element by the column total, ensuring that the sum of each column equals 1. This step is essential for establishing a uniform basis for priority assessment, as expressed in Equation (2):
N i j = a i j i = 1 n a i j
where Nij is the normalized value at row i, column j; aij is the original pairwise comparison value at row i, column j; i = 1 n a i j represents the sum of the elements in column j; and n is the total number of criteria or alternatives. This normalized matrix is used to calculate the local priority weights for both the criteria and alternatives, as determined in (4).
(4) Derivation of local priority weight (WCi and WAij)
The local priority weight of each criterion (WCi) or each alternative under a given criterion (WAij) is computed by averaging the values in each row of the normalized matrix (Nij), using Equation (3). The calculation produces the principal eigenvector, which indicates the relative importance of each criterion or alternative.
W i = 1 n j = 1 n N i j
where Wi is the local priority weight of the i-th criterion (when evaluating criteria) or the j-th alternative under the i-th criterion (when evaluating alternatives). In the criteria comparison matrix, WCi denotes the local priority weight of the i-th criterion. In the alternative comparison matrix under a specific criterion, WAij represents the local priority weight of the j-th alternative with respect to i-th criterion. This row-averaging method yields an approximate principal eigenvector of the pairwise comparison matrix, indicating the relative importance of each criterion or alternative in a consistent way.
(5) Evaluation of consistency ratio (CR)
CR is computed to validate the consistency of the pairwise comparisons, ensuring the reliability of the derived local priority weights. A CR value below 0.1 is generally considered acceptable, indicating that the pairwise comparisons are consistent. The process begins with the calculation of the weighted sum vector (WSi), which is computed separately for criteria and alternatives. For criteria, WSi is obtained by multiplying the original pairwise comparison matrix (aij) by WCi, and for alternatives, it is obtained by multiplying the original pairwise comparison matrix by WAij, using Equation (4). Each element of the consistency vector (θi) is then determined by dividing each element of WSi by its corresponding WCi or WAij, using Equation (5). The largest eigenvalue (λmax) is computed as the average of all elements in θi, using Equation (6). Using this, the consistency index (CI) is calculated as given in Equation (7), while the CR is determined using Equation (8):
W S i = j = 1 n a i j · W j
θ i = W S i W i
λ m a x = 1 n i = 1 n θ i
C I = λ m a x n n 1
C R = C I R I
where WSi is the weighted sum vector for the i-th row; Wj is the local priority weight for the j-th criterion or alternative; θi is the consistency vector for the i-th row; λmax is the largest eigenvalue of the pairwise comparison matrix; and RI is the random index selected according to the matrix order n (e.g., RI = 1.12 for n = 5) [88].
(6) Computation of global priority weight (GAj)
The global priority weight of each alternative (GAj) is obtained by multiplying the local priority weight of each criterion (WCi) by the corresponding alternative local priority weight under that criterion (WAij) and summing across all criteria, using Equation (9).
G A j = W C i × W A i j
where GAj is the global priority weight for the j-th alternative. The summation is taken over all criteria i = 1, 2, …, n. Each alternative’s global score GAj reflects its global priority considering all criteria. This final score ranks the technology options, supporting evidence-based selection aligned with practical needs.
This AHP-based prioritization provides a systematic basis for selecting non-destructive technologies for aquatic animal product quality assessment. Section 4 applies the framework to a practical decision scenario that ranks candidate technologies for assessing ovarian maturation stages in mud crabs.

4. Case Application of the AHP Framework in Aquaculture: Ovarian Maturation Assessment in Mud Crabs

4.1. Prioritizing the Non-Destructive Technologies for Ovarian Staging Assessment

Conventional ovarian maturation staging in mud crabs is destructive, requiring dissection and ovary excision; stages are assigned using gross ovarian appearance (e.g., color and enlargement/coverage) and oocyte histology, while biochemical indices are commonly quantified to characterize stage-associated changes (Figure 1c) [6]. In Scylla paramamosain, ovarian development is commonly classified into five stages based on external appearance and oocyte histology, progressing from transparent/translucent immature ovaries (Stage I) to opalescent ovaries (Stage II) and yellow vitellogenic ovaries (Stages III–IV), culminating in maximally enlarged mature ovaries that may cover the hepatopancreas (Stage V). These limitations motivate non-destructive alternatives that allow repeated assessment of live animals to support broodstock selection, feeding adjustment, and harvest scheduling in mud crab aquaculture.
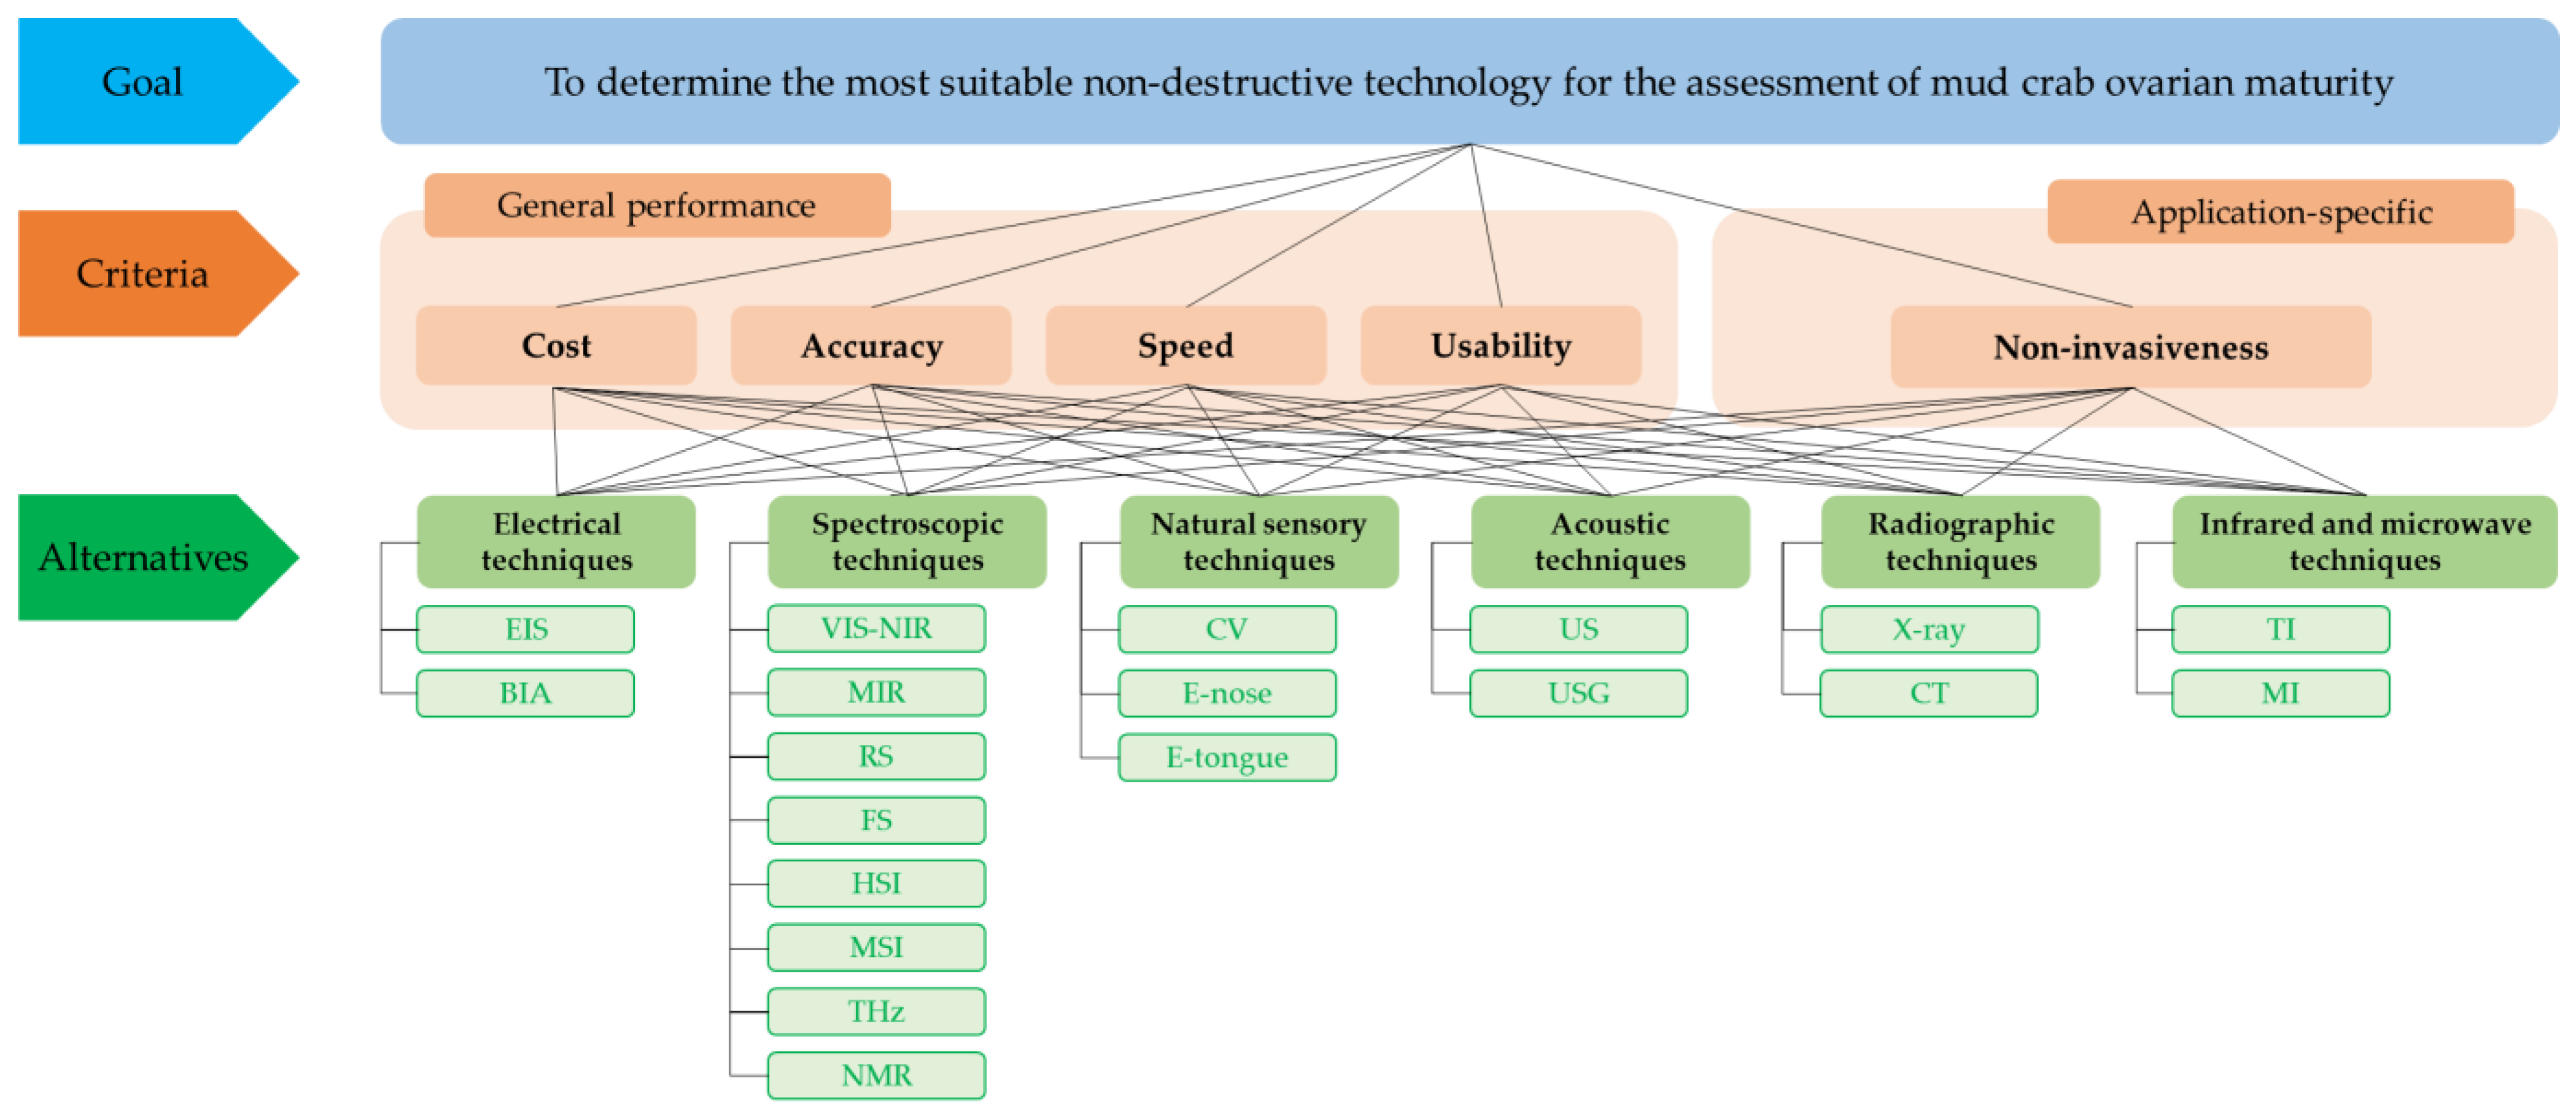
Based on the evaluation criteria established in Section 3.1 and the AHP procedure detailed in Section 3.2, 19 candidate technologies were assessed using five criteria: cost, accuracy, speed, usability, and non-invasiveness. The remaining application-specific criteria (e.g., scalability, portability, integration feasibility, and environmental impact) were treated as context-dependent implementation considerations and were therefore not incorporated into the AHP matrices for this case. In contrast, non-invasiveness is a non-negotiable requirement for ovarian maturation staging in live mud crabs and was retained as the decision-critical application-specific criterion. Expert judgments were elicited via pairwise comparisons using Saaty’s 1–9 scale, from which local and global priority weights were derived. Consistency ratios were calculated, and only matrices with CR < 0.1 were retained for the final analysis. The AHP hierarchy is shown in Figure 10, comprising three levels: (1) the overarching goal of selecting the most appropriate technology, (2) the evaluation criteria, and (3) the candidate technology alternatives.
The use of AHP in this case study is consistent with its broader adoption in aquaculture decision support, where it has been applied to prioritize management options and technology choices under multiple, often competing criteria [21,89,90,91,92]. As shown in Figure 10, the AHP hierarchy in this study comprises the decision goal, evaluation criteria, and candidate non-destructive technologies (alternatives). Extending AHP to non-destructive ovarian maturation assessment highlights its value for transparent, evidence-based selection of practical tools for real-world aquaculture operations. In this application, the criteria were selected to balance measurement performance and farm-level feasibility. Accuracy reflects the reliability of maturity classification for breeding, feeding, and harvest decisions, whereas non-invasiveness captures the ability to assess internal development without harming or stressing valuable broodstock. Cost, speed, and usability represent implementation constraints that influence whether a method can be adopted in routine farm workflows.
Pairwise comparisons (aij) between criteria were performed to construct the judgment matrix (Table 4) using Equation (1). The normalized matrices (Nij) and local priority weights (WCi) were derived (Table 5) using Equations (2) and (3). The results indicate that accuracy was assigned the highest priority (WCi = 0.416), reflecting its critical role in precise classification of maturation stages. Non-invasiveness followed (WCi = 0.224), highlighting industry emphasis on animal welfare and repeatable, damage-free assessments. Usability ranked third (WCi = 0.197), indicating that technologies must integrate smoothly into farm operations and be operable by staff with minimal difficulty. Because maturity staging informs broodstock selection and conditioning, misclassification may lead to inappropriate broodstock choice and suboptimal conditioning (including diet-related management), thereby reducing reproductive performance and increasing production risk and costs [93,94]. Speed was valued but ranked lower (WCi = 0.108), suggesting tolerance for slower methods if they significantly improve accuracy or animal safety. Finally, cost was given the lowest priority (WCi = 0.055). This suggests that experts favor more effective solutions even at higher financial cost, particularly for critical tasks such as breeding stock selection. This preference structure suggests that sustainability and decision accuracy take precedence over short-term cost savings in high-stakes aquaculture operations. The CR of the criteria pairwise comparison matrix was calculated using Equations (4)–(8) and yielded a value of 0.076, which is below the acceptable threshold of 0.1. This confirms acceptable consistency in the expert judgments and supports the use of the derived criterion local priority weights (WCi) for subsequent analysis.
Expert pairwise comparison matrices (Table 6, Table 7, Table 8, Table 9 and Table 10) were developed to evaluate the relative performance of each technology under the five criteria. These matrices captured consistent trade-offs based on domain knowledge and practical aquaculture considerations. For example, in Table 4, a value of 3 in the (Speed, Cost) cell indicates that experts moderately preferred faster assessments over cheaper ones, highlighting that timely results are often worth a reasonable cost increase. Conversely, the reciprocal value of 1/3 in the (Cost, Speed) cell signifies that cost is correspondingly less important than speed. Under the cost criterion (Table 6), computer vision (CV) scored 5 against nuclear magnetic resonance (NMR), reflecting a strong preference due to CV’s lower equipment and operational costs; conversely, the reciprocal 1/5 for NMR denotes its higher expense. In contrast, Table 7 (accuracy) shows that NMR was moderately preferred over CV with a value of 3, highlighting its enhanced ability to detect internal anatomical structures, whereas CV was scored 1/3 in return, reflecting its relatively lower accuracy in such assessments. Similar trends were observed in the speed (Table 8) and usability (Table 9) matrices, where CV was consistently rated more favorably than NMR in both speed and usability (value = 9), due to its rapid processing capabilities and ease of implementation within routine farm operations. Under the non-invasiveness criterion (Table 10), CV was moderately preferred over NMR with a score of 3, reflecting its ability to assess specimens externally without physical contact. In contrast, NMR received a reciprocal score of 1/3, indicating lower non-invasiveness due to requirements such as immobilization, prolonged scanning, or sedation. These explicit judgments reflect a consistent preference for practical, fast, and animal-friendly technologies like CV over more technically advanced but less feasible alternatives such as NMR in the context of mud crab ovarian maturity assessment.
Normalized pairwise comparison matrices (Nij) for each technology under the five criteria were computed according to Equation (2). As the normalization procedure is identical across criteria and is illustrated in Table 5, the remaining normalized matrices are omitted for brevity. The local priority weights (WAij) for alternatives under each criterion were derived from Equation (3) (Table 11), followed by CR checks to validate expert judgments. As presented in Table 12, all CR values were below the threshold of 0.1, indicating acceptable consistency across all matrices. Based on these validated weights, we calculated the global priority weight (GAj) for each technology. This was achieved by multiplying each alternative’s local priority weight under each criterion by the corresponding criterion weight and summing cross criteria (Equation (9)). The resulting global priority weights and ranking are presented in Table 13.
As shown in Table 13, CV (natural sensory; GAj = 0.076) ranked first, followed by NMR (spectroscopic; GAj = 0.073) and CT (radiographic; GAj = 0.070). VIS-NIR and HSI (both spectroscopic; GAj = 0.061) were tied for fourth. The upper mid-tier comprised US (acoustic) and E-nose (natural sensory) (GAj = 0.056; ranks 6–7) and FS (spectroscopic; GAj = 0.055; rank 8), followed by X-ray (radiographic) and BIA (electrical) (GAj = 0.050; ranks 9–10) and RS (spectroscopic) and TI (infrared and microwave) (GAj = 0.049; ranks 11–12). Lower-scoring options included EIS (electrical) and MSI/MIR (both spectroscopic) (GAj = 0.045–0.048; ranks 13–15), THz (spectroscopic; GAj = 0.040; rank 16), USG (acoustic) and E-tongue (natural sensory) (GAj = 0.039; ranks 17–18), and MI (infrared and microwave; GAj = 0.039; rank 19). Ranks were computed from full-precision GAj values; ties share rank (competition ranking). Technology categories (e.g., natural sensory, spectroscopic, radiographic) were used solely for description and were not included in the AHP evaluation criteria (cost, accuracy, speed, usability, and non-invasiveness). Accordingly, the cross-category distribution of ranks across all 19 alternatives reflects complementary criterion-level strengths rather than any category effect; the mixed top-five composition is a direct consequence.
For the top-five techniques (CV, NMR, CT, VIS-NIR, and HSI), the small numerical differences reflect distinct criterion trade-offs. CV achieved the highest scores for cost, speed, usability, and non-invasiveness, while maintaining acceptable accuracy, making it the most balanced option for mud crab ovarian maturity assessment. Although CV may not match the precision of laboratory-grade instruments for internal structure imaging, it does offer sufficient accuracy for practical purposes. This accuracy can be further enhanced through calibration or machine learning. Moreover, CV excels in deployability [70]. NMR and CT, although exhibiting very high accuracy scores, ranked poorly in cost, speed, usability, and non-invasiveness due to their operational complexity, high expense, immobility, and limited compatibility with live specimen evaluation. These methods often require sedation or immobilization and may introduce stress or harm to the crabs. Their application is generally limited to research settings and controlled environments, making them impractical for routine aquaculture operations [8,73]. HSI and VIS-NIR spectroscopy were also among the top five technologies. HSI ranked highest in accuracy due to its ability to extract rich spectral information but was penalized in cost, speed, and usability due to its technical complexity and computational demands [95]. VIS-NIR offered a favorable balance across all criteria, benefiting from simplified hardware and faster processing by focusing on key wavelengths. It is widely recognized as a targeted, cost-effective alternative to full-spectrum HSI [13,31,96].
Beyond the top five, US (acoustic) showed a moderately strong performance. It is non-invasive and allows for the assessment of internal tissue characteristics through acoustic signal analysis, but scored lower in usability due to setup requirements and operator dependency [55]. Electrical techniques, such as BIA and EIS, were rated favorably in cost and speed but had reduced accuracy. In species with scales or exoskeletons, inconsistent electrode contact can degrade measurement reliability; surface preparation or electrode penetration may be required [97]. Middle-ranked technologies such as FS, MSI, and RS displayed application-specific strengths but were constrained by trade-offs in one or more criteria. For example, FS is suitable for detecting certain biochemical markers but is limited in structural analysis [36], while MSI often allows faster processing than HSI due to reduced data volume, it captures fewer spectral details, yielding lower spectral resolution [39].
The AHP results highlight the multidimensional nature of aquaculture decision-making, where no single technology exceeds across all performance indicators. While high-accuracy techniques like NMR and CT ranked near the top, their operational complexity, cost, and lack of non-invasiveness constrained their overall suitability. By contrast, CV consistently scored highly across cost, speed, usability, and animal-friendliness, making it the most balanced and deployable solution. These findings reflect aquaculture’s real-world priorities, where technologies offering fit-for-purpose accuracy combined with efficiency and integration feasibility are favored over gold-standard laboratory instruments. This aligns with the growing adoption of machine vision systems in aquaculture tasks such as grading, sorting, and quality assurance [48]. Given CV’s top ranking, it is worth examining its practical implementation and feasibility in mud crab maturity assessment, which we address next.

4.2. Implications and Feasibility of Implementing Non-Destructive Technologies for Crab Maturity

The identification of CV as the top-ranked non-destructive technology for mud crab ovarian maturity assessment highlights its strong alignment with practical aquaculture needs. CV systems, typically composed of digital cameras and image analysis algorithms, can capture external morphological cues such as abdominal swelling, pleopodal changes, or color shifts associated with ovarian development. These features can be detected non-invasively, enabling repeated monitoring of live broodstock without sacrificing reproductive value. The widespread availability of imaging devices and computing hardware makes CV a cost-effective option, particularly for small and medium-scale farms. This observation is supported by prior research demonstrating successful use of computer vision for quality grading in aquaculture and food processing [46,98,99]. Furthermore, the speed of image capture and automated processing supports real-time screening, which is especially advantageous during intensive breeding cycles. Compared to high-precision instruments such as NMR and CT, CV may offer slightly lower accuracy but provides a more deployable and sustainable alternative for routine use.
Several technical and operational factors must be addressed for CV to perform reliably in practice. Image quality is a key determinant of accuracy; reflections, moisture, and inconsistent lighting can obscure relevant features. Standardizing the imaging environment using neutral backgrounds, uniform lighting, and enclosures to diffuse glare has proven effective in similar applications [46,100]. Live crab behavior also poses challenges, as individuals may not remain still or in optimal orientation; brief gentle restraint or positioning devices may be required to reliably capture the ventral and abdominal areas where maturity cues manifest. Algorithm selection is equally important, while basic image processing may enable coarse classification, subtle indicators of ovarian development demand more sophisticated approaches. Deep learning techniques, such as convolutional neural networks (CNNs), have demonstrated high accuracy in aquatic species identification and quality analysis [47,101], and they could be trained using curated datasets of annotated crab images matched with known maturity stages. User interfaces must also be intuitive, with automated classification outputs to support adoption by non-specialist farm personnel.
Despite these advantages, pilot testing remains essential before widescale deployment. A validation study comparing CV predictions with dissection-based maturity assessments under farm conditions would reveal potential limitations related to lighting variability, carapace opacity, or shell patterns that confound visual cues. If results confirm high accuracy and user-friendliness, CV systems could be rapidly adopted and integrated into hatchery workflows. In the long term, these systems may enable data-driven broodstock management, reducing animal losses, improving spawning efficiency, and facilitating longitudinal reproductive tracking. The transition from destructive to non-invasive assessment would also support ethical standards and sustainability certifications. In summary, CV’s success lies in its balance between sufficient precision and strong practicality, making it a promising tool for enhancing reproductive monitoring and decision-making in crab aquaculture.

5. Conclusions and Future Prospects

Non-destructive technologies are increasingly essential in aquaculture for objective, rapid, and welfare-compliant quality assessment relative to destructive gold standards. This study synthesized six technology categories—electrical, spectroscopic, natural sensory, acoustic, radiographic, and infrared and microwave—and formalized their comparison using an AHP-based selection framework. The evaluation incorporates general performance criteria (cost, accuracy, speed, usability) and application-specific criteria (scalability, portability, integration feasibility, environmental impact, non-invasiveness), addressing heterogeneous evidence across species and settings. In a case study on ovarian maturation stage classification in live mud crabs, the AHP assessment of 19 candidate techniques against the criteria of cost, accuracy, speed, usability, and non-invasiveness, identified CV as the most deployable option, balancing throughput, operational simplicity, cost, and animal welfare. By contrast, NMR and CT, despite superior analytical accuracy, were constrained by cost, complexity, and invasiveness. A practical implication is the need to standardize cross-site measurement protocols across modalities: acquisition parameters, calibration and quality control routines, and reference standard labeling. This standardization enables reproducible comparisons and scalable deployment. Overall, this pipeline from systematic review to an AHP-based selection framework to a case study provides a transparent, evidence-based foundation for routine technology selection in aquaculture and underscores that adoption should prioritize operational feasibility and welfare alongside accuracy.
Building on the review–AHP–case study pipeline, future work will integrate evidence synthesis with farm-level validation to iteratively refine criterion definitions, weights, technology rankings, and deployment guidance using real-world data. Key priorities are to (1) develop a species–task library of application-specific criteria with operational definitions and a standardized reporting checklist; (2) periodically update the AHP hierarchy and pairwise comparison matrices through structured evidence synthesis and expert elicitation with documented provenance and consistency checks; and (3) conduct prospective, multi-site field studies to update empirical performance data for alternatives, recompute rankings, and perform sensitivity analyses. With clear documentation and regular updates as new evidence becomes available, the proposed framework can be extended to other aquaculture species (e.g., shrimp, finfish, and mollusks) and quality targets (e.g., maturity, size, and post-harvest freshness). To broaden sector coverage beyond the mud crab case, a finfish case application will be added to select the most suitable non-destructive method for post-harvest freshness evaluation; candidate techniques (e.g., EIS, HSI, CV, US, X-ray imaging, and TI) will be compared under the shared general performance criteria (cost, accuracy, speed, usability), with line deployment constraints captured through an application-specific criterion (e.g., integration feasibility for in-line implementation). Comparing the mud crab and finfish cases will show how criterion weights and preferred technologies change across species and deployment settings (e.g., live animal assessment vs. post-harvest in-line grading), strengthening the framework’s generalizability across aquaculture.

Author Contributions

Conceptualization, methodology, software, formal analysis, investigation, data curation, writing—original draft preparation, visualization, G.H.; resources, supervision, project administration, funding acquisition, K.T. and S.C.; validation, writing—review and editing, G.H., K.T., and S.C. All authors have read and agreed to the published version of the manuscript.

Funding

This research was funded by the National Science, Research and Innovation Fund (NSRF) and Prince of Songkla University (Grant No. ENG67012405). The APC was funded by G.H. (personal funds).

Institutional Review Board Statement

Ethical review and approval were waived for this study because it is a review and methodological synthesis that involved only non-sensitive professional opinions collected without personal identifiers and did not include any experiments on humans or animals.

Data Availability Statement

No new data were created or analyzed in this study. Data sharing is not applicable to this article.

Acknowledgments

During the preparation of this manuscript, the authors used OpenAI ChatGPT (GPT-5.2; accessed December 2025) to generate schematic icons for figures and used Microsoft PowerPoint (Microsoft Office Home and Student 2021) to assemble and edit the figures. The authors have reviewed and edited the output and take full responsibility for the content of this publication. The authors gratefully acknowledge the Songkhla Coastal Aquaculture Research and Development Center for their valuable support in the assessment of mud crab ovarian development.

Conflicts of Interest

The authors declare no conflicts of interest.

References

  1. Hassoun, A.; Karoui, R. Quality Evaluation of Fish and Other Seafood by Traditional and Nondestructive Instrumental Methods: Advantages and Limitations. Crit. Rev. Food Sci. Nutr. 2017, 57, 1976–1998. [Google Scholar] [CrossRef] [Scilit]
  2. FAO. The State of World Fisheries and Aquaculture 2020—Sustainability in Action; FAO: Rome, Italy, 2020; ISBN 978-92-5-132692-3. [Google Scholar]
  3. FAO. The State of World Fisheries and Aquaculture 2024—Blue Transformation in Action; FAO: Rome, Italy, 2024; ISBN 978-92-5-138763-4. [Google Scholar]
  4. Huang, Y.-Z.; Liu, Y.; Jin, Z.; Cheng, Q.; Qian, M.; Zhu, B.-W.; Dong, X.-P. Sensory Evaluation of Fresh/Frozen Mackerel Products: A Review. Compr. Rev. Food Sci. Food Saf. 2021, 20, 3504–3530. [Google Scholar] [CrossRef] [Scilit]
  5. Dridi, S.; Romdhane, M.S.; Elcafsi, M. Seasonal Variation in Weight and Biochemical Composition of the Pacific Oyster, Crassostrea gigas in Relation to the Gametogenic Cycle and Environmental Conditions of the Bizert Lagoon, Tunisia. Aquaculture 2007, 263, 238–248. [Google Scholar] [CrossRef] [Scilit]
  6. Chen, B.; Zheng, J.; Chen, C.; Wu, K.; Lin, F.; Ning, L.; Rong, H.; Chen, C.; Xiao, F.; Zhang, H.; et al. Differences in Lipid Accumulation and Mobilization in the Hepatopancreas and Ovary of Female Mud Crab (Scylla paramamosain, Estampador, 1949) During Ovarian Development. Aquaculture 2023, 564, 739046. [Google Scholar] [CrossRef] [Scilit]
  7. Bureau du Colombier, S.; Jacobs, L.; Gesset, C.; Elie, P.; Lambert, P. Ultrasonography as a Non-Invasive Tool for Sex Determination and Maturation Monitoring in Silver Eels. Fish. Res. 2015, 164, 50–58. [Google Scholar] [CrossRef] [Scilit]
  8. Ceballos-Francisco, D.; García-Carrillo, N.; Cuesta, A.; Esteban, M.Á. Radiological Characterization of Gilthead Seabream (Sparus aurata) Fat by X-Ray Micro-Computed Tomography. Sci. Rep. 2020, 10, 10527. [Google Scholar] [CrossRef] [Scilit]
  9. Urazoe, K.; Kuroki, N.; Maenaka, A.; Tsutsumi, H.; Iwabuchi, M.; Fuchuya, K.; Hirose, T.; Numa, M. Automated Fish Bone Detection in X-Ray Images with Convolutional Neural Network and Synthetic Image Generation. IEEJ Trans. Electr. Electron. Eng. 2021, 16, 1510–1517. [Google Scholar] [CrossRef] [Scilit]
  10. Meng, Z.; Wu, Z.; Gray, J. Microwave Sensor Technologies for Food Evaluation and Analysis: Methods, Challenges and Solutions. Trans. Inst. Meas. Control 2018, 40, 3433–3448. [Google Scholar] [CrossRef] [Scilit]
  11. Ding, N.; Dong, S.; Zhang, Y.; Lu, D.; Lin, J.; Zhao, Q.; Shi, X. Portable Silver-Doped Prussian Blue Nanoparticle Hydrogels for Colorimetric and Photothermal Monitoring of Shrimp and Fish Freshness. Sens. Actuators B Chem. 2022, 363, 131811. [Google Scholar] [CrossRef] [Scilit]
  12. Wang, B.; Liu, K.; Wei, G.; He, A.; Kong, W.; Zhang, X. A Review of Advanced Sensor Technologies for Aquatic Products Freshness Assessment in Cold Chain Logistics. Biosensors 2024, 14, 468. [Google Scholar] [CrossRef] [Scilit]
  13. Wold, J.P.; Kermit, M.; Woll, A. Rapid Nondestructive Determination of Edible Meat Content in Crabs (Cancer pagurus) by Near-Infrared Imaging Spectroscopy. Appl. Spectrosc. 2010, 64, 691–699. [Google Scholar] [CrossRef] [Scilit]
  14. Devi, K.; Yadav, S.P. A Multicriteria Intuitionistic Fuzzy Group Decision Making for Plant Location Selection with ELECTRE Method. Int. J. Adv. Manuf. Technol. 2013, 66, 1219–1229. [Google Scholar] [CrossRef] [Scilit]
  15. Sriprateep, K.; Pitakaso, R.; Khonjun, S.; Luesak, P.; Jutagate, A.; Kaewta, C.; Srichok, T.; Kosacka-Olejnik, M.; Matitopanum, S. Optimizing Nile Tilapia Growth and Production Costs in Earthen Ponds Using Multi-Objective Adaptive Artificial Intelligence Systems. Aquac. Rep. 2025, 41, 102716. [Google Scholar] [CrossRef] [Scilit]
  16. Rahbar, M.; Safari, R.; Perez-Rostro, C.I. Defining Breeding Objectives and Estimation Economic Values of Traits for Persian Sturgeon (Acipenser persicus). Aquac. Rep. 2024, 39, 102404. [Google Scholar] [CrossRef] [Scilit]
  17. Quéméner, L.; Suquet, M.; Mero, D.; Gaignon, J.-L. Selection Method of New Candidates for Finfish Aquaculture: The Case of the French Atlantic, the Channel and the North Sea Coasts. Aquat. Living Resour. 2002, 15, 293–302. [Google Scholar] [CrossRef] [Scilit]
  18. Sadeghzadeh, K.; Salehi, M.B. Mathematical Analysis of Fuel Cell Strategic Technologies Development Solutions in the Automotive Industry by the TOPSIS Multi-Criteria Decision Making Method. Int. J. Hydrogen Energy 2011, 36, 13272–13280. [Google Scholar] [CrossRef] [Scilit]
  19. Saaty, T.L. The Analytic Hierarchy Process: Planning, Priority Setting, Resource Allocation; McGraw-Hill International Book Company: New York, NY, USA; London, UK, 1980; ISBN 978-0-07-054371-3. [Google Scholar]
  20. Sae-Lim, P.; Komen, H.; Kause, A.; van Arendonk, J.A.M.; Barfoot, A.J.; Martin, K.E.; Parsons, J.E. Defining Desired Genetic Gains for Rainbow Trout Breeding Objective Using Analytic Hierarchy Process. J. Anim. Sci. 2012, 90, 1766–1776. [Google Scholar] [CrossRef] [Scilit]
  21. Zulkarnain, R.; Adiyana, K.; Waryanto; Nugroho, H.; Nugraha, B.; Thesiana, L.; Supriyono, E. Selection of Intensive Shrimp Farming Technology for Small Farmers with Analytical Hierarchy Process: A Case for Whiteleg Shrimp (Litopenaeus vannamei). IOP Conf. Ser. Earth Environ. Sci. 2020, 404, 012017. [Google Scholar] [CrossRef] [Scilit]
  22. Carbajal-Hernández, J.J.; Sánchez-Fernández, L.P.; Villa-Vargas, L.A.; Carrasco-Ochoa, J.A.; Martínez-Trinidad, J.F. Water Quality Assessment in Shrimp Culture Using an Analytical Hierarchical Process. Ecol. Indic. 2013, 29, 148–158. [Google Scholar] [CrossRef] [Scilit]
  23. Grossi, M.; Riccò, B. Electrical Impedance Spectroscopy (EIS) for Biological Analysis and Food Characterization: A Review. J. Sens. Sens. Syst. 2017, 6, 303–325. [Google Scholar] [CrossRef] [Scilit]
  24. Vue, S.; Samways, K.M.; Cunjak, R.A. Bioelectrical Impedance Analysis to Estimate Lipid Content in Atlantic Salmon Parr as Influenced by Temperature, PIT Tags, and Instrument Precision and Application in Field Studies. Trans. Am. Fish. Soc. 2015, 144, 235–245. [Google Scholar] [CrossRef] [Scilit]
  25. Zavadlav, S.; Janči, T.; Lacković, I.; Karlović, S.; Rogulj, I.; Vidaček, S. Assessment of Storage Shelf Life of European Squid (Cephalopod: Loliginidae, Loligo vulgaris) by Bioelectrical Impedance Measurements. J. Food Eng. 2016, 184, 44–52. [Google Scholar] [CrossRef] [Scilit]
  26. Marshall, D.L.; Wiese-Lehigh, P.L. Comparison of Impedance, Microbial, Sensory, and pH Methods to Determine Shrimp Quality. J. Aquat. Food Prod. Technol. 1997, 6, 17–31. [Google Scholar] [CrossRef] [Scilit]
  27. Sun, J.; Zhang, R.; Zhang, Y.; Liang, Q.; Zhang, F.; Xu, P.; Li, G. Evaluation of Fish Freshness Using Impedance Spectroscopy Based on the Characteristic Parameter of Orthogonal Direction Difference. J. Sci. Food Agric. 2020, 100, 4124–4131. [Google Scholar] [CrossRef] [Scilit]
  28. Yuan, P.; Wang, Y.; Miyazaki, R.; Liang, J.; Hirasaka, K.; Tachibana, K.; Taniyama, S. A Convenient and Nondestructive Method Using Bio-Impedance Analysis to Determine Fish Freshness During Ice Storage. Fish. Sci. 2018, 84, 1099–1108. [Google Scholar] [CrossRef] [Scilit]
  29. Ruiz-Vargas, A.; Ivorra, A.; Arkwright, J.W. Design, Construction and Validation of an Electrical Impedance Probe with Contact Force and Temperature Sensors Suitable for In-Vivo Measurements. Sci. Rep. 2018, 8, 14818. [Google Scholar] [CrossRef] [Scilit]
  30. Chaudhary, V.; Kajla, P.; Dewan, A.; Pandiselvam, R.; Socol, C.T.; Maerescu, C.M. Spectroscopic Techniques for Authentication of Animal Origin Foods. Front. Nutr. 2022, 9. [Google Scholar] [CrossRef] [Scilit] [PubMed]
  31. Reis, M.M.; Martínez, E.; Saitua, E.; Rodríguez, R.; Pérez, I.; Olabarrieta, I. Non-Invasive Differentiation between Fresh and Frozen/Thawed Tuna Fillets Using Near Infrared Spectroscopy (VIS-NIRS). LWT 2017, 78, 129–137. [Google Scholar] [CrossRef] [Scilit]
  32. Hernández-Martínez, M.; Gallardo-Velázquez, T.; Osorio-Revilla, G.; Almaraz-Abarca, N.; Ponce-Mendoza, A.; Vásquez-Murrieta, M.S. Prediction of Total Fat, Fatty Acid Composition and Nutritional Parameters in Fish Fillets Using MID-FTIR Spectroscopy and Chemometrics. LWT Food Sci. Technol. 2013, 52, 12–20. [Google Scholar] [CrossRef] [Scilit]
  33. Chen, Z.; Wu, T.; Xiang, C.; Xu, X.; Tian, X. Rapid Identification of Rainbow Trout Adulteration in Atlantic Salmon by Raman Spectroscopy Combined with Machine Learning. Molecules 2019, 24, 2851. [Google Scholar] [CrossRef] [Scilit]
  34. Ya-nan, S.U.I.; Lei-lei, Z.; Shi-yang, L.U.; De-hong, Y.; Cheng, Z.H.U. Research on the Shrimp Quality of Different Storage Conditions Based on Raman Spectroscopy and Prediction Model. Spectrosc. Spectr. Anal. 2020, 40, 1607. [Google Scholar]
  35. Liu, Z.; Yang, Y.; Huang, M.; Zhu, Q. Spatially Offset Raman Spectroscopy Combined with Attention-Based LSTM for Freshness Evaluation of Shrimp. Sensors 2023, 23, 2827. [Google Scholar] [CrossRef] [Scilit] [PubMed]
  36. Rahman, M.M.; Bui, M.V.; Shibata, M.; Nakazawa, N.; Rithu, M.N.A.; Yamashita, H.; Sadayasu, K.; Tsuchiyama, K.; Nakauchi, S.; Hagiwara, T.; et al. Rapid Noninvasive Monitoring of Freshness Variation in Frozen Shrimp Using Multidimensional Fluorescence Imaging Coupled with Chemometrics. Talanta 2021, 224, 121871. [Google Scholar] [CrossRef] [Scilit]
  37. Cheng, J.-H.; Sun, D.-W.; Zeng, X.-A.; Pu, H.-B. Non-Destructive and Rapid Determination of TVB-N Content for Freshness Evaluation of Grass Carp (Ctenopharyngodon idella) by Hyperspectral Imaging. Innov. Food Sci. Emerg. Technol. 2014, 21, 179–187. [Google Scholar] [CrossRef] [Scilit]
  38. Fengou, L.-C.; Lianou, A.; Tsakanikas, P.; Gkana, E.N.; Panagou, E.Z.; Nychas, G.-J.E. Evaluation of Fourier Transform Infrared Spectroscopy and Multispectral Imaging as Means of Estimating the Microbiological Spoilage of Farmed Sea Bream. Food Microbiol. 2019, 79, 27–34. [Google Scholar] [CrossRef] [Scilit]
  39. Monteiro, F.; Bexiga, V.; Chaves, P.; Godinho, J.; Henriques, D.; Melo-Pinto, P.; Nunes, T.; Piedade, F.; Pimenta, N.; Sustelo, L.; et al. Classification of Fish Species Using Multispectral Data from a Low-Cost Camera and Machine Learning. Remote Sens. 2023, 15, 3952. [Google Scholar] [CrossRef] [Scilit]
  40. Zhang, N.; Lim, S.J.; Toh, J.M.; Wei, Y.F.; Rusli; Ke, L. Investigation of Spoilage in Salmon by Electrochemical Impedance Spectroscopy and Time-Domain Terahertz Spectroscopy. ChemPhysMater 2022, 1, 148–154. [Google Scholar] [CrossRef] [Scilit]
  41. Cai, H.; Lin, L.; Ding, S.; Cui, X.; Chen, Z. Fast Quantification of Fatty Acid Profile of Intact Fish by Intermolecular Double-Quantum Coherence 1H-NMR Spectroscopy. Eur. J. Lipid Sci. Technol. 2016, 118, 1150–1159. [Google Scholar] [CrossRef] [Scilit]
  42. Medeiros, E.C.; Almeida, L.M.; Filho, J.G.d.A.T. Computer Vision and Machine Learning for Tuna and Salmon Meat Classification. Informatics 2021, 8, 672. [Google Scholar] [CrossRef] [Scilit]
  43. Han, F.; Huang, X.; Teye, E.; Gu, F.; Gu, H. Nondestructive Detection of Fish Freshness During Its Preservation by Combining Electronic Nose and Electronic Tongue Techniques in Conjunction with Chemometric Analysis. Anal. Methods 2013, 6, 529–536. [Google Scholar] [CrossRef] [Scilit]
  44. Di Rosa, A.R.; Leone, F.; Cheli, F.; Chiofalo, V. Fusion of Electronic Nose, Electronic Tongue and Computer Vision for Animal Source Food Authentication and Quality Assessment—A Review. J. Food Eng. 2017, 210, 62–75. [Google Scholar] [CrossRef] [Scilit]
  45. Munekata, P.E.S.; Finardi, S.; de Souza, C.K.; Meinert, C.; Pateiro, M.; Hoffmann, T.G.; Domínguez, R.; Bertoli, S.L.; Kumar, M.; Lorenzo, J.M. Applications of Electronic Nose, Electronic Eye and Electronic Tongue in Quality, Safety and Shelf Life of Meat and Meat Products: A Review. Sensors 2023, 23, 672. [Google Scholar] [CrossRef] [Scilit]
  46. Taheri-Garavand, A.; Fatahi, S.; Banan, A.; Makino, Y. Real-Time Nondestructive Monitoring of Common Carp Fish Freshness Using Robust Vision-Based Intelligent Modeling Approaches. Comput. Electron. Agric. 2019, 159, 16–27. [Google Scholar] [CrossRef] [Scilit]
  47. Hu, J.; Zhou, C.; Zhao, D.; Zhang, L.; Yang, G.; Chen, W. A Rapid, Low-Cost Deep Learning System to Classify Squid Species and Evaluate Freshness Based on Digital Images. Fish. Res. 2020, 221, 105376. [Google Scholar] [CrossRef] [Scilit]
  48. Wang, H.; Zhu, H.; Bi, L.; Xu, W.; Song, N.; Zhou, Z.; Ding, L.; Xiao, M. Quality Grading of River Crabs Based on Machine Vision and GA-BPNN. Sensors 2023, 23, 5317. [Google Scholar] [CrossRef] [Scilit]
  49. Zhao, F.; Hao, J.; Zhang, H.; Yu, X.; Yan, Z.; Wu, F. Quality Recognition Method of Oyster Based on U-Net and Random Forest. J. Food Compos. Anal. 2024, 125, 105746. [Google Scholar] [CrossRef] [Scilit]
  50. Lee, D.; Kim, S.; Park, M.; Yang, Y. Weight Estimation of the Sea Cucumber (Stichopus japonicas) Using Vision-Based Volume Measurement. J. Electr. Eng. Technol. 2014, 9, 2154–2161. [Google Scholar] [CrossRef] [Scilit]
  51. Wijaya, D.R.; Syarwan, N.F.; Nugraha, M.A.; Ananda, D.; Fahrudin, T.; Handayani, R. Seafood Quality Detection Using Electronic Nose and Machine Learning Algorithms with Hyperparameter Optimization. IEEE Access 2023, 11, 62484–62495. [Google Scholar] [CrossRef] [Scilit]
  52. Kiselev, I.; Sysoev, V.; Kaikov, I.; Koronczi, I.; Adil Akai Tegin, R.; Smanalieva, J.; Sommer, M.; Ilicali, C.; Hauptmannl, M. On the Temporal Stability of Analyte Recognition with an E-Nose Based on a Metal Oxide Sensor Array in Practical Applications. Sensors 2018, 18, 550. [Google Scholar] [CrossRef] [Scilit] [PubMed]
  53. Apetrei, I.M.; Rodriguez-Mendez, M.L.; Apetrei, C.; de Saja, J.A. Fish Freshness Monitoring Using an E-Tongue Based on Polypyrrole Modified Screen-Printed Electrodes. IEEE Sens. J. 2013, 13, 2548–2554. [Google Scholar] [CrossRef] [Scilit]
  54. Wadehra, A.; Patil, P.S. Application of Electronic Tongues in Food Processing. Anal. Methods 2016, 8, 474–480. [Google Scholar] [CrossRef] [Scilit]
  55. Tokunaga, K.; Saeki, C.; Taniguchi, S.; Nakano, S.; Ohta, H.; Nakamura, M. Nondestructive Evaluation of Fish Meat Using Ultrasound Signals and Machine Learning Methods. Aquac. Eng. 2020, 89, 102052. [Google Scholar] [CrossRef] [Scilit]
  56. Goto, K. A Nondestructive Freshness Evaluation for Frozen Tuna. Available online: https://sj.jst.go.jp/news/202302/n0202-01k.html (accessed on 15 December 2025).
  57. Sireesha, T.; Gowda, N.A.N.; Kambhampati, V. Ultrasonication in Seafood Processing and Preservation: A Comprehensive Review. Appl. Food Res. 2022, 2, 100208. [Google Scholar] [CrossRef] [Scilit]
  58. Ceballos-Francisco, D.; García-Carrillo, N.; Cuesta, A.; Esteban, M.Á. Ultrasonography Study of the Skin Wound Healing Process in Gilthead Seabream (Sparus aurata). J. Fish Dis. 2021, 44, 1091–1100. [Google Scholar] [CrossRef] [Scilit]
  59. Silva, S.R.; Guedes, C.M.; Rema, P.; Batista, A.C.; Rodrigues, V.; Loureiro, N.; Dias, J. In Vivo Assessment of Fat Composition in Senegalese Sole (Solea senegalensis) by Real-Time Ultrasonography and Image Analysis of Subcutaneous Fat. Aquaculture 2016, 456, 76–82. [Google Scholar] [CrossRef] [Scilit]
  60. Wolf, P.H.; Elliott, C.W.; Tufts, B.L. Ultrasonographic Sex Identification of Largemouth Bass and Smallmouth Bass. North Am. J. Fish. Manag. 2025, 45, 470–481. [Google Scholar] [CrossRef] [Scilit]
  61. Roberts, A.A.; Guimarães, D.; Tehrani, M.W.; Lin, S.; Parsons, P.J. A Field-Based Evaluation of Portable XRF to Screen for Toxic Metals in Seafood Products. X-Ray Spectrom. 2024, 53, 506–519. [Google Scholar] [CrossRef] [Scilit]
  62. Mery, D.; Lillo, I.; Loebel, H.; Riffo, V.; Soto, A.; Cipriano, A.; Aguilera, J.M. Automated Fish Bone Detection Using X-Ray Imaging. J. Food Eng. 2011, 105, 485–492. [Google Scholar] [CrossRef] [Scilit]
  63. Miao, Y.; Wang, R.; Jing, Z.; Wang, K.; Tan, M.; Li, F.; Zhang, W.; Han, J.; Han, Y. CT Image Segmentation of Foxtail Millet Seeds Based on Semantic Segmentation Model VGG16-UNet. Plant Methods 2024, 20, 169. [Google Scholar] [CrossRef] [Scilit]
  64. Boal, T.; Colgan, P.A.; Czarwinski, R. International Basic Safety Standards—Protecting People and the Environment. Radioprotection 2013, 48, S27–S33. [Google Scholar] [CrossRef] [Scilit]
  65. Do, K.-H. General Principles of Radiation Protection in Fields of Diagnostic Medical Exposure. J. Korean Med. Sci. 2016, 31, S6–S9. [Google Scholar] [CrossRef] [Scilit] [PubMed]
  66. Saberioon, M.; Gholizadeh, A.; Cisar, P.; Pautsina, A.; Urban, J. Application of Machine Vision Systems in Aquaculture with Emphasis on Fish: State-of-the-Art and Key Issues. Rev. Aquac. 2017, 9, 369–387. [Google Scholar] [CrossRef] [Scilit]
  67. Vadivambal, R.; Jayas, D.S. Applications of Thermal Imaging in Agriculture and Food Industry—A Review. Food Bioprocess Technol. 2011, 4, 186–199. [Google Scholar] [CrossRef] [Scilit]
  68. Garvin, J.; Abushakra, F.; Choffin, Z.; Shiver, B.; Gan, Y.; Kong, L.; Jeong, N. Microwave Imaging for Watermelon Maturity Determination. Curr. Res. Food Sci. 2023, 6, 100412. [Google Scholar] [CrossRef] [Scilit]
  69. Pastorino, M. Microwave Imaging; John Wiley & Sons: Hoboken, NJ, USA, 2010; ISBN 978-0-470-27800-0. [Google Scholar]
  70. Brosnan, T.; Sun, D.-W. Improving Quality Inspection of Food Products by Computer Vision—A Review. J. Food Eng. 2004, 61, 3–16. [Google Scholar] [CrossRef] [Scilit]
  71. Zhou, J.; Liu, C.; Zhong, Y.; Luo, Z. Applications of Near-Infrared Spectroscopy for Nondestructive Quality Analysis of Fish and Fishery Products. Foods 2024, 13, 3992. [Google Scholar] [CrossRef] [Scilit]
  72. Cheng, J.-H.; Sun, D.-W. Hyperspectral Imaging as an Effective Tool for Quality Analysis and Control of Fish and Other Seafoods: Current Research and Potential Applications. Trends Food Sci. Technol. 2014, 37, 78–91. [Google Scholar] [CrossRef] [Scilit]
  73. Shull, P.J. Nondestructive Evaluation: Theory, Techniques, and Applications; CRC Press: Boca Raton, FL, USA, 2002; ISBN 978-0-429-21339-7. [Google Scholar]
  74. dos Santos, C.A.T.; Lopo, M.; Páscoa, R.N.M.J.; Lopes, J.A. A Review on the Applications of Portable Near-Infrared Spectrometers in the Agro-Food Industry. Appl. Spectrosc. 2013, 67, 1215–1233. [Google Scholar] [CrossRef] [Scilit]
  75. Ghassemi Nejad, J.; Ju, M.-S.; Jo, J.-H.; Oh, K.-H.; Lee, Y.-S.; Lee, S.-D.; Kim, E.-J.; Roh, S.; Lee, H.-G. Advances in Methane Emission Estimation in Livestock: A Review of Data Collection Methods, Model Development and the Role of AI Technologies. Animals 2024, 14, 435. [Google Scholar] [CrossRef] [Scilit] [PubMed]
  76. Coleman, S.; Gelais, A.T.S.; Fredriksson, D.W.; Dewhurst, T.; Brady, D.C. Identifying Scaling Pathways and Research Priorities for Kelp Aquaculture Nurseries Using a Techno-Economic Modeling Approach. Front. Mar. Sci. 2022, 9. [Google Scholar] [CrossRef] [Scilit]
  77. Yakes, B.J.; Ellsworth, Z.; Karunathilaka, S.R.; Crump, E. Evaluation of Portable Sensor and Spectroscopic Devices for Seafood Decomposition Determination. Food Anal. Methods 2021, 14, 2346–2356. [Google Scholar] [CrossRef] [Scilit]
  78. Xu, Y.; Jin, J.; Zeng, S.; Zhang, Y.; Xiao, Q. Development and Evaluation of an IoT-Based Portable Water Quality Monitoring System for Aquaculture. INMATEH Agric. Eng. 2023, 70, 359–368. [Google Scholar] [CrossRef] [Scilit]
  79. Yue, K.; Shen, Y. An Overview of Disruptive Technologies for Aquaculture. Aquac. Fish. 2022, 7, 111–120. [Google Scholar] [CrossRef] [Scilit]
  80. Abed, N.; Murugan, R.; Deldari, A.; Sankarannair, S.; Ramesh, M.V. IoT and AI-Driven Solutions for Human-Wildlife Conflict: Advancing Sustainable Agriculture and Biodiversity Conservation. Smart Agric. Technol. 2025, 10, 100829. [Google Scholar] [CrossRef] [Scilit]
  81. WorldFish. Priority Technologies and National Strategies to Develop and Manage Fisheries and Aquaculture; WorldFish: Penang, Malaysia, 2007; p. 4. Available online: https://hdl.handle.net/20.500.12348/1720 (accessed on 15 December 2025).
  82. Kamruzzaman, M.; Makino, Y.; Oshita, S. Non-Invasive Analytical Technology for the Detection of Contamination, Adulteration, and Authenticity of Meat, Poultry, and Fish: A Review. Anal. Chim. Acta 2015, 853, 19–29. [Google Scholar] [CrossRef] [Scilit]
  83. Zhang, X.; Zhang, W.; Zhang, C.; Zhang, L.; Zhang, Y. A Multi-Indexes and Non-Invasive Fish Health Assessment System with Deep Learning and Impedance Sensing. Aquaculture 2025, 598, 742025. [Google Scholar] [CrossRef] [Scilit]
  84. Sun, J.; Zhang, R.; Zhang, Y.; Li, G.; Liang, Q. Estimating Freshness of Carp Based on EIS Morphological Characteristic. J. Food Eng. 2017, 193, 58–67. [Google Scholar] [CrossRef] [Scilit]
  85. Thanasarn, N.; Chaiprapat, S.; Waiyakan, K.; Thongkaew, K. Automated Discrimination of Deveined Shrimps Based on Grayscale Image Parameters. J. Food Process Eng. 2019, 42, e13041. [Google Scholar] [CrossRef] [Scilit]
  86. Vajdi, M.; Varidi, M.J.; Varidi, M.; Mohebbi, M. Using Electronic Nose to Recognize Fish Spoilage with an Optimum Classifier. J. Food Meas. Charact. 2019, 13, 1205–1217. [Google Scholar] [CrossRef] [Scilit]
  87. Saaty, T.L. How to Make a Decision: The Analytic Hierarchy Process. Eur. J. Oper. Res. 1990, 48, 9–26. [Google Scholar] [CrossRef] [Scilit]
  88. Li, J.; Wang, Q.; Xuan, Y.; Zhou, H. User Demands Analysis of Eco-City Based on the Kano Model—An Application to China Case Study. PLOS ONE 2021, 16, e0248187. [Google Scholar] [CrossRef] [Scilit]
  89. Akdeniz, H.B.; Yalpir, S.; Inam, S. Assessment of Suitable Shrimp Farming Site Selection Using Geographical Information System Based Analytical Hierarchy Process in Turkey. Ocean Coast. Manag. 2023, 235, 106468. [Google Scholar] [CrossRef] [Scilit]
  90. Shunmugapriya, K.; Panneerselvam, B.; Muniraj, K.; Ravichandran, N.; Prasath, P.; Thomas, M.; Duraisamy, K. Integration of Multi Criteria Decision Analysis and GIS for Evaluating the Site Suitability for Aquaculture in Southern Coastal Region, India. Mar. Pollut. Bull. 2021, 172, 112907. [Google Scholar] [CrossRef] [Scilit]
  91. Zhang, Z.; Wang, Z.; Li, G.; Zhao, M.; Li, W. The Suitability Assessment on Site Selection for Bottom-Seeding Scallop Culture Based on Analytic Hierarchy Process. J. Oceanol. Limnol. 2024, 42, 647–663. [Google Scholar] [CrossRef] [Scilit]
  92. Nurhabib, A.; Sartimbul, A.; Primyastanto, M.; Widodo, M.S.; Handoko, L.T.; Rahayu, A.R.; Martudi, S. Sustainable Pangasius Aquaculture Management Strategy Using Multidimensional Scaling (MDS) and Analytical Hierarchy Process (AHP) in Tulungagung Regency, East Java, Indonesia. J. Ilm. Perikan. Dan Kelaut. 2024, 16, 66–91. [Google Scholar] [CrossRef] [Scilit]
  93. Azra, M.N.; Ikhwanuddin, M. A Review of Maturation Diets for Mud Crab Genus Scylla Broodstock: Present Research, Problems and Future Perspective. Saudi J. Biol. Sci. 2016, 23, 257–267. [Google Scholar] [CrossRef] [Scilit]
  94. Asmat-Ullah, M.; Waiho, K.; Fazhan, H.; Ahmed, S.; Abualreesh, M.H.; Norainy, M.H.; Nahid, S.A.A.; Ma, H.; Peng, T.H.; Rahman, M.M.; et al. Reproductive Performance of Female Orange Mud Crab, Scylla olivacea, Based on Body Size and Mating Strategies. Aquac. Rep. 2025, 42, 102718. [Google Scholar] [CrossRef] [Scilit]
  95. Li, X.; Wang, B.; Xie, T.; Stankovski, S.; Hu, J. Research Progress on Nondestructive Testing Technology for Aquatic Products Freshness. J. Food Process Eng. 2022, 45, e14025. [Google Scholar] [CrossRef] [Scilit]
  96. Zhang, X.; Zhou, H.; Chang, L.; Lou, X.; Li, J.; Hui, G.; Zhao, Z. Study of Golden Pompano (Trachinotus ovatus) Freshness Forecasting Method by Utilising Vis/NIR Spectroscopy Combined with Electronic Nose. Int. J. Food Prop. 2018, 21, 1257–1269. [Google Scholar] [CrossRef] [Scilit]
  97. Hartman, K.J.; Margraf, F.J.; Hafs, A.W.; Cox, M.K. Bioelectrical Impedance Analysis: A New Tool for Assessing Fish Condition. Fisheries 2015, 40, 590–600. [Google Scholar] [CrossRef] [Scilit]
  98. Zhang, D.; Lillywhite, K.D.; Lee, D.-J.; Tippetts, B.J. Automatic Shrimp Shape Grading Using Evolution Constructed Features. Comput. Electron. Agric. 2014, 100, 116–122. [Google Scholar] [CrossRef] [Scilit]
  99. Sung, H.-J.; Park, M.-K.; Choi, J.W. Automatic Grader for Flatfishes Using Machine Vision. Int. J. Control Autom. Syst. 2020, 18, 3073–3082. [Google Scholar] [CrossRef] [Scilit]
  100. Issac, A.; Dutta, M.K.; Sarkar, B. Computer Vision Based Method for Quality and Freshness Check for Fish from Segmented Gills. Comput. Electron. Agric. 2017, 139, 10–21. [Google Scholar] [CrossRef] [Scilit]
  101. Liu, Z.; Jia, X.; Xu, X. Study of Shrimp Recognition Methods Using Smart Networks. Comput. Electron. Agric. 2019, 165, 104926. [Google Scholar] [CrossRef] [Scilit]
Figure 1. Conventional destructive workflows in aquaculture: (a) fish freshness scoring (Torry scheme), (b) bivalve gonad development staging (Crassostrea gigas), and (c) mud crab ovarian maturation staging (Scylla paramamosain). For panel (b), stages I–III D correspond to the histological gonadal development stages: Stage I (early development), Stage II (late development), Stage III A (intense gametogenic activity), Stage III B (maturation), and Stage III D (spent condition), respectively. For panel (c), ovarian maturation was classified into five stages—predevelopmental (I), initial developmental (II), proliferative (III), prematuration (IV), and mature (V)—based on external morphology and histological observation. Schematic illustration created by the authors based on [4,5,6], with the assistance of OpenAI ChatGPT (GPT-5.2) and Microsoft PowerPoint (Microsoft Office Home and Student 2021).
Aquacj 06 00003 g001
Figure 2. Classification of non-destructive technologies for aquatic animal product quality assessment, grouped by sensing mechanism into six families; the dashed outline indicates analytical statistics and modeling techniques (e.g., PCA, PLS, and SVMs) applied across modalities.
Aquacj 06 00003 g002
Figure 3. Schematic illustration of a typical EIS/BIA measurement system. Schematic illustration created by the authors based on [27,28], with the assistance of OpenAI ChatGPT (GPT-5.2) and Microsoft PowerPoint (Microsoft Office Home and Student 2021).
Aquacj 06 00003 g003
Figure 4. (a) Typical optical spectroscopy systems (VIS-NIR, MIR, RS, FS, HSI, and MSI), (b) THz spectroscopy systems, and (c) NMR spectroscopy systems. Adapted from [30], licensed under CC BY 4.0.
Aquacj 06 00003 g004
Figure 5. (a) CV system for visual assessments, (b) E-nose system for volatile compound detection, and (c) E-tongue system for liquid sample analysis. Schematic illustration created by the authors based on [42,44,45], with the assistance of OpenAI ChatGPT (GPT-5.2) and Microsoft PowerPoint (Microsoft Office Home and Student 2021).
Aquacj 06 00003 g005
Figure 6. (a) US: ultrasonication disk system for testing fish meat and (b) USG: high-resolution ultrasound system for fish imaging and acquisition. Schematic illustration created by the authors based on [57,58], with the assistance of OpenAI ChatGPT (GPT-5.2) and Microsoft PowerPoint (Microsoft Office Home and Student 2021).
Aquacj 06 00003 g006
Figure 7. (a) X-ray imaging system configuration and (b) CT system setup for aquatic animal product quality evaluation. Schematic illustration created by the authors based on [62,63], with the assistance of OpenAI ChatGPT (GPT-5.2) and Microsoft PowerPoint (Microsoft Office Home and Student 2021).
Aquacj 06 00003 g007
Figure 8. (a) Industrial microwave system integrated with a thermal imaging camera and (b) schematic of an automated microwave imaging system. Schematic illustration created by the authors based on [67,68], with the assistance of OpenAI ChatGPT (GPT-5.2) and Microsoft PowerPoint (Microsoft Office Home and Student 2021).
Aquacj 06 00003 g008
Figure 9. AHP-based decision-making framework for evaluating and ranking non-destructive technologies in aquatic animal product quality assessment: a case study on ovarian maturation stage evaluation in mud crabs.
Aquacj 06 00003 g009
Figure 10. Hierarchical structure of the AHP-based decision model for selecting non-destructive technologies to assess ovarian maturation stages in mud crabs.
Aquacj 06 00003 g010
Table 1. Criterion definitions for non-destructive technology assessment in aquaculture and the four-level rating scale used for the general performance criteria in the AHP framework.
CategoryCriterionDefinitionLevelRef.
LMHVH
General
performance
CostTotal financial investment for acquisition, operation, and maintenance.Cost-effectiveModerately pricedCostlyHigh financial burden[12,70,71]
AccuracyAverage precision in detecting or classifying the target attribute across repeated assessments.Low accuracyModerate accuracyHigh accuracyVery high
accuracy
[71,72]
SpeedTime efficiency in completing a measurement or assessment.SlowModerateFastVery fast[1,71]
UsabilityOverall user-friendliness and operational simplicity in practical or field conditions.Technically complexModerately
operable
User-friendlyIntuitive and plug-and-play[73,74]
Application-
specific
ScalabilityCapacity to adapt to varying sample sizes, production scales, or operational contexts.Non-scalableLimited scalabilityEasily scalableFully scalable[75,76]
PortabilitySuitability for field deployment, including ease of transport and setup.StationaryMovable with
effort
Mobile and
compact
Fully portable and field-ready[77,78]
Integration
feasibility
Ease of incorporation into existing workflows or systems.Incompatible with systemsAdaptable with workflow changesCompatible with typical systemsSeamlessly
integrable
[75,79]
Environmental
impact
Potential ecological footprint and sustainability of the technology.Environmentally harmfulModerately
sustainable
Low-impact and efficientNear-zero
footprint
[80,81]
Non-invasivenessAbility to assess animals without causing harm, stress, or degradation.Highly invasiveMinimally invasiveMildly
non-invasive
Fully
non-invasive
[82,83]
Table 2. Preliminary qualitative comparison of non-destructive technologies based on general performance criteria.
CategoryTechniqueApplicationGeneral Performance Criteria
CostAccuracySpeedUsability
ElectricalEISAssessment of fish freshness [84]MHHM
BIAEvaluation of lipid content in fish [24]MHHM
SpectroscopicVIS-NIRDetection of fresh and frozen/thawed fish [31]MHHH
MIRPrediction of fat and fatty acids in fish [32]HHMM
RSDetection of fish adulteration [33]HHMM
FSAssessment of shrimp freshness [36]MHHM
HSIEvaluation of fish freshness [37]HVHMM
MSIEstimation of fish spoilage [38]MHHM
THzInvestigation of fish spoilage [40]VHHLL
NMRQuantification of fatty acid in fish [41]VHVHLL
Natural sensoryCVDetection of defects in shrimps [85]MHHH
E-noseDiagnosis of fish spoilage [86]MHMM
E-tongueMonitoring fish freshness [53]MMMM
AcousticUSEvaluation of fish freshness [56]MHMM
USGEvaluation of gonadal maturity in fish [7]MHMM
RadiographicX-rayDetection of foreign materials [61]HHHM
CTAnalysis of fat distribution in fish [8]VHVHLL
Infrared and
microwave
TIAssessment of shrimp and fish freshness [11]MHHM
MIInternal quality assessments [10]HHMM
Table 3. Saaty’s 1–9 scale for pairwise comparisons [87].
ScaleImportance LevelExplanation
1Equal importanceBoth criteria contribute equally to the goal.
3Moderate importanceOne criterion is slightly more important than the other.
5Strong importanceOne criterion is strongly favored over the other.
7Very strong importanceOne criterion is strongly preferred.
9Extreme importanceOne criterion is overwhelmingly more important.
2, 4, 6, 8Intermediate valuesValues used for compromises between levels.
ReciprocalsE.g., 1/3, 1/5, etc.Used when a criterion is less important.
Table 4. Pairwise comparison matrix (aij) for assessing criteria.
Criterionaij
CostAccuracySpeedUsabilityNon-Invasiveness
Cost11/51/31/51/3
Accuracy51333
Speed31/311/31/3
Usability51/3311/2
Non-invasiveness31/3321
Table 5. Normalized comparison matrix (Nij), local priority weight (WCi), and ranking for criteria.
CriterionNijWCiRanking
CostAccuracySpeedUsabilityNon-Invasiveness
Cost0.0590.0910.0320.0310.0650.0555
Accuracy0.2940.4550.2900.4590.5810.4161
Speed0.1760.1520.0970.0510.0650.1084
Usability0.2940.1520.2900.1530.0970.1973
Non-invasiveness0.1760.1520.2900.3060.1940.2242
Table 6. Pairwise comparison matrix (aij) of 19 alternatives for cost.
AlternativesElectricalSpectroscopicNatural SensoryAcousticRadiographicInfrared and Microwave
EISBIAVIS-NIRMIRRSFSHSIMSITHzNMRCVE-noseE-tongueUSUSGX-RayCTTIMI
ElectricalEIS1123334445123234534
BIA1123334445123234534
SpectroscopicVIS-NIR1/21/2122233341/212123423
MIR1/31/31/211122231/31/211/212312
RS1/31/31/211122231/31/211/212312
FS1/31/31/211122231/31/211/212312
HSI1/41/41/31/21/21/211121/41/31/21/31/2121/21
MSI1/41/41/31/21/21/211121/41/31/21/31/2121/21
THz1/41/41/31/21/21/211121/41/31/21/31/2121/21
NMR1/51/51/41/31/31/31/21/21/211/51/41/31/41/31/211/31/2
Natural sensoryCV1123334445123234534
E-nose1/21/2122233341/212123423
E-tongue1/31/31/211122231/31/211/212312
AcousticUS1/21/2122233341/212123423
USG1/31/31/211122231/31/211/212312
RadiographicX-ray1/41/41/31/21/21/211121/41/31/21/31/2121/21
CT1/51/51/41/31/31/31/21/21/211/51/41/31/41/31/211/31/2
Infrared and microwaveTI1/31/31/211122231/31/211/212312
MI1/41/41/31/21/21/211121/41/31/21/31/2121/21
Table 7. Pairwise comparison matrix (aij) of 19 alternatives for accuracy.
AlternativesElectricalSpectroscopicNatural SensoryAcousticRadiographicInfrared and Microwave
EISBIAVIS-NIRMIRRSFSHSIMSITHzNMRCVE-noseE-tongueUSUSGX-RayCTTIMI
ElectricalEIS111/21/31/41/41/51/31/21/61/2111/21/31/51/622
BIA111/21/31/41/41/51/31/31/61/3111/21/31/51/61/21/2
SpectroscopicVIS-NIR2211/21/31/31/41/21/21/5221/311/21/41/511/2
MIR33211/21/21/3111/5331/2211/31/521
RS4432111/2221/4421321/21/432
FS4432111/2221/4411321/21/432
HSI5543221331/35444311/343
MSI33211/21/21/3111/4332211/31/421
THz23211/21/21/3111/5311211/31/521
NMR6655443451355543155
Natural sensoryCV231/21/31/41/41/51/31/31/31221/21/31/51/31/21/3
E-nose111/21/31/211/41/311/51/2111/21/31/41/511
E-tongue1132111/41/211/51/2111/21/31/31/511
AcousticUS2211/21/31/31/41/21/21/522211/21/41/511/2
USG33211/21/21/3111/4333211/31/421
RadiographicX-ray5543221331/35434311/343
CT6655443451355543154
Infrared and microwaveTI1/2211/21/31/31/41/21/21/521111/21/41/511/2
MI1/22211/21/21/3111/5311211/31/421
Table 8. Pairwise comparison matrix (aij) of 19 alternatives for speed.
AlternativesElectricalSpectroscopicNatural SensoryAcousticRadiographicInfrared and Microwave
EISBIAVIS-NIRMIRRSFSHSIMSITHzNMRCVE-noseE-tongueUSUSGX-RayCTTIMI
ElectricalEIS12146365481/224234727
BIA1/211/235254371/313123616
SpectroscopicVIS-NIR12146365481/224234727
MIR1/41/31/4131/232151/51/311/31/2141/34
RS1/61/51/61/311/411/21/331/71/51/31/51/41/321/52
FS1/31/21/324143261/41/221/21251/25
HSI1/61/51/61/311/411/21/331/71/51/31/51/41/321/52
MSI1/51/41/51/221/3211/241/61/41/21/41/31/231/43
THz1/41/31/4131/232151/51/311/31/2141/34
NMR1/81/71/81/51/31/61/31/41/511/91/71/51/71/61/51/21/71/2
Natural sensoryCV2325747659135345838
E-nose1/211/235254371/313123616
E-tongue1/41/31/4131/232151/51/311/31/2141/34
AcousticUS1/211/235254371/313123616
USG1/31/21/324143261/41/221/21251/25
RadiographicX-ray1/41/31/4131/232151/51/311/31/2141/34
CT1/71/61/71/41/21/51/21/31/421/81/61/41/61/51/411/61
Infrared and microwaveTI1/211/235254371/313123616
MI1/71/61/71/41/21/51/21/31/421/81/61/41/61/51/411/61
Table 9. Pairwise comparison matrix (aij) of 19 alternatives for usability.
AlternativesElectricalSpectroscopicNatural SensoryAcousticRadiographicInfrared and Microwave
EISBIAVIS-NIRMIRRSFSHSIMSITHzNMRCVE-noseE-tongueUSUSGX-RayCTTIMI
ElectricalEIS11/2145463581/2151/245726
BIA2125657469126156837
SpectroscopicVIS-NIR11/2145463581/2151/245726
MIR1/41/51/412131/2251/51/421/51241/33
RS1/51/61/51/211/221/3141/61/511/61/2131/42
FS1/41/51/412131/2251/51/421/51241/33
HSI1/61/71/61/31/21/311/41/231/71/61/21/71/31/221/51
MSI1/31/41/323241361/41/331/42351/24
THz1/51/61/51/211/221/3141/61/511/61/2131/42
NMR1/81/91/81/51/41/51/31/61/411/91/81/41/91/51/41/21/71/3
Natural sensoryCV2125657469126156837
E-nose11/2145463581/2151/245726
E-tongue1/51/61/51/211/221/3141/61/511/61/2131/42
AcousticUS2125657469126156837
USG1/41/51/412131/2251/51/421/51241/33
RadiographicX-ray1/51/61/51/211/221/3141/61/511/61/2131/42
CT1/71/81/71/41/31/41/21/51/321/81/71/31/81/41/311/61/2
Infrared and microwaveTI1/21/31/234352471/31/241/334615
MI1/61/71/61/31/21/311/41/231/71/61/21/71/31/221/51
Table 10. Pairwise comparison matrix (aij) of 19 alternatives for non-invasiveness.
AlternativesElectricalSpectroscopicNatural SensoryAcousticRadiographicInfrared and Microwave
EISBIAVIS-NIRMIRRSFSHSIMSITHzNMRCVE-noseE-tongueUSUSGX-RayCTTIMI
ElectricalEIS111/71/71/71/71/71/71/71/31/71/71/71/51/5331/71/7
BIA111/71/71/71/71/71/71/71/31/71/71/71/51/5331/71/7
SpectroscopicVIS-NIR7711111113111335511
MIR7711111113111335511
RS7711111113111335511
FS7711111113111335511
HSI7711111113111335511
MSI7711111113111335511
THz7711111113111335511
NMR331/31/31/31/31/31/31/311/31/31/31/31/3331/31/3
Natural sensoryCV7711111113111335511
E-nose7711111113111335511
E-tongue7711111113111335511
AcousticUS551/31/31/31/31/31/31/331/31/31/311331/31/3
USG551/31/31/31/31/31/31/331/31/31/311331/31/3
RadiographicX-ray1/31/31/51/51/51/51/51/51/51/31/51/51/51/31/3111/51/5
CT1/31/31/51/51/51/51/51/51/51/31/51/51/51/31/3111/51/5
Infrared and microwaveTI7711111113111335511
MI7711111113111335511
Table 11. Priority weights (WAij) for 19 alternatives under each criterion.
AlternativesWAij
CostAccuracySpeedUsabilityNon-Invasiveness
ElectricalEIS0.1170.0210.1120.0900.013
BIA0.1170.0160.0750.1310.013
SpectroscopicVIS-NIR0.0750.0250.1120.0900.072
MIR0.0440.0390.0330.0320.072
RS0.0440.0600.0160.0210.072
FS0.0440.0590.0500.0320.072
HSI0.0260.0940.0160.0140.072
MSI0.0260.0430.0230.0460.072
THz0.0260.0370.0330.0210.072
NMR0.0160.1540.0090.0080.025
Natural sensoryCV0.1170.0250.1590.1310.072
E-nose0.0750.0230.0750.0900.072
E-tongue0.0440.0310.0330.0210.072
AcousticUS0.0750.0270.0750.1310.031
USG0.0440.0440.0500.0320.031
RadiographicX-ray0.0260.0920.0330.0210.012
CT0.0160.1520.0110.0100.012
Infrared and microwaveTI0.0440.0230.0750.0650.072
MI0.0260.0350.0110.0140.072
Table 12. Consistency analysis for criteria and alternatives based on each criterion.
Evaluation LevelλmaxCIRICRAcceptable (Yes/No)
Criteria (overall)5.3410.0851.120.076Yes
Alternatives based on cost19.2040.0111.620.007Yes
Alternatives based on accuracy20.3940.0771.620.048Yes
Alternatives based on speed19.6710.0371.620.023Yes
Alternatives based on usability19.7270.0401.620.025Yes
Alternatives based on non-invasiveness19.6750.0371.620.023Yes
Table 13. Global priority weights (GAj) and ranking for all non-destructive technologies.
AlternativesGAjRanking
ElectricalEIS0.04813
BIA0.0509
SpectroscopicVIS-NIR0.0614
MIR0.04515
RS0.04911
FS0.0558
HSI0.0614
MSI0.04714
THz0.04016
NMR0.0732
Natural sensoryCV0.0761
E-nose0.0566
E-tongue0.03917
AcousticUS0.0566
USG0.03917
RadiographicX-ray0.0509
CT0.0703
Infrared and microwaveTI0.04911
MI0.03619
Disclaimer/Publisher’s Note: The statements, opinions and data contained in all publications are solely those of the individual author(s) and contributor(s) and not of MDPI and/or the editor(s). MDPI and/or the editor(s) disclaim responsibility for any injury to people or property resulting from any ideas, methods, instructions or products referred to in the content.