Article

Individual Growth Parameterization Models Using the Observed Variance in Organisms Subject to Aquaculture

by
Eugenio Alberto Aragón-Noriega
1,*,
Edgar Alcántara-Razo
1,
José Adán Félix-Ortiz
2 and
Samuel Angiee Ayón-Jiménez
2
1
Unidad Guaymas del Centro de Investigaciones Biológicas del Noroeste, Km 2.35 Camino al Tular, Estero Bacochibampo, Guaymas 85454, Sonora, Mexico
2
Facultad de Ciencias del Mar, Universidad Autónoma de Sinaloa, Paseo Claussen S/N, Mazatlán 82000, Sinaloa, Mexico
*
Author to whom correspondence should be addressed.
Aquac. J. 2025, 5(4), 21; https://doi.org/10.3390/aquacj5040021
Submission received: 18 September 2025 / Revised: 10 October 2025 / Accepted: 20 October 2025 / Published: 29 October 2025

Abstract

Parameterizing nonlinear models presents an ongoing challenge in fisheries and aquaculture research. While additive and multiplicative error structures have been traditionally applied, a more recent alternative—the observed error structure—is gaining increasing acceptance. This study aimed to analyze the variability of individual growth during the early developmental stages of totoaba (Totoaba macdonaldi), shrimp (Penaeus vannamei), and pearl oyster (Pteria sterna). The observed variance was incorporated as a central component for parameterizing individual growth models. All three datasets were derived from controlled laboratory conditions. Information theory was applied to identify the most appropriate variance criterion (observed, additive, or multiplicative). The Schnute model, case 1, was utilized to estimate the growth curve for each species. Distinct growth patterns were observed: sigmoid in totoaba, rectilinear in shrimp, and exponential in pearl oyster. These findings indicate that incorporating observed variability at each age enhances the parameterization of individual growth models across diverse taxonomic groups, including fish, crustaceans, and mollusks.

Graphical Abstract

1. Introduction

Globally, fisheries and aquaculture are major economic activities that supply large volumes of food for direct and indirect human consumption [1]. They also generate employment and produce significant economic benefits, particularly for coastal communities. In 2020, combined fisheries and aquaculture production reached nearly 178 million tons of marine products, with aquaculture accounting for 49% [1]. The species most frequently reared were the white leg shrimp (Penaeus vannamei) with 5.8 million tons, followed by the grass carp (Ctenopharyngodon idellus) with 5.7 million tons, oysters (Crassostrea spp.) with 5.5 million tons, the silver carp (Hypophthalmichthys molitrix) with 4.9 million tons, and the Nile tilapia (Oreochromis niloticus) with 4.4 million tons [2].
In Mexico, a production of 1.9 million tons was obtained in 2021 from both fisheries and aquaculture activities, of which 13% corresponded to aquaculture. The white leg shrimp was the primary cultivated with 182,110 t, followed by the Nile tilapia with 45,064 t, and the oyster with 15,602 t [3].
Advancements in aquaculture production have faced significant challenges, with numerous obstacles successfully addressed, particularly in the optimization of production processes. Several aquaculture production systems have been enhanced through bio-economic analyses [4]. Bio-economic models are fed by individual growth analysis, but obtaining growth rates in aquaculture also involves some conflict because aquaculturists generally investigate growth using absolute (weight gain during culture time), relative (weight increment as a percentage), and specific (percentage of weight increase between the growing period) growth rates [5,6]. The main inconvenience with these approaches is that the real growth rate of the studied species is lost.
Previous studies [5,6] have emphasized the importance of applying individual-based growth models in aquaculture to obtain more accurate estimates of growth rates during production. This is particularly relevant because absolute growth rate calculations can introduce systematic errors that are often overlooked errors that become evident when plotting individual length data over time [7]. The application of growth models not only improves the accuracy of growth estimates but also deepens our understanding of growth dynamics under culture conditions.
This leads to a critical methodological question: Which model should be used to analyze growth? Among the mathematical models developed to describe organismal growth, the von Bertalanffy Growth Function (VBGF) has been widely used since its introduction in 1938 [8]. Although originally developed for fisheries applications, its widespread use does not necessarily mean it is the most suitable model for all scenarios. A variety of alternative models have been proposed and applied in aquaculture, including the Gompertz [9], Johnson [10], Richards [11], logistic [12], and Schnute [13] models.
As with other mathematical models, growth models rely on variables and parameters that must be estimated from empirical data. Parameter estimation can be carried out using various methods, one of the most common being the application of objective functions in the context of nonlinear models. These functions are formulated based on assumptions about the error structure, which involves key decisions regarding the nature of the variance. Traditionally, error structures are classified as either additive or multiplicative; however, more complex formulations, such as those incorporating depensatory [14] or compensatory [15] variance structures, have also been explored.
In the present research, a novel method was chosen for calculating individual growth model parameters based on the error structure. The observed error structure for estimating parameters in the modeling used in aquaculture is evident. However, this is ignored, and additive or multiplicative type errors are used. The conceptual advancement of this proposal, which contributes to the progress of scientific knowledge, is based on an innovative and original idea to explain the estimation of model parameters used in aquaculture, specifically in the individual growth of organisms subject to aquaculture. Particularly, we propose breaking the old paradigm and consolidating the new use of the observed structure error as an alternative approach to model parameterization in aquaculture research. To test the hypothesis that the use of the observed error structure will allow more robust estimates of individual growth parameters, length-at-age data from fish, crustaceans, and bivalve mollusks were used. For this reason, this investigation was conducted to evaluate the variability of individual growth in early stages of totoaba, shrimp, and pearl oyster to demonstrate that the error structure observed at each age is better for finding more realistic growth parameters than additive or multiplicative error structures, primarily for modeling used in aquaculture, and specifically in individual growth models.

2. Materials and Methods

2.1. Data Bases

The data were obtained from information generated in other projects with very different aims from those of the present study [16,17,18]. In this study, the results of parameterization with three different error structure criteria were compared. Growth data was selected (length-at-age of the three taxonomic groups: fish, mollusks, and crustaceans), most used in aquaculture. Particularly for the fish group, data from totoaba were used (Totoaba macdonaldi) (see [16] for further details). Totoaba eggs from reproductive specimens maintained in captivity were obtained through a donation from the Centro Reproductivo de Especies Marinas del Estado de Sonora (CREMES). Positively buoyant fertilized eggs were collected and separated by decantation using 1 L plastic tubes, then rinsed with filtered seawater and transferred to a 3000 L incubation tank at a density of 65 eggs·L−1. Egg quantification was performed using the volumetric method. Incubation was carried out at a constant temperature of 22 °C, while subsequent larval rearing followed a gradually increasing temperature regime reflecting ambient outdoor conditions. Salinity was maintained at 36 psu throughout the experiment. Larvae were fed according to established laboratory protocols: live feed (microalgae, rotifers, and Artemia nauplii) was provided from hatching to 30 days post-hatching (DPH), followed by microencapsulated formulated feed from 31 to 40 DPH. Temperature, salinity, and dissolved oxygen levels were monitored daily using a YSI Model 556 MPS multiparameter. For the crustacean group, data from the culture of post-larval white leg shrimp were used. Larvae were cultured in the laboratory under controlled conditions to determine the age in post-larval stages. A shrimp trawler captured ripened females of Penaeus vannamei in the Gulf of California. In the laboratory, females were placed in fiberglass tanks with a capacity of approximately 1500 L, which contained water with a practical salinity of 36 units and a temperature of 28 °C. Nauplii were placed in round fiberglass tanks and cultured as described in [17]. Larvae were fed with microalgae (100,000–200,000 cells/mL) (Chaetoceros sp., Isochrysis galbana, and Tetraselmis suecica) from zoea until the first day of post-larvae. Furthermore, Artemia were added (0.1 nauplii/mL) from the second mysis stage until all post-larval stages. Once shrimp reached the postlarval stages (PL1), they were placed in a 500 L plastic tank, and samples of 10 individuals were collected daily from PL1 to PL20. Total length (TL) and shell length (SL) were measured in each postlarvae using a calibrated vernier. In the case of mollusks, pearl oyster (Pteria sterna) data were used [18]. Postlarvae (seed) were cultured under controlled conditions from an initial shell height of approximately 0.5 mm until reaching a commercial size of ≥3.0 mm. Pearl oysters were reared in square tanks (50 × 50 × 10 cm) equipped with plastic mesh bottoms, beginning with a 150 µm mesh and transitioning to 300 µm by the end of the culture period. Seawater circulation was maintained using a submersible pump (1/6 Hp) connected to 1.91 cm piping in a recirculating system with a downward flow. Temperature and salinity conditions were consistent with the previous rearing phase; however, the seawater exchange rate increased to 150% per day.
Feeding was carried out using the same microalgae species and proportions as in the prior stage, with concentrations ranging from 100 × 103 to 150 × 103 cells per milliliter over the course of the culture period. This stage lasted approximately 28 days, spanning from day 42 to day 70 post-fertilization. Weekly sampling was conducted to assess seed density, shell size, and survival rates.

2.2. Individual Growth Analysis

The model used to analyze growth of the three species studied was the Schnute growth model [13] which is, in general, a four-parameter model that can be mathematically solved in four different ways (four cases) depending on the values of a and b. That is, there is only one model that attempts to calculate using the so-called case 1, where a parameter (a or b) equals zero; the model “collapses.” Therefore, Schnute [13] when presenting his model also presents the other three cases when one or both parameters (a or b) have a value equal to zero. This model is highly versatile, generating various curves that express both asymptotic and non-asymptotic growth. The Schnute case 1 was used for this study when a ≠ 0, b ≠ 0 in the following manner:
Y t =   y 1 b + y 2 b y 1 b 1 e a t τ 1 1 e a τ 2 τ 1 1 b ,
where Yt is the dimension (height or weight) at age; t is the age in days of rearing; τ1 minimum age of the dataset; τ2 maximum age of the dataset; a is the theoretical initial relative growth rate at age zero (age units−1); b is the relative increase of the growth rate (constant increase in time); y1 is the dimension (length or weight) at age τ1; y2 is the dimension (length or weight) at age τ2.

2.3. Model Parameterization

To parameterize the model, the error structure criteria with normal and log-normal distributions were used. The observed variance of the sample was also used. To estimate the parameters, the objective function was first fitted with the following equation:
L L = 0.5 L N σ 2 0.5 L N 2 π Y o Y e 2 2 σ 2 ,
This function was maximized using the Newton algorithm [19] and considering different residual criteria; the used sigma (σ) values were:
Additive error
σ = Y o Y e 2 n ,
Multiplicative error structure
σ = l n Y o l n Y e 2 n ,
Observed error structure
σ i = Y o Y a 2 n ,
where Yo is the observed value in each age, Ye is the estimated value, and Ya is the average value at each age.

2.4. Selecting the Best Structure Error

To determine which was the best error structure to parameterize the model, the Bayesian Information Criterion (BIC) or the Schwarz Information Criterion was used. The case with the lowest value is considered the best fit:
B I C =   2 L L + log n θ ,
where θ is the number of model parameters, the log function is the natural logarithmic function, n is the number of data or observations, and LL is the log-likelihood function.
To prioritize error structures, the difference in the BIC (Δi) values was estimated among the three structures. The most accurate error structure was chosen if BIC value was the lowest.
i   = B I C i B I C m i n ,
To statistically determine the best fit of the data, the Bayesian weighting of each error structure was evaluated using the following equation:
w i =   e x p 0.5 i k = 1 3 e x p 0.5 i .

3. Results

3.1. Development of Organisms in Captivity

For the totoaba, 40 culture days were completed with spaced sampling in function of the age of organisms. Forty days were processed, resulting in a total of 92 samples and 1390 organisms. Total length varied from 2.42 mm to 34.60 mm. The data demonstrated that inter-individual size variability became more pronounced as age increased (Figure 1A). The growth of shrimp post larvae initiated once they passed from the mysis stage to post larvae from the same first day, and follow-up was carried out until day 20. The smallest recorded size was 4.8 mm TL, while the largest registered on day 20 was 12.1 mm (Figure 1B). Regarding the pearl oyster, 510 individuals were measured in 17 different moments. Data showed empirical evidence of a depensatory growth (variance increases with age) in unprocessed data (Figure 1C). The chosen measure was the height, as it is the most common in bivalve mollusks.

3.2. Observed Variability in Reared Organisms

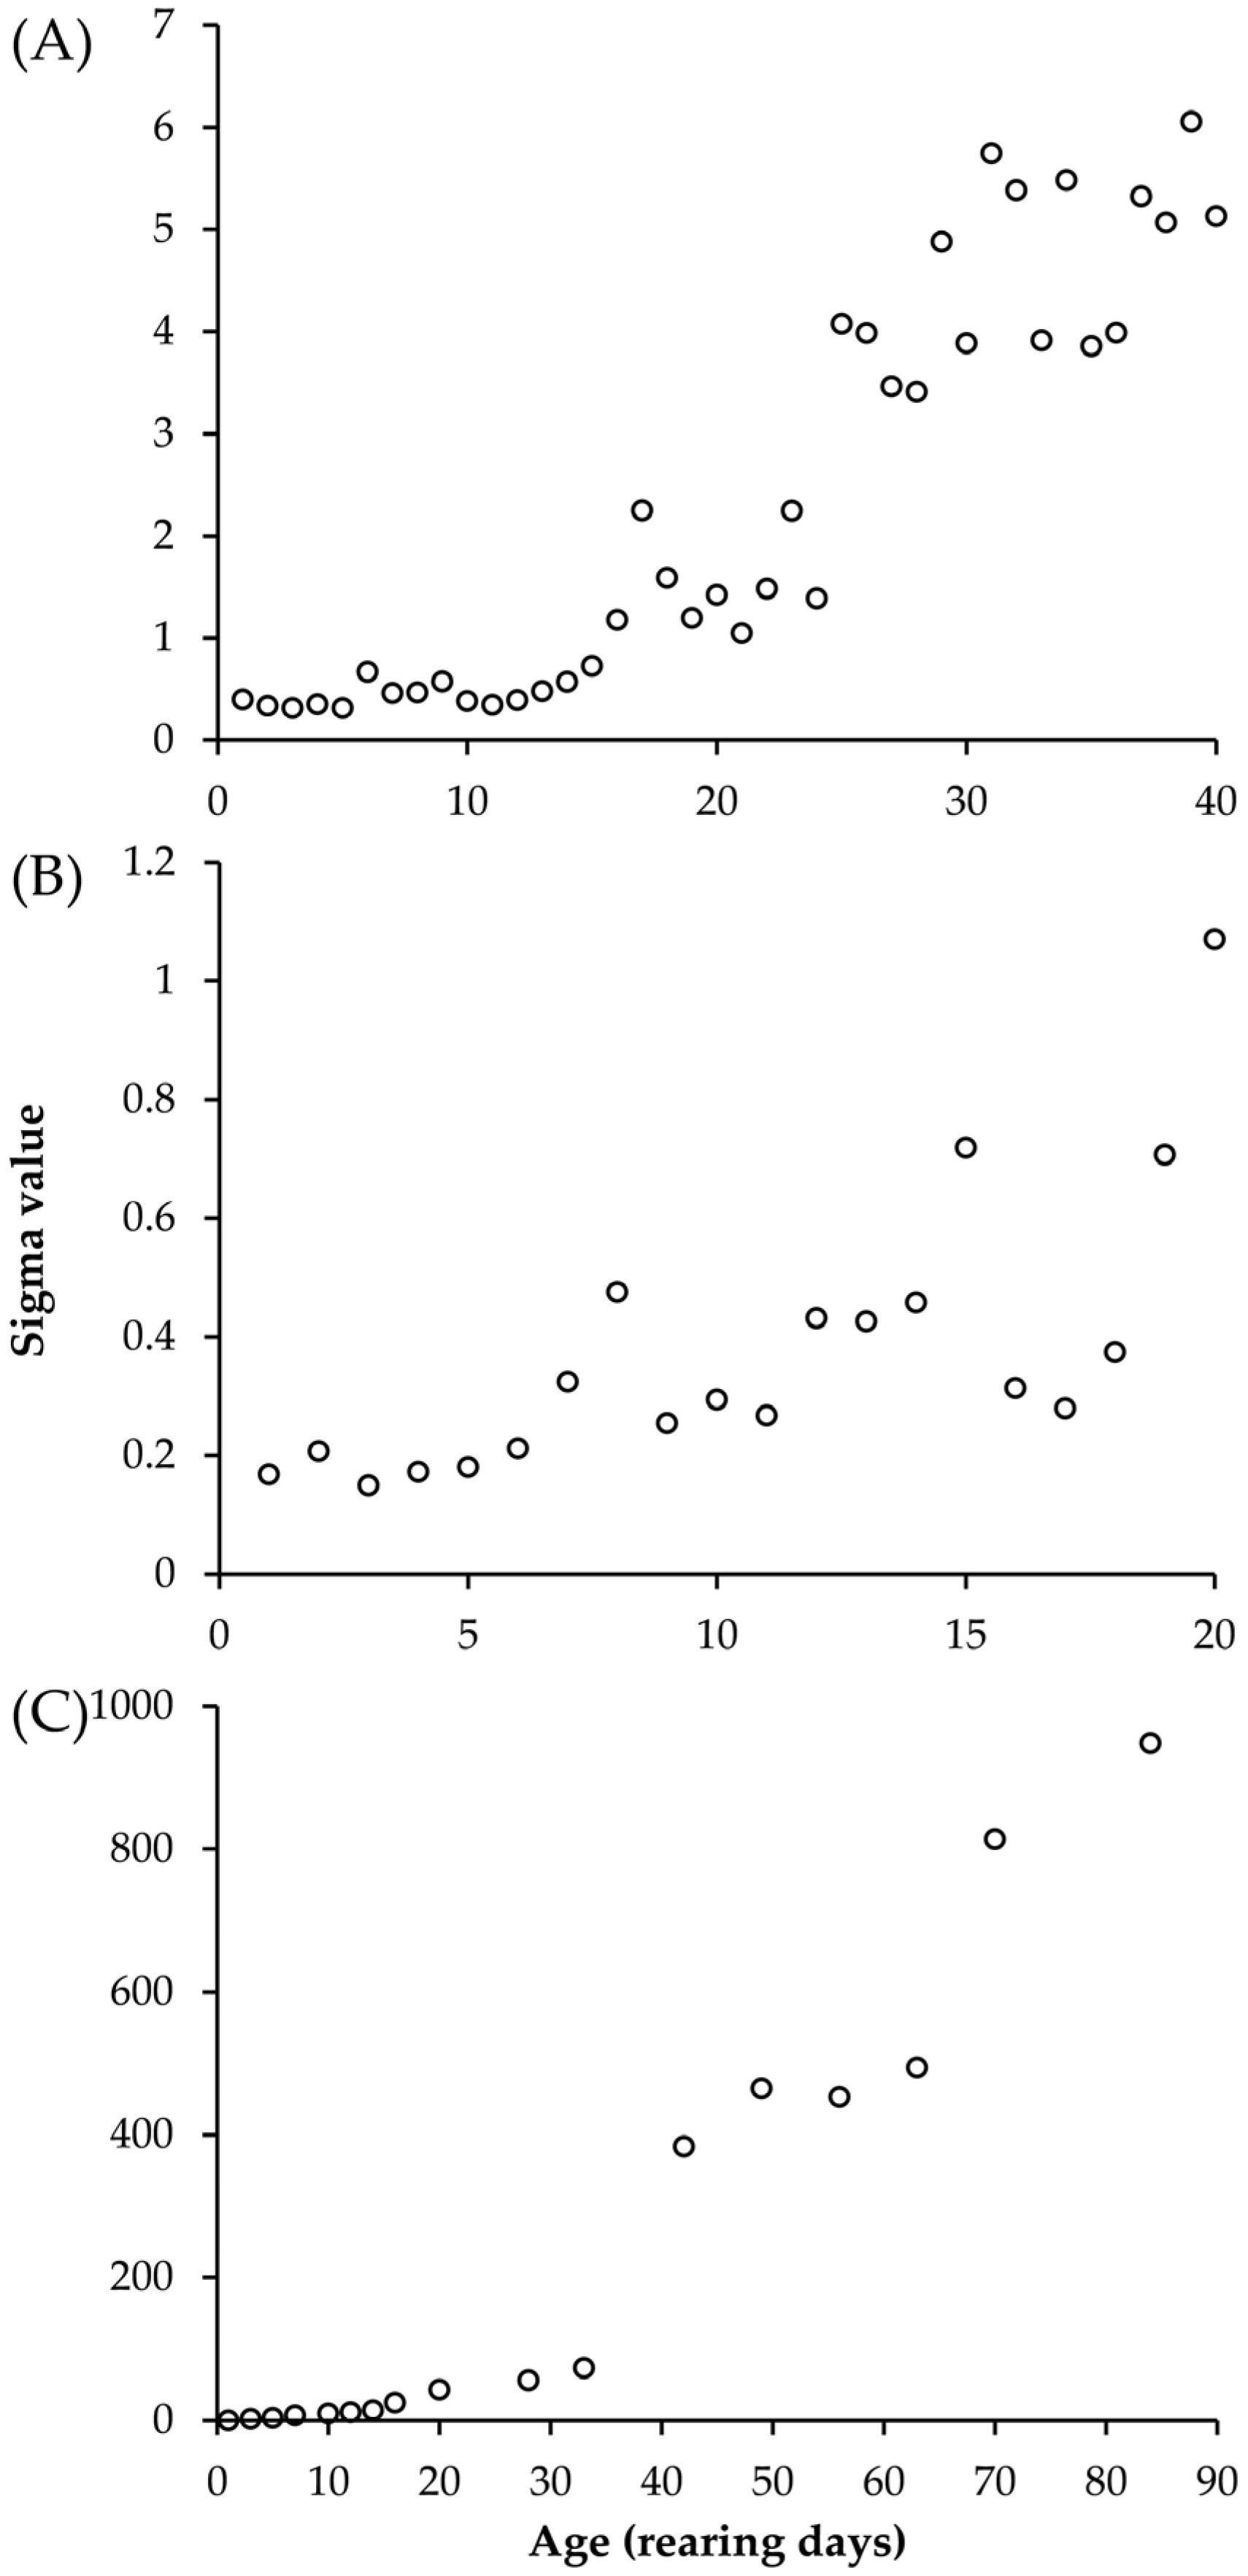
Data from cultured totoaba showed a standard deviation that indicated unbalanced growth in the first stages of the culture (Figure 2A). In the cultured shrimp experiment, the general data dispersal trend presented a predisposition to increase with age, but this tendency did not continue to increase throughout the culture period. The variability occurred in three periods. Increasing from day 1 to 8, variability decreased from day 9 compared to day 8 and then presented another increasing tendency until day 15. Day 16 was lower again compared to day 15, and then it increased again until day 20 (Figure 2B). In the pearl oyster, the depensatory variance was unquestionable from the 20 days of culture. In previous days, the difference in variance was imperceptible, and it would seem like a constant variance until that moment. However, the variance is masked by the scale since values range from 2 to 43 until day 20.

3.3. Selecting the Appropriate Error Form

In the growth experiments of the three taxa (fish, crustaceans, and mollusks), the BIC values indicated that the most plausible model parameters were obtained using the observed error structure of the length-at-age data (Table 1). Table 2 presents the model parameters, along with the three error structures used to optimize them, for each of the three groups of cultured organisms.

3.4. Average Growth of the Three Species

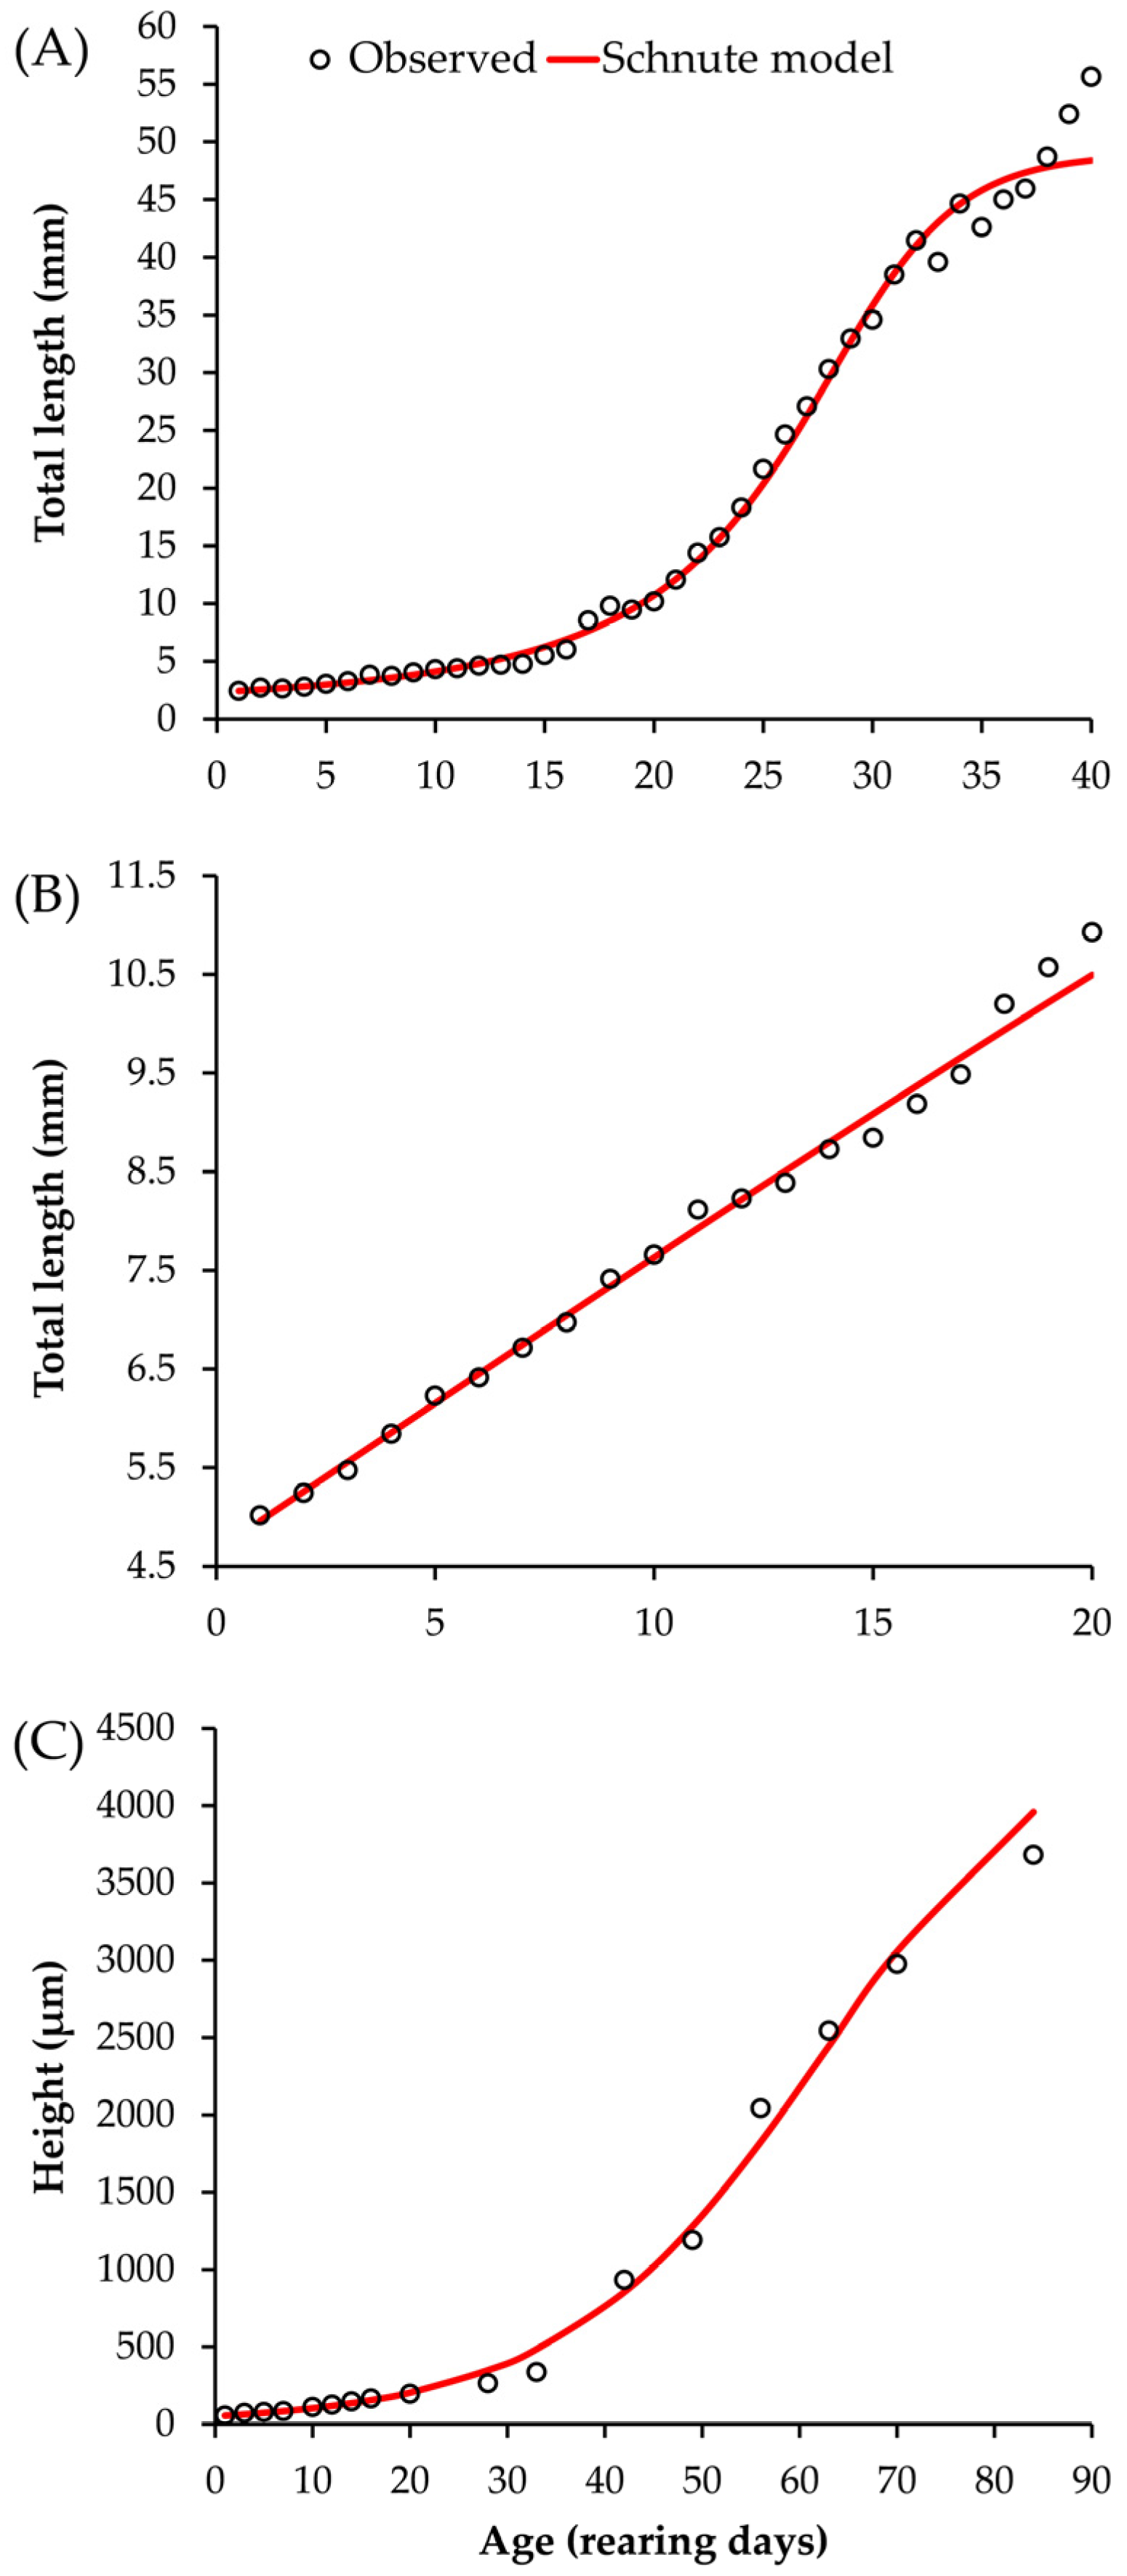
The curves resulted from the model, along with a comparison to the average age data in terms of age or culture days, are shown in Figure 3. They were presented in this manner to facilitate better appreciation and to highlight the average values. In the experiment with totoaba, the curve described by the Schnute model was sigmoid and not that efficient in describing the last two days of growth (Figure 3A). Figure 3B shows the average growth results of white leg shrimp post larvae. In this case, it turned out to be rectilinear in both the average data and the model. The estimated curve for the average growth of pearl oyster is represented by a power-type curve (Figure 3C). In this case, with three species from three taxa, it was observed that Schnute model has the capability to anticipate different curves such asymptotic and non-asymptotic.

4. Discussion

In farmed species such as fish, shrimp, and mollusks, individuals of the same age often exhibit substantial size variability, with some being markedly larger or smaller than the average. Incorporating this observed variability at age into the parameterization of individual growth models represents a novel and valuable approach in aquaculture. Modeling individual growth dynamics enables more precise feeding strategies, thereby reducing feed waste and improving feed conversion ratios (FCR). Because feed constitutes the largest operational cost in aquaculture, improving the accuracy of growth parameter estimation can significantly reduce feed expenses and enhance overall farm management efficiency. Size variation among conspecifics of the same age cohort in aquaculture systems may result from genetic changes in growing probability or unequal access to resources such as feed. Dominant individuals, typically bigger or more aggressive, can monopolize feed, thereby restricting access for subordinate fish and contributing to growth disparities within the population. Consequently, dominant fish typically exhibit higher growth rates than their subordinate counterparts. These disparities in growth may either amplify or diminish as individuals get older [20].
Previous studies regarding individual growth analysis of cultured or wild organisms assumed a constant variance. However, when multiple criteria were applied, the observed variance emerged as the most appropriate according to the Bayesian Information Criterion (BIC). To the best of our knowledge, the approach adopted in this study using the observed variance for model parameterization is novel in the context of analyzing individual growth in both reared and wild animals. Previous studies have noted the limited use of constant variance in model parameterization and have proposed alternative criteria, such as “fat-tailed” distributions [21] and depensatory variance [14,22]. Fat-tailed approach involves combining two or more probability distribution functions (PDFs), for example, a normal distribution and a t-distribution into a mixture model that captures randomness across different distributions. In such models, a parameter “g” is introduced to control the dispersion of the data: increasing g thickens the tails of the distribution, thereby increasing the likelihood of extreme values. In the two-component mixture model proposed by Chen and Fournier [21], an additional parameter “p” is used to represent the proportion of outlier or “problem” observations. While this approach offers a novel way to address variability and outliers, it still assumes constant variance, which remains a limitation.
Size heterogeneity within a cohort must be considered by age to parameterize models and obtain better results [23] as seen in cultivated fish [24], suggesting that this should be a common practice. Some experiments [25,26] reported a very significant growth disparity among fish of the same age in culture conditions of the first stages of spotted rose snapper Lutjanus guttatus. In this study, size heterogeneity intensified as grow out in data from the three taxonomic groups (totoaba, shrimp, and pearl oyster), supporting the growth depensation hypothesis [14]. This justifies the parameterization of models that considering multi approach such observed variance [23], multiplicative or depensatory method.
The use of observed variance offers a key advantage in capturing the intrinsic variability in size with age. Variability that remains hidden when the objective function is solved using conventional assumptions such as constant variance or monotonically increasing/decreasing variance structures. Based on the raw data, one might initially expect a time-stable (constant) variance. However, it was particularly insightful to compare this with models incorporating the sum of “n” variances. Interestingly, no apparent differences were observed in the estimated growth parameters across models for each species, unless a model selection criterion was applied. In this regard, the BIC highlighted clear distinctions between the variance structures used for each species. This suggests that relying solely on parameter estimates could lead to misinterpretation, specifically, underestimating the importance of the error structure, as similar growth curves may appear to support any model. Nevertheless, fitting the growth model using observed variance consistently produced more robust and biologically plausible results, reinforcing the value of this approach.
Accurate fitting of empirical data is essential for describing growth patterns in aquaculture, as it facilitates the interpolation of size at explicit stages within the range of observed values. Improvements in aquaculture management depend on an accurate interpretation of growth dynamics for effective feeding strategies, rather than the traditional assumption of linear growth. In aquaculture, growth projections are typically represented as linear trends, which form the basis for feeding management strategies. Improving the accuracy of these projections can lead to more effective growth and feed management. In the context of stock management, growth rates constitute a fundamental component of fisheries assessment models; therefore, achieving robust growth estimations represents a significant advancement.
Model selection for growth analysis remains a critical yet challenging step in aquaculture research. While the VBGF is the most widely used model for estimating growth parameters in cultured aquatic species, it has become increasingly common to evaluate multiple models for improved accuracy and biological relevance [27,28,29]. Even though the primary objective in present investigation was not model selection per se, but rather to evaluate differences in the structure of hypothesized variance, the Schnute model, when applied with observed size-at-age dispersion was found to provide a plausible fit.
This finding is particularly noteworthy given the increased number of parameters in the model, as the observed variances were directly estimated from the data and therefore must be included in the BIC calculation [30]. The flexibility of the Schnute model, combined with the use of three datasets from phylogenetically distinct aquaculture species, demonstrated its capacity to accurately represent diverse growth patterns: a sigmoidal curve in totoaba, a linear growth trajectory in shrimp, and a potential-type curve in pearl oyster. All these fits were achieved using the basic form of the Schnute model (Case 1), where the shape of the growth curve is determined by the combination of parameters a and b for each dataset.
This outcome highlights the adaptability of the Schnute model in aquaculture research, as it successfully generated three distinct growth curve types using a consistent modeling framework.

5. Conclusions

The use of the observed variability at each age leads to better individual growth model parameterization regardless of the taxonomic group: fish, mollusks, or crustaceans. Specifically, in the early stages of the species used in aquaculture production.
The Schnute model is the most highly recommended in individual growth studies, regardless of the taxonomic group used in commercial cultures (fish, mollusks, or crustaceans), as well as in the development stages of larvae, post larvae, or juveniles. In each study, the species-specific growth differed: sigmoid, rectilinear, and exponential for totoaba, shrimp, and pearl oyster, respectively.

Author Contributions

Conceptualization, E.A.A.-N.; software, S.A.A.-J.; validation, E.A.A.-N., E.A.-R., J.A.F.-O. and S.A.A.-J.; formal analysis, E.A.A.-N.; investigation, E.A.A.-N.; resources, E.A.A.-N.; data curation, E.A.-R.; writing—original draft preparation, E.A.A.-N.; writing—review and editing, E.A.A.-N., E.A.-R., J.A.F.-O. and S.A.A.-J.; visualization, E.A.A.-N., E.A.-R., J.A.F.-O. and S.A.A.-J.; supervision, E.A.A.-N.; project administration, E.A.A.-N.; funding acquisition, E.A.A.-N.; All authors have read and agreed to the published version of the manuscript.

Funding

This research was funded by “SECIHTI, grant number CF-2023-I-668” and the APC was also funded by “SECIHTI, grant number CF-2023-I-668”. Please note that actual SECIHTI was the former CONAHCYT (by its Spanish acronym) which was National Council of Humanities, Sciences and Technologies Decentralized public area of the federal government of Mexico. Is Mexico’s entity in charge of the promotion of scientific and technological activities, setting government policies for these matters, and granting scholarships for postgraduate studies. Since January 2025 is SECIHTI (Spanish acronym of Secretaría de Ciencias Humanidades Tecnología e Innovación).

Institutional Review Board Statement

This study utilized exclusively previously published, publicly available data and did not involve any experimental manipulation of animals. The Totoaba eggs referenced in the original data were obtained from reproductive specimens maintained in captivity at the Centro Reproductivo de Especies Marinas del Estado de Sonora (CREMES) and provided as a donation. As no animals were used or subjected to experimentation in this study, the work did not meet the criteria for ethical review as stipulated by the Ethics Committee of the Centro de Investigaciones Biológicas del Noroeste (Comité de Ética de Investigación). Therefore, ethical approval was not required, which has been confirmed by the Committee.

Data Availability Statement

The data supporting the findings of this study are available from the first author and corresponding author, E.A.A.-N., upon reasonable request.

Acknowledgments

This project was supported by CONAHCYT in 2023. We also thank Technicians from CIBNOR-Guaymas Applied Ecology and Fisheries lab.

Conflicts of Interest

The authors declare no conflicts of interest. The funders had no role in the design of the study; in the collection, analyses, or interpretation of data; in the writing of the manuscript; or in the decision to publish the results.

Abbreviations

The following abbreviations are used in this manuscript:
BICBayesian Information Criterion
CIBNORCentro de Investigaciones Biológicas del Noroeste (Northwest Biological Research Center)
CONAPESCAComisión Nacional de Acuacultura y Pesca (National Fisheries and Aquaculture Commission)
FAOFood and Agricultural Organization

References

  1. Urías-Sotomayor, R.; Félix-Ortiz, J.A.; Payán-Alejo, J.; Ramos-Torres, B. El cultivo de camarón Penaeus spp. en México con diferente salinidad en el agua. Rev. Cienc. Mar UAS 2024, 2, 103–121. Available online: https://revistas.uas.edu.mx/index.php/CIMAR/article/view/500 (accessed on 1 September 2025).
  2. Food and Agricultural Organization (FAO). El Estado Mundial de la Pesca y la Acuicultura. Hacia la Transformación Azul; FAO: Rome, Italy, 2022. [Google Scholar] [CrossRef]
  3. Comisión Nacional de Acuacultura y Pesca CONAPESCA. Anuario Estadístico de Acuacultura y Pesca 2023. Available online: https://www.gob.mx/conapesca/documentos/anuario-estadistico-de-acuacultura-y-pesca (accessed on 9 September 2025).
  4. Rodríguez-Domínguez, G.; Aragón-Noriega, E.A.; Payán-Alejo, J.; Mendivil-Mendoza, J.E.; Curiel-Bernal MVValenzuela-Quiñonez, W.; Urías-Sotomayor, R. The Fractal Approach to Describe Growth of Farmed Marine Species: Using Double and Triple Logistic Models. Fishes 2024, 9, 106. [Google Scholar] [CrossRef]
  5. Lugert, V.; Thaller, G.; Tetens, J.; Schulz, C.; Krieter, J. A review on fish growth calculation: Multiple functions in fish production and their specific application. Rev. Aquacult. 2016, 8, 30–42. [Google Scholar] [CrossRef]
  6. Hopkins, K.D. Reporting Fish Growth: A Review of the Basics. J. World Aquac. Soc. 1992, 23, 173–179. [Google Scholar] [CrossRef]
  7. Mata-Sotres, J.A.; Lazo, J.P.; Baron-Sevilla, B. Effect of age on weaning success in totoaba (Totoaba macdonaldi) larval culture. Aquac. 2015, 437, 292–296. [Google Scholar] [CrossRef]
  8. von Bertalanffy, L. A quantitative theory of organic growth (Inquires on growth laws II). Hum. Biol. 1938, 10, 181–213. [Google Scholar]
  9. Gompertz, B. On the nature of the function expressive of the law of human mortality, and on a new mode of determining the value of life contingencies. Philos. Trans. R. Soc. Lond. 1825, 115, 513–583. [Google Scholar] [CrossRef]
  10. Johnson, N.O. A trend line for growth series. J. Am. Stat. Assoc. 1935, 30, 717. [Google Scholar] [CrossRef]
  11. Richards, F.J. A flexible growth function for empirical use. J. Exp. Bot. 1959, 10, 290–300. [Google Scholar] [CrossRef]
  12. Ricker, W.E. Computation and interpretation of biological statistics of fish populations. Bull. Fish. Res. Board Can. 1975, 191, 1–382. [Google Scholar]
  13. Schnute, J. A versatile growth model with statistically stable parameters. Can. J. Fish. Aquat. Sci. 1981, 38, 1128–1140. [Google Scholar] [CrossRef]
  14. Restrepo, V.R.; Diaz, G.A.; Walter, J.F.; Neilson, J.D.; Campana, S.E.; Secor, D.; Wingate, R.L. Updated estimate of the growth curve of western Atlantic bluefin tuna. Aquat. Living Resour. 2010, 23, 335–342. [Google Scholar] [CrossRef]
  15. Félix-Ortiz, J.A.; Aragón-Noriega, E.A.; Castañeda-Lomas, N.; Rodríguez-Domínguez, G.; Valenzuela-Quiñónez, W.; Castillo-Vargasmachuca, S. Individual growth analysis of the Pacific yellowlegs shrimp Penaeus californiensis via multi-criteria approach. Lat. Am. J. Aquat. Res. 2020, 48, 768–778. [Google Scholar] [CrossRef]
  16. Curiel-Bernal, M.V.; Cisneros-Mata, M.Á.; Rodríguez-Domínguez, G.; Sánchez-Velasco, L.; Jiménez-Rosenberg, S.P.A.; Parés-Sierra, A.; Aragón-Noriega, E.A. Modelling Early Growth of Totoaba macdonaldi (Teleostei: Sciaenidae) under Laboratory Conditions. Fishes 2023, 8, 155. [Google Scholar] [CrossRef]
  17. Naranjo Páramo, J.; Aragón Noriega, E.A.; Magallón Barajas, F.; Portillo Clark, G. Producción de postlarvas de camarón café Penaeus californiensis en tanques semi comerciales. Oceanología 1996, 10, 73–81. [Google Scholar]
  18. Hoyos-Chairez, F.; Aragón-Noriega, E.A.; Chávez-Villalba, J. Modelling early growth of the pearl oyster Pteria sterna under pilot-commercial production. Aquac Res. 2020, 41, 5106–5117. [Google Scholar] [CrossRef]
  19. Neter, J.; Kutner, M.H.; Nachtsheim, C.J.; Wasserman, W. Applied Linear Statistical Models, 4th ed.; McGraw-Hill: New York, NY, USA, 1996; pp. 1–720. [Google Scholar]
  20. Schnute, J.; Fournier, D. A new approach to length-frequency analysis: Growth structure. Can. J. Fish. Aquat. Res. 1980, 37, 1337–1351. [Google Scholar] [CrossRef]
  21. Chen, Y.; Fournier, D. Impacts of atypical data on Bayesian inference and robust Bayesian approach in fisheries. Can. J. Fish. Aquat. Sci. 1999, 56, 1525–1533. [Google Scholar] [CrossRef]
  22. Luquin-Covarrubias, M.A.; Morales-Bojorquez, E.; González-Pelaez, S.S.; Lluch-Cota, D.B. Joint likelihood function based on multinomial and normal distributions for analyzing the phenotypic growth variability of geoduck clam Panopea globosa. CalCOFI Rep. 2016, 57, 151–162. Available online: https://calcofi.org/downloads/publications/calcofireports/v57/Vol57-Luquin_pages.151-162.pdf (accessed on 27 August 2025).
  23. Curiel-Bernal, M.V.; Aragón-Noriega, E.A.; Cisneros-Mata, M.Á.; Sánchez-Velasco, L.; Jiménez-Rosenberg, S.P.A.; Parés-Sierra, A. Using observed residual error structure yields the best estimates of individual growth parameters. Fishes 2021, 6, 35. [Google Scholar] [CrossRef]
  24. Castillo-Vargasmachuca, S.G.; Aragón-Noriega, E.A.; Rodríguez-Domínguez, G.; Martínez-Cárdenas, L.; Arámbul-Muñoz, E.; Burgos Arcos, Á.J. The standard deviation structure as a new approach to growth analysis in weight and length data of farmed Lutjanus guttatus. Fishes 2021, 6, 60. [Google Scholar] [CrossRef]
  25. Abdo-de la Parra, M.I.; Rodríguez-Ibarra, E.; Rodríguez-Montes de Oca, G.; Velasco-Blanco, G.; Ibarra-Casto, L. Estado actual del cultivo de larvas del pargo flamenco (Lutjanus guttatus). Lat. Am. J. Aquat. Res. 2015, 43, 415–423. [Google Scholar] [CrossRef]
  26. Ibarra-Castro, L.; Ochoa-Bojórquez, M.O.; Sánchez-Téllez, J.L.; Rojo-Cebreros, A.H.; Alvarez-Lajonchere, L. A new efficient method for the mass production of juvenile spotted rose snapper. Lutjanus Guttatus. Aquac. Rep. 2020, 18, 100550. [Google Scholar] [CrossRef]
  27. Baer, A.; Schulz, C.; Traulsen, I.; Krieter, J. Analysing the growth of turbot (Psetta maxima) in a commercial recirculation system with the use of three different growth models. Aquacult. Int. 2010, 19, 497–511. [Google Scholar] [CrossRef]
  28. Ansah, Y.B.; Frimpong, E.A. Using model-based inference to select a predictive growth curve for farmed Tilapia. North Amer. J. Aquac. 2015, 77, 281–288. [Google Scholar] [CrossRef]
  29. Mercier, L.; Panfili, J.; Paillon, C.; N’diaye, A.; Mouillot, D.; Darnaude, A.M. Otolith reading and multi-model inference for improved estimation of age and growth in the gilthead seabream Sparus aurata (L.). Estuar. Coast. Shelf Sci. 2011, 92, 534–545. [Google Scholar] [CrossRef]
  30. Burnham, K.P.; Anderson, D.R. Model Selection and Multimodel Inference: A Practical Information-Theoretic Approach, 2nd ed.; Springer: New York, NY, USA, 2002; pp. 1–488. [Google Scholar]
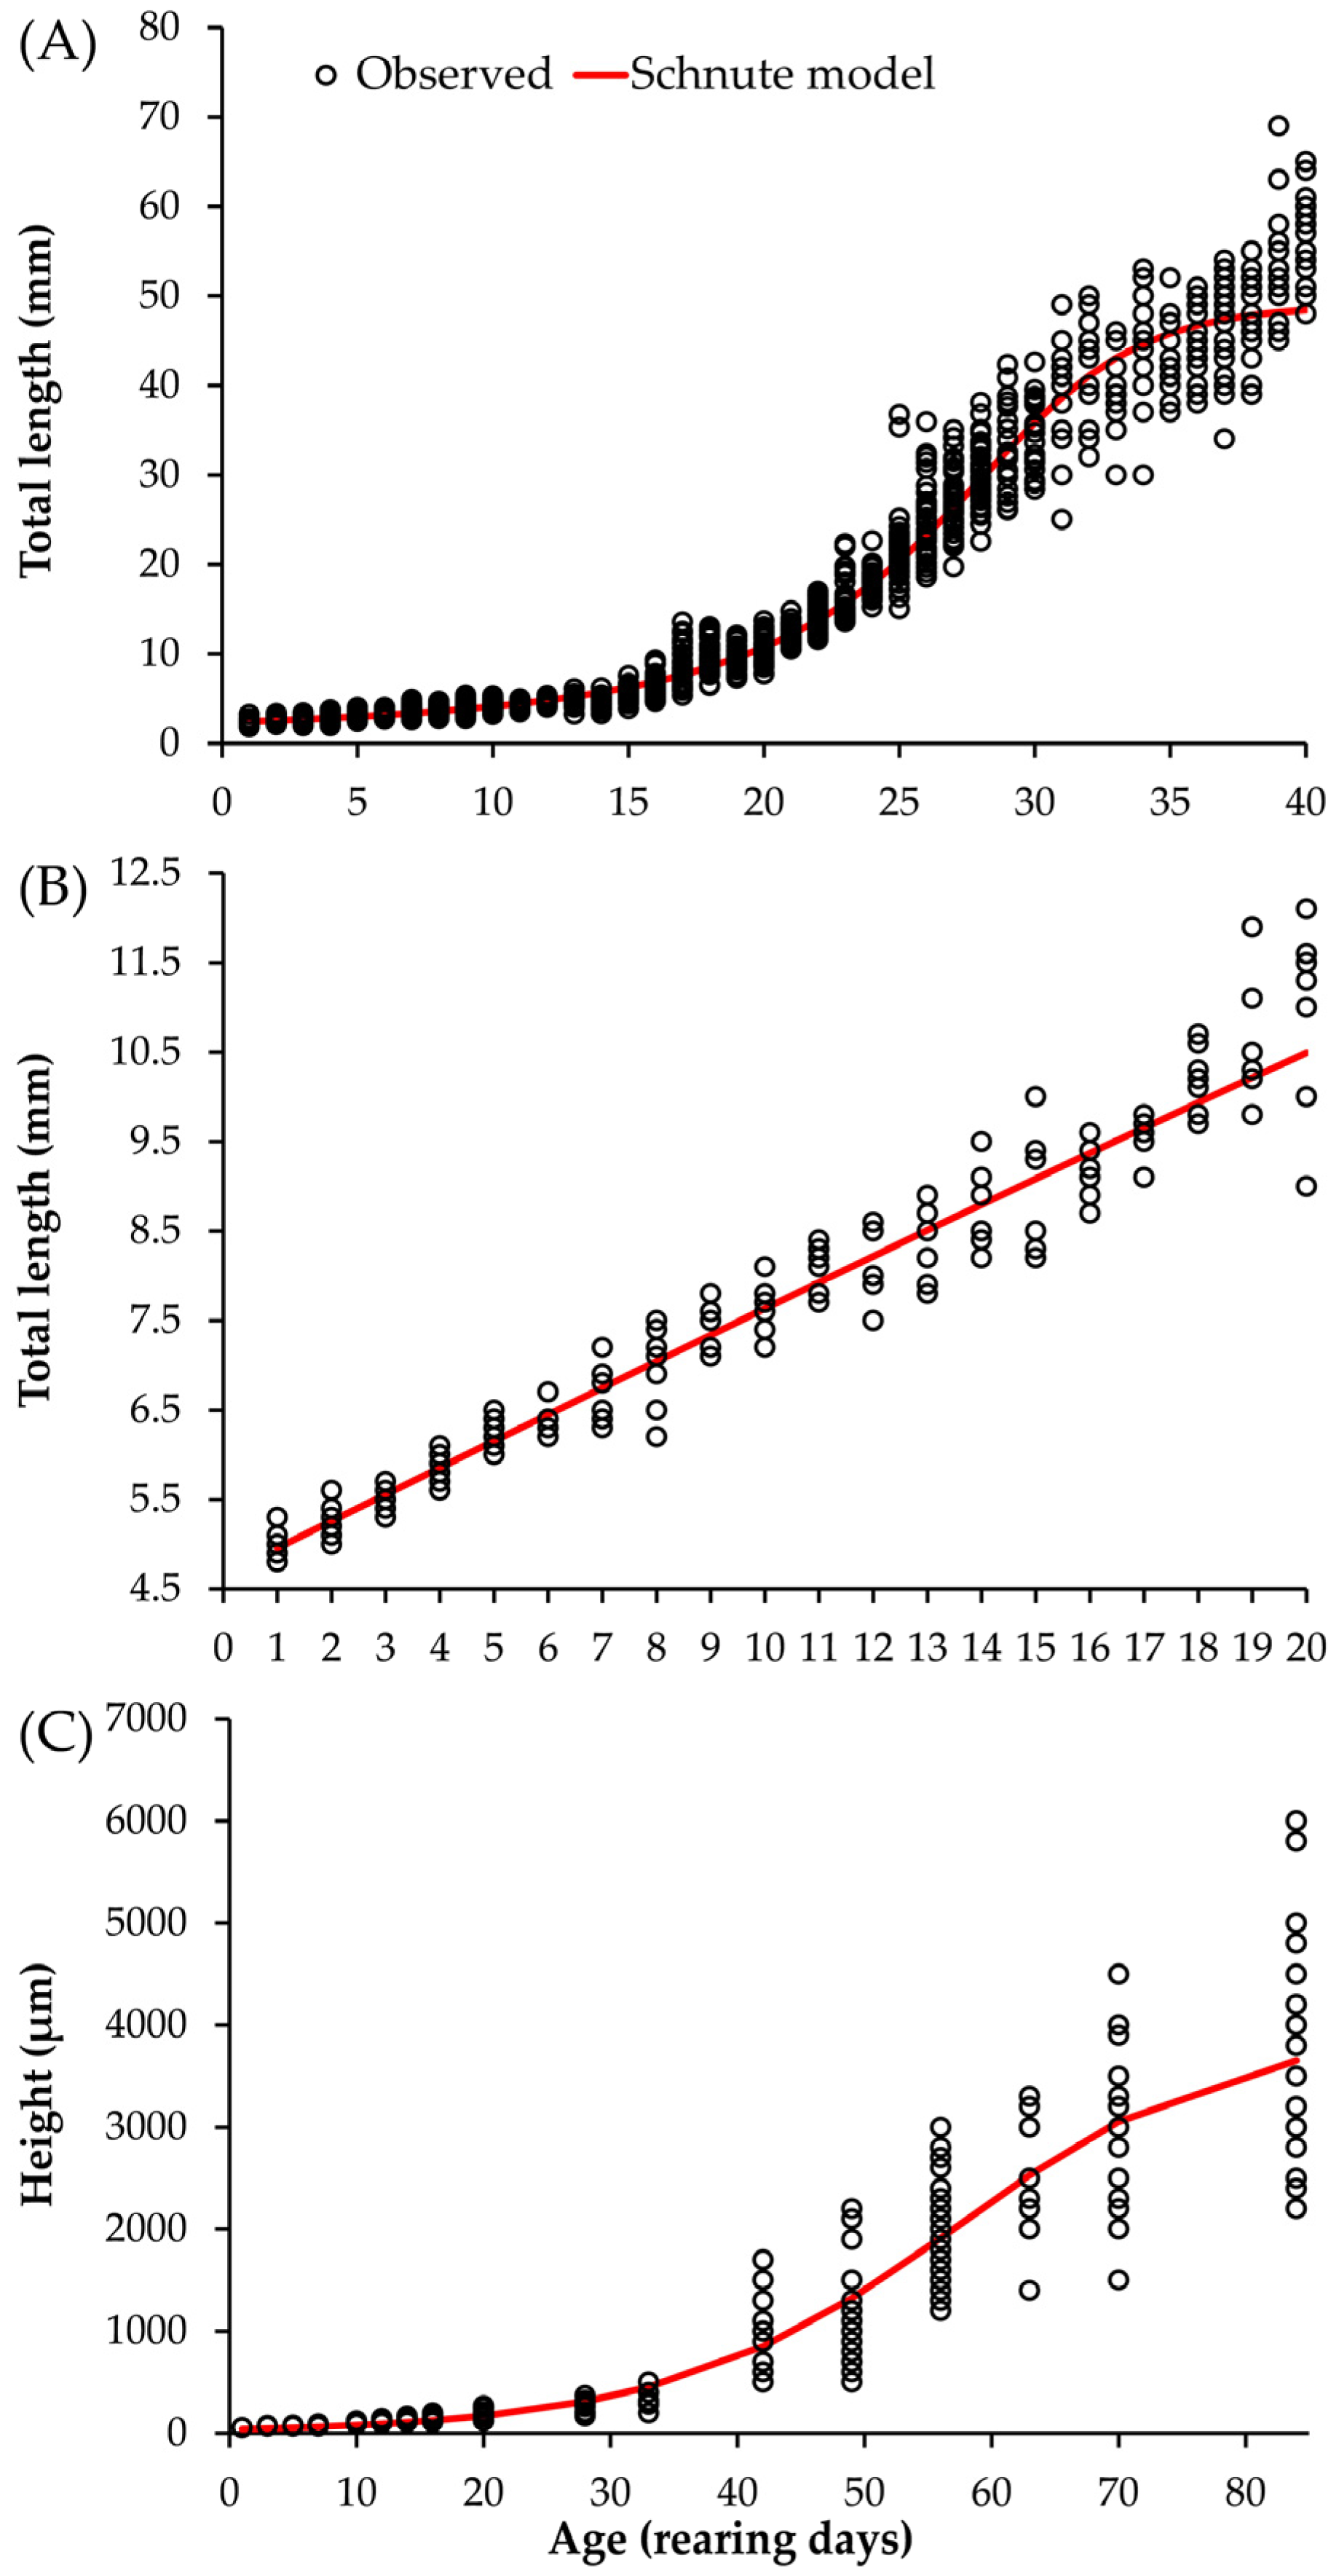
Figure 1. Observed values and growth curves of the organisms according to their age or culture periods. (A) totoaba Totoaba macdonaldi; (B) white leg shrimp Penaeus vannamei; (C) pearl oyster Pteria sterna.
Aquacj 05 00021 g001
Figure 2. Standard deviation values estimated during the individual growth experiment. (A) totoaba Totoaba macdonaldi; (B) white leg shrimp Penaeus vannamei; (C) pearl oyster Pteria sterna.
Aquacj 05 00021 g002
Figure 3. Average values and average growth curves. (A) totoaba Totoaba macdonaldi; (B) white leg shrimp Penaeus vannamei; (C) pearl oyster Pteria sterna.
Aquacj 05 00021 g003
Table 1. Choosing the best-performing residual distribution to parameterize the individual growth model of the three cultivated species.
SpeciesError
Structure
BICΔiWi (%)
TotoabaObserved47400100
Multiplicative4794540.00
Additive676420250.00
ShrimpObserved1080100
Multiplicative143350.00
Additive182740.00
Pearl oysterObserved58730100
Multiplicative5922490.00
Additive752216490.00
Table 2. Parameters estimated for each cultured species under each tested error structure using the Schnute growth model in all three species.
SpeciesError StructureY1Y2ab
TotoabaObserved0.8823.8790.367−7.012
Multiplicative0.8863.8810.374−7.183
Additive0.7433.9420.210−3.171
ShrimpObserved1.6012.3510.0241.979
Multiplicative1.6002.375−0.0706.092
Additive1.5952.383−0.1288.956
Pearl oysterObserved55.03958.90.083−1.189
Multiplicative59.63432.30.225−3.646
Additive38.83652.90.099−1.264
Disclaimer/Publisher’s Note: The statements, opinions and data contained in all publications are solely those of the individual author(s) and contributor(s) and not of MDPI and/or the editor(s). MDPI and/or the editor(s) disclaim responsibility for any injury to people or property resulting from any ideas, methods, instructions or products referred to in the content.