Article

Synergistic Microbial Interactions Between Algae and Bacteria Augment Growth and Immune Performance in Red Tilapia (Oreochromis sp.)

1
International Centre of Insect Physiology and Ecology (icipe), Nairobi P.O. Box 30772-00100, Kenya
2
Department of Animal and Fisheries Sciences, Maseno University, Maseno P.O. Box Private Bag, Kenya
3
Department of Aquaculture, Tamil Nadu Dr. J. Jayalalithaa Fisheries University (TNJFU), Nagapattinam 611002, India
4
Central Institute of Brackishwater Aquaculture, Chennai 600028, India
5
Kenya Marine and Fisheries Research Institute (KMFRI), National Aquaculture Research Development and Training Centre, Sagana P.O. Box 451-10230, Kenya
6
WorldFish, Jalan Batu Maung, Batu Maung, Bayan Lepas 11960, Malaysia
*
Authors to whom correspondence should be addressed.
Aquac. J. 2025, 5(3), 12; https://doi.org/10.3390/aquacj5030012
Submission received: 9 June 2025 / Revised: 13 August 2025 / Accepted: 19 August 2025 / Published: 25 August 2025

Abstract

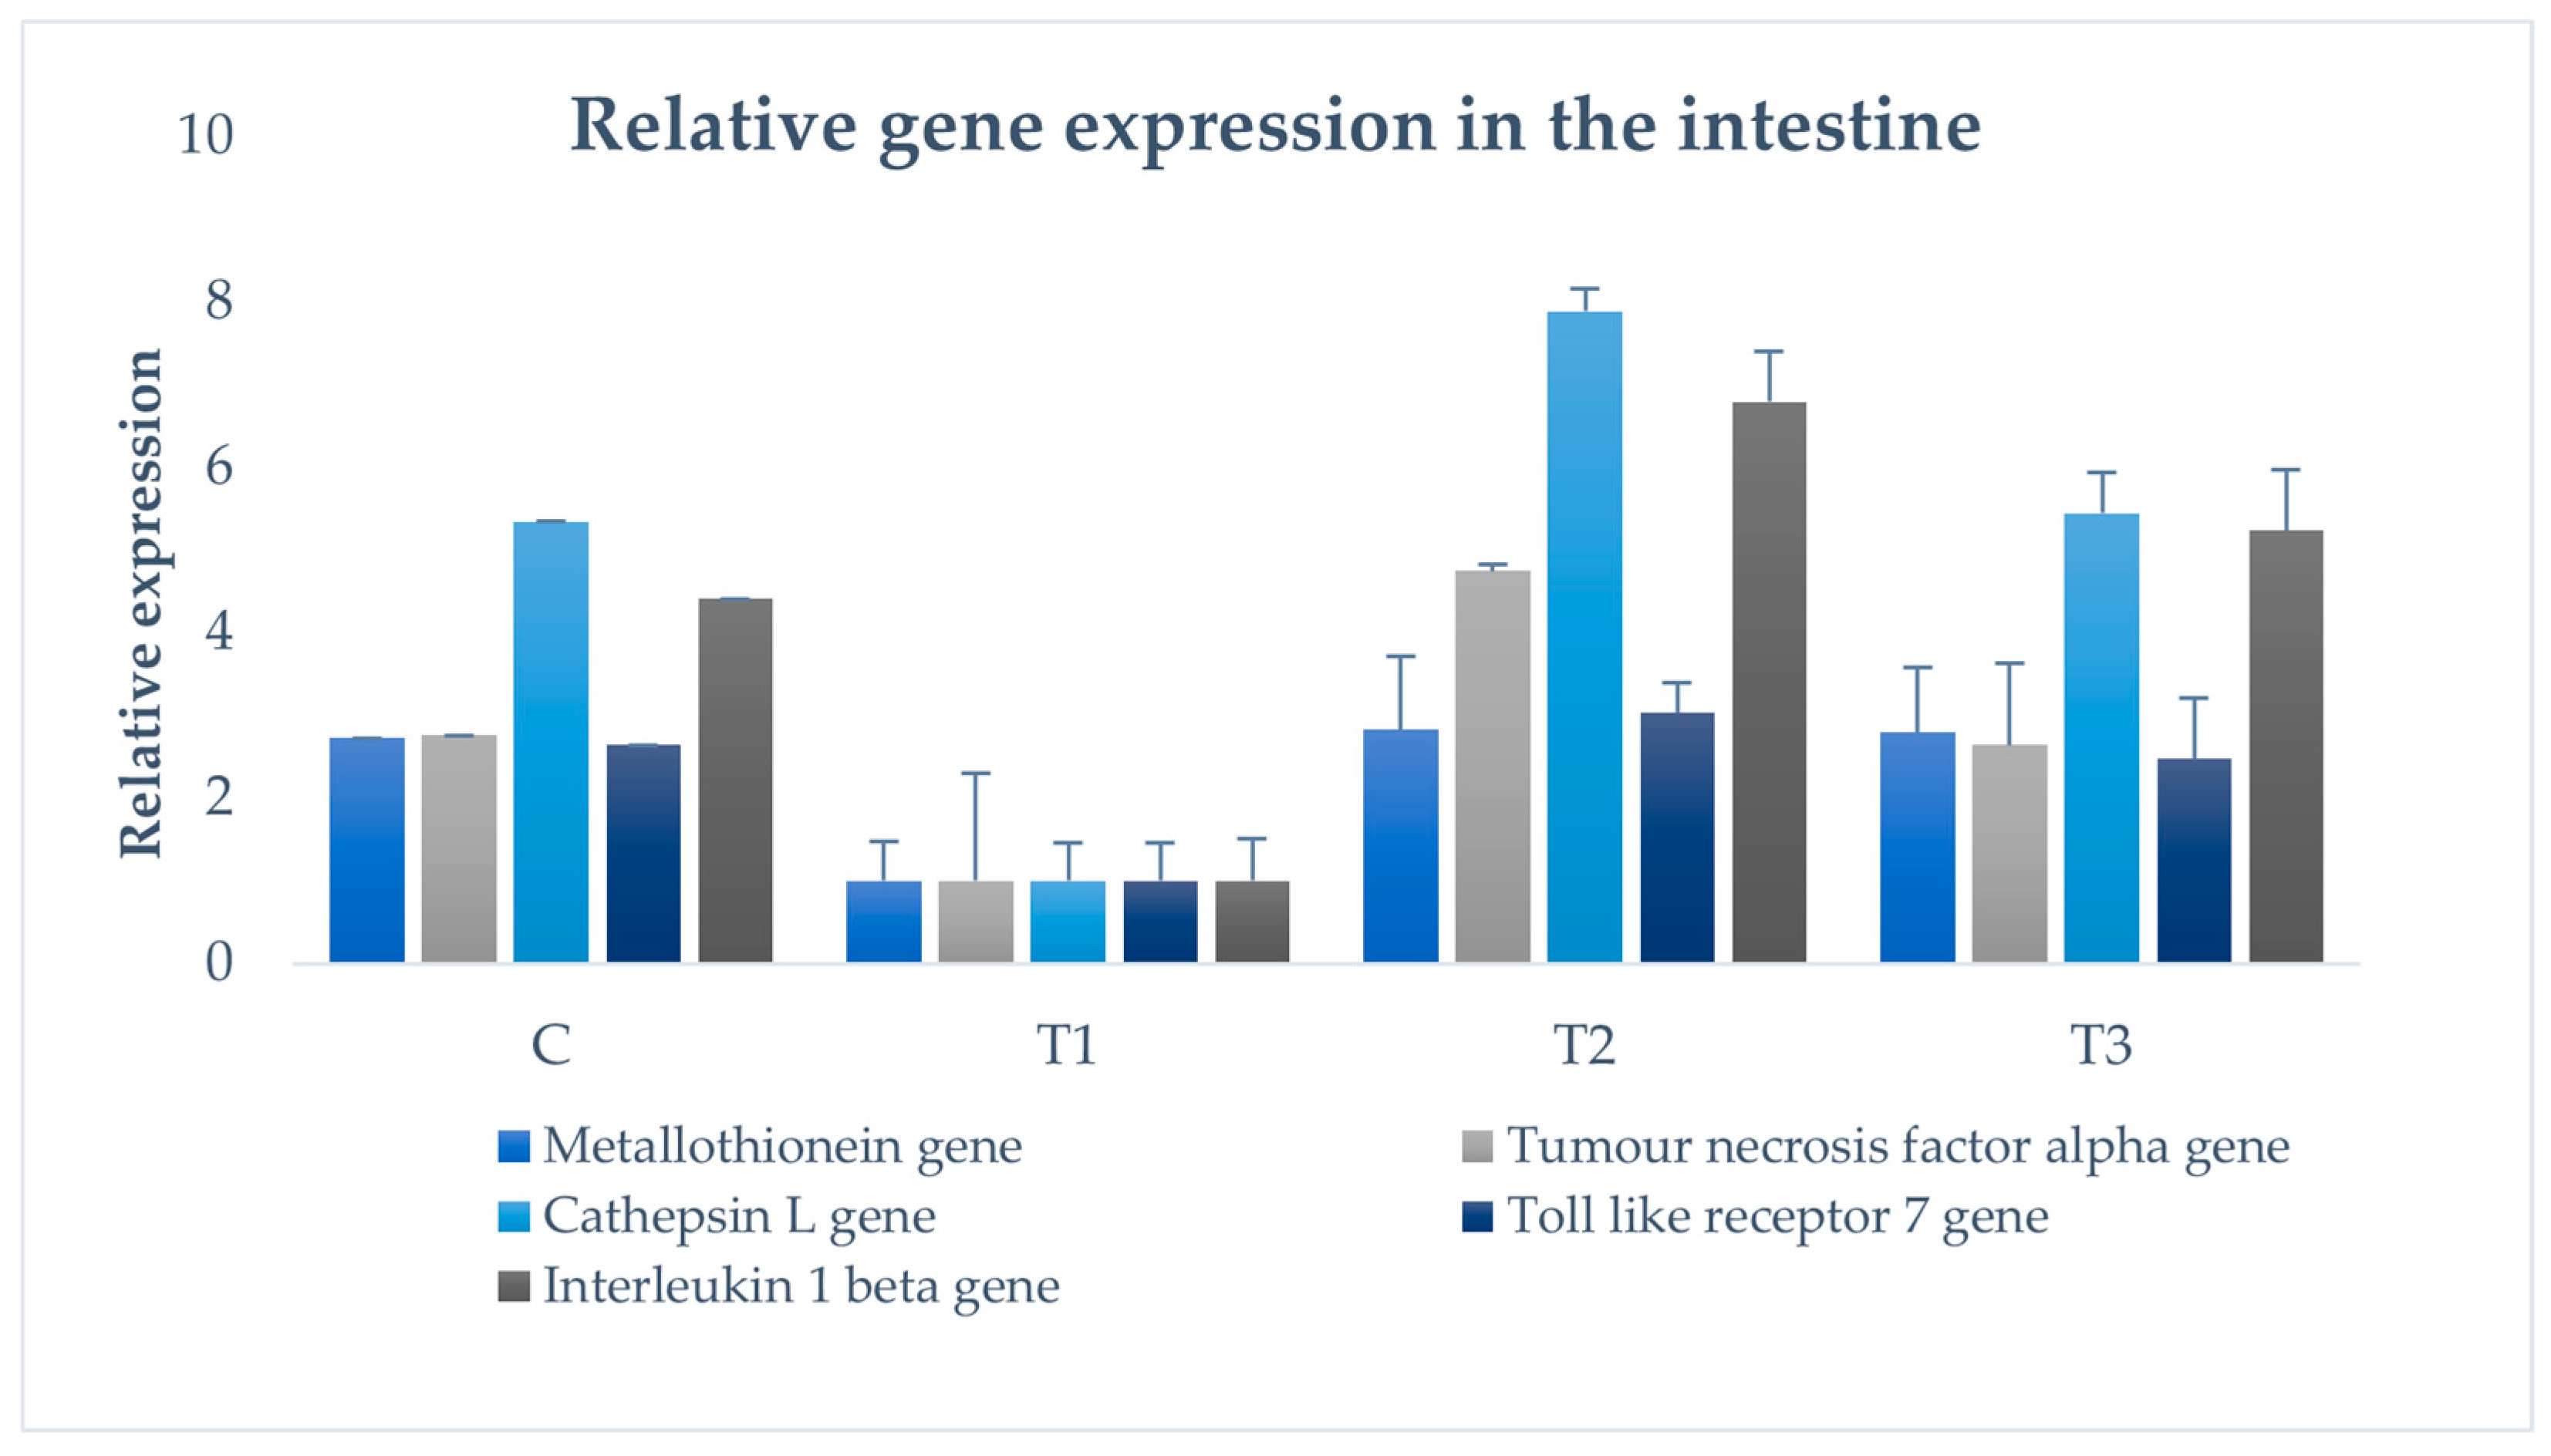
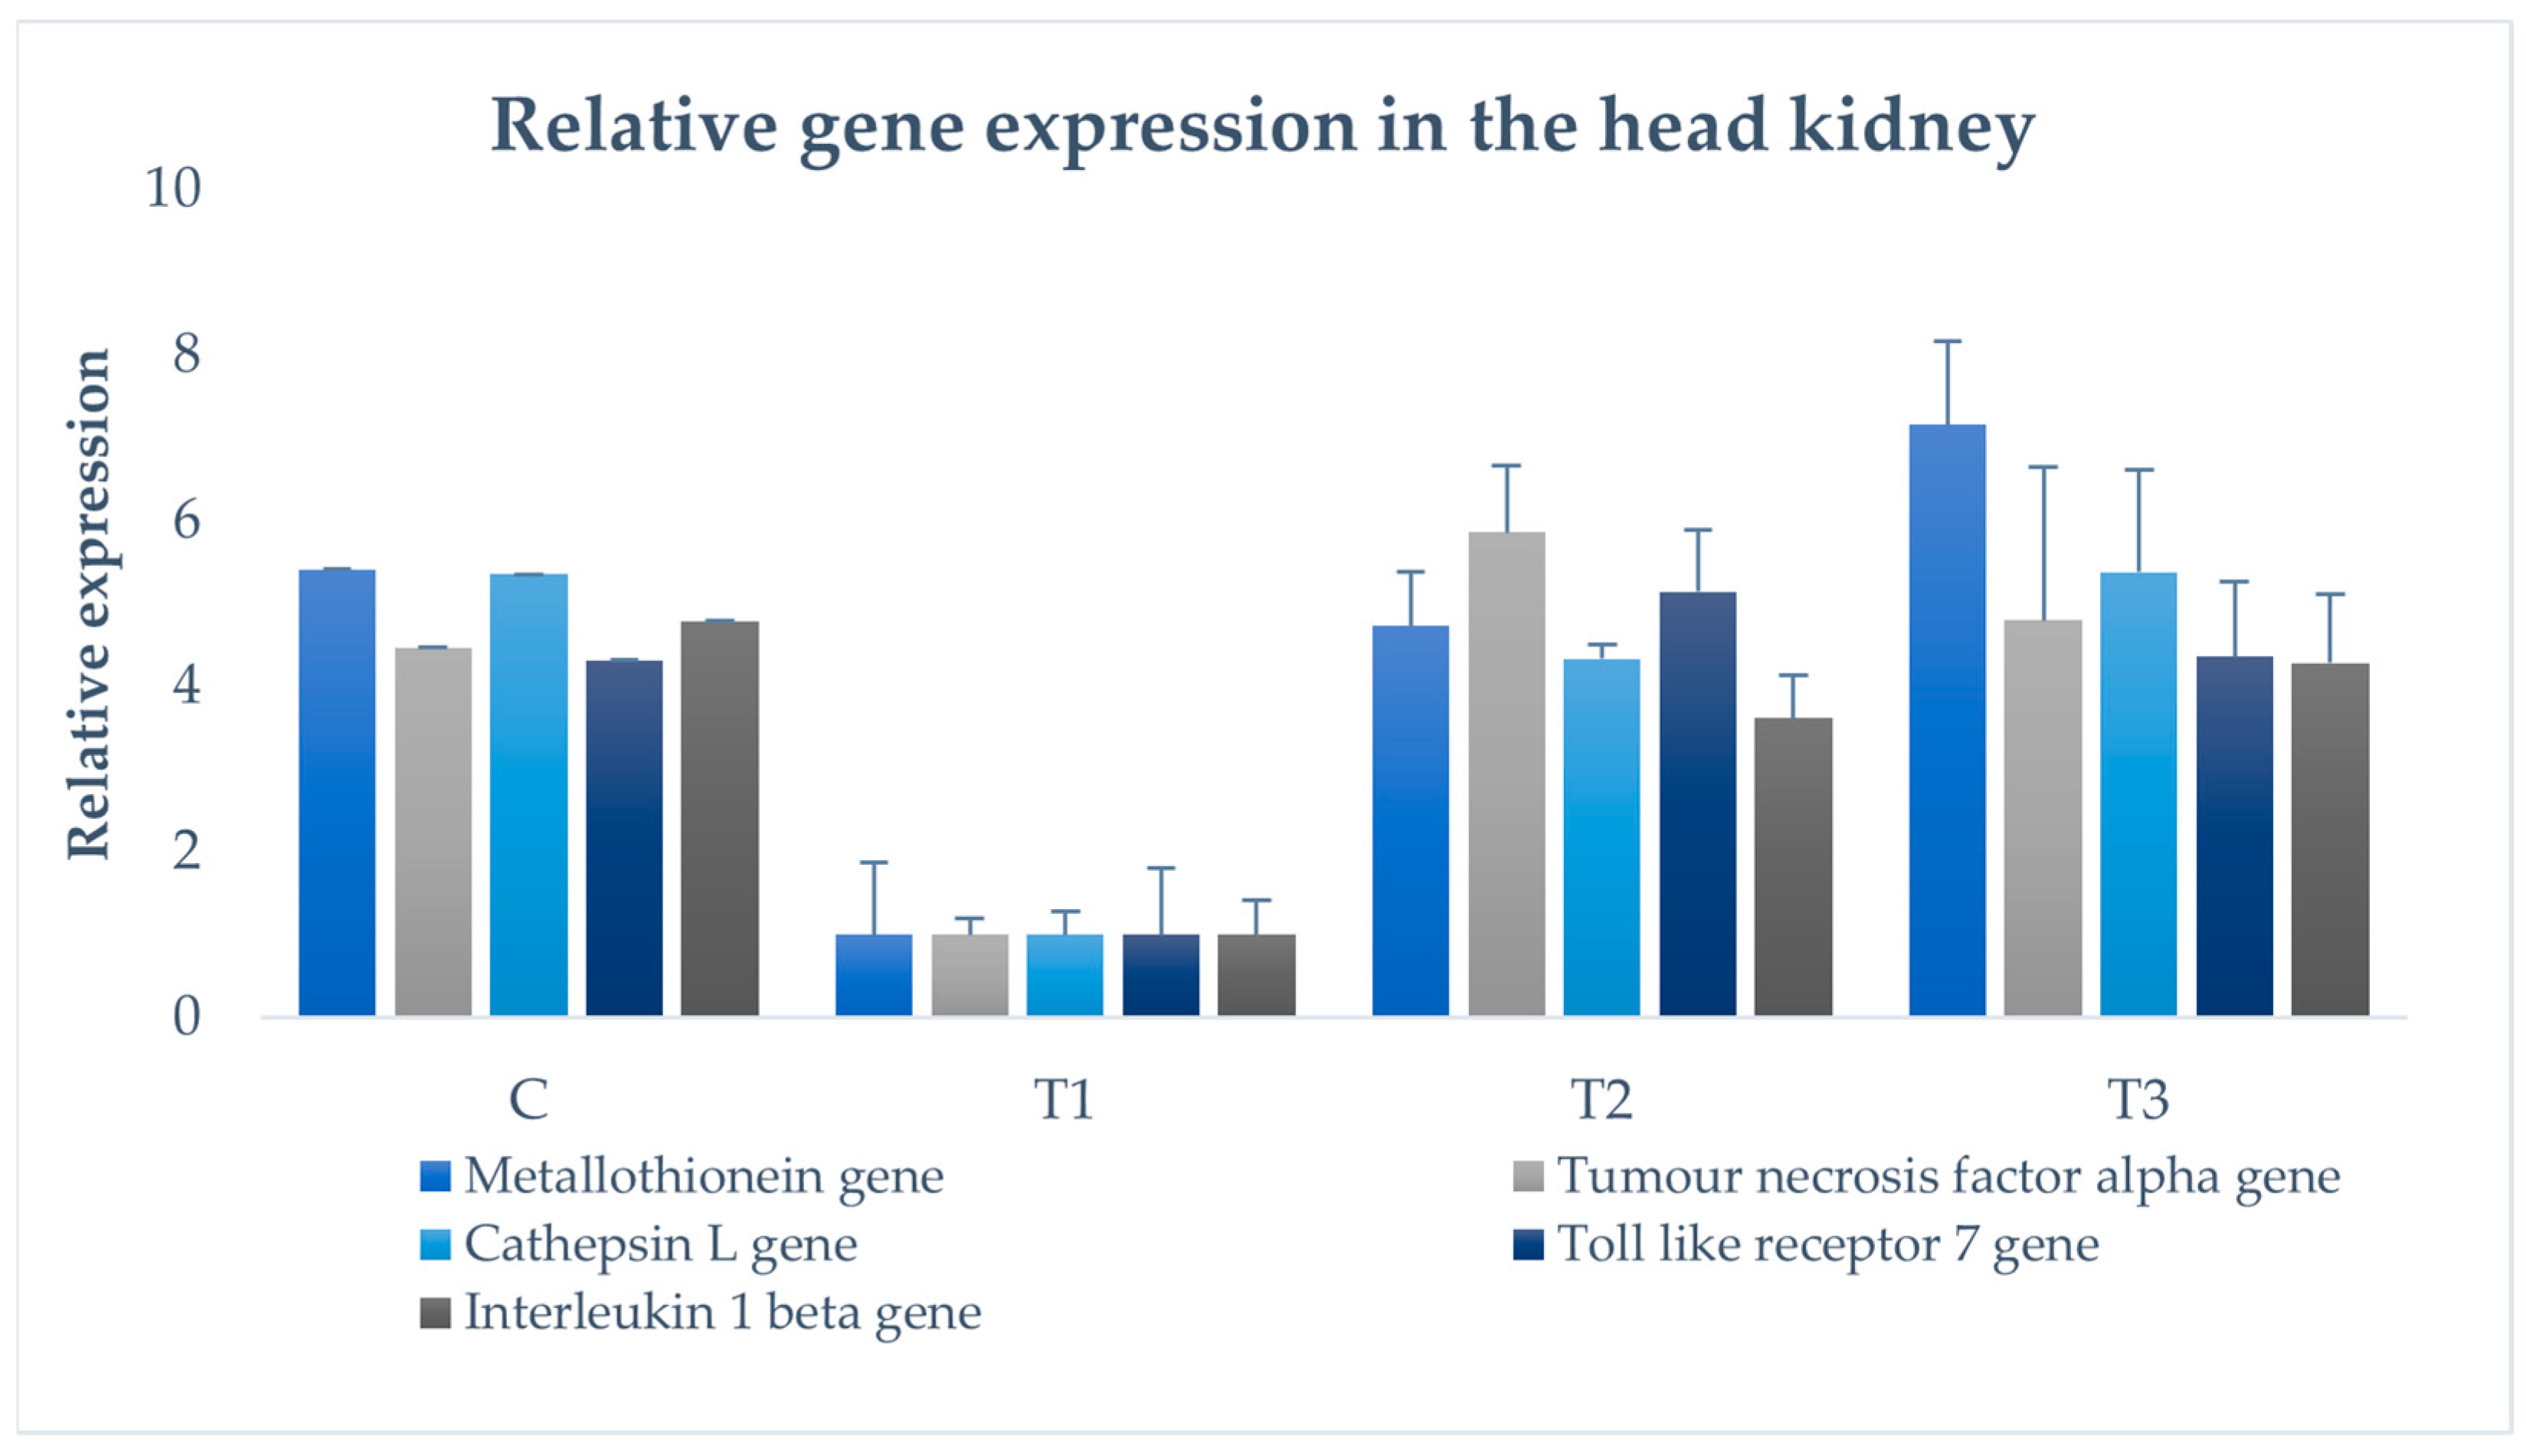
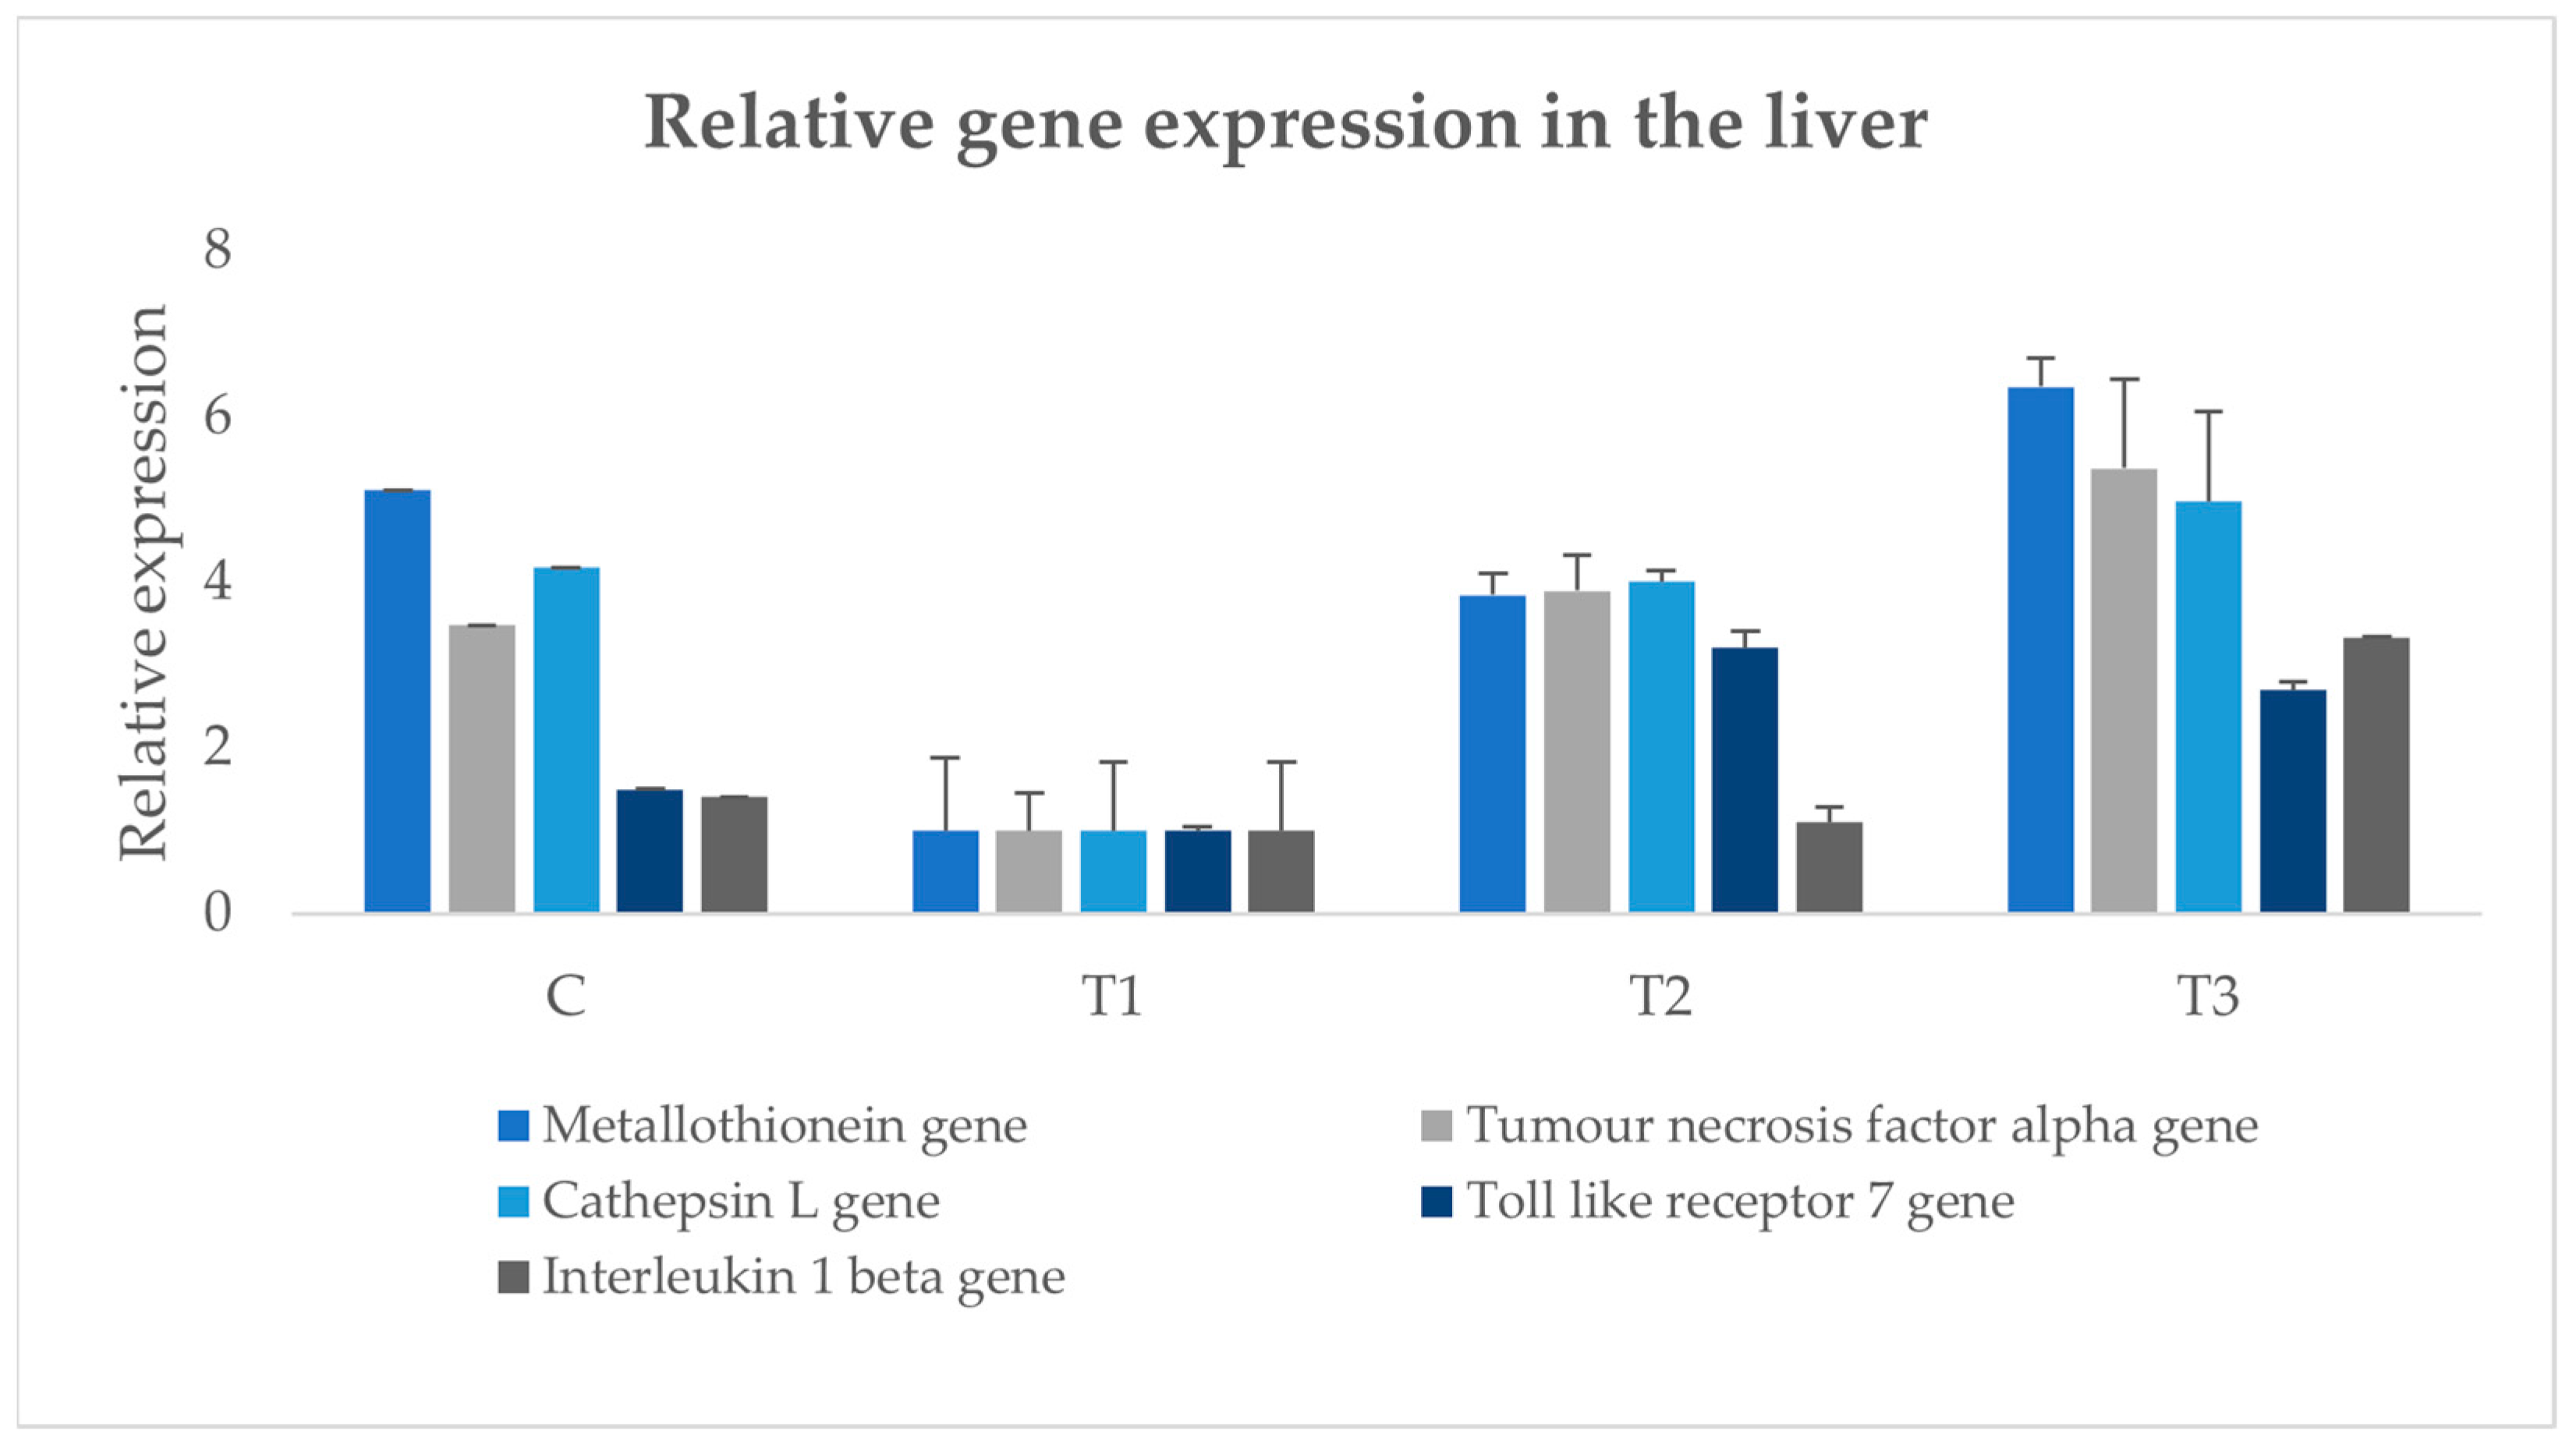
This study investigated the effects of integrating biofloc with microalgae on growth performance and immune gene expression in red tilapia (Oreochromis sp.). The experiment consisted of four treatments: C (Biofloc), T1 (Chlorella vulgaris and Nannochloropsis sp.; 1:1), T2 (Biofloc + Chlorella vulgaris and Nannochloropsis sp.; 1:1), T3 (Biofloc + Chlorella vulgaris and Nannochloropsis sp.; 2:1) in 500 L plastic tanks for 60 days. T2 and T3 exhibited the lowest ammonia and nitrite levels, respectively. T3 exhibited the highest chlorophyll a and chlorophyll b levels, while T2 showed the highest carotenoid content. T2 showed the highest weight gain (142 ± 0.7 g) and SGR (1.61 ± 0.02) and the lowest FCR (1.79 ± 0.009). T2 exhibited the highest gene expression levels in the intestine, with 7.8-fold upregulation of the cathepsin L (ctsl) gene, 3-fold upregulation of toll-like receptor 7 (tlr7), 6.7-fold upregulation of interleukin-1 b (il-1b), 4.7-fold upregulation of tumor necrosis factor-alpha (tnf-a), and 2.8-fold upregulation of metallothionein (mt). In the head kidney, the mt upregulation was highest in T3 (7.2-fold), while tnf-a and tlr7 upregulations were highest in T2 (5.9-fold and 5-fold, respectively). In the liver, the gene expressions were highest in T3, with 6.4-fold upregulation of mt, 5-fold upregulation of ctsl, 2.7-fold upregulation of tlr7, 3-fold upregulation of il-1b, and 5.4-fold upregulation of tnf-a. These results suggest a synergistic effect of algae and bacteria on immune and antioxidative capacity in red tilapia.

1. Introduction

Aquaculture intensification has emerged as the most effective solution to meet the demand for aquatic food in the last few decades. Intensive aquaculture entails high fish stocking densities and the use of large quantities of high-protein feeds to increase productivity while minimizing water and land use [1,2,3,4]. High stocking densities combined with nitrogen-rich diets in intensive fish farming often lead to poor water quality, particularly due to the buildup of inorganic nitrogen compounds such as ammonia (NH3-N) and nitrite (NO2-N) [5,6]. To maintain optimal water quality in aquaculture systems, common strategies include frequent water exchange, the application of nitrifying biofilters, and the introduction of microorganisms that utilize an external carbon source [1,7,8].
The uptake of advanced culture systems and technologies has been promoted to enhance aquaculture production and productivity [9]. Consequently, biofloc technology (BFT), an environmentally friendly aquaculture practice that promotes continuous recycling and reuse of nutrients, has been recommended. It entails growing microorganisms (including bacteria and algae) in a fish culture unit, with zero or minimal water exchange [10,11,12], hence ensuring water efficiency. Biofloc technology (BFT) has gained widespread use in enhancing shrimp and fish production, owing to its capacity to support high stocking densities, improve water quality, and simultaneously recycle nutrients by producing microbial protein within the culture system [1,13,14,15]. According to Kuhn et al. [11], incorporating microbial floc meal into the diets of tilapia and shrimp significantly enhances weight gain. Similarly, Ekasari and Maryam [16] found that BFT improves growth performance, survival rates, and feed efficiency in red tilapia (Oreochromis sp.). Biofloc technology (BFT) units as zero-exchange intensive systems utilize different carbon inputs to optimize the Carbon/Nitrogen (C/N) balance and enhance the growth of BFT microbial communities [17,18]. Moreover, the microbial biomass generated in BFT systems can be utilized as feed for the fish, helping to lower production costs, enhance immunity, and reduce mortality rates in fish [13,16,19,20,21].
Microalgae and bacteria are essential components of the biofloc systems. They influence various trophic levels along the aquatic food chain by maintaining the equilibrium of energy flow and nutrient cycles [22]. All possible beneficial relationships are covered by algae–bacteria interactions, which could either be positive or negative [23,24,25,26,27]. Three kinds of interactions exist between microalgae and bacteria, including nutrient exchange, transmission of genes, and transmission of signals [28], with the most fundamental being nutrient exchange [26,29]. Microalgae generate organic molecules and oxygen through photosynthesis, while bacteria utilize these compounds for cell formation and production of energy [30,31]. Bacteria break down organic materials, such as dead microalgae cells, which the microalgae can then reuse as growth nutrients [32]. The microalga Chlorella sorokiniana, which produces oxygen and biosurfactants to promote phenanthrene breakdown by Pseudomonas migulae, is one example of the use of algae–bacteria interactions in wastewater treatment [33]. Algae and bacteria typically interchange macronutrients like carbon and nitrogen [34,35,36] and micronutrients like vitamins [35,37]. Additionally, algal growth is stimulated by plant hormones produced by bacteria [35]. For instance, freshwater microalgae grew more rapidly when exposed to the Azospirillum sp., which is recognized as a bacterium that promotes plant growth. Conversely, inhibition results from microalgae producing toxins or antimicrobial chemicals [38].
The benefits of Chlorella and Nannochloropsis to cultured fish have been reported in previous studies [21,39,40,41,42]. For instance, Galal et al. [39] reported improved immune response and antioxidative capacity in Nile tilapia fed on a diet supplemented with C. vulgaris. Although potentially beneficial, well-engineered consortia of bacteria and microalgae are rarely used in aquaculture, and the impact of high presence of algal biomass in biofloc on fish culture has not been adequately investigated. The present study aimed to investigate the synergistic effects of microalgae, specifically Chlorella vulgaris and Nannochloropsis sp., within biofloc systems and their influence on growth and immune gene expression in red tilapia.

2. Materials and Methods

2.1. Experimental Design

Tilapia (Oreochromis sp.) fingerlings with an average initial weight of 85 ± 0.5 g were sourced from the hatchery unit of the Directorate of Sustainable Aquaculture, Dharmapuri, Tamil Nadu, India. Prior to the start of the experiment, fish were acclimated for two weeks under laboratory conditions in recirculating aquaculture systems. A total of 480 healthy fish were randomly distributed in twelve 500 L fiberglass-reinforced plastic (FRP) tanks at a stocking density of 40 fish per tank (i.e., 80 fish/m3), with three replicates per treatment. This study was conducted in a completely randomized design with four experimental groups, each in triplicate: C (Biofloc only), T1 (Chlorella and Nannochloropsis in a 1:1 ratio), T2 (Biofloc + Chlorella and Nannochloropsis, 1:1), and T3 (Biofloc + Chlorella and Nannochloropsis, 2:1) over a 60-day period. The selection of the specific ratios was guided by both previous literature and practical considerations relating to microalgal nutritional composition and compatibility in aquaculture systems. These two microalgae species are widely recognized for their beneficial effects on fish growth, immune modulation, and water quality improvement in biofloc-based systems [39,40].
The 1:1 ratio (T2) was selected as a balanced combination to evaluate the synergistic effect of both species when co-cultured with biofloc. This ratio allows for an equal representation of the functional benefits of each alga—Chlorella being rich in proteins and growth-promoting factors, and Nannochloropsis being a known source of omega-3 fatty acids and immune-stimulatory compounds [21,39,40,41,42]. The 2:1 ratio (T3) with a higher proportion of Chlorella was chosen based on preliminary findings and reports indicating its superior growth-promoting potential for tilapia due to its higher digestibility and better protein profile [39]. All tanks were maintained under natural photoperiod (12L:12D), and constant aeration was provided by diffused air through air stones connected to a centralized air blower system to ensure homogeneous mixing and optimal oxygenation. Water temperature (27.5–28.5 °C), dissolved oxygen (>5.5 mg/L), pH (7.4–7.8), and total ammonia nitrogen (<0.05 mg/L) were monitored daily using a multiparameter water quality meter (Hanna HI98194, Hanna Instruments, Woonsocket, RI, USA), and maintained within optimal ranges for tilapia culture. Fish in all treatments were fed isoenergetic and isonitrogenous diets (32% crude protein) formulated using standard fish feed ingredients. The fish were hand-fed twice daily (09:00 and 17:00 h) to apparent satiation, and the ration was adjusted biweekly based on total tank biomass.
The biofloc system in treatments C, T2, and T3 was developed by inoculating tanks with a heterotrophic microbial starter culture and adjusting the carbon-to-nitrogen (C/N) ratio to 10:1 [43,44]. A liquid organic carbon source, distillery spent wash (obtained from M/s Rajshree Biosolutions, Coimbatore, India), was used for C/N balancing. Total suspended solids (TSSs) were monitored thrice weekly and maintained within the optimal range of 200–400 mg/L through 10–15% water exchange or foam fractionation as required. Biofloc activity was periodically examined microscopically and through microbial colony counts to ensure system stability.
The microalgae Chlorella vulgaris (GenBank Accession No. GCA_023343905.1) and Nannochloropsis oculata (GenBank Accession No. GCA_004335455.1) were obtained from the algal culture repository of the Indian Council of Agricultural Research—Central Institute of Brackishwater Aquaculture (ICAR-CIBA), Chennai, India. Axenic cultures were maintained in sterile Walne’s medium at 24 ± 1 °C, under continuous illumination (100 µmol photons m−2 s−1) and constant aeration with filtered air. Algae were harvested during the exponential growth phase via centrifugation at 5000× g for 10 min. The harvested biomass was dried under controlled conditions to a constant moisture content (~10% moisture), ensuring uniformity of dosing. Dried algal biomass was dosed into the tanks at 0.75 g dry weight per liter of tank water per week, administered in two equal doses (i.e., 0.375 g/L) biweekly to maintain a steady-state concentration and minimize fluctuations in microbial dynamics. The dosing interval was chosen to match the estimated residence time and biological turnover of microbial communities in the tanks.
In T2 and T3 treatments (biofloc-algal co-cultures), algal dosing was synchronized with C/N ratio adjustments to promote balanced microbial interactions. Algal biomass quality was confirmed by measuring crude protein and chlorophyll content before dosing. The algal-bacterial synergy in co-culture systems was monitored through periodic microbial sampling.

2.2. Monitoring of Water Quality Parameters

Temperature (mercury thermometer; °C) and pH (Labtronics) were monitored daily, while dissolved oxygen (mg/L), calcium, magnesium, alkalinity, nitrite (NO2-N), and ammonia (NH4-N) were estimated on a weekly basis.

2.3. Measurement of Growth Parameters

The length and weight of the red tilapia were measured biweekly, and various growth indices were calculated as follows:
Weight gain (WG in g) = Final weight − Initial weight
Specific growth rate (%) = Ln (Final weight) − Ln (Initial weight) × 100/Number of days
Feed Conversion Ratio (FCR) = Feed given/Weight gain
Survival rate (%) = Total number of fish harvested/Total number of fish stocked × 100

2.4. Chlorophyll and Carotenoid Estimation in Water

Chlorophyll (a and b) and carotenoid concentrations in the water samples were measured at the end of the culture period. Microalgae cultures, harvested at the end of the exponential growth phase, were then analyzed. Pigment extraction followed a slightly modified version of the method described by Sartory and Grobbelaar [45]. Specifically, 2 mL of microalgal cells from each strain were centrifuged at 12,500 rpm for 5 min. The resulting pellet was resuspended in 2 mL of 90% methanol and incubated in a water bath at 64.7 °C for 5 min. This was followed by maceration in the dark for 20 h. The samples were then centrifuged again at 12,500 rpm for 5 min, and the supernatant was collected for analysis. Absorbance was measured using a UV-Vis spectrophotometer at wavelengths of 470 nm, 652.4 nm, and 665.2 nm, using methanol as the blank.
The concentrations of chlorophyll a, chlorophyll b, and total carotenoids were calculated using the equations reported by Sumanta et al. [46] as follows:
Chlorophyll a (Ch-a) = 16.72 (A665.2) − 9.16 (A652.4)
Chlorophyll b (Ch-b) = 34.09 (A652.4) − 15.28 (A665.2)
Total carotenoid content = [1000(A470) − 1.63Ch-a − 104.96Ch-b]/221

2.5. Carotenoid Estimation in Tissues

At the end of the trial, three fish per replicate were euthanized with an overdose of MS-222 (200 mg/L), and dorsal skin samples (~1 g) were collected, rinsed, and stored at −20 °C. Carotenoids were extracted from the fish skin, and the total carotenoid concentration (TCC) was estimated following the method by Olson and Lakshman [47]. Thawed samples were homogenized in 10 mL of 90% acetone and centrifuged at 5000× g for 10 min at 4 °C, after which the supernatant was collected. The extraction was repeated twice, and the pooled extracts were filtered.
Absorbance was measured at 450 nm using a UV-Vis spectrophotometer against a 90% acetone blank. Carotenoid concentration was calculated using the formula:
TCC (µg/g) = A450 × V × 106
2500 × W
where A450 = absorbance at 450 nm, V = volume (mL), W = sample weight (mg), and 2500 is the extinction coefficient for β-carotene in acetone. Results were expressed as µg/g of fresh tissue.

2.6. Measurement of Floc and Sludge Parameters

The floc and sludge parameters measured included the floc/sludge volume (FV/SV), floc/sludge concentration (TSS), floc/sludge porosity, floc/sludge volume index (FVI/SVI), floc/sludge density index (FDI/SDI), and volatile suspended solids (VSSs). Floc/sludge volume was determined using an Imhoff cone. Water samples were collected from the treatments and allowed to stand undisturbed for 20 min to enable the suspended particles to settle. The volume accumulated at the bottom of the cone was then recorded as the floc/sludge volume [1]. Floc/sludge porosity was calculated according to the method by Li and Ganczarczyk [48]. It was calculated by dividing the floc/sludge (FV/SV) by the volume of water (WV) and expressed as a percentage (%).
Porosity = (1 − FV/WV) × 100/(1 − SV/WV) × 100
To measure floc/sludge concentration (TSS), a known volume of the sample was filtered through a pre-weighed 0.45 µm Millipore filter paper using a vacuum filtration pump. After filtration, the filter paper containing the retained residue was dried in a hot air oven at 105 °C, then cooled in a desiccator and weighed. The TSS concentration was determined by calculating the weight difference of the filter paper before and after filtration [49].
Floc/sludge volume index was calculated using floc/sludge volume and floc/sludge concentration [50] as follows:
Floc volume index (FVI) = Floc volume (mL)/Floc concentration (g)
Sludge volume index (SVI) = Sludge volume (mL)/Sludge concentration (g)
The floc/sludge density index represents the mass (in grams) of floc or sludge occupying 100 mL of volume after 20 min of settling. It was derived based on the floc/sludge volume index.
Floc density index (FDI) = 100/FVI
Sludge density index (SDI) = 100/SVI
Volatile suspended solids (VSSs) were determined using the residues collected on the dried filter paper from the floc/sludge concentration analysis. The residue was transferred to a pre-weighed silica crucible, then ignited in a muffle furnace at 550 °C for 15 to 20 min. After ignition, the crucible was cooled in a desiccator and reweighed. The difference in weight before and after ignition represented the amount of volatile suspended solids.

2.7. Total Bacterial Count and Algal Count

Total bacterial count was estimated on a weekly basis as per Bergey’s manual of systematic bacteriology [51]. The total algal count was measured on a weekly basis by counting the number of cells per mL with a hemocytometer [52]. Both the bacterial and algal counts were calculated in colony-forming units (CFUs) and expressed as Log CFU/mL.

2.8. Examination of Immune Gene Expression

The immune-related genes in the head kidney, liver, and intestine of the experimental fish were examined for each treatment. For RNA isolation, fish tissue samples were homogenized in TRI Reagent® solution, and the extracted RNA was then kept for later use at −20 °C. Using the primers listed in Table 1, the extracted RNA was transformed into cDNA and examined for tumor necrosis factor-alpha (tnf-a), metallothionein (mt), toll-like receptor 7 (tlr7), cathepsin L (ctsl), and interleukin-1 β (il-1b).
The cDNA synthesized via reverse transcriptase PCR was serially diluted and used for amplification and melt curve analysis. Relative quantification of the target genes was conducted using real-time PCR (qRT-PCR) with the Applied Biosystems StepOnePlus® Real-Time PCR System. The two-step PCR thermal cycling conditions included an initial denaturation at 95 °C for 10 min, followed by 45 cycles of denaturation at 95 °C for 15 s and annealing/extension at 60 °C for 1 min. Each PCR reaction was carried out in a total volume of 20 μL, consisting of 10 μL of 2X SYBR® Green qPCR Master Mix (Bio-Rad, Hercules, CA, USA), 1 μL each of forward and reverse primers (10 pmol), 1 μL of template DNA (30–60 ng), and 7 μL of nuclease-free water. All samples were analyzed in triplicate, and relative gene expression levels were calculated using the comparative threshold cycle (2−ΔΔCT) method, with β-actin and 18S rRNA serving as internal reference genes [53].

2.9. Pathogen Challenge of Experimental Fish Against Aeromonas Hydrophila

The challenge was conducted as per the national regulations for the use of animals. At the end of the culture duration before the challenge, Aeromonas hydrophila, obtained from the state referral laboratory in Tamil Nadu Dr. J. Jayalalithaa Fisheries University, was administered to a randomly selected assortment of 120 fish from all the treatments (30 fish per treatment). The pathogen was administered at four different dosages (104, 105, 106, and 107 CFU/mL/fish), which were used as the treatments for the fish (10 fish per replicate) to determine the dosage at which they would least survive. A low relative percentage survival (RPS) was recorded in tilapia subjected to bacteria at the dosage of 107 CFU/mL/fish. Based on these results, an experimental bacterial dosage of 107 CFU/mL/fish was arrived at.
For the actual pathogen challenge, ten (10) fish from each experimental treatment were transferred into 500 L FRP tanks in triplicate. The fish were subjected to the Aeromonas hydrophila at the dosage of 107 CFU/mL/fish for 14 days to observe their survival. The isolate was cultured in tryptic soy broth (TSB; Hi-Media, Thane, India) for 24 h at 30–31 °C, then centrifuged at 10,000 rpm for 10 min. The resulting pellet was resuspended in phosphate-buffered saline (PBS; pH 7.2). A 0.1 mL volume of this sterile PBS suspension was intramuscularly injected into tilapia [54] from all treatment groups, at a concentration of 107 CFU/mL per fish. Cumulative mortality of the subjected fish was recorded daily, and RPS was calculated following Amend’s method [55], using the following formula:
RPS (in %) = 1 − (% treatment mortality/% control mortality) × 100

2.10. Statistical Analysis

One-way ANOVA was conducted using SPSS version 20.0 to determine significant differences among the treatments and the control for immunological parameters, antioxidant status, growth performance, and RPS. Post hoc comparisons were carried out using Duncan’s Multiple Range Test at a 5% significance level.

3. Results

3.1. Water Quality Parameters

The pH was lowest in T1 (6.71 ± 0.007), where ammonia content was highest (0.031 ± 0.007 mg/L), with no significant difference among the treatments (p > 0.05), as shown in Table 2. Additionally, the calcium (70.50 ± 0.707 mg/L) and magnesium (52.55 ± 0.070 mg/L) levels were significantly lower in T1 (p < 0.05) than in the other treatments. There were no significant differences in pH, ammonia, temperature, nitrite, and DO levels among the treatments (p > 0.05).

3.2. Growth Parameters

There was no significant difference in the initial mean weights and all the growth parameters of the fish in the different treatments (p > 0.05), as shown in Table 3. Among the treatments, T2 showed the highest weight gain (142 ± 0.7 g), the highest SGR (1.61 ± 0.02), and the lowest FCR (1.79 ± 0.009).

3.3. Chlorophyll and Carotenoid Level

Chlorophyll a and b were highest in T3, while both carotenoids in water and in tissue were highest in T2 (Table 4). For chlorophyll a, the level was lowest (0.45%) in C and highest in T3 (0.68%). T2 and T3 had significantly higher chlorophyll a levels than both C and T1 (p < 0.05). A similar pattern was observed with chlorophyll b. The level was lowest (1.21%) in the C and highest in T3 (1.75%). Similarly, T2 and T3 had significantly higher chlorophyll b levels compared to C and T1 (p < 0.05). Both the carotenoid content in water (0.4 ± 0.01) and the carotenoid content in tissue (37.6 ± 0.56) were highest in T2, with no significant differences among the treatments (p > 0.05).

3.4. Floc Characteristics

Control (C) consistently exhibited the highest floc volume across all measured time points (15, 30, 45, and 60 days), as illustrated in Figure 1. Starting from 37.5 mL/L at 15 days, the floc volume in C increased steadily, reaching 61.5 mL/L by day 60. In contrast, the treatment groups T2 and T3 displayed lower floc volumes throughout the experiment. Although there was an upward trend in floc volume for these groups, their values remained significantly lower than those of C at each time point. The floc volumes of C were significantly higher, while the floc volumes of T1 were significantly lower than those of T2 and T3 (p < 0.05), which were not significantly different from each other (p > 0.05).
T1 showed the highest levels of TSS, beginning at 0.36 g/L at 15 days and constantly increasing to 0.62 g/L by day 60. T3, however, had the lowest TSS levels, starting at 0.03 g/L and reaching 0.08 g/L at 60 days. The TSS in T3 was significantly lower than C, T1, and T3 at all time points (p < 0.05). T3 showed the highest VSS levels, particularly noticeable at the 60-day mark, where it peaked at 1.69 g/L. T1 had significantly lower VSS levels (p < 0.05) than C, T2, and T3, which had no significant difference in VSS levels (p > 0.05). The FVI values for T3 were significantly higher than those for C, T1, and T2 at all time points (p < 0.05), peaking at 481 mL/g on day 60. In contrast, the FVI values for C, T1, and T2 showed no increase over time, remaining below 200 mL/g.
The FDI values for C constantly improved over time from 0.64 g/mL at day 15 to 0.81 g/mL at day 60. The FDI values for T1 were consistently high and steadily increased from 0.79 to 0.87 g/mL. However, T3 displayed significantly lower FDI values than the other treatments (p < 0.05). Control (C) exhibited the highest porosity values, starting at 37.5% on day 15 and increasing to 61.5% by day 60. T1 showed moderate porosity values, which were consistently lower than those of C but higher than those of T2 and T3. T3 had the lowest porosity but showed an increasing trend over time, reaching 48% by day 60. There were significant differences in porosity between the treatments (p < 0.05), with C consistently showing the highest porosity.

3.5. Sludge Characteristics

Sludge volume (SV) was highest in C (58 ± 2.82 mL/L) and lowest in T3 (19.5 ± 0.707 mL/L), as shown in Table 5. Similarly, SVI showed the highest value in C (319 ± 9.89 mL/g) and the lowest in T3 (100 ± 10.60 mL/g). The SDI followed an opposite trend, with the highest density in T3 (0.099 ± 0.001 g/mL) and the lowest in C (0.031 ± 0.001 g/mL). Sludge porosity was highest in C (60 ± 0.002%) and lowest in T3 (19 ± 0.007%). Total suspended solids (TSSs) were highest in T3 (0.31 ± 0.014 g/L) and lowest in T2 (0.025 ± 0.007 g/L), and VSS were highest in T2 (1.77 ± 0.04 g/L) and lowest in C (1.2 ± 0.07 g/L).

3.6. Total Bacterial Count

At the onset (7th day), T3 had the highest bacterial count (546 ± 9.33 CFU/mL), while T1 had the lowest (220 ± 8.85 CFU/mL), as summarized in Table 6. Control (C) peaked significantly by the 28th day (1057.5 ± 18.89 CFU/mL), whereas T1 peaked at the 35th day (698 ± 77.78 CFU/mL). T2 and T3 also showed distinct peak periods, with T2 peaking at the 28th day (960 ± 48.52 CFU/mL) and T3 at the 14th day (876 ± 79.19 CFU/mL). By the 60th day, all treatments showed decreased bacterial populations compared to their respective peaks. Control (C) retained the highest population (340 ± 45.8 CFU/mL).

3.7. Total Algal Count

Initially, T1 showed the highest algal population (270 ± 28.28 CFU/mL), which increased significantly by the 21st day (21,500 ± 1202.08 CFU/mL), as shown in Table 7. T2 gradually increased by the 21st day. Control (C) had the lowest algal count, which gradually decreased throughout the experiment. The algal population in T1 peaked at 19,750 CFU/mL by the 60th day, maintaining a consistently high level throughout this study period. T2 reached its peak by the 35th day but then declined sharply by the 56th day and slightly reduced by the 60th day. T3 showed a gradual increase, peaking at 39,375 CFU/mL by the 35th day and stabilizing around 9565 CFU/mL by the 60th day.

3.8. Immune Gene Expression

The relative mRNA expression of the target genes in the intestine was all upregulated (Figure 2). The gene expressions were highest in T2, with 7.8-fold upregulation of the ctsl gene, threefold upregulation of tlr7, 6.7-fold upregulation of il-1b, and 4.7-fold upregulation of tnf-a. Metallothionein (mt) gene expression was relatively low across all the treatments and similar in C, T2, and T3, with nearly threefold upregulation.
The relative mRNA expression of the target genes in the head kidney was all upregulated (Figure 3). The mt upregulation was highest in T3 (7.2-fold), while tnf-a and tlr7 upregulations were highest in T2 (5.9-fold and 5-fold, respectively). The ctsl upregulation was highest in C and T3, with both having a 5.4-fold upregulation, and il-1b upregulation was highest in C (4.8-fold).
The relative mRNA expression of the target genes in the liver was all upregulated (Figure 4). The gene expressions were highest in T3, with 5-fold upregulation of the ctsl gene, 2.7-fold upregulation of tlr7, threefold upregulation of il-1b, 5.4-fold upregulation of tnf-a, and 6.4-fold upregulation of mt.

3.9. Challenge of the Experimental Fish Against Aeromonas Hydrophila

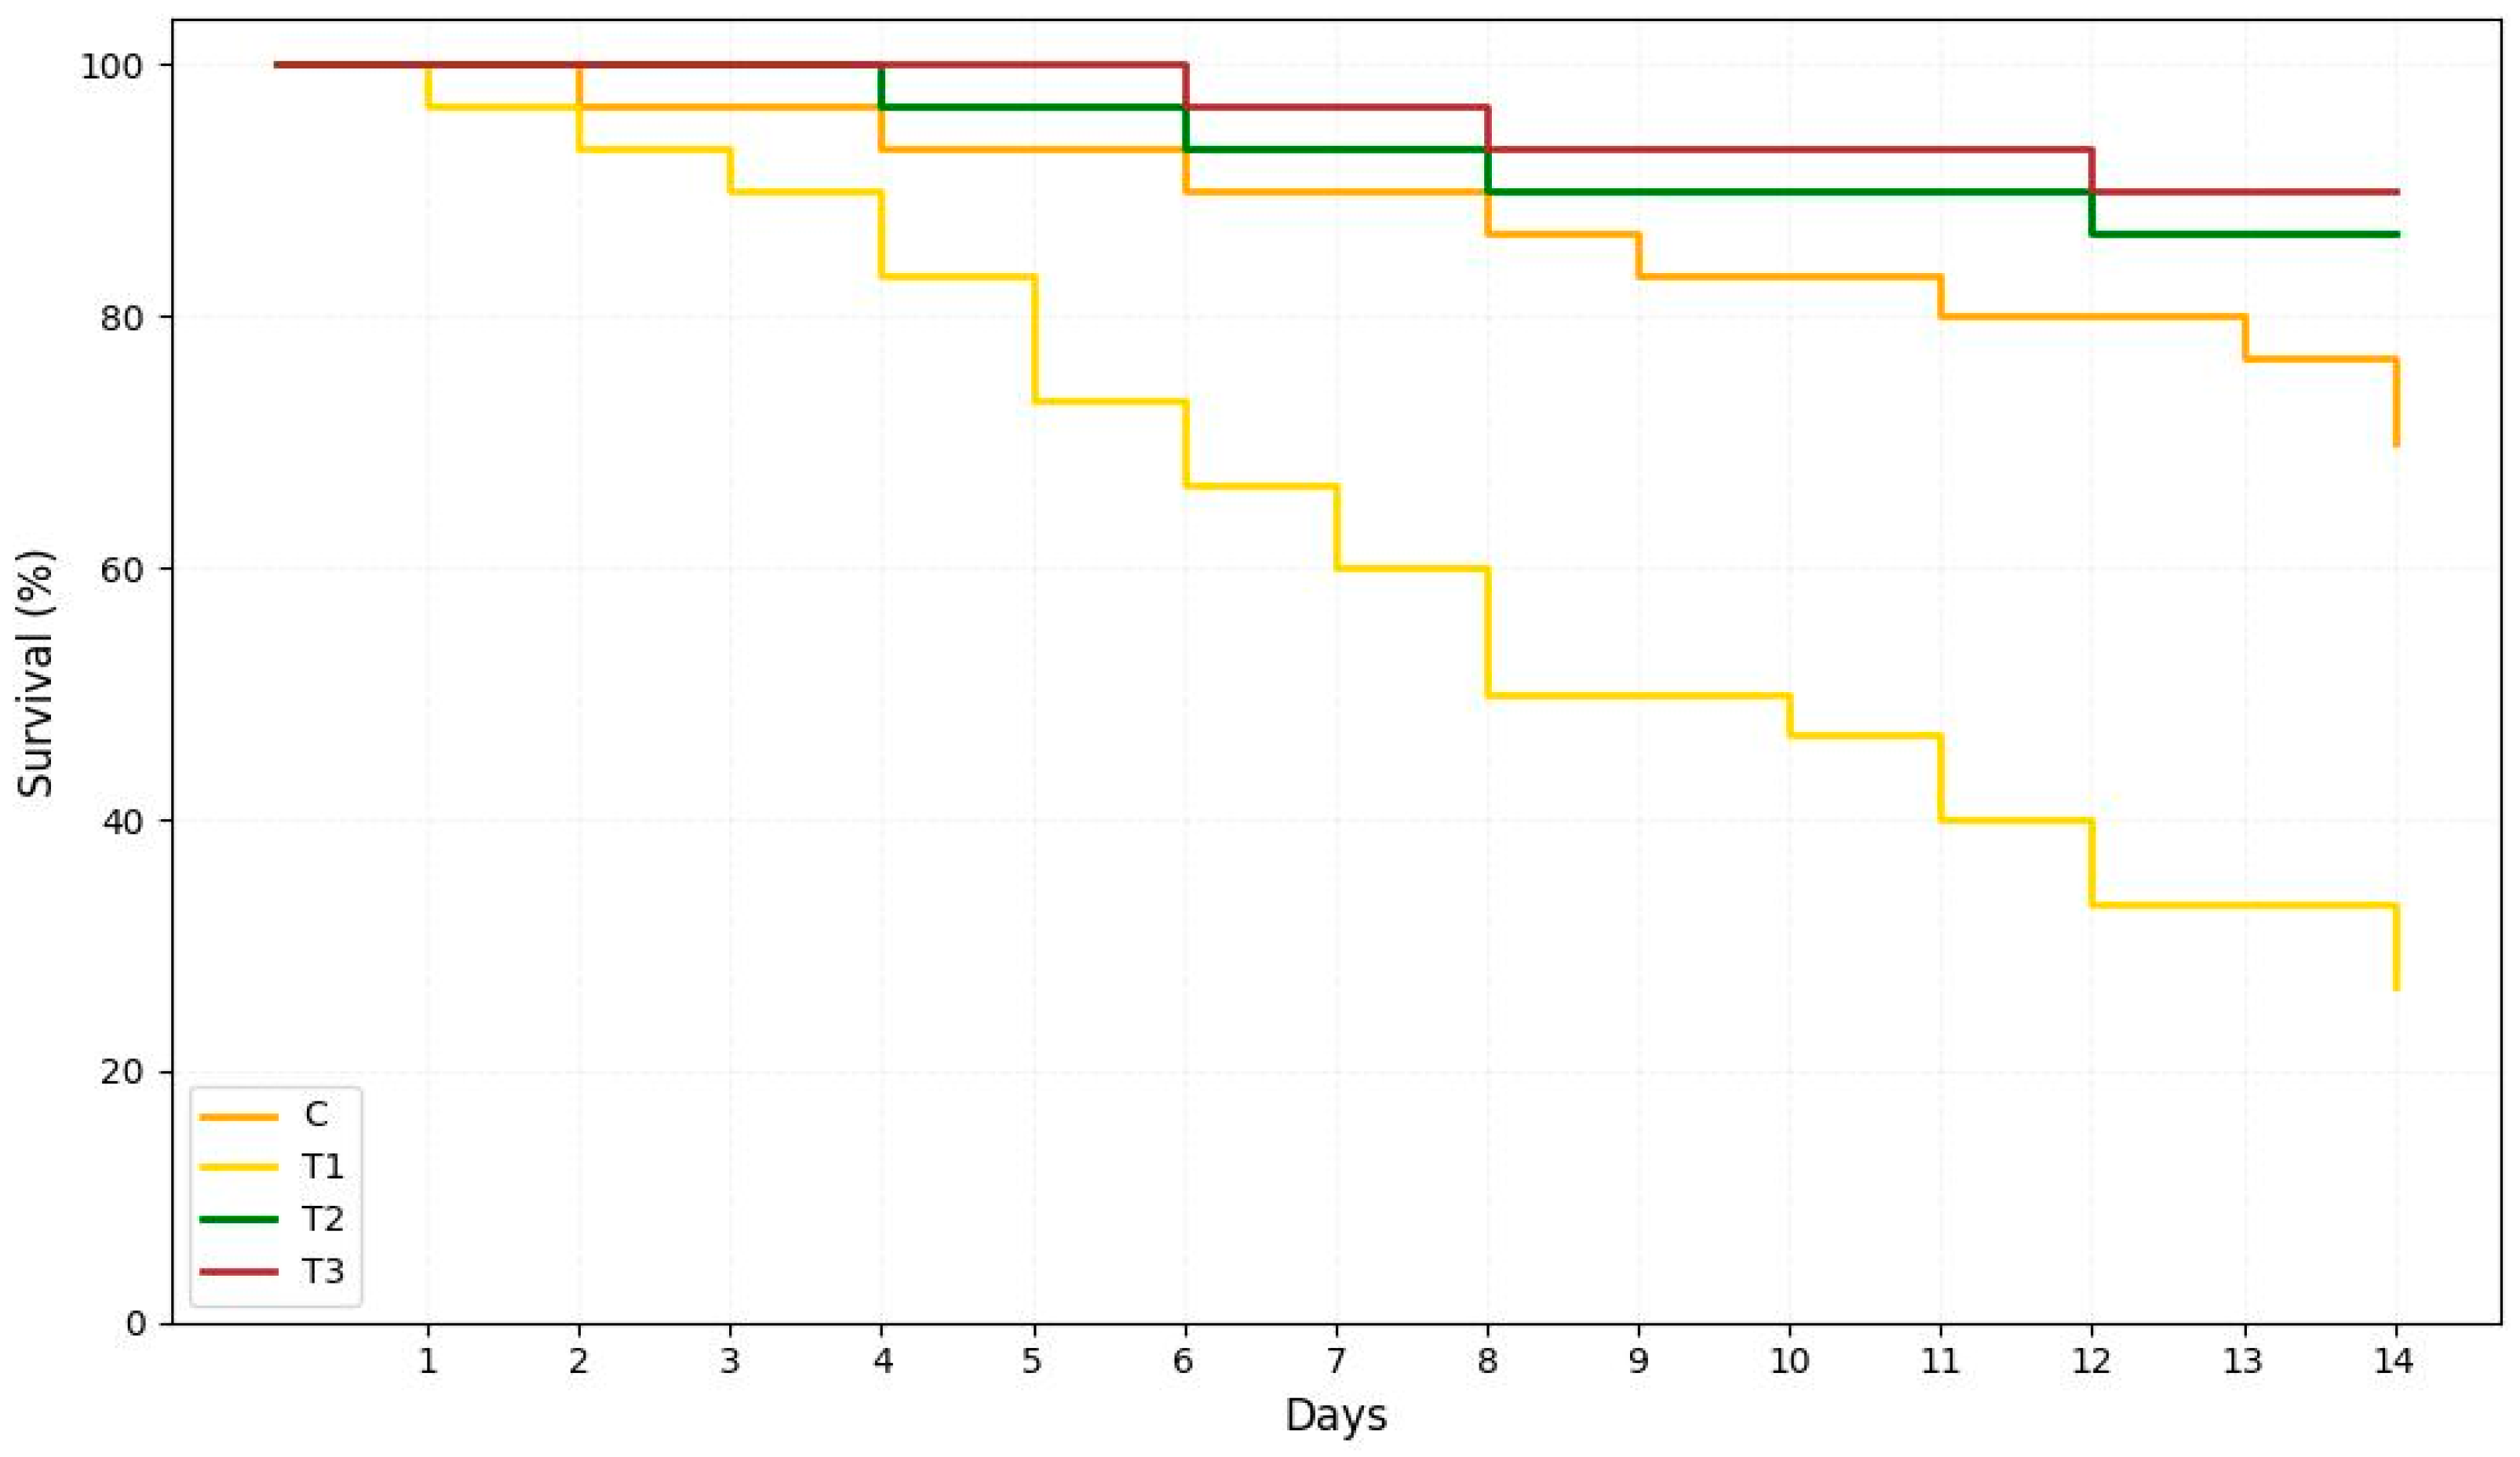
Mortality was highest in T1, followed by C, and lowest in T3, showing the greatest survival (Figure 5). No further mortality was observed in T3 beyond the 10th day post-challenge. The RPS values were 67.85% for C, 73.80% for T1, 88.09% for T2, and 92.85% for T3. No statistically significant differences (p > 0.05) were observed among the treatments.

4. Discussion

This study evaluated the effects of combining biofloc and microalgae on the water quality, growth performance, and immune response in red tilapia. From the findings, ammonia was highest in the Chlorella vulgaris and Nannochloropsis sp. only treatment, which could be due to lower levels of heterotrophic bacteria that are responsible for assimilating ammonia [13]. However, the ammonia levels were lowest in the treatment with an equal ratio of Chlorella vulgaris and Nannochloropsis sp., indicating that this combination reduces ammonia accumulation, potentially due to enhanced nitrification due to higher levels of heterotrophic bacteria [56]. Temperature and DO levels were optimal for tilapia culture and highest in the treatment with biofloc and an equal ratio of the microalgae. This implies that these conditions support better aerobic conditions and consequently, better metabolic processes in fish [57]. Nitrite levels, which can be toxic to fish, were within acceptable limits, with the treatment with higher levels of Chlorella vulgaris showing the lowest concentration, indicating improved and efficient microbial activity and nitrogen cycling in the biofloc system [58]. These findings conform with Ji et al. [59], who reported the crucial role of algae–bacteria symbiotic interactions in nutrient removal in wastewater. Calcium and magnesium levels varied, with the biofloc-microalgae combinations enhancing the concentrations of these essential minerals, which are required for better fish health and bone development [60]. Alkalinity was highest in the control, which had biofloc only, and lowest in the treatment with biofloc and an equal ratio of the microalgae, reflecting the buffering capacity provided by biofloc [13]. These results suggest that the integration of biofloc with Chlorella vulgaris and Nannochloropsis sp. improves water quality, and is consistent with previous studies that have highlighted the beneficial role of microalgae–bacteria interactions on water quality [59,61,62].
The floc and sludge parameters indicate significant differences influenced by the presence and ratios of microalgae and biofloc. The high floc and sludge volumes recorded in the control across all measured time points suggest that biofloc alone can promote higher floc formation, findings that are in tandem with those of Liu et al. [63]. The inclusion of Chlorella vulgaris and Nannochloropsis sp. in different ratios displayed significantly lower floc and sludge volumes, indicating that the addition of microalgae reduces floc and sludge volume. Notably, the most effective reduction is achieved by a higher ratio of Chlorella vulgaris. These findings are supported by the TSS and VSS levels recorded, highlighting the role of microalgae in reducing suspended solids. The distinct differences in FDI and porosity among treatments show the impact of microalgae on floc and sludge characteristics, with a higher ratio of Chlorella vulgaris demonstrating superior performance in achieving denser and more stable floc and sludge. These findings align with previous findings that microalgae, particularly Chlorella vulgaris, can improve sludge settling and compaction properties of microalgal-bacterial consortia by influencing microbial community structure and extracellular polymeric substances (EPSs) production in wastewater [64,65,66].
The chlorophyll and carotenoid levels in water and tissue demonstrate the significant impact of microalgae and biofloc combinations on these parameters. The highest levels of chlorophyll a and chlorophyll b were observed in the higher ratio of Chlorella vulgaris to Nannochloropsis sp. This suggests that the increased presence of Chlorella vulgaris substantially enhances the overall chlorophyll levels in the water. This supports the findings of Nakanishi and Deuchi [67], who reported high chlorophyll content in Chlorella vulgaris. Additionally, Pekkoh et al. [25] reported a substantial increase in chlorophyll content resulting from an increased production of algal biomass in their study of the symbiotic algal-bacteria interactions in aquaculture wastewater supplemented with agricultural wastes. An equal ratio of Chlorella vulgaris and Nannochloropsis sp. exhibited the highest carotenoid content in both water and tissue, highlighting the superior bioavailability and assimilation of carotenoids in microalgae, as reported by Guedes et al. [68] and Matos et al. [69]. These findings underscore the potential of integrating bacteria with microalgae to enhance the nutritional quality of the culture water and the health benefits of farmed fish, particularly through increased antioxidant compounds like carotenoids [68].
The findings highlight distinct dynamics of bacterial and algal populations influenced by the combinations of biofloc and microalgae. Initially, the treatment with biofloc and a higher Chlorella vulgaris to Nannochloropsis sp. ratio had the highest bacterial count, indicating that the biofloc-microalgae interactions provide a conducive environment that promotes bacterial growth. In contrast, the combination of only the microalgae without biofloc inhibits initial bacterial proliferation, as indicated by the low initial bacterial populations in the treatment. Throughout this study, each treatment exhibited unique bacterial population peaks, with the treatment with only biofloc (control) showing the highest peak on the 21st day. This suggests that biofloc alone provides substantial organic matter to support bacterial growth, as reported by Avnimelech [57]. The microalgae treatment demonstrated a significant and sustained increase in algal populations, peaking by the final day of the trial, likely due to the rapid growth characteristics of Chlorella vulgaris and Nannochloropsis sp. Equal Chlorella vulgaris and Nannochloropsis sp. showed more variability in algal population, peaking at 35 days but then declining, indicating a more dynamic interaction between biofloc and the equal ratio of microalgae. More Chlorella vulgaris resulted in a slower but sustained growth, peaking by the 35th day and stabilizing around the 60th day, which could be attributed to the higher ratio of Chlorella vulgaris providing a balanced environment for algal proliferation [70]. These findings showed that the integration of biofloc with specific ratios of Chlorella vulgaris and Nannochloropsis sp. can significantly influence the microbial ecology of aquaculture systems, potentially enhancing water quality and promoting fish growth.
This study’s analysis of red tilapia growth performance under different treatments reveals that combining biofloc with microalgae significantly impacts fish growth and feed utilization efficiency. The high final weight and weight gain observed in the combined biofloc with equal amounts of Chlorella vulgaris and Nannochloropsis sp., demonstrating superior growth. This combination also exhibited the best FCR and SGR, indicating efficient feed utilization and enhanced growth performance, possibly due to the balanced nutritional profile and improved water quality associated with this combination [40,42]. Conversely, higher ratios of Chlorella vulgaris show lower weight gains and higher FCRs, suggesting that an excess of Chlorella vulgaris might not be as effective in promoting optimal growth as the balanced ratio. Survival rates were high across all treatments, indicating that none of the combinations had adverse effects on fish health. These findings suggest that integrating biofloc with a balanced ratio of Chlorella vulgaris and Nannochloropsis sp. enhances growth performance and feed efficiency in red tilapia, offering a promising strategy for sustainable aquaculture.
The study findings on the relative expression levels of various immune-related genes in the intestine, head kidney, and liver of red tilapia under the different treatments provide useful insights on the immune-modulatory effects of algae–bacteria interactions on the fish. All treatments with biofloc resulted in upregulated mRNA expression of the target genes in the fish, demonstrating an enhanced immune response. Overall, high gene expression levels were observed in the combined biofloc with an equal ratio of Chlorella vulgaris and Nannochloropsis sp., indicating a synergistic effect on immune modulation in enhancing innate immune responses [71,72]. This is further emphasized by the findings from the pathogen challenge of the experimental fish, suggesting a synergistic benefit from the combined inclusion of biofloc and microalgae. However, the levels of upregulation of the genes vary within the different body organs. For instance, the expression of the MT gene was consistently low in the intestine but high in the head kidney and liver, indicating that the algae–bacteria interactions might have less influence on its upregulation in the intestine than in the head kidney.
Nevertheless, the key immune-modulatory effects of biofloc-microalgae combinations on the fish are evident. The high upregulation of tnf-a and tlr7 genes indicates an optimal inflammatory and pathogen recognition response [39]. The ctsl gene is largely associated with proteolysis in fish [73,74,75], while the mt gene plays an important role in antagonizing heavy metal poisoning in fish [76]. These results indicate that the combination of biofloc with Chlorella vulgaris and Nannochloropsis sp. enhances the immune response, suggesting improved proteolytic activity, pathogen recognition, inflammatory response, and antioxidant defense mechanisms in red tilapia.
Biofloc has been reported to enhance immune response in tilapia [21,77]. In addition, microalgae have proved to improve immunity in fish and shellfish. For instance, Chlorella improves the antioxidant enzyme activities, immune response, and disease resistance in Nile tilapia (Oreochromis niloticus) [39,78] and rainbow trout (Oncorhynchus mykiss) [41]. Nannochloropsis sp. has been reported to improve the immune response and disease resistance of Pacific white shrimp (Litopenaeus vannamei) [72]. Biofloc-associated microbial communities and microalgal components may influence mucosal immunity through microbial-associated molecular patterns (MAMPs) and their recognition by pattern recognition receptors (PRRs) such as Toll-like receptors [79,80]. Additionally, microalgae-derived bioactive compounds (e.g., β-glucans and polyunsaturated fatty acids) may serve as immunostimulants, potentially enhancing cytokine signaling and cell-mediated immunity in the fish [81,82]. These interactions, occurring at the interface of the gut of the fish epithelium and the biofloc/microalgae environment, may have also contributed to the observed gene expression profiles. The findings of the current study support these previous studies and emphasize the potential of combining biofloc with microalgae by integrating specific microalgae ratios with biofloc technology to enhance the immune functions of red tilapia, which could be strategically applied in aquaculture to improve fish health and disease resistance.
Nevertheless, the current study was not without limitations. This study was conducted under controlled laboratory conditions, which may not fully replicate the environmental variability and management challenges encountered in field-scale operations. We also note that the 60-day trial duration, while sufficient for assessing short-term responses, may not capture long-term effects on performance, health, or system stability. Additionally, we recognize the need for future studies to evaluate the economic feasibility and scalability of integrating microalgae and biofloc systems in commercial tilapia farming.

5. Conclusions

This study evaluated the effects of integrating biofloc with microalgae (Chlorella vulgaris and Nannochloropsis sp.) on growth performance and immune response in red tilapia (Oreochromis sp.). The findings indicate that combining biofloc with microalgae, particularly in balanced or slightly algae-dominant ratios, improves water quality parameters, enhancing the culture conditions for red tilapia. The findings demonstrated that the combined biofloc with equal amounts of Chlorella vulgaris and Nannochloropsis sp. results in better growth, optimal FCR, and SGR. This combination provides a nutritionally rich environment and improves water quality, promoting better growth performance and feed efficiency in red tilapia. Furthermore, the examination of immune-related gene expression revealed that all treatments with biofloc result in upregulated mRNA expression of target genes, enhancing immune response in red tilapia. The combined biofloc with Chlorella vulgaris and Nannochloropsis sp. showed the highest gene expression levels and the highest resistance to pathogens, suggesting a synergistic effect on immune and antioxidative capacity in red tilapia.
In conclusion, the integration of biofloc with microalgae, particularly in balanced or slightly algae-dominant ratios, significantly improves water quality, growth performance, and immune response in red tilapia. This approach offers a promising strategy for sustainable aquaculture, enhancing fish health and disease resistance. Future research could further explore the long-term effects and potential applications of these algae–bacteria interactions in different aquaculture systems.

Author Contributions

M.M.: conceptualization, formal analysis, investigation, methodology, writing—original draft, writing—review and editing. J.B.M.: writing—original draft, writing—review and editing, validation. F.S.: conceptualization, supervision, validation, writing—original draft. A.P.: formal analysis, investigation, writing—review and editing. J.L.G.: writing—review and editing, validation. S.S.: funding Mobilization and editing. S.Y.C.: writing—review and editing. D.B.: writing—review and editing. E.O.: writing—review and editing, validation. J.M.: writing—review and editing, validation. R.Y.: funding acquisition, validation, writing—review and editing. C.M.T.: funding acquisition, validation, writing—review and editing. All authors have read and agreed to the published version of the manuscript.

Funding

This study was supported by the following organizations and agencies for this research: the Norwegian Agency for Development Cooperation (NORAD) (Grant No: SAFA-21/0004); Australian Centre for International Agricultural Research (ACIAR) (ProteinAfrica—Grant No: LS/2020/154), Netherlands Organization for Scientific Research, WOTRO Science for Global Development (NWO-WOTRO) (ILIPA—W 08.250.202), IKEA Foundation (G-2204-02144), Global Affairs Canada (BRAINS project: P011585), European Commission (HORIZON 101060762 NESTLER and HORIZON 101136739 INNOECOFOOD), Postkode Lottery, Sweden (Waste for Cash Eco Project WACEP-PJ1651), The French Ministry of Europe and Foreign Affairs (BIO Kenya project-FEF N°2024-53), Novo Nordisk Foundation (RefIPro: NNF22SA0078466), the Rockefeller Foundation (WAVE-IN—Grant No: 2021 FOD 030); Bill and Melinda Gates Foundation (INV-032416); the Curt Bergfors Foundation Food Planet Prize Award; Norwegian Agency for Development Cooperation, the Section for research, innovation, and higher education grant number RAF–3058 KEN–18/0005 (CAP–Africa); the Swedish International Development Cooperation Agency (SIDA); the Swedish International Development Cooperation Agency (Sida); the Swiss Agency for Development and Cooperation (SDC); the Australian Centre for International Agricultural Research (ACIAR); the Government of Norway; the German Federal Ministry for Economic Cooperation and Development (BMZ); and the Government of the Republic of Kenya. The views expressed herein do not necessarily reflect the official opinion of the donors.

Institutional Review Board Statement

This study was conducted in accordance with the Institutional Animal Ethics Committee, and the protocol was approved by the Research Ethics Committee, Tamil Nadu Dr. J. Jayalalithaa Fisheries University (Approval Code: TNJFU/REC/2023/0154) on 18 September 2023.

Data Availability Statement

The data presented in this study are available on request from the corresponding author due to restrictions on data sharing by the authors’ institutions.

Acknowledgments

We are grateful for the support from colleagues at the International Centre of Insect Physiology and Ecology (icipe) and Tamil Nadu Dr. J. Jayalalithaa Fisheries University for their support during this study and preparation of this article. The abstract of this article was previously published at the AFRAQ 2024 “Blue Farming: New Horizons for Economic Growth”—3rd Annual International Conference & Exposition of the African Chapter of the World Aquaculture Society [83].

Conflicts of Interest

The authors declare no conflicts of interest.

Abbreviations

The following abbreviations are used in this manuscript:
BFTBiofloc Technology
FRPFiberglass Reinforced Plastic
FCRFood Coversion Ratio
SGRSpecific Growth Rate
ICAR-CIBAIndian Council of Agricultural Research—Central Institute of Brackishwater Aquaculture
RPSRelative Percentage Survival
CFUColony-forming Units
ANOVAAnalysis of Variance

References

  1. Avnimelech, Y.; Kochba, M. Evaluation of nitrogen uptake and excretion by tilapia in biofloc tanks, using 15N tracing. Aquaculture 2009, 278, 163–168. [Google Scholar] [CrossRef]
  2. DeLong, D.C.; Losordo, T.M. Recirculating Aquaculture Systems; NRAC Publication: Washington, DC, USA, 2012; No. 401. [Google Scholar]
  3. Piedrahita, R.H. Reducing the potential environmental impact of tank aquaculture effluents through intensification and recirculation. Aquaculture 2003, 226, 35–44. [Google Scholar] [CrossRef]
  4. Pillay, T.V.R.; Kutty, M.N. Aquaculture: Principles and Practices, 2nd ed.; Blackwell Publishing: Oxford, UK, 2005. [Google Scholar]
  5. Hargreaves, J.A.; Tucker, C.S. Managing Ammonia in Fish Ponds; SRAC Publication: Stoneville, MS, USA, 2004; No. 4603. [Google Scholar]
  6. Aliabad, H.S.; Naji, A.; Mortezaei, S.R.S.; Sourinejad, I.; Akbarzadeh, A. Effects of restricted feeding levels and stocking densities on water quality, growth performance, body composition and mucosal innate immunity of Nile tilapia (Oreochromis niloticus) fry in a biofloc system. Aquaculture 2022, 546, 737320. [Google Scholar] [CrossRef]
  7. Avnimelech, Y. Bio-filters: The need for an new comprehensive approach. Aquac. Eng. 2006, 34, 172–178. [Google Scholar] [CrossRef]
  8. Taufik, M.; Ismail, T.I.T.; Manan, H.; Ikhwanuddin, M.; Salam, A.I.A.; Rahim, A.I.A.; Ishak, A.N.; Kamaruzzan, A.S.; Draman, A.S.; Kasan, N.A. Synergistic effects of Recirculating Aquaculture System (RAS) with combination of clear water, probiotic and biofloc technology: A review. Aquac. Fish. 2023, 9, 883–892. [Google Scholar] [CrossRef]
  9. Dawood, M.A.O.; Koshio, S.; Ishikawa, M.; Yokoyama, S.; El-Sayed, A.I.; Ahmed, H.A. Effects of dietary supplementation of heat-killed Lactobacillus plantarum on growth performance, immune responses and stress resistance of juvenile red sea bream, Pagrus major. Aquaculture 2015, 442, 29–36. [Google Scholar] [CrossRef]
  10. Avnimelech, Y. Feeding with microbial flocs by tilapia in minimal discharge bio-flocs technology ponds. Aquaculture 2007, 264, 140–147. [Google Scholar] [CrossRef]
  11. Kuhn, D.D.; Lawrence, A.L.; Boardman, G.D.; Patnaik, S.; Marsh, L.; Flick, G.J., Jr. Evaluation of two types of bioflocs derived from biological treatment of fish effluent as feed ingredients for Pacific white shrimp, Litopenaeus vannamei. Aquaculture 2009, 296, 51–57. [Google Scholar] [CrossRef]
  12. Khanjani, M.H.; Mohammadi, A.; Emerenciano, M.G.C. Microorganisms in biofloc aquaculture system. Aquac. Rep. 2022, 26, 101300. [Google Scholar] [CrossRef]
  13. Azim, M.E.; Little, D.C. The biofloc technology (BFT) in indoor tanks: Water quality, biofloc composition, and growth and welfare of Nile tilapia (Oreochromis niloticus). Aquaculture 2008, 283, 29–35. [Google Scholar] [CrossRef]
  14. Ogello, E.O.; Outa, N.O.; Obiero, K.O.; Kyule, D.N.; Munguti, J.M. The prospects of biofloc technology (BFT) for sustainable aquaculture development. Sci. Afr. 2021, 14, e01053. [Google Scholar] [CrossRef]
  15. Yu, Y.B.; Choi, J.H.; Lee, J.H.; Jo, A.H.; Lee, K.M.; Kim, J.H. Biofloc technology in fish aquaculture: A review. Antioxidants 2023, 12, 398. [Google Scholar] [CrossRef] [PubMed]
  16. Ekasari, J.; Maryam, S. Evaluation of biofloc technology application on water quality and production performance of red tilapia Oreochromis sp. cultured at different stocking densities. Hayati J. Biosci. 2012, 19, 73–80. [Google Scholar] [CrossRef]
  17. Burford, M.A.; Thompson, P.J.; McIntosh, R.P.; Bauman, R.H.; Pearson, D.C. The contribution of flocculated material to shrimp (Litopenaeus vannamei) nutrition in a high-intensity, zero-exchange system. Aquaculture 2004, 232, 525–537. [Google Scholar] [CrossRef]
  18. Khanjani, M.H.; Sharifinia, M. Biofloc technology as a promising tool to improve aquaculture production. Rev. Aquac. 2020, 12, 1836–1850. [Google Scholar] [CrossRef]
  19. Xu, W.J.; Pan, L.Q. Effects of bioflocs on growth performance, digestive enzyme activity and body composition of juvenile Litopenaeus vannamei in zero-water exchange tanks manipulating C/N ratio in feed. Aquaculture 2012, 356, 147–152. [Google Scholar] [CrossRef]
  20. Mansour, A.T.; Esteban, M.Á. Effects of carbon sources and plant protein levels in a biofloc system on growth performance, and the immune and antioxidant status of Nile tilapia (Oreochromis niloticus). Fish Shellfish Immunol. 2017, 64, 202–209. [Google Scholar] [CrossRef]
  21. Azimi, A.; Shekarabi, S.P.H.; Paknejad, H.; Harsij, M.; Khorshidi, Z.; Zolfaghari, M.; Hatami, A.S.; Dawood, M.A.; Mazloumi, N.; Zakariaee, H. Various carbon/nitrogen ratios in a biofloc-based rearing system of common carp (Cyprinus carpio) fingerlings: Effect on growth performance, immune response, and serum biochemistry. Aquaculture 2022, 548, 737622. [Google Scholar] [CrossRef]
  22. Cotner, J.B.; Biddanda, B.A. Small Players, Large Role: Microbial Influence on Biogeochemical Processes in Pelagic Aquatic Ecosystems. Ecosystems 2002, 5, 105–121. [Google Scholar] [CrossRef]
  23. Fuentes, J.L.; Garbayo, I.; Cuaresma, M.; Montero, Z.; González-del-Valle, M.; Vílchez, C. Impact of microalgae-bacteria interactions on the production of algal biomass and associated compounds. Mar. Drugs 2016, 14, 100. [Google Scholar] [CrossRef]
  24. Ramanan, R.; Kim, B.H.; Cho, D.H.; Oh, H.M.; Kim, H.S. Algae–bacteria interactions: Evolution, ecology and emerging applications. Biotech. Adv. 2016, 34, 14–29. [Google Scholar] [CrossRef]
  25. Pekkoh, J.; Chaichana, C.; Thurakit, T.; Phinyo, K.; Lomakool, S.; Ruangrit, K.; Duangjan, K.; Suwannarach, N.; Kumla, J.; Cheirsilp, B.; et al. Dual-bioaugmentation strategy to enhance the formation of algal-bacteria symbiosis biofloc in aquaculture wastewater supplemented with agricultural wastes as an alternative nutrient sources and biomass support materials. Bioresour. Technol. 2022, 359, 127469. [Google Scholar] [CrossRef] [PubMed]
  26. Cole, J.J. Interactions between bacteria and algae in aquatic ecosystems. Ann. Rev. Ecol. System. 1982, 13, 291–314. Available online: https://www.jstor.org/stable/2097070 (accessed on 12 December 2024). [CrossRef]
  27. Joint, I.; Tait, K.; Wheeler, G. Cross-kingdom signalling: Exploitation of bacterial quorum sensing molecules by the green seaweed Ulva. Philos. Trans. R. Soc. B Biol. Sci. 2007, 362, 1223–1233. [Google Scholar] [CrossRef]
  28. Kouzuma, A.; Watanabe, K. Exploring the potential of algae/bacteria interactions. Curr. Opin. Biotechnol. 2015, 33, 125–129. [Google Scholar] [CrossRef] [PubMed]
  29. Cooper, M.B.; Smith, A.G. Exploring mutualistic interactions between microalgae and bacteria in the omics age. Curr. Opin. Plant Biol. 2015, 26, 147–153. [Google Scholar] [CrossRef]
  30. Coveney, M.F.; Wetzel, R.G. Bacterial metabolism of algal extracellular carbon. Hydrobiologia 1989, 173, 141–149. [Google Scholar] [CrossRef]
  31. Armstrong, E.; Rogerson, A.; Leftley, J.W. The abundance of heterotrophic protists associated with intertidal seaweeds. Estuar. Coast. Shelf Sci. 2000, 50, 415–424. [Google Scholar] [CrossRef]
  32. Rowe, G.T.; Deming, J.W. The Role of Bacteria in the Turnover of Organic Carbon in Deep-Sea Sediments. 1985. Available online: https://elischolar.library.yale.edu/journal_of_marine_research/1804/ (accessed on 17 December 2024).
  33. Muñoz, R.; Guieysse, B.; Mattiasson, B. Phenanthrene biodegradation by an algal-bacterial consortium in two-phase partitioning bioreactors. Appl. Microbiol. Biotechnol. 2003, 61, 261–267. [Google Scholar] [CrossRef]
  34. Kim, B.H.; Ramanan, R.; Cho, D.H.; Oh, H.M.; Kim, H.S. Role of Rhizobium, a plant growth promoting bacterium, in enhancing algal biomass through mutualistic interaction. Biomass Bioenergy 2014, 69, 95–105. [Google Scholar] [CrossRef]
  35. Teplitski, M.; Rajamani, S. Signal and nutrient exchange in the interactions between soil algae and bacteria. In Biocommunication in Soil Microorganisms; Springer: Berlin/Heidelberg, Germany, 2010; pp. 413–426. [Google Scholar] [CrossRef]
  36. Kazamia, E.; Czesnick, H.; Nguyen, T.T.V.; Croft, M.T.; Sherwood, E.; Sasso, S.; Hodson, S.J.; Warren, M.J.; Smith, A.G. Mutualistic interactions between vitamin B12-dependent algae and heterotrophic bacteria exhibit regulation. Environ. Microbiol. 2012, 14, 1466–1476. [Google Scholar] [CrossRef]
  37. Croft, M.T.; Lawrence, A.D.; Raux-Deery, E.; Warren, M.J.; Smith, A.G. Algae acquire vitamin B12 through a symbiotic relationship with bacteria. Nature 2005, 438, 90–93. [Google Scholar] [CrossRef]
  38. Sanmukh, S.; Bruno, B.; Ramakrishnan, U.; Khairnar, K.; Swaminathan, S.; Paunikar, W. Bioactive compounds derived from microalgae showing antimicrobial activities. J. Aquac. Res. Dev. 2014, 5, 224. Available online: https://www.cabidigitallibrary.org/doi/full/10.5555/20143284901 (accessed on 24 March 2025). [CrossRef]
  39. Galal, A.A.; Reda, R.M.; Mohamed, A.A.R. Influences of Chlorella vulgaris dietary supplementation on growth performance, hematology, immune response and disease resistance in Oreochromis niloticus exposed to sub-lethal concentrations of penoxsulam herbicide. Fish Shellfish Immunol. 2018, 77, 445–456. [Google Scholar] [CrossRef] [PubMed]
  40. Ayala, M.D.; Galián, C.; Fernández, V.; Chaves-Pozo, E.; de la Serrana, D.G.; Sáez, M.I.; Galafaz Díaz, A.; Alarcón, F.J.; Martínez, T.F.; Arizcun, M. Influence of low dietary inclusion of the microalga Nannochloropsis gaditana (Lubián 1982) on performance, fish morphology, and muscle growth in juvenile gilthead seabream (Sparus aurata). Animals 2020, 10, 2270. [Google Scholar] [CrossRef] [PubMed]
  41. Chen, W.; Gao, S.; Huang, Y.; Chang, K.; Zhao, X. Addition of Chlorella sorokiniana meal in the diet of juvenile rainbow trout (Oncorhynchus mykiss): Influence on fish growth, gut histology, oxidative stress, immune response, and disease resistance against Aeromonas salmonicida. Fish Shellfish Immunol. 2022, 129, 243–250. [Google Scholar] [CrossRef]
  42. Huang, K.; Liu, X.; Ma, R.; Wang, B.; Ho, S.H.; Chen, J.; Xie, Y. Effects of substituting fish meal with Chlorella meal on growth performance, whole-body composition, pigmentation, and physiological health of marbled eel (Anguilla marmorata). Algal Res. 2024, 80, 103523. [Google Scholar] [CrossRef]
  43. Silva, V.F.; Pereira, P.K.; Martins, M.A.; Lorenzo, M.A.D.; Cella, H.; Lopes, R.G.; Derner, R.B.; Magallón-Servín, P.; Vieira, F.D.N. Effects of microalgae addition and fish feed supplementation in the integrated rearing of Pacific white shrimp and Nile tilapia using biofloc technology. Animals 2022, 12, 1527. [Google Scholar] [CrossRef]
  44. Taw, N. Future of biofloc technology in Asia. In Proceedings of the Roundtables Aquaculture Series 2012, Phuket, Thailand, 15–16 August 2012; pp. 1–30. [Google Scholar]
  45. Sartory, D.P.; Grobbelaar, J.U. Extraction of chlorophyll a from freshwater phytoplankton for spectrophotometric analysis. Hydrobiologia 1984, 114, 177–187. [Google Scholar] [CrossRef]
  46. Sumanta, N.; Haque, C.I.; Nishika, J.; Suprakash, R. Spectrophotometric analysis of chlorophylls and carotenoids from commonly grown fern species by using various extracting solvents. Res. J. Chem. Sci. 2014, 2231, 606X. Available online: https://www.cabidigitallibrary.org/doi/full/10.5555/20153044304 (accessed on 26 March 2025).
  47. Olson, J.A.; Lakshman, M.R. Carotenoid converstions. In Methods in Enzymology; Academic Press: Cambridge, MA, USA, 1990; Volume 189, pp. 425–432. [Google Scholar]
  48. Li, D.H.; Ganczarczyk, J. Flow through activated sludge flocs. Water Res. 1988, 22, 789–792. [Google Scholar] [CrossRef]
  49. Beutler, M.; Wiltshire, K.H.; Meyer, B.; Moldaenke, C.; Lüring, C.; Meyerhöfer, M.; Hansen, U.P.; Dau, H. A fluorometric method for the differentiation of algal populations in vivo and in situ. Photosynth. Res. 2002, 72, 39–53. [Google Scholar] [CrossRef]
  50. Mohlman, F.W. The sludge index. Sew. Work. J. 1934, 6, 119–122. Available online: https://www.jstor.org/stable/25028375 (accessed on 17 March 2025).
  51. Bergey, D.H. Bergey’s Manual of Determinative Bacteriology; Lippincott Williams & Wilkins: Philadelphia, PA, USA, 1994; pp. 1–695. [Google Scholar]
  52. Holt, P.G. Alveolar macrophages. I. A simple technique for the preparation of high numbers of viable alveolar macrophages from small laboratory animals. J. Immunol. Methods 1979, 27, 189–198. [Google Scholar] [CrossRef] [PubMed]
  53. Pfaffl, M.W. A new mathematical model for relative quantification in real-time RT–PCR. Nucleic Acids Res. 2001, 29, e45. [Google Scholar] [CrossRef] [PubMed]
  54. Yardımcı, B.; Aydın, Y. Pathological findings of experimental Aeromonas hydrophila infection in Nile tilapia (Oreochromis niloticus). Ank. Üniversitesi Vet. Fakültesi Derg. 2011, 58, 47–54. [Google Scholar] [CrossRef]
  55. Shoemaker, C.A.; Klesius, P.H.; Evans, J.J. In ovo methods for utilizing the modified live Edwardsiella ictaluri vaccine against enteric septicemia in channel catfish. Aquaculture 2002, 203, 221–227. [Google Scholar] [CrossRef]
  56. Ebeling, J.M.; Timmons, M.B.; Bisogni, J.J. Engineering analysis of the stoichiometry of photoautotrophic, autotrophic, and heterotrophic removal of ammonia–nitrogen in aquaculture systems. Aquaculture 2006, 257, 346–358. [Google Scholar] [CrossRef]
  57. Avnimelech, Y. Biofloc Technology: A Practical Guide Book; World Aquaculture Society: Baton Rouge, LA, USA, 2009; p. 182. Available online: https://www.cabidigitallibrary.org/doi/full/10.5555/20113266301 (accessed on 15 February 2025).
  58. Crab, R.; Avnimelech, Y.; Defoirdt, T.; Bossier, P.; Verstraete, W. Nitrogen removal techniques in aquaculture for a sustainable production. Aquaculture 2007, 270, 1–14. [Google Scholar] [CrossRef]
  59. Ji, X.; Jiang, M.; Zhang, J.; Jiang, X.; Zheng, Z. The interactions of algae-bacteria symbiotic system and its effects on nutrients removal from synthetic wastewater. Bioresour. Technol. 2018, 247, 44–50. [Google Scholar] [CrossRef]
  60. Lall, S.P.; Kaushik, S.J. Nutrition and metabolism of minerals in fish. Animals 2021, 11, 2711. [Google Scholar] [CrossRef]
  61. Marimuthu, C.; Arun, J.; Subathra, M.; Priyadharsini, P.; Nirmala, N.; Sarojadevi, S. Microalgae for Treating Wastewater. In Sustainable Industrial Wastewater Treatment and Pollution Control; Springer Nature: Singapore, 2023; pp. 1–12. [Google Scholar] [CrossRef]
  62. Qv, M.; Dai, D.; Liu, D.; Wu, Q.; Tang, C.; Li, S.; Zhu, L. Towards advanced nutrient removal by microalgae-bacteria symbiosis system for wastewater treatment. Bioresour. Technol. 2023, 370, 128574. [Google Scholar] [CrossRef]
  63. Liu, H.; Li, H.; Wei, H.; Zhu, X.; Han, D.; Jin, J.; Yang, Y.; Xie, S. Biofloc formation improves water quality and fish yield in a freshwater pond aquaculture system. Aquaculture 2019, 506, 256–269. [Google Scholar] [CrossRef]
  64. Zhang, B.; Li, W.; Guo, Y.; Zhang, Z.; Shi, W.; Cui, F.; Lens, P.N.; Tay, J.H. Microalgal-bacterial consortia: From interspecies interactions to biotechnological applications. Renew. Sustain. Energy Rev. 2020, 118, 109563. [Google Scholar] [CrossRef]
  65. Fallahi, A.; Rezvani, F.; Asgharnejad, H.; Nazloo, E.K.; Hajinajaf, N.; Higgins, B. Interactions of microalgae-bacteria consortia for nutrient removal from wastewater: A review. Chemosphere 2021, 272, 129878. [Google Scholar] [CrossRef]
  66. Cabeza, C.; van Lier, J.B.; van der Steen, P. Effects of thermal and enzymatic pre-treatments on the solubilisation of extracellular polymeric substances (EPS) and subsequent anaerobic digestion of microalgae-bacterial biomass. Algal Res. 2023, 72, 103130. [Google Scholar] [CrossRef]
  67. Nakanishi, K.; Deuchi, K. Culture of a high-chlorophyll-producing and halotolerant Chlorella vulgaris. J. Biosci. Bioeng. 2014, 117, 617–619. [Google Scholar] [CrossRef]
  68. Guedes, A.C.; Amaro, H.M.; Malcata, F.X. Microalgae as sources of carotenoids. Mar. Drugs 2011, 9, 625–644. [Google Scholar] [CrossRef] [PubMed]
  69. Matos, J.; Cardoso, C.; Bandarra, N.M.; Afonso, C. Microalgae as healthy ingredients for functional food: A review. Food Funct. 2017, 8, 2672–2685. [Google Scholar] [CrossRef] [PubMed]
  70. Rosenberg, J.N.; Oyler, G.A.; Wilkinson, L.; Betenbaugh, M.J. A green light for engineered algae: Redirecting metabolism to fuel a biotechnology revolution. Curr. Opin. Biotech. 2008, 19, 430–436. [Google Scholar] [CrossRef] [PubMed]
  71. Naqvi, S.A.R.; Sherazi, T.A.; Hassan, S.U.; Shahzad, S.A.; Faheem, Z. Anti-inflammatory, anti-infectious and anti-cancer potential of marine algae and sponge: A review. Eur. J. Inflam. 2022, 20, 20587392221075514. [Google Scholar] [CrossRef]
  72. Zhang, P.; Peng, R.; Jiang, X.; Jiang, M.; Zeng, G. Effects of Nannochloropsis oculata and Thalassiosira pseudonana monocultures on growth performance and nutrient composition of Litopenaeus vannamei. Algal Res. 2022, 66, 102769. [Google Scholar] [CrossRef]
  73. Kumaresan, V.; Bhatt, P.; Palanisamy, R.; Gnanam, A.; Pasupuleti, M.; Arockiaraj, J. A murrel cysteine protease, cathepsin L: Bioinformatics characterization, gene expression and proteolytic activity. Biologia 2014, 69, 395–406. [Google Scholar] [CrossRef]
  74. Wang, R.; Song, L.; Su, B.; Zhao, H.; Zhang, D.; Peatman, E.; Li, C. Mucosal expression signatures of two Cathepsin L in channel catfish (Ictalurus punctatus) following bacterial challenge. Fish Shellfish Immunol. 2015, 47, 582–589. [Google Scholar] [CrossRef] [PubMed]
  75. Chiang, Y.R.; Wang, L.C.; Lin, H.T.; Lin, J.H.Y. Bioactivity of orange-spotted grouper (Epinephelus coioides) cathepsin L: Proteolysis of bacteria and regulation of the innate immune response. Fish Shellfish Immunol. 2022, 122, 399–408. [Google Scholar] [CrossRef] [PubMed]
  76. Huang, X.; Feng, Y.; Fan, W.; Duan, J.; Duan, Y.; Xiong, G.; Wang, K.; Deng, Y.; Geng, Y.; Ouyang, P.; et al. Potential ability for metallothionein and vitamin E protection against cadmium immunotoxicity in head kidney and spleen of grass carp (Ctenopharyngodon idellus). Ecotoxicol. Environ. Saf. 2019, 170, 246–252. [Google Scholar] [CrossRef]
  77. Menaga, M.; Felix, S.; Charulatha, M.; Gopalakannan, A.; Panigrahi, A. Effect of in-situ and ex-situ biofloc on immune response of Genetically Improved Farmed Tilapia. Fish Shellfish Immunol. 2019, 92, 698–705. [Google Scholar] [CrossRef]
  78. Abdel-Tawwab, M.; Mousa, M.A.; Mamoon, A.; Abdelghany, M.F.; Abdel-Hamid, E.A.; Abdel-Razek, N.; Ali, F.S.; Shady, S.H.; Gewida, A.G. Dietary Chlorella vulgaris modulates the performance, antioxidant capacity, innate immunity, and disease resistance capability of Nile tilapia fingerlings fed on plant-based diets. Anim. Feed. Sci. Technol. 2022, 283, 115181. [Google Scholar] [CrossRef]
  79. Mohammadi, G.; Rafiee, G.; Abdelrahman, H.A. Effects of dietary Lactobacillus plantarum (KC426951) in biofloc and stagnant-renewal culture systems on growth performance, mucosal parameters, and serum innate responses of Nile tilapia Oreochromis niloticus. Fish Physiol. Biochem. 2020, 46, 1167–1181. [Google Scholar] [CrossRef]
  80. do Carmo Alves, A.P.; Peconick, A.P.; da Silva Cerozi, B.; Possebon Cyrino, J.E. Role of probiotics on the immunity of Nile tilapia Oreochromis niloticus: A review. Aquac. Int. 2022, 30, 1905–1929. [Google Scholar] [CrossRef]
  81. Rodrigues, M.V.; Zanuzzo, F.S.; Koch, J.F.A.; de Oliveira, C.A.F.; Sima, P.; Vetvicka, V. Development of fish immunity and the role of β-glucan in immune responses. Molecules 2020, 25, 5378. [Google Scholar] [CrossRef] [PubMed]
  82. Bahi, A.; Ramos-Vega, A.; Angulo, C.; Monreal-Escalante, E.; Guardiola, F.A. Microalgae with immunomodulatory effects on fish. Rev. Aquac. 2023, 15, 1522–1539. [Google Scholar] [CrossRef]
  83. Menaga, M.; Mboya, J.; Sugantham, F.; Panigrahi, A.; Subramanian, S.; Chia, S.; Beesigamukama, D.; Yossa, R.; Tanga, C. Algae-bacteria synergy leads to improved growth and immune defense in red tilapia (Oreochromis sp.). In AFRAQ 2024: Blue Farming—New Horizons for Economic Growth, Book of Abstracts, Proceedings of the African Chapter of the World Aquaculture Society, Hammamet, Tunisia, 19–22 November 2024; World Aquaculture Society (WAS) African Chapter: Midrand, South Africa, 2024; p. 146. [Google Scholar]
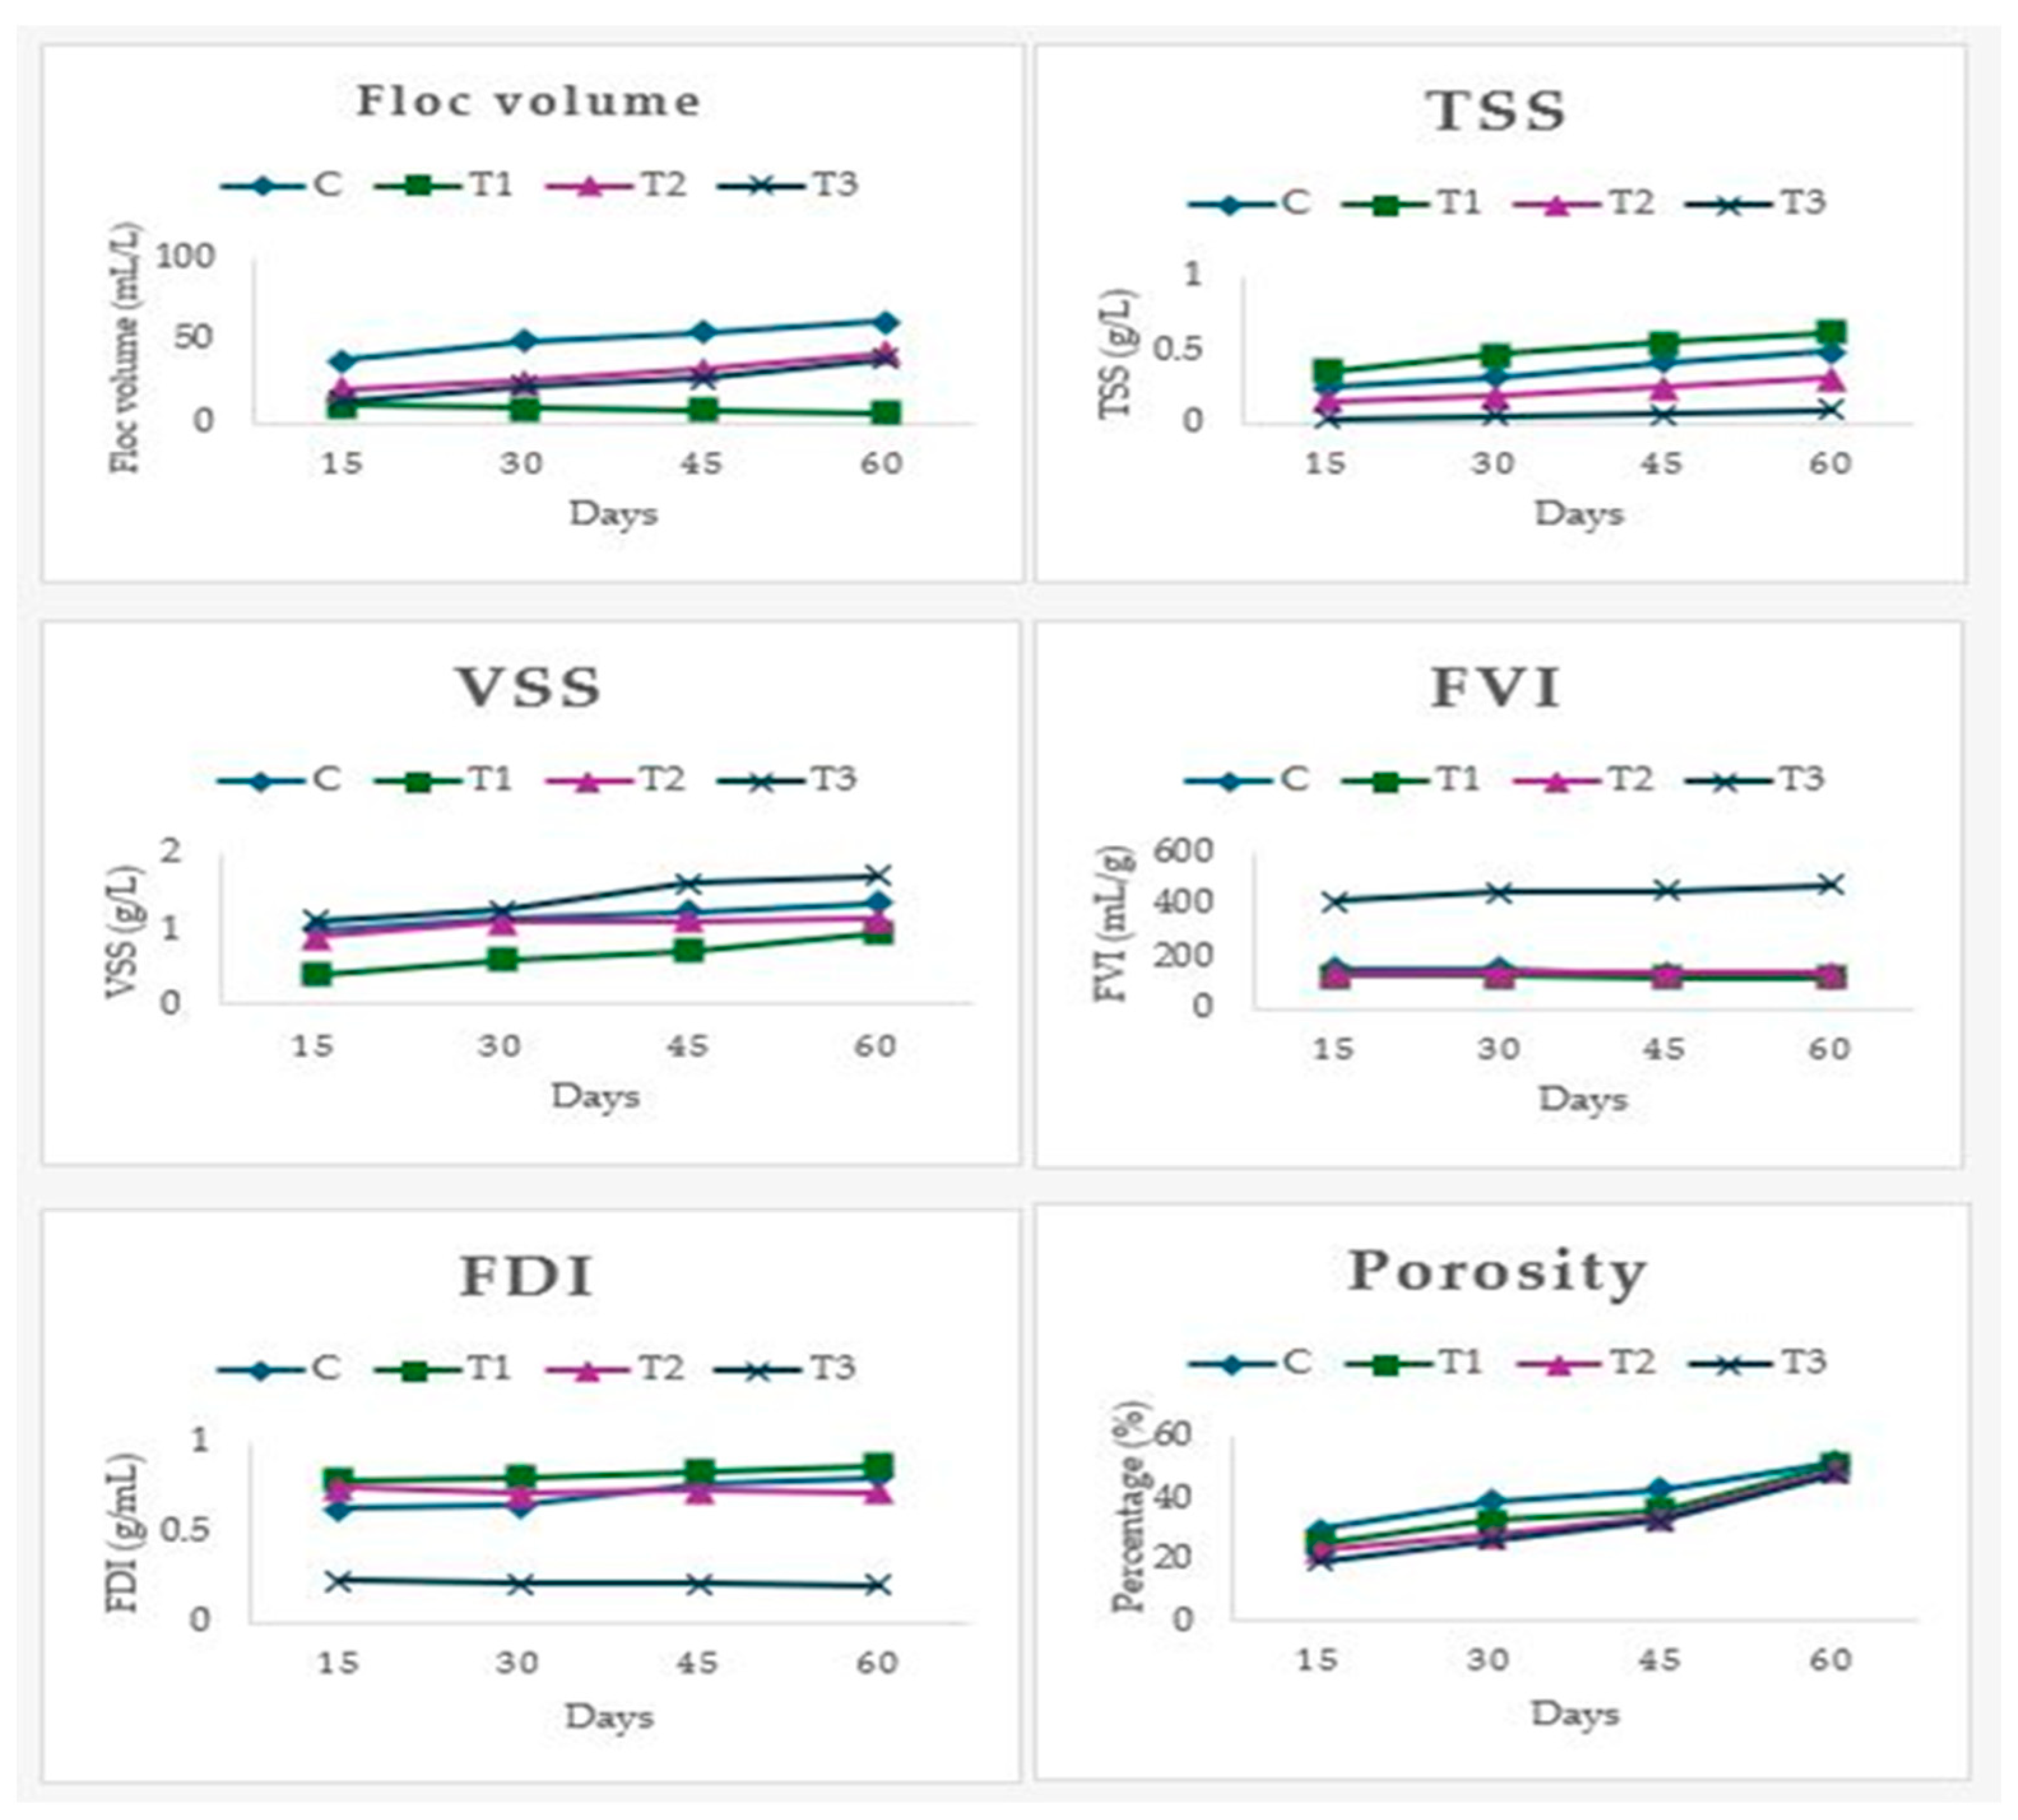
Figure 1. The floc characteristics analyzed during the trial in various treatments. TSS: total suspended solids, VSS: volatile suspended solids, FVI: floc volume index, FDI: floc density index.
Aquacj 05 00012 g001
Figure 2. Relative expression levels of the various immune-related genes in the intestine of red tilapia subjected to the four different treatments.
Aquacj 05 00012 g002
Figure 3. Relative expression levels of the various immune-related genes in the head kidney of red tilapia subjected to the four different treatments.
Aquacj 05 00012 g003
Figure 4. Relative expression levels of the various immune-related genes in the liver of red tilapia subjected to the four different treatments.
Aquacj 05 00012 g004
Figure 5. Kaplan–Meier survival graph showing the survival of red tilapia over a 14-day challenge with Aeromonas hydrophila. Different curves indicate the percent survival of fish (n = 10 per replicate).
Aquacj 05 00012 g005
Table 1. Primers used for the five immune-related genes in qRT-PCR.
Gene NameAccession NumberPrimersBase Pair
Tumor necrosis factor-alpha (tnf-a)XM_003438427.5GCTACGACTCCCAGCACTTTG (FP)
GCGGTACTGCTCGGATCTCT (RP)
72
Metallothionein (mt)XM_003447045.5GCCACTCCTACACCGTCATTC (FP)
CTGGCGTTGCTCTTGTCTCTT (RP)
63
Toll-like receptor 7 (tlr7)XM_019352834.2CCTATTTTGGCAACTGGCATCT (FP)
CACTTCACTCCCATTGTTGATCTC (RP)
78
Cathepsin L (ctsl)XM_003444107.5TGTCTTGCTCGTGGGCTATG (FP)
CAGCTATTTTTCACCAGCCAGTAG (RP)
63
Interleukin-1 beta (il-1b)KF747686.1TGTCGCTCTGGGCATCAA (FP)
GGCTTGTCGTCATCCTTGTGA (RP)
63
β-actinEU887951.1CCACACAGTGCCCATCTACGA (FP)
CCACGCTCTGTCAGGATCTTCA (RP)
120
18S rRNAXR_003216134GTGCATGGCCGTTCTTAGTT (FP)
CTCAATCTCGTGTGGCTGAA (RP)
150
Table 2. Water quality parameters during the experimental period.
ParameterCT1T2T3
pH7.40 ± 0.03 a6.71 ± 0.04 a7.65 ± 0.05 a7.45 ± 0.02 a
Ammonia (NH4-N; mg/L)0.014 ± 0.003 a0.031 ± 0.005 a0.009 ± 0.002 a0.015 ± 0.004 a
Temperature (°C)30.0 ± 0.15 a29.0 ± 0.12 a29.0 ± 0.08 a29.0 ± 0.10 a
Nitrite (NO2-N; mg/L)0.0365 ± 0.002 a0.0225 ± 0.001 a0.0245 ± 0.001a0.0215 ± 0.001 a
Calcium (mg/L)88.5 ± 1.2 b70.5 ± 1.5 ba102.5 ± 1.1 bc84.5 ± 1.4 ba
Magnesium (mg/L)90.5 ± 1.0 a52.55 ± 0.60 b69.65 ± 0.75 c70.85 ± 0.65 c
Alkalinity (mg/L)111.5 ± 1.1 a94.5 ± 1.0 b88.5 ± 1.2 c90.5 ± 1.3 b
DO (mg/L)3.05 ± 0.10 a3.05 ± 0.12 a5.05 ± 0.11 a4.15 ± 0.09 a
Note: C = Biofloc, T1 = Chlorella vulgaris and Nannochloropsis sp.; 1:1, T2 = Biofloc + Chlorella vulgaris and Nannochloropsis sp.; 1:1, T3 = Biofloc + Chlorella vulgaris and Nannochloropsis sp.; 2:1. The values represent the mean ± SD. A shared superscript in the same row indicates no statistically significant difference (p > 0.05).
Table 3. Growth parameters of the experimental fish in the various treatments.
ParameterCT1T2T3
Initial weight (g)85 ± 0.5 a85 ± 0.5 a85 ± 0.5 a85 ± 0.5 a
Final weight (g)222 ± 0.7 a212 ± 0.7 a227 ± 0.7 a211 ± 0.7 a
Weight gain (g)137.5 ± 0.7 a127.5 ± 0.7 a142 ± 0.7 a126.5 ± 0.7 a
SGR1.57 ± 0.007 a1.50 ± 0.007 a1.61 ± 0.02 a1.49 ± 0.01 a
FCR1.85 ± 0.017 a2.00 ± 0.012 a1.79 ± 0.009 b2.01 ± 0.004 a
Survival (%)97 a99 a99 a99 a
Note: C = Biofloc, T1 = Chlorella vulgaris and Nannochloropsis sp.; 1:1, T2 = Biofloc + Chlorella vulgaris and Nannochloropsis sp.; 1:1, T3 = Biofloc + Chlorella vulgaris and Nannochloropsis sp.; 2:1. SGR = specific growth rate, FCR = Food Conversion Ratio. The values represent the mean ± SD. A shared superscript in the same row indicates no statistically significant difference (p > 0.05).
Table 4. Chlorophyll a and b, carotenoid in water, and carotenoid in tissue.
ParameterCT1T2T3
Chlorophyll a (%)0.45 ± 0.007 a0.5 ± 0.007 a0.62 ± 0.007 b0.68 ± 0.007 b
Chlorophyll b (%)1.21 ± 0.03 a1.34 ± 0.03 a1.58 ± 0.03 b1.75± 0.03 b
Carotenoid in water (%)0.26 ± 0.01 a0.18 ± 0.02 a0.4 ± 0.01 a0.36 ± 0.01 a
Carotenoid in tissue (µg/g)31.7 ± 0.98 a33.6 ± 0.56 a37.6 ± 0.56 a30.5 ± 0.70 a
Note: C = Biofloc, T1 = Chlorella vulgaris and Nannochloropsis sp.; 1:1, T2 = Biofloc + Chlorella vulgaris and Nannochloropsis sp.; 1:1, T3 = Biofloc + Chlorella vulgaris and Nannochloropsis sp.; 2:1. The values represent the mean ± SD. A shared superscript in the same row indicates no statistically significant difference (p > 0.05).
Table 5. Sludge parameters for various treatments.
ParameterCT1T2T3
SV (mL/L)58 ± 2.82 a15.7 ± 0.103 b24.5 ± 0.707 b19.5 ± 0.707 b
SVI (mL/g)319 ± 9.89 a148 ± 9.71 b160 ± 11.31 b100 ± 10.60 c
SDI (g/mL)0.031 ± 0.001 a0.104 ± 0.006 b0.06 ± 0.004 c0.099 ± 0.001 b
Porosity (%)60 ± 0.002 a38 ± 0.005 b24 ± 0.005 c19 ± 0.007 c
TSS (g/L)0.07 ± 0.014 a0.45 ± 0.0110.025 ± 0.007 b0.31 ± 0.014 c
VSS (g/L)1.2 ± 0.07 a0.6 ± 0.01 b1.77 ± 0.04 a1.49 ± 0.35 a
Note: C = Biofloc, T1 = Chlorella vulgaris and Nannochloropsis sp.; 1:1, T2 = Biofloc + Chlorella vulgaris and Nannochloropsis sp.; 1:1, T3 = Biofloc + Chlorella vulgaris and Nannochloropsis sp.; 2:1. SV = sludge volume; SVI = sludge volume index; SDI = sludge density index; TSS = total suspended solids/sludge concentration; VSS = volatile suspended solids. The values represent the mean ± SD. A shared superscript in the same row indicates no statistically significant difference (p > 0.05).
Table 6. Total bacterial population analyzed during the experiment (Log CFU/mL).
DaysTreatments
CT1T2 T3
7th Day260 ± 6.63 a220 ± 8.85 a490 ± 14.41 b546 ± 9.33 b
14th Day495 ± 6.63 a615 ± 16.18 b640 ± 43.40 b876 ± 79.19 c
21st Day133 ± 18.89 a213.5 ± 18.89 b105 ± 8.99 a715 ± 24.48 c
28th Day1057.5 ± 18.89 a174 ± 8.48 b960 ± 48.52 a410 ± 38.83 c
35th Day925 ± 49.49 a698 ± 77.78 a665 ± 17.77 a710 ± 25.26 a
42nd Day462.5 ± 24.74 a172.5 ± 36.06 b470 ± 31.11 a290.5 ± 18.79 b
49th Day123 ± 15.55 a195.5 ± 36.06 a366 ± 14.65 b512 ± 12.45 c
56th Day220 ± 55.68 a305 ± 20.60 b,c340 ± 29.84 c260 ± 12.79 a,b
60th Day340 ± 45.8 a115 ± 25.60 b320 ± 21.4 a215 ± 22.9 c
Note: C = Biofloc, T1 = Chlorella vulgaris and Nannochloropsis sp.; 1:1, T2 = Biofloc + Chlorella vulgaris and Nannochloropsis sp.; 1:1, T3 = Biofloc + Chlorella vulgaris and Nannochloropsis sp.; 2:1. The values represent the mean ± SD. A shared superscript in the same row indicates no statistically significant difference (p > 0.05).
Table 7. Total algal population analyzed during the experiment (Log CFU/mL).
DaysTreatments
CT1T2 T3
7th day35 ± 6.61 a270 ± 28.28 b17.5 ± 3.53 a90 ± 56.56 c
14th day150 ± 7.03 a16,625 ± 219.75 b134 ± 5.65 a19,150 ± 118.08 b
21st day587 ± 56.82 a21,500 ± 202.08 b675 ± 148.49 a890 ± 42.42 c
28th day1980 ± 31.27 a6750 ± 114.21 b19,000 ± 141.42 c2800 ± 48.52 d
35th day15,468 ± 68.06 a11,688 ± 441.94 a21,875 ± 17.67 b39,375 ± 88.38 c
42nd day3694 ± 36.56 a13,500 ± 141.421 b3900 ± 141.421 a6250 ± 70.71 c
49th day5821 ± 52.19 a16,200 ± 282.84 b6850 ± 0.71 a8250 ± 70.71 c
56th day6729 ± 63.23 a18,750 ± 70.71 b1550 ± 70.71 c9350 ± 70.71 a
60th day7158 ± 28.61 a19,750 ± 60.71 b1457 ± 64.1 c9565 ± 34.1 a
Note: C = Biofloc, T1 = Chlorella vulgaris and Nannochloropsis sp.; 1:1, T2 = Biofloc + Chlorella vulgaris and Nannochloropsis sp.; 1:1, T3 = Biofloc + Chlorella vulgaris and Nannochloropsis sp.; 2:1. The values represent the mean ± SD. A shared superscript in the same row indicates no statistically significant difference (p > 0.05).
Disclaimer/Publisher’s Note: The statements, opinions and data contained in all publications are solely those of the individual author(s) and contributor(s) and not of MDPI and/or the editor(s). MDPI and/or the editor(s) disclaim responsibility for any injury to people or property resulting from any ideas, methods, instructions or products referred to in the content.