Article

A Thorough Insight into the Biofilm Properties of Potential Fish Pathogen Tenacibaculum discolor Strain FMCC B487

by
Eirini Schoina
1,
Laetitia Marchand
2,
Agata Zykwinska
2,
Corinne Sinquin
2,
Françoise Leroi
2,
Christine Delbarre-Ladrat
2 and
George-John E. Nychas
1,*
1
Laboratory of Microbiology and Biotechnology of Foods, Department of Food Science and Human Nutrition, School of Food and Nutritional Sciences, Agricultural University of Athens, 11855 Athens, Greece
2
Ifremer, MASAE Microbiologie Aliment Santé Environment, F-44000 Nantes, France
*
Author to whom correspondence should be addressed.
Aquac. J. 2024, 4(2), 76-91; https://doi.org/10.3390/aquacj4020006
Submission received: 4 April 2024 / Revised: 1 June 2024 / Accepted: 7 June 2024 / Published: 11 June 2024

Abstract

:
Tenacibaculum discolor develops biofilm in marine aquaculture production tanks and is identified as one of the causative agents of tenacibaculosis, a bacterial disease that causes significant losses in marine aquaculture production. In this study, the biofilm characteristics of T. discolor strain FMCC B487 were evaluated. Cell growth and biofilm formation and development were studied in miniaturized assays to assess the effect of different levels of environmental factors temperature and salinity, as well as the presence of monosaccharides potentially found in aquaculture hatcheries. The ability of the strain to grow and develop strong biofilms in ambient to high temperatures and at salinities above 20 g/L was shown. Mannose was the monosaccharide with the most prominent impact on the T. discolor strain FMCC B487 biofilm. The composition of planktonic cell extract, biofilm extracts, and extracellular polymeric substances (EPS) produced by T. discolor strain FMCC B487 were investigated by means of colorimetric and fluorometric assays as well as analyses by electrophoresis, gas chromatography, and high-performance size-exclusion chromatography coupled with a multiangle light scattering detector, revealing the dominance of proteins and lipids and the absence of high-molecular-weight polysaccharides. This information may serve as a basis for considering anti-biofilm strategies against the pathogen T. discolor.

1. Introduction

The increased global consumption of aquatic species has been reflected through the high aquaculture production which now contributes 49% to global aquatic animal production [1]. However, to achieve such an increase in production volumes, large-scale installations with high density are required. These conditions offer ideal ground for the emergence and spread of diseases, leading to animal fatalities and financial losses. In particular, bacterial pathogens may cause significant mortalities due to diseases such as vibriosis, tenacibaculosis (former flexibacteriosis), and mycobacteriosis [2]. Many of these bacterial pathogens have been found to develop biofilms on aquaculture installations, making them difficult to remove and treat [3].
Regarding these infectious bacterial diseases, tenacibaculosis is considered one of the most important [2], affecting marine aquaculture installations by causing significant losses [2,4,5]. The symptoms in fish include hemorrhagic mouth, ulcers on the skin, and fin and tail rot [2,6,7]. Apart from fish, tenacibaculosis has also been reported to affect mollusks [8,9]. Tenacibaculum maritimum is the most thoroughly studied species of the Tenacibaculum genus, since it was the first species recognized as the etiological agent of the disease [10]. So far it has been attributed to the disease in a variety of fish species [11,12,13,14,15,16,17]. Other Tenabibaculum species that have been identified as the causative agent of tenacibaculosis are Tenacibaculum dicentrarchi, Tenacibaculum discolor, Tenacibaculum finnmarkense, Tenacibaculum gallaicum, Tenacibaculum mesophilum, Tenacibaculum ovolyticum, and Tenacibaculum soleae [6,18]. Out of these species, biofilm formation has only been studied for T. maritimum [19], T. dicentrarchi [20], and T. mesophilum [21].
T. discolor has been previously isolated from marine aquaculture systems, either from the water column or from biofilm samples [22,23,24,25]. Up to now, there have only been a limited number of research studies on T. discolor, focusing mainly on antimicrobial compounds [26,27] and serotyping methods [5], while, to our knowledge, there are not yet available dedicated pathogenicity studies or studies that tackle the biofilm formation and properties of this potential pathogen, although biofilm poses major risks in aquaculture. Thus, in the present work, we provide more information about the growth and biofilm properties of T. discolor strain FMCC (Lab of Food Microbiology Culture Collection) B487. Particularly, the effect of environmental factors of temperature and salinity, as well as of monosaccharides on cell growth and biofilm development, were evaluated. To obtain a better insight on the strain, the biochemical composition of the strain’s planktonic and biofilm extracts was analyzed. Furthermore, extracellular polymeric substances (EPS) were produced by adding either glucose or mannose, and their biochemical composition was analyzed.

2. Materials and Methods

2.1. Bacterial Strain

Tenacibaculum discolor strain FMCC B487 (accession number PP860795) was first isolated from an experimental recirculation aquaculture system where seabass and seabream were reared [25]. The initial identification of the isolate was conducted with partial sequencing of the 16S rRNA gene and further assessed by whole genome sequencing analysis. The isolate was stored in Marine broth (Condalab, Madrid, Spain) supplemented with 20% glycerol at −20 °C. Working cultures were activated in Zobell medium (4 g/L Tryptone, 1 g/L yeast extract and 33.3 g/L aquarium salts) incubated at 25 °C for 24 h.

2.2. Biofilm Assays

2.2.1. Effect of Environmental Factors on Biofilm Formation

The effect of salinity and temperature on biofilm formation was investigated with the method of biofilm formation on polystyrene flat-bottom microplates followed by crystal violet (CV) assay [28]. The ability of the strain to form biofilms under different (i) temperatures (5, 15, and 30 °C) and (ii) salinities (10, 20, 30, and 40 g/L aquarium salt) was evaluated in Zobell medium. Temperature and salinity conditions were selected so as to cover a broad spectrum of environmental conditions found in aquaculture installations.
Ten microliters of 24 h culture were added to 10 mL of Zobell broth adapted with the desired salinity so as to reach a bacterial density of 106 cells/mL; the bacterial density was confirmed by serial dilutions on Zobell medium. Two hundred microliters were added in each microplate well. As a negative control, sterile Zobell broth was added. A series of 96-well polystyrene microtiter plates were used to assess the formation and development of biofilms under different conditions. The microtiter plates were incubated statically at appropriate temperature conditions for 48 h. At the end of the 48 h incubation period, optical density at 600 nm (OD 600) was measured in a Synergy HT multi-mode microplate reader (BioTek, Winooski, VT, USA). Then, a crystal violet (CV) assay was used to assess the biofilm formed under different treatments, as previously described [28] with slight modifications. Briefly, after the incubation period, planktonic and loosely attached cells were removed with pipetting. Sterile PBS was added to the wells and incubated for 5 min under agitation so as to remove the loosely attached cells. The PBS solution was removed and biofilm was fixed by adding methanol for 15 min. Methanol was then removed; wells were air dried and Crystal Violet aqueous solution (0.05% w/v) was added for 5 min. Stain was removed and wells were washed thrice with distilled water and allowed to air dry. The crystal violet adhered to the biofilm matrix was solubilized by adding 200 microliters absolute ethanol. The optical density was measured at 590 nm. As a control solution, a standard Zobell broth with a 33 g/L aquarium salt concentration was used. OD 600 was measured prior to CV assay to determine the impact of the salinity on the growth of the strain. A total of 3 independent biological replicates with 16 technical ones (48 in total) were performed for each treatment. Treatments were compared with the control using Student’s t-test.
Biofilm-forming capacity studied with the CV assay was expressed using cut-off values; the cut-off OD (ODc) was defined as the average OD of the negative control plus three standard deviations (SD) [29], and the biofilm forming capacity was classified as non, weak, moderate, and high biofilm former [30].

2.2.2. Effect of Monosaccharides on the Growth and Biofilm Formation of T. discolor Strain FMCC B487

The ability of T. discolor strain FMCC B487 to grow under the presence of various monosaccharides and form a biofilm was assessed in Zobell broth supplemented with (i) five monosaccharides [glucose (Glc), mannose (Man), galactose (Gal), glucosamine (GlcN), and fructose (Fru)] at (ii) three different concentrations (10, 20, and 30 g/L) for each. Bacterial growth was monitored by using microplates incubated at 25 °C for 65 h under continuous agitation in a Varioskan™ LUX (Thermo Fisher Scientific, Illkirch, France), measuring OD 600 every 30 min.
The formation of biofilms was assessed using CV assay in microtiter plates, as described above. The same type of microplate was used for growth monitoring and biofilm assessment. The optical density after CV staining was measured at 590 nm with a Varioskan™ LUX microplate reader. For each treatment, 3 independent biological and 4 technical replicates (12 in total) were performed.
The effect of the monosaccharides on the growth of the strain was assessed using the model of Baranyi and Roberts [31] by using the DMFIT software version 3.5 (Institute of Food Research, Reading, UK) for fitting of the data. Measurements (OD 600) were limited to 48 h so as to include only the lag, exponential, and stationary phases. The growth data were modelled as a function of time and the kinetic parameters μmax and lag were estimated. To assess the differences of both parameters between the control and the treatments, t-test or Mann–Whitney W-test were applied to compare either the means or medians. Statistical analyses were conducted with STATGRAPHICS Centurion XVII software (version 17.2.00, Statgraphics Technologies, Inc., The Plains, VA, USA) at a 95% confidence level.

2.3. Chemical Composition of Biofilm and EPS

2.3.1. Recovery of Biofilm Fractions

Biofilm recovery was performed as previously described by Passerini et al. [32] with slight modifications. Briefly, the strain was grown on Zobell medium at 25 °C under agitation (120 rpm) for 24 h. A dilution in fresh Zobell medium was performed so to reach an average OD at 600 nm of 0.1. Volumes of 10 mL of the freshly diluted culture were poured into each of the 40 Petri dishes (polystyrene, 90 mm of diameter) and left to form biofilms at 25 °C under gentle agitation (30 rpm) for 48 h.
After the incubation period, the planktonic sample was collected and the plates were then rinsed with 3 mL of sterile saline water (20 g/L NaCl). The biofilm formed on the bottom surface was collected using a sterile cell scraper while adding sterile saline water (2 mL per Petri dish). The total volumes of the recovered planktonic and adhered fractions were recorded. Aliquots in triplicates were fixed in sterile saline water that contained 37% formaldehyde for cell counts in a Thoma chamber with an Optika microscope model B-192 (100×) (Dutscher, Brumath, France).

2.3.2. Extracellular Polymeric Substances Production in Medium Supplemented with Carbohydrate

Extracellular polymeric substances (EPS) were extracted from biofilm planktonic and sessile fractions, as well as from liquid cultures in medium supplemented with carbohydrate, Glc, or Man. Erlenmeyer flasks containing 500 mL Zobell medium supplemented with either Glc (30 g/L) or Man (15 g/L) were inoculated with 5 mL of a 24 h culture of the strain. They were incubated under agitation (150 rpm) at 25 °C for 48 h. At the end of the incubation, the total volume of the cultures was collected. Aliquots in triplicates were fixed in sterile saline water with a final concentration of 2.5% formaldehyde, and enumeration of viable cells was performed as described above.

2.3.3. Preparation of Extracts

A series of extracts were obtained from the shake flask cultures and planktonic and adhered fractions from the biofilm experiment, as previously described in detail [32]. Biofilm, planktonic phase, and shake flask cultures from sugar-supplemented liquid medium were centrifuged (8000× g, 40 min, 10 °C); the supernatants were then filtered at 2.6 μm and at 0.7 μm (glass microfiber membrane), ultrafiltered at 100 kDa, and freeze dried. Before centrifugation, aliquots of 10 mL were collected for ethyl acetate extraction. Briefly, the acetate extraction procedure was as follows: addition of 10 mL ethyl acetate, blending for 30 s, and agitation for 15 min at 100 rpm. The supernatant was collected and the aqueous phase was subjected to a second extraction. Then, the two solvent phases were mixed and dried under nitrogen. Cell pellets were subjected to extraction with either NaOH or ethyl acetate. The cell pellets extracted with NaOH were dissolved in 5 mL NaOH (0.1% w/v) and incubated under agitation (100 rpm) for four hours. Acetic acid was then added to reach pH 7 and samples were centrifuged (30 min, 8000× g, at 10 °C). The supernatants were filtered on a sterile 0.22 µm cellulose acetate membrane (VWR, France), dialyzed on a 3.5 kDa Spectra Por 3 membrane, and freeze dried. Table 1 depicts all extracts obtained, their origin, and method of extraction. Their yield was recorded, and they were reconstituted with Milli-Q water at a concentration of 2 mg/mL, or at 1 mg/mL when yield was very low.

2.3.4. Chemical and Electrophoretic Assays and Molecular Weight Determination

All extracts, with the exception of ethyl acetate extracts, were subjected to various analyses as previously and thoroughly described [32]. Briefly, chemical analysis was performed with colorimetric/fluorometric methods for protein (bicinchoninic assay), carbohydrate (orcinol assay), DNA (Quant-it PicoGreen dsDNA assay (Invitrogen, Thermo Fisher Scientific, Illkirch, France)), and lipid with the sulfo-phospho-vanillin assay. Electrophoretic separations and stainings were also performed to study proteins, DNA, and glycopolymers. All the analyzed extracts had a concentration of 2 mg/mL. Agarose gels (0.7% agarose) were prepared in TAE (Tris Acetate EDTA buffer Thermo Fisher Scientific, Illkirch, France). Gels were stained with a cationic carbocyanine dye Stains-All (Sigma-Aldrich, Lyon, France) in order to reveal any anionic polymers. As a standard, GY785, a high-molecular-weight polysaccharide, was used [33]. Extracts were also analyzed by PAGE with 12% acrylamide gel (one hour at 200 V) and Stains-All staining or by SDS-PAGE (45 min at 100 V) at 10% SDS concentration using Coomassie Blue staining. As a marker, protein MW marker peq GOLD Marker I 116–14.4 kDa was used (VWR, Fontenay-sous-Bois, France).

2.3.5. Characterization of Carbohydrates

The osidic composition was determined by means of gas chromatography (8860 GC system, Agilent Technologies, Les Ulis, France) as previously described [34], following the method of Kamerling et al. [35] and modified by Montreuil et al. [36]. Samples of extracts with sufficient yield were prepared appropriately and analyzed in triplicates whenever possible. Myo-inositol was used as the internal standard.

2.3.6. Molecular Weight Determination

Extracts were analyzed by high-performance size-exclusion chromatography (HPSec) coupled with a multiangle light scattering detector (MALS, Dawn Heleos-II, Wyatt Technology, Santa Barbara, CA, USA), a differential refractive index (RI) detector (Optilab Wyatt technology, Santa Barbara, CA, USA), and a Prominence UV detector (Shimadzu Co., Kyoto, Japan). The HPSEC system was composed of an HPLC Prominence system (Shimadzu Co., Kyoto, Japan), a PL aquagel-OH mixed 8 µm (Agilent, Les Ulis, France) guard column (U 7.5 mm × L 50 mm), and a PL aquagel-OH mixed (Agilent, Les Ulis, France) separation column.

3. Results

3.1. Biofilm Assays

3.1.1. Effects of Environmental Factors on Biofilm Formation of T. discolor Strain FMCC B487

The effects of salinity and temperature on growth and biofilm formation of T. discolor strain FMCC B487 were investigated. Biofilm formation of the strain with different sea salt amounts was assessed by employing the CV assay. Notably, at the lowest salinity, neither growth nor biofilm formation was observed, while the growth of the strain was comparable under all the other treatments (Figure 1a). The observed differences in the normalized OD 590 values were not statistically significant, showing that salinity above 20 g/L has no further effect on the biofilm development (Figure 1b).
To assess the effect of temperature, cells were incubated statically under three different temperatures, at 5, 15, and 30 °C, in standard-salinity Zobell medium. OD 600 was measured after 48 h incubation, revealing no growth at 5 °C, while growth values increased significantly (p < 0.05) as temperature increased (Figure 1c). CV assay results recorded no biofilm at 5 °C, and normalized OD 590 values indicated significantly higher biofilm formation at 15 °C than at 30 °C (p < 0.05), as seen in Figure 1d. Overall, the strain exhibited strong biofilm formation capabilities under all but at low temperature (5 °C) and salinity (10 g/L), as growth was inhibited.

3.1.2. Effects of Monosaccharides on Growth and Biofilm Development of T. discolor Strain FMCC B487

The effects of five different monosaccharides at three concentrations on growth and biofilm development were investigated. Glc, Man, Gal, GlcN, and Fru were added at 10, 20, or 30 g/L. Growth was monitored by means of OD 600, and growth parameters were evaluated (Table 2). Regarding the growth of the cells, the addition of Glc did not increase the OD 600, but at concentrations above 20 g/L, lag time was significantly increased. Man addition increased the max OD600 (ymax) and lag time regardless of the concentration. At 30 g/L, μmax was decreased. When Gal was added, ymax was increased at all concentrations but lag time remained comparable to the control level below 30 g/L. Adding GlcN up to 20 g/L increased the ymax, lag time, and μmax, but at 30 g/L, growth was significantly decreased, as well as μmax. When Fru was present at 10 or 20 g/L, growth did not change significantly; however, lag time was significantly increased. At the highest concentration, fructose inhibited the growth of the strain. The following Table 2 summarizes the initial (y0) and maximum (ymax) OD, lag time, and μmax.
Biofilm biomass was assessed by the crystal violet assay (Figure 2). Addition of Glc did not affect biofilm development compared to the control, while no significant difference (p > 0.05) was observed among the averages obtained with different Glc levels. Man addition, on the contrary, resulted in significantly higher values in the CV assay (p < 0.05). By increasing the concentration of Man, three homogenous groups were created according to the CV values: the first without Man, the second with 10 and 20 g/L, and the third with the highest concentration of Man. Adding Gal at higher concentrations (20 and 30 g/L) resulted in higher CV values (p < 0.05) when comparing the median to no or low concentration of sugar. GlcN at concentrations up to 20 g/L resulted in significantly higher values (p < 0.05) in the biofilm assay. However, when GlcN was added at 30 g/L, the formation of the biofilm was inhibited. Adding Fru to the cultivation medium resulted in higher values of the assay, which were significant (p < 0.05) at 10 g/L Fru. The higher values obtained at 30 g/L may be due to the high sugar content, since growth was inhibited. Overall, when comparing all the treatments, the presence of Man in the incubation broth significantly induced the formation of biofilm, as seen in Figure 2.

3.2. Chemical Composition of Planktonic, Adhered Biofilm and EPS Extracts

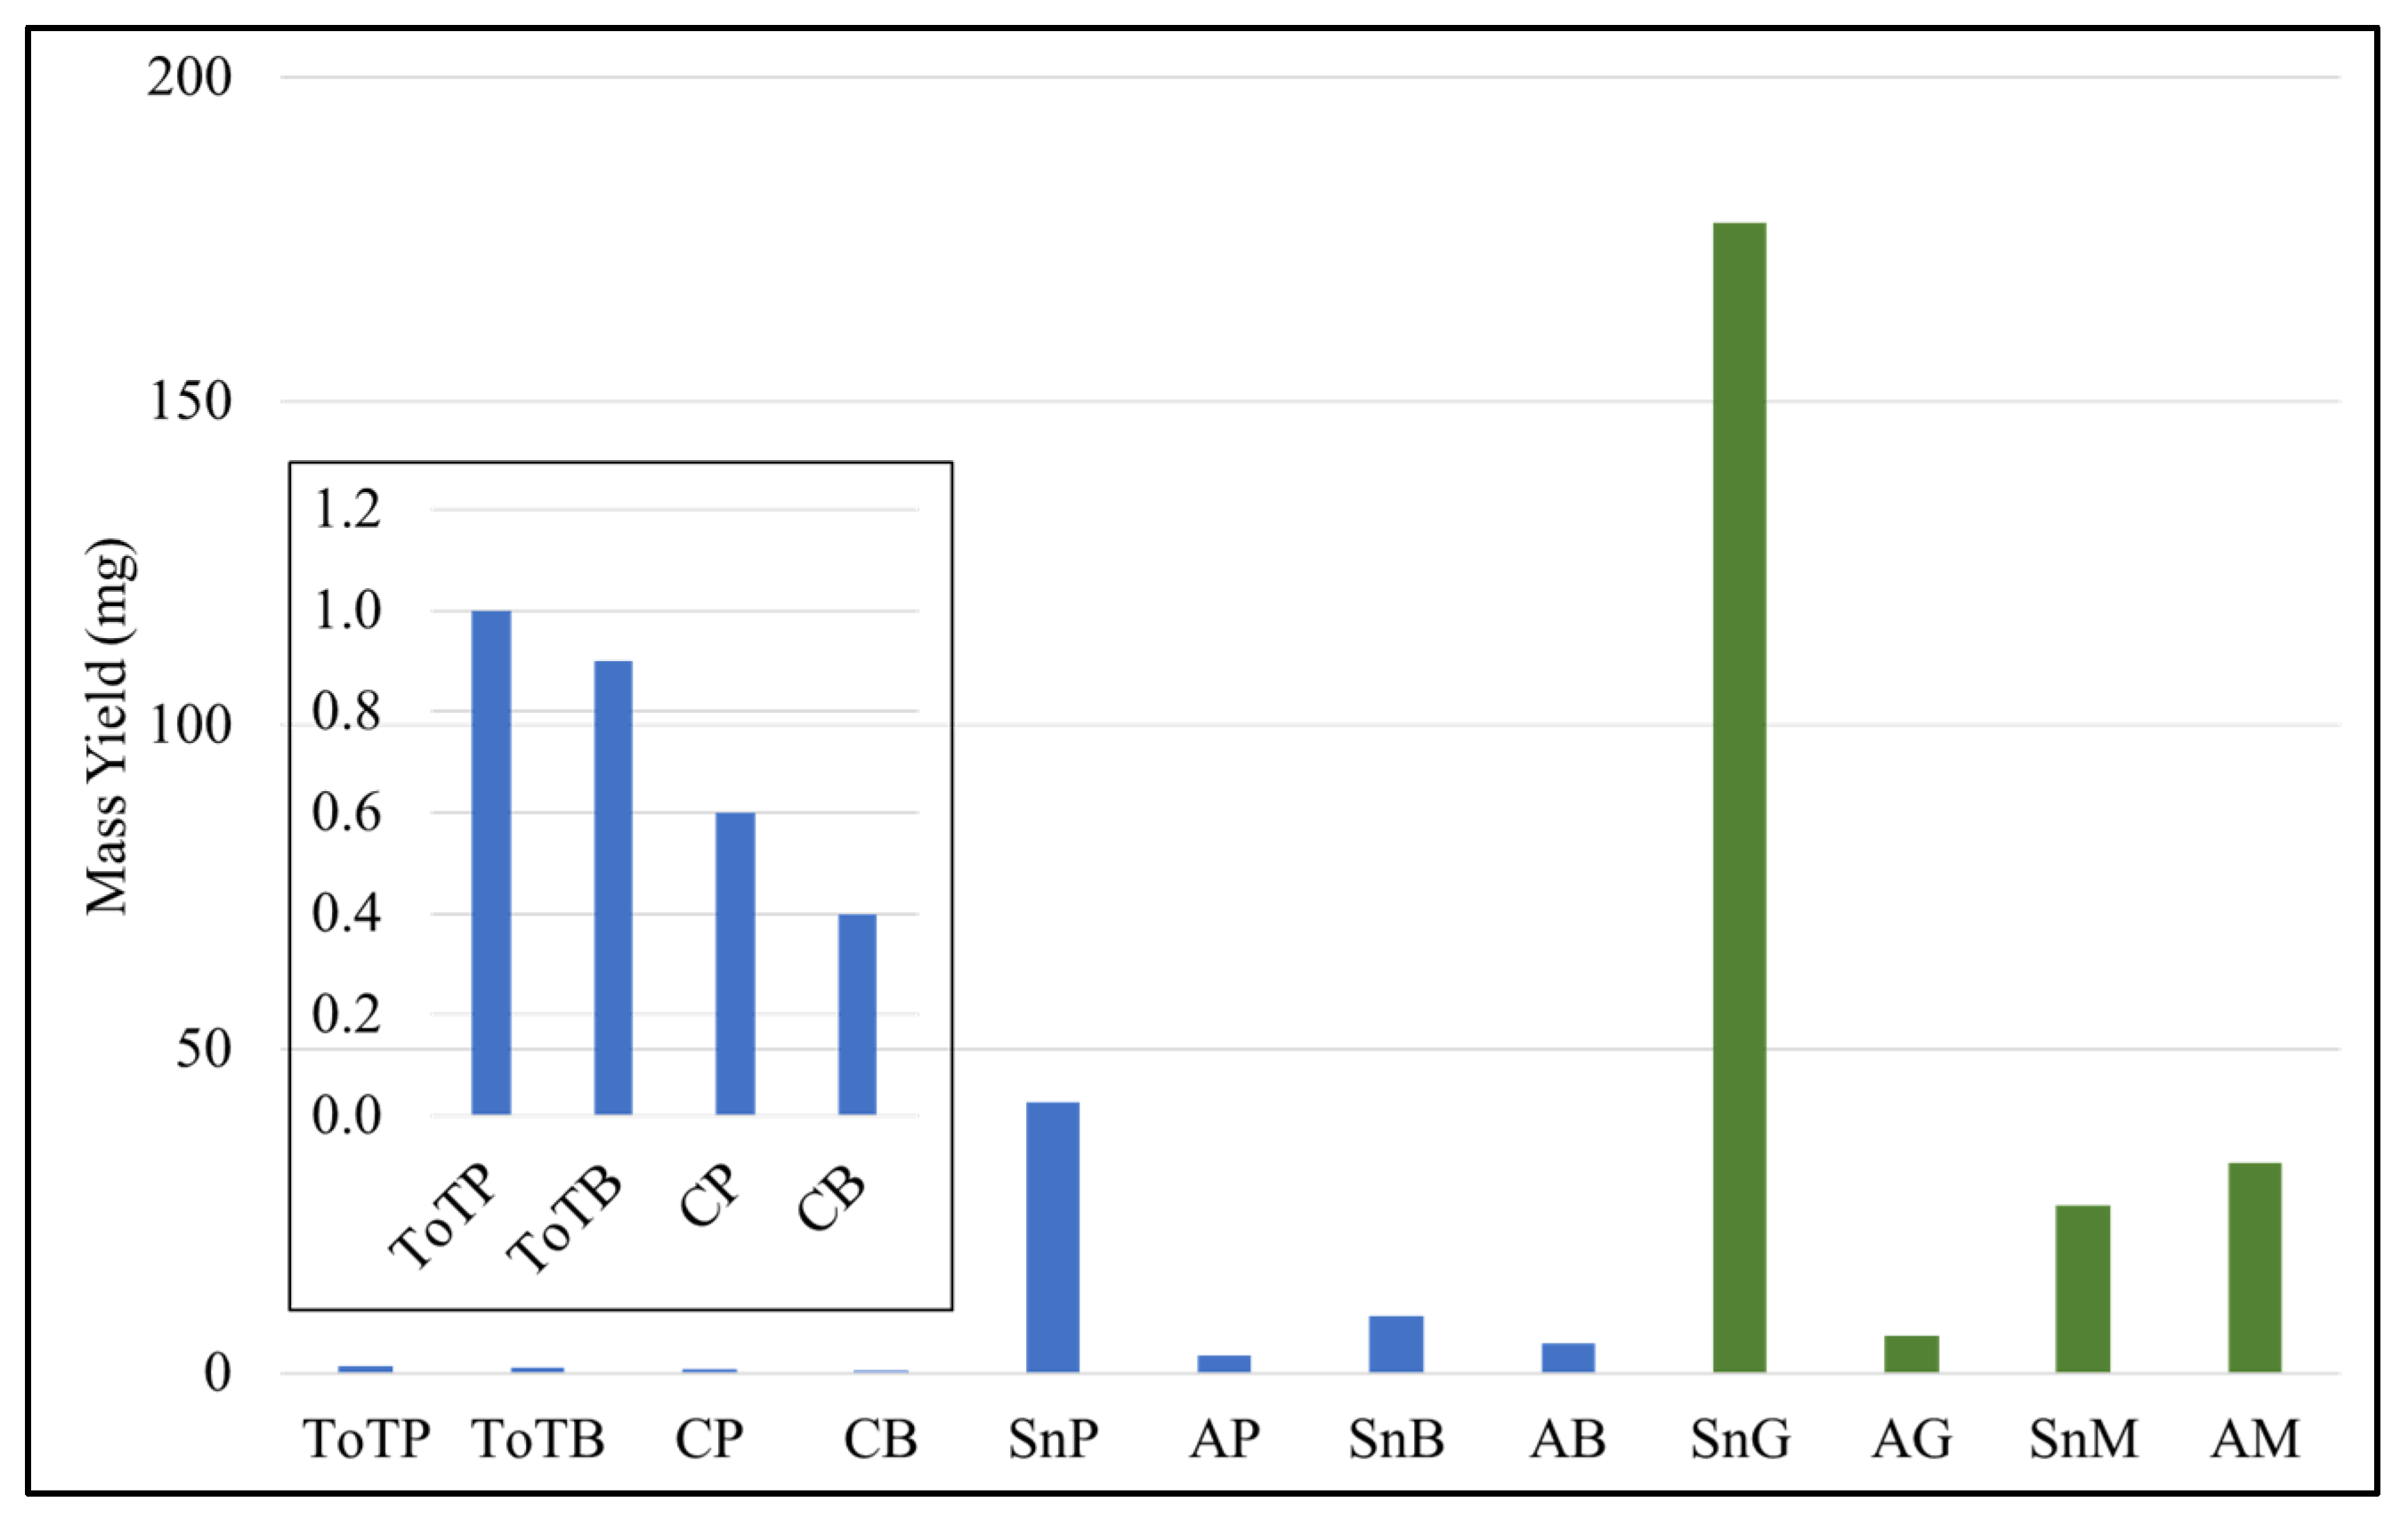
3.2.1. Yield of Cell Extracts

Biofilms were prepared on the bottom of plates and were recovered with a cell scraper. Volumes of planktonic and biofilm adhered cells suspensions were recorded, and the bacterial population from planktonic and adhered biofilm fractions was counted under the microscope. Cell numbers in all samples were high; 8.6 × 10¹¹ planktonic cells and 3.3 × 10¹⁰ biofilm cells were recovered. In shake flasks, mannose-supplemented medium resulted in 10 times more cells (5.1 × 10¹¹ cells) than glucose (2.9 × 10¹⁰ cells).
The recovery yield of dry matter was measured and is presented in Figure 3. A high extracted matter was recovered from the supernatant SnG where Glc was added to the medium in shake flasks, followed by the supernatant of planktonic cells SnP and the extracts from the NaOH extraction and supernatant of EPS production in shake flasks with mannose. Soluble compounds collected in the NaOH extracts (A) were generally lower than those of the corresponding supernatants (Sn), apart from the extracts from Man-supplemented cultures (AM > SnM). The extracted matter from the ethyl acetate extraction procedure was very low and did not exceed 1 mg.

3.2.2. Chemical Composition

The chemical composition (carbohydrate, protein, lipid, and nucleic acid content) of all aqueous extracts was determined using both colorimetric and fluorometric assays (Figure 4). The total amount of analyzed molecules reached a maximum of 71% (w/w) of the dry mass for the AM extract (surface-bound compounds from cells grown in shake flask with mannose-supplemented medium). Interestingly, proteins and lipids represented the main components of the majority of the extracts. Carbohydrates were low in the NaOH extracts from the cell surface, and DNA was detected only in the NaOH extracts from the cell surface; no DNA was found in the supernatants.

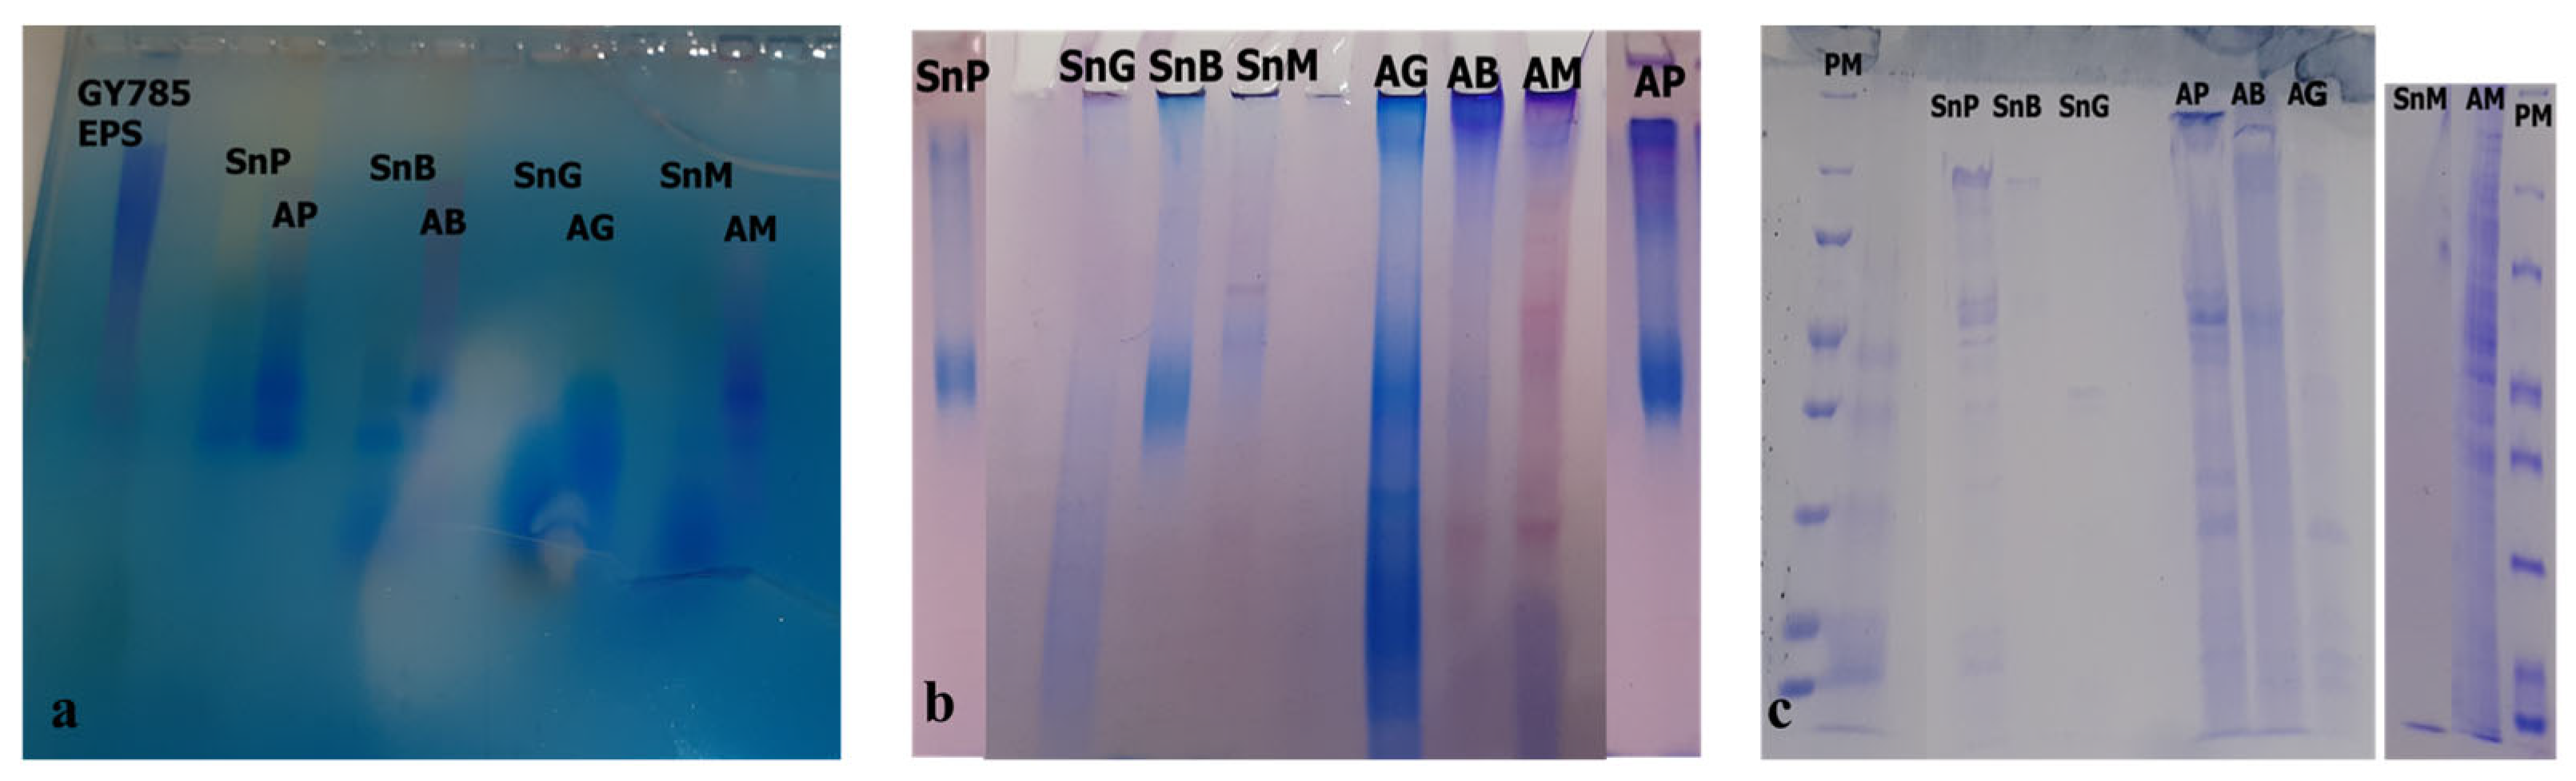
3.2.3. Electrophoretic Analyses

All extracts were analyzed by electrophoreses. Agarose gel analysis showed the absence of any high-molecular-weight compound in all of the tested extracts (Figure 5a). These results correlated with the low carbohydrate content as well as the PAGE analysis (Figure 5b). The EPS produced by addition of Glc or Man did not show high molecular weight carbohydrate. However, the high amount of protein content in all extracts was further confirmed from the SDS-PAGE and agarose gel. The presence of multiple bands on the gel (Figure 5c), especially in the AM extract (which had more than 50% proteins), suggest that the strain produces high concentrations of proteins which are secreted and are mainly part of the membrane cells. DNA was not detected in the electrophoresis gels, correlating to its low amount recovered from the extracts from the fluorometric method. Although ethyl acetate extracts were analyzed, they did not give any results due to their low mass content.

3.2.4. Osidic Composition

Gas chromatography was used to determine the osidic composition of all the lyophilized extracts (Figure 6). The carbohydrate amount of all extracts was low, especially in the NaOH extracts from the cells, and reached a maximum of 14% (w/w) of dry mass in planktonic supernatants. The lack of quantity required prevented the analysis of all extracts.
Planktonic supernatants soluble extracts (SnP) consisted mainly of Man followed by the neutral sugars Glc and Gal. N-acetylglucosamine (GlcNAc), galacturonic acid (GalA), and N-acetylgalactosamine (GalNAc) were also detected in low amounts. The mass of AP was not sufficient to perform the same analysis. The biofilm-cell supernatant (SnB), which had a very low carbohydrate content, showed only neutral sugars Man and Glc. On the contrary, the NaOH extract of these biofilm cells (AB) consisted of GalA and GalNAc.

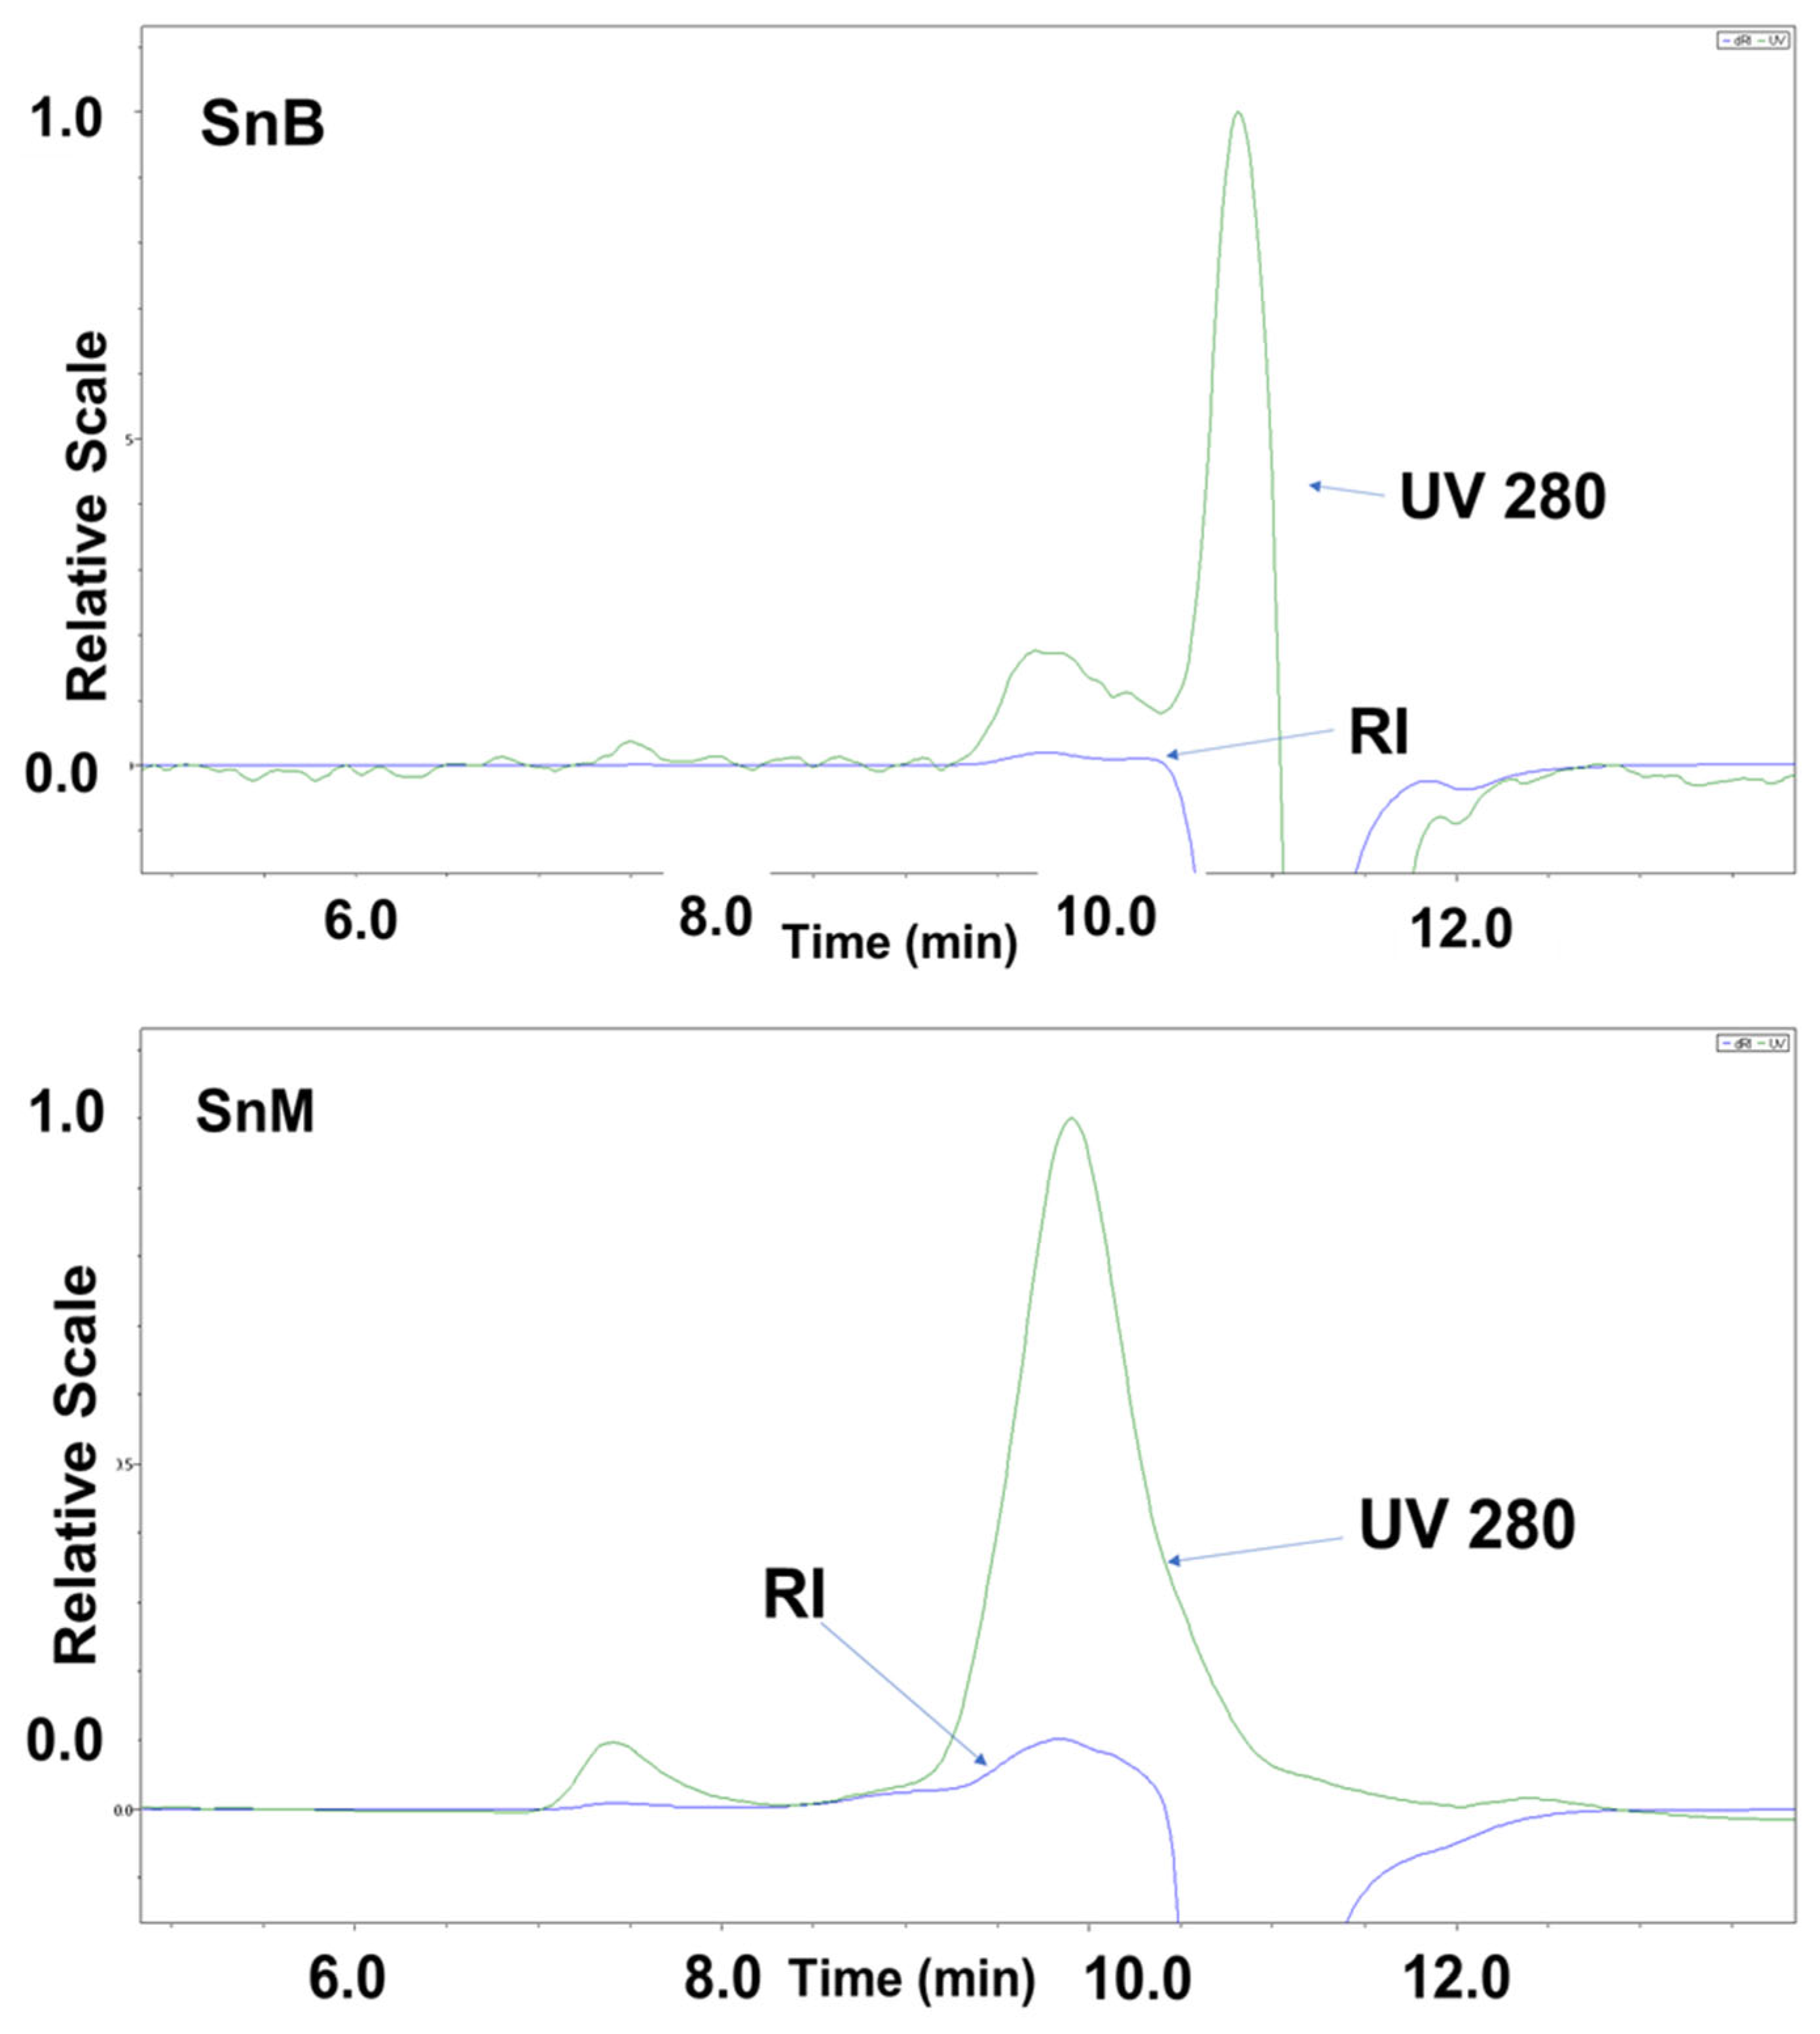
3.2.5. Molecular Weight Analysis

All the extracts (SnP, SnB, SnG, SnM, AP, AG, and AM) were analyzed by HPSEC-MALS. The refractometer detection (RI) showed very low amounts of carbohydrate polymer; only UV detection at 280 nm showed the presence of proteins. This confirmed the previous results of the chemical and osidic compositions, suggesting that the EPS produced by T. discolor strain FMCC B487 were of a protein nature. Indicatively, the chromatograms of SnB and SnM are depicted in Figure 7.

4. Discussion

Bacterial biofilms may impact aquaculture production as they serve as a constant source of bacterial pathogens to the reared species and act as a reservoir for them to re-colonize the water column [37,38], while after their development, biofilms can be resistant to disinfectants [3]. As demonstrated in the present study, T. discolor, a bacterium that has been previously characterized as a fish pathogen [39], was able to form biofilms on polystyrene surfaces, as pathogens T. maritimum [20] and T. dicentrarchi [19] have been reported to be able to previously. Tenacibaculum maritimum, the main cause of tenacibaculosis disease, has been thoroughly studied, and a vaccine has also been developed. However, in the literature, we see that other Tenacibaculum species may be considered pathogenic, one of those being T. discolor, for which we lack information. Here, we addressed a number of factors that may play a role in the growth and biofilm formation of T. discolor strain FMCC B487 and explored the composition of its biofilm and the produced EPS.
Environmental parameters, salinity and temperature, can impact the bacterial growth and biofilm formation. To challenge the ability of the strain to develop a biofilm, initially, salinity was assessed as a factor that may influence adhesion on surfaces. The effect of salinity, in terms of NaCl concentration, on the biofilm formation has been reported previously in other bacteria, such as Aeromonas hydrophila [40], Vibrio cholerae [41], and Vibrio parahaemolyticus [42], affecting gene regulatory pathways of quorum sensing, biofilm matrix production, and motility. In the present study, the strain’s growth and biofilm formation on polystyrene surfaces was limited when exposed to low salinity levels, implying its ability to contaminate only marine water aquaculture facilities. Temperature is one of the major environmental parameters that affects both growth and biofilm development. As reviewed by Garrett et al. [43], the optimum temperature for a microorganism is correlated with an increase in nutrient intake which results in rapid biofilm formation. Optimum temperature conditions for the species range from 25 to 30 °C, but it has been grown in a broader range between 14 and 38 °C [24]. In this study, the strain was grown under three different temperatures, 5, 15, and 30 °C, so as to investigate whether the “extreme” temperature conditions would promote biofilm or planktonic phase and to cover the whole range of temperature spectrum that is present in the seawater environment of the Mediterranean. Here, the strain did not grow at low temperature, and growth was significantly higher at higher temperatures. Data showed that the best conditions for T. discolor strain FMCC B487 to form a strong biofilm were ambient to warm temperatures and salinity levels between 20 and 33 g/L. This data comes in agreement with the presence of the species only in similar salinity conditions, as T. discolor has been only identified and isolated from marine aquaculture facilities [23].
Nutrients can also impact bacterial growth and biofilm formation. Neutral sugars can be found in aquaculture hatcheries, for example as components of microalgae added as feed for zooplankton or for water conditioning purposes [44,45]. These neutral sugars have been previously found to affect bacterial biofilm formation [32,46,47,48] and may be used for controlling biofilms [49,50]. Although mannose has been shown to act as an inhibitor of biofilm formation [51,52,53,54], in the present study, mannose addition in the culture medium promoted both growth and biofilm formation of the strain, regardless of the concentration tested.
As there was only limited information on the biochemical composition of the biofilm matrix as well as on the extracellular substances that T. discolor produces, a detailed work was conducted. By combining simple assays coupled with electrophoresis analyses, gas chromatography, and HPSEC-MALS, we were able to characterize the composition of extracellular and cell membrane-associated extracts from planktonic, sessile cells, and EPS produced by cells cultured in excess of glucose and mannose. In general, the yield of the extracts was low, especially for the ethyl acetate extracts as already described [32], so only aqueous extracts were further analyzed. The yield from the extracts of the membrane-associated compounds were lower than of the supernatants; however, it was increased when mannose was added in the culture broth.
Other marine bacteria have been reported to have a biofilm matrix rich in proteins and lipids [32,53]. Biochemical assays in this study revealed that all extracts of the strain were characterized by high protein and lipid levels. All analyses confirmed the dominance of proteins and the low levels of carbohydrates in these extracts. Even the addition of sugars for the production of EPS did not result in any high-molecular-weight polysaccharides, as confirmed by agarose gel, PAGE analysis, and HPSEC-MALS results.
The higher yield of the SnG extract can be explained by the monosaccharide composition analysis, which revealed that the SnG extract was rich in Glc. The EPSs produced in excess of Glc were composed of Glc, Man, Gal, and GlcNAc. Compared with the osidic composition of the SnP extract, this suggests that the strain probably did not utilize all the glucose added in the culture medium, resulting in residual Glc co-extracted with EPS. However, when EPSs were produced in excess of Man, the composition was comparable to the EPS extracted when no carbon source was provided. GlcA and Rha, found previously in the EPS of Flavobacterium columnare [55], were not detected in the EPS produced in the present study. Usually, the addition of a carbon source during the fermentation of marine bacteria can result in the production of extracellular polysaccharides [56]. For T. discolor strain FMCC B487, the addition of glucose did not result in an increase in carbohydrates rather than an increase in lipid content in the membrane-associated extract AG, but the addition of mannose resulted in a higher protein content, especially in the AM extract. In comparison, a recent study on T. maritimum showed that a great quantity of proteins was excreted and may play a role in biofilm formation and virulence [57].
Overall, for T. discolor strain FMCC B487 the supplementation with Man resulted in a massive increase in the cell membrane-associated proteins. This can be related to the increased capacity of the strain to form biofilm in the presence of Man. The effect of Man on the growth and biofilm formation of the species is yet to be investigated. D-mannose is utilized for the de novo biosynthesis of L-fucose, found in the polysaccharides of bacterial cell wall [58], and the biosynthesis of GDP-D-rhamnose [59]. However, in this study, these sugars were not detected in any of the analyzed strain’s extracts. The role of Man in bacterial adhesins has been demonstrated previously in the mannose-specific FimH protein of Escherichia coli [60], in which, upon mannose binding, the adhesin’s activity is regulated. Since the whole genome analysis of the strain has been realized, a future comparative analysis and search for similar adhesins could give us more information. Also, the addition of Man to the culture medium has been shown to induce the secretion of different carbohydrate-active enzymes (CAZymes) in a Streptomyces strain [61]. The increased presence of proteins in the extract AM, and of cell-associated compounds of mannose-supplemented medium, is in correlation with the aforementioned research. As the metabolic pathways involved are not yet clear, more studies on the isolation and characterization of the produced proteins could fill this knowledge gap.
In conclusion, in this study, we investigated factors that may influence the growth and biofilm formation, as well as the biofilm and EPS composition, of a T. discolor strain that we previously isolated from an aquaculture installation. As T. discolor is characterized as a potential fish pathogen, it was important to enrich our knowledge with this information on the composition of its biofilm matrix, which can give us clues about its eradication and the best selection of disinfectants, while the data of the factors that promote its biofilm development may help us predict its appearance pattern. Further studies on its mannose-induced produced proteins and compounds would offer a better insight into its virulence and biofilm development. Such a study can also benefit from omics techniques, including transcriptomics, proteomics, and metabolomics, to obtain a global and integrated overview of genes, proteins, and various compounds expressed differentially in planktonic cells and cells adhered to the surface in biofilms.

Author Contributions

Conceptualization, E.S. and G.-J.E.N.; methodology, E.S., L.M. and C.S.; software, E.S.; validation, E.S., L.M., C.S., A.Z. and C.D.-L.; formal analysis, E.S., L.M. and C.S. investigation, E.S.; resources, F.L., C.D.-L. and G.-J.E.N.; data curation, A.Z. and C.S.; writing—original draft preparation, E.S.; writing—review and editing, C.S., F.L., C.D.-L. and G.-J.E.N.; visualization, E.S.; supervision, F.L., C.D.-L. and G.-J.E.N.; project administration, G.-J.E.N.; funding acquisition, G.-J.E.N. All authors have read and agreed to the published version of the manuscript.

Funding

This research was funded by the European Union’s Horizon 2020 research and innovation programme under grant agreement No 774109 (project “Intelligent Management System for Inte- grated Multi-trophic Aquaculture—IMPAQT”).

Data Availability Statement

The original contributions presented in the study are included in the article, further inquiries can be directed to the corresponding author.

Conflicts of Interest

The authors declare no conflicts of interest. The funders had no role in the design of the study; in the collection, analyses, or interpretation of data; in the writing of the manuscript, or in the decision to publish the results.

References

  1. FAO. In Brief to the State of World Fisheries and Aquaculture 2022. Towards Blue Transformation; FAO: Rome, Italy, 2022. [Google Scholar] [CrossRef]
  2. Toranzo, A.E.; Magariños, B.; Romalde, J.L. A review of the main bacterial fish diseases in mariculture systems. Aquaculture 2005, 246, 37–61. [Google Scholar] [CrossRef]
  3. Mizan, M.F.R.; Jahid, I.K.; Ha, S.D. Microbial biofilms in seafood: A food-hygiene challenge. Food Microbiol. 2015, 49, 41–55. [Google Scholar] [CrossRef]
  4. Avendaño-Herrera, R.; Irgang, R.; Sandoval, C.; Moreno-Lira, P.; Houel, A.; Duchaud, E.; Poblete-Morales, M.; Ilardi, P. Isolation, Characterization and Virulence Potential of Tenacibaculum dicentrarchi in Salmonid Cultures in Chile. Transbound. Emerg. Dis. 2016, 63, 121–126. [Google Scholar] [CrossRef]
  5. Fernández-Álvarez, C.; Santos, Y. Identification and typing of fish pathogenic species of the genus Tenacibaculum. Appl. Microbiol. Biotechnol. 2018, 102, 9973–9989. [Google Scholar] [CrossRef]
  6. Avendaño-Herrera, R.; Collarte, C.; Saldarriaga-Córdoba, M.; Irgang, R. New salmonid hosts for Tenacibaculum species: Expansion of tenacibaculosis in Chilean aquaculture. J. Fish Dis. 2020, 43, 1077–1085. [Google Scholar] [CrossRef]
  7. Irgang, R.; González-Luna, R.; Gutiérrez, J.; Poblete-Morales, M.; Rojas, V.; Tapia-Cammas, D.; Avendaño-Herrera, R. First identification and characterization of Tenacibaculum dicentrarchi isolated from Chilean red conger eel (Genypterus chilensis, Guichenot 1848). J. Fish Dis. 2017, 40, 1915–1920. [Google Scholar] [CrossRef]
  8. Burioli, E.A.V.; Varello, K.; Trancart, S.; Bozzetta, E.; Gorla, A.; Prearo, M.; Houssin, M. First description of a mortality event in adult Pacific oysters in Italy associated with infection by a Tenacibaculum soleae strain. J. Fish Dis. 2018, 41, 215–221. [Google Scholar] [CrossRef]
  9. Sakatoku, A.; Fujimura, T.; Ito, M.; Takashima, S.; Isshiki, T. Newly isolated bacterium Tenacibaculum sp. strain Pbs-1 from diseased pearl oysters is associated with black-spot shell disease. Aquaculture 2018, 493, 61–67. [Google Scholar] [CrossRef]
  10. Suzuki, M.; Nakagawa, Y.; Harayama, S.; Yamamoto, S. Phylogenetic analysis and taxonomic study of marine Cytophaga-like bacteria: Proposal for Tenacibaculum gen. nov. with Tenacibaculum maritimum comb. nov. and Tenacibaculum ovolyticum comb. nov., and description of Tenacibaculum mesophilum sp. nov. and Ten. Int. J. Syst. Evol. Microbiol. 2001, 51, 1639–1652. [Google Scholar] [CrossRef]
  11. Khalil, R.H.; Diab, A.M.; Shakweer, M.S.; Ghetas, H.A.; Khallaf, M.M.; Omar, A.A. New perspective to control of tenacibaculosis in sea bass Dicentrarchus labrax L. Aquac. Res. 2018, 49, 2357–2365. [Google Scholar] [CrossRef]
  12. Kolygas, M.N.; Gourzioti, E.; Vatsos, I.N.; Athanassopoulou, F. Identification of Tenacibaculum maritimum strains from marine farmed fish in Greece. Vet. Rec. 2018, 170, 623. [Google Scholar] [CrossRef]
  13. Muñoz-Atienza, E.; Araújo, C.; Magadán, S.; Hernández, P.E.; Herranz, C.; Santos, Y.; Cintas, L.M. In vitro and in vivo evaluation of lactic acid bacteria of aquatic origin as probiotics for turbot (Scophthalmus maximus L.) farming. Fish Shellfish Immunol. 2014, 41, 570–580. [Google Scholar] [CrossRef]
  14. Småge, S.B.; Frisch, K.; Brevik, Ø.J.; Watanabe, K.; Nylund, A. First isolation, identification and characterisation of Tenacibaculum maritimum in Norway, isolated from diseased farmed sea lice cleaner fish Cyclopterus lumpus L. Aquaculture 2016, 464, 178–184. [Google Scholar] [CrossRef]
  15. van Gelderen, R.; Carson, J.; Nowak, B. Effect of extracellular products of Tenacibaculum maritimum in Atlantic salmon, Salmo salar L. J. Fish Dis. 2009, 32, 727–731. [Google Scholar] [CrossRef]
  16. Watanabe, K.I.; Nishioka, T. Antibacterial effect of chemical reagents against Tenacibaculum maritimum. Fish Pathol. 2010, 45, 66–68. [Google Scholar] [CrossRef]
  17. Wynne, J.W.; Thakur, K.K.; Slinger, J.; Samsing, F.; Milligan, B.; Powell, J.F.F.; McKinnon, A.; Nekouei, O.; New, D.; Cichmond, Z.; et al. Microbiome Profiling Reveals a Microbial Dysbiosis During a Natural Outbreak of Tenacibaculosis (Yellow Mouth) in Atlantic Salmon. Front. Microbiol. 2020, 11, 586387. [Google Scholar] [CrossRef]
  18. Nowlan, J.P.; Lumsden, J.S.; Russell, S. Advancements in characterizing Tenacibaculum infections in Canada. Pathogens 2020, 9, 1029. [Google Scholar] [CrossRef]
  19. Levipan, H.A.; Tapia-Cammas, D.; Molina, V.; Irgang, R.; Toranzo, A.E.; Magariños, B.; Avendaño-Herrera, R. Biofilm development and cell viability: An undervalued mechanism in the persistence of the fish pathogen Tenacibaculum maritimum. Aquaculture 2019, 511, 734267. [Google Scholar] [CrossRef]
  20. Levipan, H.A.; Irgang, R.; Tapia-Cammas, D.; Avendaño-Herrera, R. A high-throughput analysis of biofilm formation by the fish pathogen Tenacibaculum dicentrarchi. J. Fish Dis. 2019, 42, 617–621. [Google Scholar] [CrossRef] [PubMed]
  21. Dong, Y.; Feng, D.; Song, G.L.; Su, P.; Zheng, D. The effect of a biofilm-forming bacterium Tenacibaculum mesophilum D-6 on the passive film of stainless steel in the marine environment. Sci. Total Environ. 2022, 815, 152909. [Google Scholar] [CrossRef] [PubMed]
  22. Kee, H.L.; Mikheyeva, I.V.; Mickol, R.L.; Dawson, S.C.; Newman, D.K.; Leadbetter, J.R. Draft Genome Sequence of the Iridescent Marine Bacterium Tenacibaculum discolor Strain IMLK18. Microbiol. Resour. Announc. 2019, 8, 14–16. [Google Scholar] [CrossRef] [PubMed]
  23. Martins, P.; Cleary, D.F.R.; Pires, A.C.C.; Rodrigues, A.M.; Quintino, V.; Calado, R.; Gomes, N.C.M. Molecular analysis of bacterial communities and detection of potential pathogens in a recirculating aquaculture system for Scophthalmus maximus and Solea senegalensis. PLoS ONE 2013, 8, e0080847. [Google Scholar] [CrossRef] [PubMed]
  24. Piñeiro-Vidal, M.; Riaza, A.; Santos, Y. Tenacibaculum discolor sp. nov. and Tenacibaculum gallaicum sp. nov., isolated from sole (Solea senegalensis) and turbot (Psetta maxima) culture systems. Int. J. Syst. Evol. Microbiol. 2008, 58, 21–25. [Google Scholar] [CrossRef] [PubMed]
  25. Schoina, E.; Doulgeraki, A.I.; Miliou, H.; Nychas, G.-J.E. Dynamics of Water and Biofilm Bacterial Community Composition in a Mediterranean Recirculation Aquaculture System. Aquac. J. 2022, 2, 164–179. [Google Scholar] [CrossRef]
  26. Wang, L.; Linares-Otoya, V.; Liu, Y.; Mettal, U.; Marner, M.; Armas-Mantilla, L.; Willbold, S.; Kurtán, T.; Linares-Otoya, L.; Schäberle, T.F. Discovery and Biosynthesis of Antimicrobial Phenethylamine Alkaloids from the Marine Flavobacterium Tenacibaculum discolor sv11. J. Nat. Prod. 2022, 85, 1039–1051. [Google Scholar] [CrossRef] [PubMed]
  27. Wang, L.; Marner, M.; Mettal, U.; Liu, Y.; Schäberle, T.F. Seven New Alkaloids Isolated from Marine Flavobacterium Tenacibaculum discolor sv11. Mar. Drugs 2022, 20, 620. [Google Scholar] [CrossRef] [PubMed]
  28. Lianou, A.; Koutsoumanis, K.P. Strain variability of the biofilm-forming ability of Salmonella enterica under various environmental conditions. Int. J. Food Microbiol. 2012, 160, 171–178. [Google Scholar] [CrossRef] [PubMed]
  29. Diaz, M.; Ladero, V.; del Rio, B.; Redruello, B.; Fernández, M.; Martin, M.C.; Alvarez, M.A. Biofilm-Forming Capacity in Biogenic Amine-Producing Bacteria Isolated from Dairy Products. Front. Microbiol. 2016, 7, 591. [Google Scholar] [CrossRef]
  30. Yuan, L.; Burmølle, M.; Sadiq, F.A.; Wang, N.; He, G. Interspecies variation in biofilm-forming capacity of psychrotrophic bacterial isolates from Chinese raw milk. Food Control 2018, 91, 47–57. [Google Scholar] [CrossRef]
  31. Baranyi, J.; Roberts, T.A. A dynamic approach to predicting bacterial growth in food. Int. J. Food Microbiol. 1994, 23, 277–294. [Google Scholar] [CrossRef]
  32. Passerini, D.; Fécamp, F.; Marchand, L.; Kolypczuk, L.; Bonnetot, S.; Sinquin, C.; Verrez-Bagnis, V.; Hervio-Heath, D.; Colliec-Jouault, S.; Delbarre-Ladrat, C. Characterization of Biofilm Extracts from Two Marine Bacteria. Appl. Sci. 2019, 9, 4971. [Google Scholar] [CrossRef]
  33. Raguénès, G.H.C.; Peres, A.; Ruimy, R.; Pignet, P.; Christen, R.; Loaec, M.; Rougeaux, H.; Barbier, G.; Guezennec, J.G. Alteromonas infernus sp. Nov., a new polysaccharideproducing bacterium isolated from a deep-sea hydrothermal vent. J. Appl. Microbiol. 1997, 82, 422–430. [Google Scholar] [CrossRef] [PubMed]
  34. Zykwinska, A.; Le Berre, L.T.; Sinquin, C.; Ropartz, D.; Rogniaux, H.; Colliec-Jouault, S.; Delbarre-Ladrat, C. Enzymatic depolymerization of the GY785 exopolysaccharide produced by the deep-sea hydrothermal bacterium Alteromonas infernus: Structural study and enzyme activity assessment. Carbohydr. Polym. 2018, 188, 101–107. [Google Scholar] [CrossRef] [PubMed]
  35. Kamerling, J.P.; Gerwig, G.J.; Vliegenthart, J.F.G.; Clamp, J.R. Characterization by gas-liquid chromatography mass spectrometry of permethylsilylglycosides obtained in the methanolysis of glycoproteins and glycolipids. Biochem. J. 1975, 151, 491–495. [Google Scholar] [CrossRef] [PubMed]
  36. Montreuil, J.; Bouquelet, S.; Debray, H.; Fournet, B.; Spik, G.; Strecker, G. Glycoproteins. In Carbohydrate Analysis: A Practical Approach, 2nd ed.; Chaplin, M.F., Kennedy, J.K., Eds.; IRL Press: Oxford, UK, 1986; pp. 143–204. [Google Scholar]
  37. Almeida, D.B.; Magalhães, C.; Sousa, Z.; Borges, M.T.; Silva, E.; Blanquet, I.; Mucha, A.P. Microbial Community Dynamics in a Hatchery Recirculating Aquaculture System (RAS) of Sole (Solea senegalensis). Aquaculture 2021, 539, 736592. [Google Scholar] [CrossRef]
  38. Bourne, D.G.; Høj, L.; Webster, N.S.; Swan, J.; Hall, M.R. Biofilm Development within a Larval Rearing Tank of the Tropical Rock Lobster, Panulirus ornatus. Aquaculture 2006, 260, 27–38. [Google Scholar] [CrossRef]
  39. Fernández-Álvarez, C.; Torres-Corral, Y.; Santos, Y. Comparison of serological and molecular typing methods for epidemiological investigation of Tenacibaculum species pathogenic for fish. Appl. Microbiol. Biotechnol. 2018, 102, 2779–2789. [Google Scholar] [CrossRef]
  40. Jahid, I.K.; Mizan, M.F.R.; Ha, A.J.; Ha, S.D. Effect of salinity and incubation time of planktonic cells on biofilm formation, motility, exoprotease production, and quorum sensing of Aeromonas hydrophila. Food Microbiol. 2015, 49, 142–151. [Google Scholar] [CrossRef] [PubMed]
  41. Shikuma, N.J.; Yildiz, F.H. Identification and characterization of OscR, a transcriptional regulator involved in osmolarity adaptation in Vibrio cholerae. J. Bacteriol. 2009, 191, 4082–4096. [Google Scholar] [CrossRef]
  42. Li, X.; Sun, J.; Zhang, M.; Xue, X.; Wu, Q.; Yang, W.; Yin, Z.; Zhou, D.; Lu, R.; Zhang, Y. The Effect of Salinity on Biofilm Formation and c-di-GMP Production in Vibrio parahaemolyticus. Curr. Microbiol. 2022, 79, 25. [Google Scholar] [CrossRef]
  43. Garrett, T.R.; Bhakoo, M.; Zhang, Z. Bacterial adhesion and biofilms on surfaces. Prog. Nat. Sci. 2008, 18, 1049–1056. [Google Scholar] [CrossRef]
  44. Brown, M.R. The amino-acid and sugar composition of 16 species of microalgae used in mariculture. J. Exp. Mar. Biol. Ecol. 1991, 145, 79–99. [Google Scholar] [CrossRef]
  45. Whyte, J.N.C.; Nagata, W.D. Carbohydrate and fatty acid composition of the rotifer, Brachionus plicatilis, fed monospecific diets of yeast or phytoplankton. Aquaculture 1990, 89, 263–272. [Google Scholar] [CrossRef]
  46. Chai, Y.; Beauregard, P.B.; Vlamakis, H.; Losick, R.; Kolter, R. Galactose Metabolism Plays a Crucial Role in Biofilm Formation by B. subtilis. mBio 2012, 3, e00184-12. [Google Scholar] [CrossRef]
  47. Mizan, M.F.R.; Ashrafudoulla, M.; Sadekuzzaman, M.; Kang, I.; Ha, S.D. Effects of NaCl, glucose, and their combinations on biofilm formation on black tiger shrimp (Penaeus monodon) surfaces by Vibrio parahaemolyticus. Food Control 2018, 89, 203–209. [Google Scholar] [CrossRef]
  48. Piotrowski, M.; Wultańska, D.; Obuch-Woszczatyński, P.; Pituch, H. Fructooligosaccharides and mannose affect Clostridium difficile adhesion and biofilm formation in a concentration-dependent manner. Eur. J. Clin. Microbiol. Infect. Dis. 2019, 38, 1975–1984. [Google Scholar] [CrossRef]
  49. Ryu, E.J.; An, S.J.; Sim, J.; Sim, J.; Lee, J.; Choi, B.K. Use of D-galactose to regulate biofilm growth of oral streptococci. Arch. Oral. Biol. 2020, 111, 104666. [Google Scholar] [CrossRef]
  50. Ryu, E.J.; Sim, J.; Sim, J.; Lee, J.; Choi, B.K. D-Galactose as an autoinducer 2 inhibitor to control the biofilm formation of periodontopathogens. J. Microbiol. 2016, 54, 632–637. [Google Scholar] [CrossRef]
  51. Nadesalingam, J.; Dodds, A.W.; Reid, K.B.M.; Palaniyar, N. Mannose-Binding Lectin Recognizes Peptidoglycan via the N -Acetyl Glucosamine Moiety, and Inhibits Ligand-Induced Proinflammatory Effect and Promotes Chemokine Production by Macrophages. J. Immunol. 2005, 175, 1785–1794. [Google Scholar] [CrossRef]
  52. Oyofo, B.A.; Droleskey, R.E.; Norman, J.O.; Mollenhauer, H.H.; Ziprin, R.L.; Corrier, D.E.; DeLoach, J.R. Inhibition by mannose of in vitro colonization of chicken small intestine by Salmonella typhimurium. Poult. Sci. 1989, 68, 1351–1356. [Google Scholar] [CrossRef]
  53. Poosarla, V.G.; Wood, T.L.; Zhu, L.; Miller, D.S.; Yin, B.; Wood, T.K. Dispersal and inhibitory roles of mannose, 2-deoxy-d-glucose and N-acetylgalactosaminidase on the biofilm of Desulfovibrio vulgaris. Environ. Microbiol. Rep. 2017, 9, 779–787. [Google Scholar] [CrossRef]
  54. Sharon, N.; Eshdat, Y.; Silverblatt, F.J.; Ofek, I. Bacterial adherence to cell surface sugars. Ciba Found. Symp. 1981, 80, 119–141. [Google Scholar] [CrossRef]
  55. de Alexandre Sebastião, F.; Pilarski, F.; Lemos, M.V.F. Composition of extracellular polymeric substances (EPS) produced by Flavobacterium columnare isolated from tropical fish in Brazil. Braz. J. Microbiol. 2013, 44, 861–864. [Google Scholar] [CrossRef]
  56. Finore, I.; Di Donato, P.; Mastascusa, V.; Nicolaus, B.; Poli, A. Fermentation technologies for the optimization of marine microbial exopolysaccharide production. Mar. Drugs 2014, 12, 3005–3024. [Google Scholar] [CrossRef]
  57. Escribano, M.P.; Balado, M.; Toranzo, A.E.; Lemos, M.L.; Magariños, B. The secretome of the fish pathogen Tenacibaculum maritimum includes soluble virulence-related proteins and outer membrane vesicles. Front. Cell. Infect. Microbiol. 2023, 13, 1197290. [Google Scholar] [CrossRef]
  58. Tonetti, M.; Sturla, L.; Bisso, A.; Zanardi, D.; Benatti, U.; De Flora, A. The metabolism of 6-deoxyhexoses in bacterial and animal cells. Biochimie 1998, 80, 923–931. [Google Scholar] [CrossRef]
  59. Webb, N.A.; Mulichak, A.M.; Lam, J.S.; Rocchetta, H.L.; Garavito, R.M. Crystal structure of a tetrameric GDP-d-mannose 4,6-dehydratase from a bacterial GDP-d-rhamnose biosynthetic pathway. Protein Sci. 2004, 13, 529–539. [Google Scholar] [CrossRef]
  60. Kisiela, D.I.; Magala, P.; Interlandi, G.; Carlucci, L.A.; Ramos, A.; Tchesnokova, V.; Basanta, B.; Yarov-Yaroyoy, V.; Avagyan, H.; Hovhannisyan, A.; et al. Toggle switch residues control allosteric transitions in bacterial adhesins by participating in a concerted repacking of the protein core. PLoS Pathog. 2021, 17, e1009440. [Google Scholar] [CrossRef]
  61. Ohashi, K.; Hataya, S.; Nakata, A.; Matsumoto, K.; Kato, N.; Sato, W.; Carlos-Shanley, C.; Beebe, E.T.; Currie, C.R.; Fox, B.G.; et al. Mannose- and mannobiose-specific responses of the insect-associated cellulolytic bacterium Streptomyces sp. strain SirexAA-E. Appl. Environ. Microbiol. 2021, 87, e02719-20. [Google Scholar] [CrossRef]
Figure 1. Effect of environmental conditions on the growth (a,c) and biofilm formation (b,d) of T. discolor strain FMCC B487 under different salinities (a,b) and temperatures (c,d). OD 590 nm was normalized by dividing by OD 600. Biofilm formation is ranged as absent (-), moderate (++), and high (+++).
Aquacj 04 00006 g001
Figure 2. Effect of monosaccharides glucose (Glc), mannose (Man), galactose (Gal), glucosamine (GlcN), and fructose (Fru) at 10, 20, and 30 g/L on the biofilm formation of T. discolor strain FMCC B487. Y axis represents OD 590 nm values from the crystal violet assay. Bars show mean ± SD values. Asterisk (*) denotes significant difference from the control (p < 0.05).
Aquacj 04 00006 g002
Figure 3. Mass yield of prepared extracts. The extract names (ToT, C, Sn, A) are followed by B for biofilm-adhered cells, P for planktonic cells, and G for glucose or M for mannose added to the medium. Blue bars represent planktonic and adhered cell extracts from the biofilm experiments. Green bars stand for cultures in Erlenmeyer flasks. Ethyl acetate extracts were ToT for total extract from the whole broth, and C refers to cell pellets. Sn refers to the broth supernatant; A contains the substances bound to the cell surface that were extracted using NaOH.
Aquacj 04 00006 g003
Figure 4. Compositional analysis of planktonic, biofilm, and EPS extracts (w/w %).
Aquacj 04 00006 g004
Figure 5. Electrophoretic analyses of T. discolor strain FMCC B487 extracts: agarose gel (a) and PAGE (b) show the presence of medium- and low-molecular-weight polysaccharides with stains all staining, and SDS-PAGE stained with Coomassie Blue (c) shows a variety of proteins (two separate gels). Extracts: supernatants of planktonic (SnP) and adhered cell (SnB), supernatants of cultures in Erlenmeyer in presence of glucose (SnG) or mannose (SnM), and at the cell surface of planktonic (AP) and adhered cell extracts (AB), as well as glucose-supplemented (AG) and mannose-supplemented cultures (AM). PM: protein MW marker (peq GOLD Marker I 116–14.4 kDa); GY785: high-molecular-weight polysaccharide.
Aquacj 04 00006 g005
Figure 6. Osidic composition (w/w %) of T. discolor strain FMCC B487 extracts. GalNAc: N-Acetylgalactosamine; GlcNAc: N-Acetylglucosamine; GalA: galacturonic acid; GlcA: Glc: glucose; Gal: galactose; Man: mannose.
Aquacj 04 00006 g006
Figure 7. Combined chromatograms of RI (refractive index) and UV profiles from the HPSEC-MALS analysis of SnB and SnM extracts.
Aquacj 04 00006 g007
Table 1. List of the extracts, origin of isolation, extraction procedure followed, and target compounds. Extracts are named as described: ToT is the total extract obtained by ethyl acetate treatment, Sn is the broth supernatant, C refers to the cell pellet extracted with ethyl acetate, and A refers to the extracted substances of the cell surface using NaOH treatment. Acronyms are followed by letters that correspond to the following: P planktonic cells, B biofilm cells, G planktonic cells from cultures supplemented with glucose, and M planktonic cells supplemented with mannose.
ExtractOriginFractionExtraction ProcedureTarget
ToT-PBiofilmTotal planktonic cell brothEthyl acetateTotal compounds
ToT-BBiofilmTotal adhered cellsEthyl acetate
SnPBiofilmSupernatant of planktonic cell brothAqueous solutionExtracellular compounds
SnBBiofilmSupernatant of biofilm adhered cellsAqueous solution
SnGShake flask cultures supplemented with glucose 30% w/vSupernatant (Glucose supplemented)Aqueous solution
SnMShake flask cultures supplemented with mannose 15% w/vSupernatant (Mannose supplemented)Aqueous solution
CPBiofilmPlanktonic cellsEthyl acetateTotal compounds of cells
CBBiofilmBiofilm adhered cellsEthyl acetate
APBiofilmPlanktonic cellsNaOHCell membrane associated compounds
ABBiofilmBiofilm adhered cellsNaOH
AGShake flask cultures supplemented with glucose 30% w/vCell pelletNaOH
AMShake flask cultures supplemented with mannose 15% w/vCell pelletNaOH
Table 2. Effect of monosaccharides glucose (Glc), mannose (Man), galactose (Gal), glucosamine (GlcN), and fructose (Fru) at 10, 20, and 30 g/L on the growth parameters of T. discolor strain FMCC B487. Initial and maximum OD 600 represent y0 and ymax, respectively.
CarbohydrateConcentration (g/L)Initial OD 600Max OD 600Lag Time (hours)μ Max (h−1)
Control-0.125 ± 0.0280.908 ± 0.0810.0 ± 0.00.05 ± 0.00
Glc100.044 ± 0.0240.926 ± 0.0770.4 ± 0.60.05 ± 0.01
200.039 ± 0.0230.929 ± 0.0770.9 ± 1.3 *0.04 ± 0.01
300.097 ± 0.0330.870 ± 0.0874.1 ± 1.9 *0.04 ± 0.01
Man100.061 ± 0.0291.093 ± 0.084 *0.3 ± 0.5 *0.05 ± 0.01
200.050 ± 0.0251.131 ± 0.078 *0.5 ± 0.7 *0.05 ± 0.01
300.054 ± 0.0391.106 ± 0.076 *1.7 ± 1.7 *0.04 ± 0.01 *
Gal100.071 ± 0.0281.099 ± 0.072 *0.1 ± 0.30.05 ± 0.01
200.054 ± 0.0271.122 ± 0.059 *0.2 ± 0.70.05 ± 0.01
300.062 ± 0.0190.995 ± 0.083 *1.3 ± 1.4 *0.04 ± 0.01 *
GlcN100.007 ± 0.0171.228 ± 0.065 *0.3 ± 0.0 *0.07 ± 0.00 *
200.037 ± 0.0191.157 ± 0.073 *1.7 ± 0.8 *0.06 ± 0.01 *
300.090 ± 0.0090.299 ± 0.092 *2.0 ± 4.60.01 ± 0.00 *
Fru100.084 ± 0.0200.956 ± 0.0692.9 ± 1.2 *0.05 ± 0.01
200.156 ± 0.0180.903 ± 0.06117.7 ± 5.0 *0.05 ± 0.01
300.103 ± 0.0150.024 ± 0.041 *9.0 ± 10.8 *0.01 ± 0.02 *
Values are mean ± SD. Statistically significant difference (p < 0.05) from the control is noted with *.
Disclaimer/Publisher’s Note: The statements, opinions and data contained in all publications are solely those of the individual author(s) and contributor(s) and not of MDPI and/or the editor(s). MDPI and/or the editor(s) disclaim responsibility for any injury to people or property resulting from any ideas, methods, instructions or products referred to in the content.

