Abstract
Recirculation technology has been emerging in the marine aquaculture industry. The microbiome developed in recirculation aquaculture systems (RASs) is an important factor for the optimal operation of these systems and fish welfare. In this study, the microbial community dynamics in the water column and the biofilms of a marine RAS with Mediterranean species of gilthead sea bream and sea bass were investigated, while physicochemical conditions were also monitored. Microbiological, culture, and non-culture analyses based on PCR-Denaturing Gradient Gel Electrophoresis (PCR-DGGE) fingerprints were performed on the water column and biofilm developed on stainless-steel surfaces. According to the obtained results, feed administration seemed to cause changes in pH and TAN, as well as drive changes in the bacterial abundance in the water column. Tested surfaces were colonized within 24 h and sessile cells were stabilized in terms of density within 6 days. DGGE fingerprints indicated the stability of the microbial community in water and a dynamic succession in the community of the biofilms. The fish pathogen Tenacibaculum discolor was found to colonize the biofilm and the water column. The main findings confirmed that RAS technology can be used as a control strategy for the stability of the water microbial community, that there is a dynamic succession of the dominant species in the biofilm communities, and that pathogenic bacteria can be dominant in the latter.
1. Introduction
Aquaculture is a fast-growing agri-food sector, with constantly increasing production. Namely, in the years 2016–2018, the contribution of aquaculture to world fish production reached an important 46% of total fish production [1]. This augmentation of aquaculture production depicts the increase in the aquaculture industry worldwide. At the same time, limited water resources and the need for waste water management have led to the emerging use of recirculation aquaculture systems (RASs), which are becoming popular in the last decades [2]. Recirculation aquaculture provides advantages in the production, such as cost effectiveness and reduced environmental impact, as it requires less water usage and has improved waste management and nutrient recycling [3,4,5], offering sustainability in the aquaculture production industry [2]. Additionally, due to the controlled environmental conditions that a RAS can provide, this technology is suggested for species that require improved water quality [6]. Recirculation aquaculture has been extensively used in the hatchery production process [4], or in the early growing stages of Atlantic salmon [7,8], trout [9,10], and cod [11,12]. RASs are also used for the farming of marine fish such as turbot [13], sea bass [14], and sole [15].
RASs’ function and productivity are correlated with abiotic and biotic parameters, mainly water quality and microbiology. Bacterial communities consist of free-living bacteria in the water column as well as adhered bacteria on the surfaces of the tanks and biofilters. As already reviewed [16], these communities include nitrifying bacteria, non-pathogenic heterotrophs, as well as pathogens, and opportunistic and probiotic bacteria. RASs have been proposed previously as a microbial control strategy for the production of marine larvae, since they can maintain the water microbial community composition and diversity compared to flow through systems [12,17].
Bacterial biofilms can be a major problem in aquaculture. They may act as a constant source of bacterial infection for the reared species, as they can host pathogenic bacteria and act as a reservoir for them to recolonize the water column [15,18]. In addition, after their formation, biofilms tend to be resistant to disinfectants and to stress factors [19], resulting in the failure of their removal from the surfaces. After cleaning or disinfection procedures, some bacteria in biofilms survive, being able to replenish the biofilm and disperse into the liquid phase after biocide or antibiotic levels have been reduced [20].
PCR-Denaturing Gradient Gel Electrophoresis (PCR-DGGE) fingerprinting is a molecular tool applied in marine microbial ecology studies [21]. This technique was primarily used to profile the community complexity of bacterial biofilms [22] but has been recognized as a useful tool for studying the spatial and temporal variability of bacterial populations [21]. The PCR-DGGE technique has been used widely to assess bacterial communities in aquaculture installations [11,23,24,25,26,27,28], having also been characterized as a suitable technique to study the bacterial populations associated with larval stages during fish culture and live feed organisms [29].
Finfish aquaculture production in the Mediterranean region is focused mainly on European sea bass (Dicentrarchus labrax) and gilthead sea bream (Sparus aurata). To our knowledge, only a few studies on bacterial dynamics have been conducted in RAS specialized in Mediterranean fish species [14,30]. As production procedure shifts towards recirculation technology, there is a need to investigate and comprehend the microbiome dynamics in such systems, so as to provide a better understanding for the enhancement of production.
The aim of the present work was to assess the dynamics of the bacterial abundance and community composition in the water and biofilm of a Mediterranean RAS, where European sea bass and gilthead sea bream were reared. For this purpose, conventional microbiological analyses coupled with culture-dependent and independent molecular analyses, by means of PCR-DGGE, were employed, while water quality was also monitored. The outcome of this study is expected to provide valuable information regarding the microbial dynamics of a recirculation system designed for Mediterranean fish species.
2. Materials and Methods
2.1. RAS Setup General Information
The experiment was conducted in an experimental marine RAS kindly provided by the Laboratory of Applied Hydrobiology of the Agricultural University of Athens. The RAS with a total capacity of 5.9 m3 was operating over a period of three months. Outlet water from rearing tanks was passed through a mechanical filter (polyester filter pad), followed by two chambers of biological filters (submerged gravel biofilter) with a total volume of 0.24 m3. The hydraulic retention time of the biofilter was 0.09 h. Water was then passed through a degasser and a chamber where UV treatment was implemented as a disinfection strategy of the RAS, before entering the rearing tanks. The photoperiod was 12 h light and 12 h dark.
The RAS was stocked with adults of D. labrax with mean weights of 77.1 ± 13.9 g and S. aurata with mean weights of 154.0 ± 18.6 g. The initial stocking density of the RAS was low, at 2.1 kg m−3. Fish were fed by hand three times per week with a commercial pellet diet until satiation, corresponding to a feed loading ranging from 450 to 500 g. The management of the RAS also included regular removal of solids and uneaten feed from fish tanks, cleaning of mechanical filters, the addition of make-up water (seawater and/or tap water), and inspection of fish. Water conditions were maintained optimal to ensure the welfare of both fish species and no mortality was observed during the experimental period.
Manipulations took place in a 120 L aquarium tank without fish, part of the aforementioned RAS. The water flow rate in the tank was set at 2.5 L min−1. Triplicates of sterilized stainless-steel coupons, of measurements 2.5 × 1 × 0.1 cm and surface area 5.7 cm2 (AISI-304, Halyvourgiki Inc., Athens, Greece), were placed in plastic nets, folded as small folders, and hanged from the aquarium lid with a fishing line, so as to be at a distance of about 5–10 cm from the bottom (12 folders in total). An air stone ensured the constant movement of these plastic folders.
2.2. Water Parameter Analyses
Water quality parameters were measured on a regular basis. Dissolved oxygen, temperature, and pH were measured daily with portable electrodes (Hack Lange GmbH, Düsseldorf, Germany), while salinity was measured with a refractometer. Measurement of nitrogenous waste products, that is total ammonia nitrogen (TAN) and nitrite nitrogen (NO2−), were conducted with spectrometric methods [31,32]. Unionized ammonia (NH3-N) concentration was calculated from TAN and pH taking into consideration temperature and salinity values [33]. Analyses of total ammonia nitrogen and nitrite nitrogen were performed on filtered water samples, acquired 3 times per week, and stored at −20 °C until further analysis. Values are presented as mean value ± standard deviation (SD).
2.3. Bacterial Abundance Assessment in Water and Biofilms
Samples of water and biofilms were collected in the morning prior to fish feeding, placed directly into sterilized glass bottles, and transferred to the lab for further analysis. Classic methods of observation and examination of biofilms adopt sampling of predetermined surfaces or expose surfaces under examination, which are then transferred to the laboratory for examination. With this in mind, in the present study, sterile stainless-steel coupons were utilized for the assessment of the in situ formation and development of the biofilms. The microbial community from the water column and the biofilms developed on the stainless-steel coupons was investigated by standard microbial plating techniques. Samplings for water microbiological analysis were conducted at days 0, 1, 2, 3, 4, 7, 11, 14, 18, 21, 25, 28, and 30. Samplings for biofilms developed on the coupons were conducted accordingly, apart from the initial day of placement.
Sessile cells from the coupons were retrieved using the bead vortexing method according to protocol by [34] with slight modifications. Briefly, coupons were rinsed by pipetting with 10 mL of sterile Maximum Recovery Diluent (MRD) to remove loosely attached cells and were transferred in plastic tubes which contained 6 mL MRD and 10 glass beads. Biofilm cells were detached from the coupons by vortex at maximum speed for 2 min and the bacterial solution was sampled. The detachment of sessile cells by vortex shaking with glass beads is a method already proven to successfully remove both cells and extracellular polymeric substances from stainless-steel test surfaces [35]. Enumeration of viable biofilm cells and planktic cells from the water samples was performed by plating after 10-fold dilutions on Marine Agar (Condalab, Madrid, Spain) triplicate plates incubated for 72 h at 25 °C. The number of Colony Forming Units (CFU) was calculated as the average of colonies after counting plates containing 30–300 colonies. Results are presented as Colony Forming Units (CFU) ml−1 in the case of water samples or CFU cm−2 for biofilms.
2.4. Identification of Dominant Bacterial Colonies
Representative colonies from dominant morphologies were isolated by serial streaking on Marine Agar to obtain pure cultures. The selection of the colonies was based on morphological characteristics, such as color, shape, and size, so as to cover all different morphologies observed on the agar plates throughout the experimental period. Identification of bacterial species was conducted by partial sequencing of the 16S rRNA gene, as previously described [36].
2.5. Monitoring of Bacterial Dynamics in Tank Water Samples and Biofilms
The temporal changes in the bacterial community composition of the tank water, as well as the biofilms, were assessed by PCR-DGGE based on the 16S rRNA gene. DGGE is a tool that can be used to study diversity, changes, and differences in the development of the combined cultivable and non-cultivable fraction of the microbial community [22,37]. The bacterial DNA extracted from tank water samples and biofilms formed on stainless-steel coupons was amplified and analyzed by PCR-DGGE.
2.6. DNA Extraction
Tank water samples (50 mL) and samples from the bacterial solution of the detached cells of each coupon (4 mL) in triplicate were centrifuged at 5000× g for 10 min, the supernatant was discarded and pellets were stored at −20 °C until DNA extraction. Total DNA from the water and biofilm samples was obtained by a bacterial cell extraction method based on a combination of enzymatic and chemical cell lysis, as described previously [38]. In brief, pellets were resuspended in 0.5 mL buffer solution (1 M sorbitol, 0.1 M EDTA, pH 7.5) that contained 25 mg ml−1 lysozyme, incubated for 2 h at 37 °C, and centrifuged at 14,000 rpm for 10 min at 4 °C. Pellets were resuspended in 0.5 mL buffer solution (50 mM Tris–HCl, 20 mM EDTA, pH 7.4), 50 μL 10% SDS solution was added and samples were incubated for 30 min at 65 °C. Then, samples were mixed with 0.2 mL potassium acetate (5Μ), placed on ice for 30 min, and centrifuged at 14,000 rpm for 10 min at 4 °C. Isopropanol was added for DNA purification. The total amount of nucleic acids extracted from samples were finally resuspended in 25 μL DNase-free water. Total DNA was quantified with a Nanophotometer (Implen, Munich, Germany) and the DNA extracts were stored at −20 °C for further analysis.
2.7. PCR-DGGE
PCR products for DGGE analysis were generated by amplification of DNA extracted from water and biofilm samples. Universal primers for the domain bacteria were used for amplification of the hypervariable V3–V5 regions on the 16S rRNA gene. Primers used were 341 F (5′-CCTACGGGAGGCAGCAG-3′) and 907 R (5′-CCGTCAATTCCTTTGAGTTT-3′). The forward primer had a 40bp rich GC clamp (5′-CGCCCGCCGCGCCCCGCGCCCGTCCCGCCGCCCCCGCCCG-3′) attached to the 5′ end [22]. The reaction mixture contained the following: 2.5 μL PCR buffer (10 × PCR buffer B with 1.5 mM MgCl2, Kappa Biosystems, Wilmington, NC, USA), 0.8 mM dNTPs, primers (each 0.5 µM), 1 U Taq DNA polymerase (Kappa Biosystems, Boston, MA, USA), 2 μL DNA (30–50 ng), and sterile distilled water to bring the final volume to 25 μL. PCR amplification was performed under the following conditions: an initial denaturation step at 94 °C for 5 min, 35 cycles of denaturation at 95 °C for 30 s, primer annealing at 55 °C for 30 s, and primer elongation at 72 °C for 1 min, followed by a final elongation step at 72 °C for 10 min to generate DGGE-compatible fragments [22]. All amplification products (~580 bp) were examined for length and purity by electrophoresis on 1.2% agarose gels, stained with ethidium bromide, and visualized under UV light in a Bio-Rad GelDoc 2000 system (Bio-Rad Laboratories Inc., Hercules, CA, USA).
DGGE was performed using the D-Code Universal Mutation Detection System (Bio-Rad, Hercules, CA, USA). PCR products mixed with equal volume of loading dye buffer were loaded on 1 mm thick 6% (w/v) polyacrylamide-bisacrylamide (37.5:1) gels in 1X TAE buffer (20 mM Tris, 10 mM acetate, 0.5 mM Na2 EDTA, pH 7.4), with denaturing chemical gradient ranging from 20% to 60% (100% corresponds to 7M urea and 40% (v/v) deionized formamide). The gel was run at 60 °C first for 10 min at 50 V followed by 4 h at a constant voltage of 200 V. After electrophoresis, the denaturing gradient gel was stained with ethidium bromide, visualized, and photographed under UV light with a GelDoc 2000 system. Three gels were run, the first with water samples, the second with biofilm samples of only one coupon for all time points, and a third with samples of water and biofilms (in triplicate) of time points when the previous feeding was performed at least 48 h before sampling. Samples from coupons were treated as replicates, although RAS was not replicated. The ladder that was used to normalize the DGGE lines was created by mixing DNA from pure cultures of three bacterial strains originating from the bacterial collection of the Laboratory of Microbiology and Biotechnology of foods: Tenacibaculum discolor FMCC B487 (isolated in the present study), Pseudomonas fluorescens FMCC B220, and Vibrio harveyi FMCC B177.
DGGE gel images were edited appropriately and analyzed using the Jaccard coefficient and dendrograms were obtained by the unweighted pair group method with arithmetic mean (UPGMA) cluster analysis with 5% tolerance, by using the BioNumerics software version 6.1 (Applied Maths, Sint-Martens-Latem, Belgium).
2.8. Excision of Bands and Sequencing Data Analysis
Selected dominant DGGE bands, were excised from the gel and eluted in 20 µL sterile distilled water overnight at 4 °C. Concerning bands with the same distance from well in different lanes, only one band was cut representing the same bacterial V3–V5 region of 16S rDNA. Four µL of the eluted DNA was used as a template in a PCR with the same primers and conditions as described above and the electrophoretic mobility of re-amplified bands was checked on a new DGGE gel, so as to confirm that it migrated as a single band to the same position. PCR products with correct mobility were purified and sequenced. Purification was performed using 3M sodium acetate and ethanol and incubating at −80 °C overnight. Sequencing was performed by CeMIA S.A. (Larissa, Greece), using the reverse primer 907R and sequencing data were aligned to the closest relative in the database using the BLAST algorithm optimized for highly similar sequences (blastn) (www.ncbi.nlm.nih.gov/blast) accessed on 27 April 2021. Sequences with 97% or higher identity were considered to represent the same species. The online platform Venny 2.1 [39] was used for the formation of Venn diagrams for the biofilm samples.
2.9. Statistical Analysis
Statistical analysis was conducted with STATGRAPHICS Centurion XVII software (version 17.2.00, Statgraphics Technologies, Inc., The Plains, VA, USA) at a 95% confidence level. The effect of time from feeding on pH, nitrite, TAN, and water bacterial abundance was evaluated using a one-way analysis of variance (ANOVA). Data variance was checked using Cochran’s test. Means were compared using Duncan’s multiple range test, while for data that did not meet Cochran’s criterion, the median was compared using the non-parametrical Kruskal–Wallis test.
3. Results
3.1. Determination of Physicochemical Parameters
During the experimental period, water physicochemical parameters remained within values that ensured optimal rearing conditions for bass and bream. Mean values and their standard deviation were as follows: temperature 23.5 ± 0.4 °C, salinity 35.3 ± 0.5 psu, pH 7.06 ± 0.11, oxygen saturation 100.6 ± 0.6%, nitrite 0.14 ± 0.08 ppm, TAN 0.07 ± 0.03 ppm, and unionized ammonia below 0.05 ppm. Although the pH seemed relatively stable throughout the experimental period, slight fluctuations which correlated with the feeding regime were observed (Figure 1). However, there were no statistically significant differences between any pair of means among the different times from feeding (p > 0.05). pH was decreasing 24 h after feeding and was recorded to be higher 48–96 h after feeding. Similarly, concentrations of nitrite and TAN showed fluctuations which also correlated with the feeding regime (Figure 2). Significantly greater values of TAN were measured at samplings performed 24 h after feeding and lowest values at 48–72 h after feeding (p < 0.05). Nitrite data were compared non-parametrically and showed that there was a statistically significant difference among the medians at the 95.0% confidence level, with values after 24 h of feeding being higher.
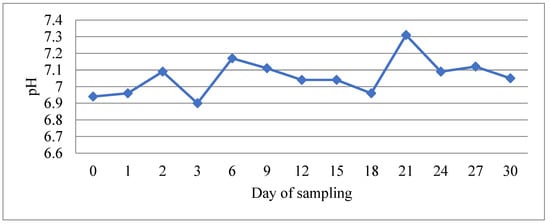
Figure 1.
The evolution of water pH value during the experimental period. The low value at day 3 corresponds to 24 h after feeding and the high value at day 21 to 96 h after feeding.
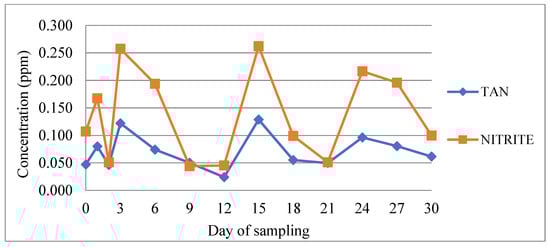
Figure 2.
Concentration of nitrite and total ammonia nitrogen (TAN) during the experimental period. An increase in both values at days 1, 6, 15, 24, and 27 corresponds to 24 h after feed administration.
3.2. Assessment of Bacterial Population in Tank Water and on Stainless-Steel Surfaces
Regarding the microbiological analysis in this study, the Marine Agar medium used here is designed for the enumeration of aerobic heterotrophic bacteria. Consequently, all bacterial colonies counted correspond to heterotrophic aerobes which are viable and culturable under these growing conditions. Analyses revealed that the population of marine heterotrophic bacteria in the water column ranged from 1.6 × 10⁴ to 2.4 × 10⁵ CFU ml−1 with a mean value of 6.1 × 10⁴ CFU ml−1. The abundance of planktic bacteria was observed to be relatively stable from the 9th day and throughout the rest of the duration of the experiment, as seen in Figure 3. Nevertheless, a tendency for higher values was recorded at days 0, 3, 6, and 15 (p > 0.05), which correspond to 24 h after feeding. Particularly, the high microbial abundance at day zero may be explained by the cleaning procedures that occurred prior to the deployment of the stainless-steel coupons. These procedures included cleaning and scraping the surfaces of all tanks of the RAS, followed by a 50% water renewal. These actions may have dispersed the adhered bacterial cells in the water column, resulting in increased CFU counts.
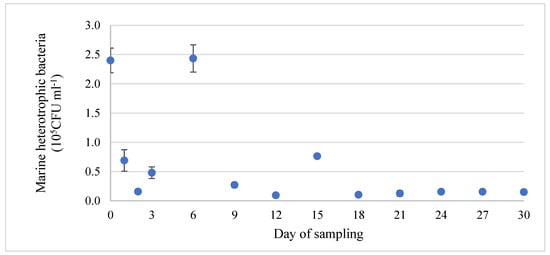
Figure 3.
Evolution of the microbial population (heterotrophic bacteria) (blue dot) of the water column during the experimental period (mean value ± SD).
The assessment of the development of the biofilms was performed on sterilized stainless-steel coupons, which is a practice commonly used in biofilm studies. Within 24 h after deployment of the coupons into the RAS, surfaces were colonized by bacteria. The abundance of heterotrophic sessile bacteria reached a density of 1.2 ± 0.6 × 10⁵ CFU cm−2 and remained at this level for the first 72 h. Bacterial density was increased on the 6th day almost 6 times in comparison with the initial density. From this time point and until the end of the experiment, the 30th day, bacterial density remained unchanged (Figure 4).
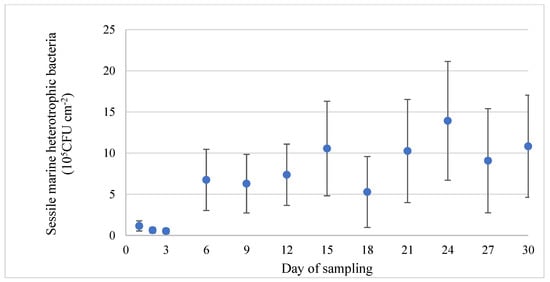
Figure 4.
Evolution of bacterial density (heterotrophic bacteria) (blue dot) of the biofilms formed on stainless-steel coupons (mean value ± SD).
3.3. Assessment of Microbiota in Water Column and on Stainless-Steel Surfaces
Temporal changes in the bacterial community associated with the RAS of both water column and biofilms were assessed by a culture-independent molecular technique. Throughout the experiment, representative colonies that were dominant on Marine Agar plates were isolated, purified by serial streaking, and identified by 16S rRNA gene partial sequencing of the hypervariable regions V1–V3. Different colonies were retrieved from various time points both from the water column and biofilm samples, so as to gain more information about the dominant culturable heterotrophic bacteria that are found in the particular RAS. A total of 10 different species were identified, mostly belonging to the classes Gamma-proteobacteria and Flavobacteriia. The complete list of the identified microorganisms is presented in Table 1. From the class Gamma-proteobacteria, Vibrio atypicus and three members of the Pseudoalteromonas genus were identified. Four members of the family Flavobacteriaceae were identified: three of them forming distinct yellow pigmented colonies, while the fourth was forming distinctive iridescent colonies. The latter was identified as the fish pathogen Tenacibaculum discolor, which was present in all temporal samples originating from both the water column and biofilm. Additionally, a member of class Alpha-proteobacteria, Roseovarius halotolerans, was isolated.

Table 1.
Sequence similarities of the isolated bacterial colonies.
In order to assess the changes in the bacterial community composition and identify the dominant bacteria of the water column and biofilms a series of samples were selected at different time points: one replicate sample for the water column (5 time points) and triplicates for biofilms (4 time points). Time points were chosen so as to be 48–72 h apart from the last feed administration: day zero, which included only water column sample, day 2 (start), days 9 and 18 (middle), and 30 (end). Samples were subjected to PCR-DGGE analysis. As markers for the gel, P. fluorescens, T. discolor, and V. harveyi were used. For bands aligned at the same position, only one band was excised and sequenced.
The obtained DGGE profiles from the water samples were almost identical. Dominant bands were present in all temporal samples, as seen in Figure 5A, implying that the planktic bacterial community was invariable throughout the experimental period. Clustering analysis, which was based on the number of the bands, did not separate the temporal samples by chronological order or by time distance from feeding.
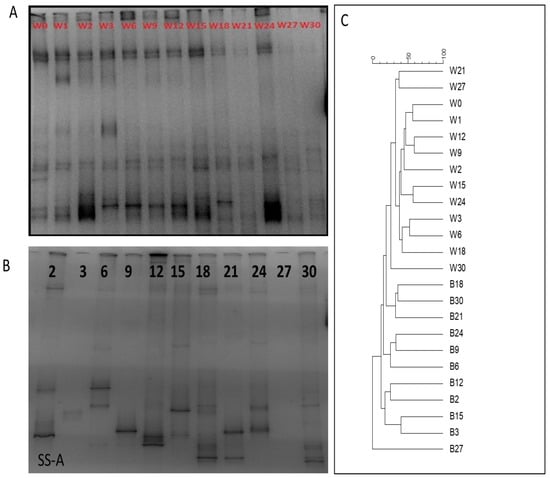
Figure 5.
DGGE band profiles of (A) temporal samples of the dominant planktic bacterial OTUs found in the water column and (B) temporal changes of the dominant microbial OTUs forming biofilms (A coupon only). (C) Cluster diagrams from the two DGGE gels.
DGGE profiles of the biofilm samples displayed a dynamic succession of the dominant bacterial species throughout the experiment. The appearance of new dominant bands in each sample and the disappearance of previous dominant bands caused a constant change in the DGGE fingerprints (Figure 5B). In comparison with the DGGE profiles obtained from the water column samples, in the case of biofilm profiles, only a limited number of bands were observed in all temporal samples apart from days 1 and 27, and no band was detected. Accordingly, the clustering analysis of the DGGE profiles completely separated the water column and biofilm samples (Figure 5C).
3.4. Identification of Bacterial Communities
In total, 17 bands were excised and analyzed by sequencing, out of which 14 were successfully sequenced and 13 OTUs were identified (Table 2). The excised bands can be seen in Figure 6. Six OTUs belonged to the class Gamma-proteobacteria, two to the class Beta-proteobacteria, two to the class Actinobacteria, and one from the classes Alpha-proteobacteria, Bacilli, and Flavobacteriia. Dominant OTUs in the water column include a member of the genus Roseobacter, which is found in almost all samples, a marine bacterium of the class Flavobacteriia, and one member of the genus Colwellia. Interestingly, only three OTUs were found to be dominant in both niches, Paraperlucidibaca wadonensis and two unidentified bacteria. In general, water column temporal samples were characterized by similar dominant OTUs, confirming our previous observation. In contrast, biofilm samples displayed different dominant OTUs on days 2 and 9, while temporal samples on days 18 and 30 had similar profiles. Shared dominant OTUs among the biofilm samples are depicted in Figure 7. The community composition of day 2 included two Psychrobacter species, one Planococcus species, one member of the Hydrogenophaga genus, and one bacterium that was similar to P. wadonensis. At day 9, none of the previous OTUs were found in the DGGE fingerprints and the dominant OTUs were affiliated with another member of the Hydrogenophaga subgroup, Marinobacter sp. and Halomonas neptunia. At day 18 only Marinobacter sp. was found in common with the previous time point. Here, Rhodococcus sp. and Microbacterium sp. were dominant and remained as such at day 30. Three unidentified bacteria appeared to characterize the biofilms of day 30. Notably, the band from the marker T. discolor was found in all temporal biofilm samples, confirming its dominance in the biofilm community. However, its band was not detected in any water column sample, even though it was observed on agar plates.
Table 2.
Sequence similarities of the excised DGGE bands.
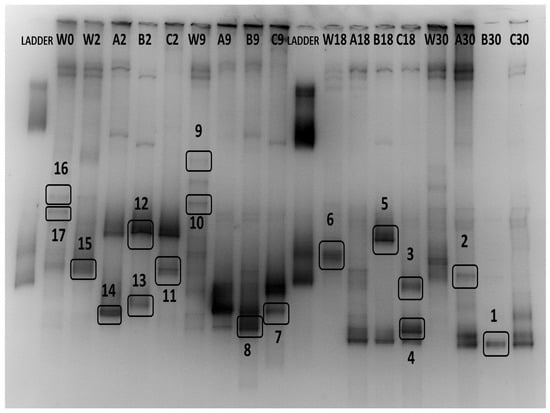
Figure 6.
DGGE band profiles of temporal changes of water (W) and biofilm (A, B, C) dominant OTUs at days 0 (only for water), 2, 9, 18, and 30. The excised bands for sequencing are marked with a box. The sequencing results of the excised bands are presented in Table 2.
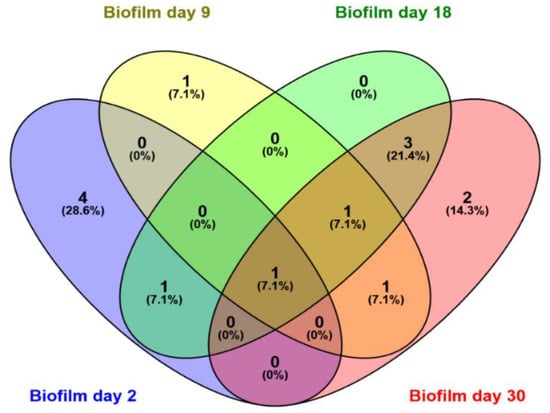
Figure 7.
Venn diagrams depicting the number of common OTUs shared among biofilms on days 2 (blue), 9 (yellow), 18 (green), and 30 (pink). The number and percentages represent the common OTUs and percentage of common OTUs, respectively.
4. Discussion
A RAS is a complex environmental system in which different types of niches can be found. The microbiology of such a system can be influenced by a number of factors as previously described [16]. Briefly, the feeding regime, management of the system, the initial microbial composition when introducing new fish into the system, quality and microbiology of make-up water, as well as mechanical filtration type [40] are only some of the parameters that can affect the RAS microbiology. In this study, the composition and dynamics of the heterotrophic bacteria community in the water column and the biofilm were described by using culture and non-culture approaches in a Mediterranean RAS, a type of RAS with yet limited research studies.
Both water quality and bacterial abundance in a RAS may be affected by changes in feed loading [10,16] or by changes in the type of feed [41]. The pH value has been also reported to cause changes in the bacterial community in RAS systems [15] and in microcosms from open water aquaculture [42]. The higher organic load which results from the feed administration may explain the temporal increase in the abundance of heterotrophic bacteria in the water. This phenomenon was highly visible in the present study, as feed was provided only three times per week and not daily. Thus, the observed fluctuations in the microbial population and water parameters, pH, nitrite, and TAN concentration were attributed to the feeding regime. Additionally, the inhibition of the accumulation of heterotrophic bacteria in the water column can be associated with the use of ultraviolet disinfection.
Even though the DGGE fingerprinting method has drawbacks in terms of limit of detection to the most abundantly amplified sequences and may not distinguish between different sequences migrating to the same position, it provides a comparison on the same gel of the migration pattern between environmental samples and a first estimation of their microbial diversity. In this research, this tool has been used to monitor the microbial community differences among spatial samples (water column versus biofilm), as well as their evolution over time. The DGGE profiles obtained from the water column temporal samples showed that the composition of the microbial community remained unchanged in the RAS. Members of classes Alpha- and Gamma-proteobacteria, as well as Flavobacteriia, were found to dominate the microbiota in the water column. These findings are in accordance with previous studies showing that Gamma-proteobacteria and Alpha-proteobacteria were abundant in RAS with disinfection and flowthrough systems of the rearing of lumpfish [43], or in tanks of Artemia rearing [25]. RASs have been proposed as a microbial control strategy for the production of marine larvae since they contribute to the stabilization of the microbial community composition [12,17], a suggestion that is being confirmed by the present study.
The immediate colonization of the test surfaces, with biofilm density being increased within 6 days and remaining relatively stable thereafter, was evident in this study. Similar results have been previously reported in a higher volume experimental RAS where sea bass was reared [14]. However, no significant drop in the CFU counts was recorded here as opposed to an observation of a previous biofilm study [18].
In contrast with the planktic environment, the dominant bacteria in the biofilm temporal samples were constantly different, indicating that biofilm has a dynamically evolving community composition. The analysis of the DGGE profiles of all samples resulted in two different clusters that were represented by the communities of the two different environments. The sequencing analysis of the retrieved DGGE bands revealed that only three OTUs were similar to both niches. The difference in the microbial community composition between the water column and biofilms may be attributed to the sterilization process by the UV system. It has been shown previously that sterilization systems, such as ultraviolet light and/or ozonation, can have an effect on the development and the community of biofilm in aquaculture tanks [25,44].
Regarding the microbial composition dynamics, two different patterns were observed. Planktic community diversity was stable as seen in the DGGE profiles, although microbial abundance fluctuated. On the contrary, biofilm communities stabilized in terms of abundance after 6 days, whereas their composition changed throughout the experimental period and only showed signs of stabilization after sampling at day 18.
Microbial communities play important roles in the operation of recirculation systems in the biochemical cycles of nutrients, in particular of nitrogen removal, with autotrophic and heterotrophic bacteria participating in the nitrification and denitrification processes [45,46,47]. In this study, the commonly detected nitrifying bacteria such as Nitrospira of Nitrosomonas species were not found in the biofilms. Yet, one of the dominant members of the biofilms was assigned to the Marinobacter genus. Marinobacter species have been isolated in marine RAS with similar conditions both in the water column and surfaces on tanks and pipes [14,48] and are considered to play a role in marine nitrification and fish wastewater treatment [48,49]. In addition, two different members of the Hydrogenophaga group were detected. Members of the Hydrogenophaga group have been previously found in biofilters of marine RAS and are considered to participate in sulfide oxidation [50,51]. In addition, a bacterium affiliated with Paraperlucidibaca wadonensis was dominant in the initial biofilm composition. This species was initially isolated from a seawater sample in Korea [52], but species of the Paraperlucidibaca genus have been isolated in composted soil and moss samples [53], as well as from samples of crude oil in seawater as part of an oil degrading community [54].
Bacterial biofilms consist not only of cells but also of extracellular polymeric substances (EPS) [55]. In the present study, the marine bacterial genera Halomonas, Planococcus, Pseudoalteromonas, and Rhodococcus, which were identified as dominant species in the biofilms, have been described as EPS producers [56]. Halomonas, Pseudoalteromonas, and Microbacterium species have been previously detected in a biofloc-based aquaculture installation [57]. Notably, Pseudoalteromonas spp. have been characterized as producers of biological active extracellular compounds [58,59,60,61]. Although members of the genus Pseudoalteromonas were not detected in the retrieved DGGE profiles, they were isolated from Marine Agar plates of the water column and biofilm samples. Three different isolates were assigned to Pseudoalteromonas spongiae, Pseudoalteromonas shioyasakiensis, and Pseudoalteromonas gelatinilytica.
By focusing on the bacterial diversity of the biofilm, fish pathogen T. discolor was detected as a dominant member of the biofilm community throughout the study. T. discolor was also observed to be highly present on agar plates from water samples acquired more than 48 h after feed administration, yet it was not observed to be dominant in the DGGE profiles. Combining all these results, it can be deduced that the planktic microbial community, although stable, could not control and inhibit this pathogenic bacterium, confirming that the biofilm may serve as a reservoir for pathogens [18]. It has to be noted that no fish mortality was recorded throughout the experimental period. However, a limited number of sea bass fish exhibited symptoms such as an eroded mouth and rotted fins, which are common symptoms of tenacibaculosis disease [62]. Tenacibaculum has recently been detected as a dominant bacterium in biofilm samples of a hatchery RAS of sole (Solea senegalensis), with past disease outbreaks being reported [15]. Other pathogenic bacteria, such as Vibrio parahaemolyticus, Vibrio alginolyticus, and Vibrio harveyi have been previously identified within the biofilm communities developed on the tanks of an aquaculture system of rock lobster (Panulirus ornatus) [18,63]. All this information can direct research towards further investigation on the role of pathogens in the biofilm [64] and the factors that can trigger disease outbreaks.
5. Conclusions
As recirculation technology becomes popular in the aquaculture industry, it is important to investigate the microbiome dynamics of the RAS. This study focused on a RAS, in which two of the most important Mediterranean fish were reared. Water quality parameters and water bacterial abundance were demonstrated to follow the feeding regime, while the community assemblages remained unchanged. The biofilm cell density reached a plateau within 6 days, whereas a dynamic succession in the bacterial community of the biofilm was revealed. No opportunistic pathogens were identified in the biofilms, with the exception of fish pathogen T. discolor, which was isolated and identified to participate in both planktic and biofilm communities. It was confirmed that RAS technology can serve as a means for the stability of the water microbial community.
Author Contributions
Conceptualization, E.S. and G.-J.E.N.; methodology, E.S. and A.I.D.; software, E.S.; validation, E.S., A.I.D. and G.-J.E.N.; formal analysis, E.S.; investigation, E.S. and A.I.D.; resources, G.-J.E.N.; data curation, E.S. and A.I.D.; writing—original draft preparation, E.S.; writing—review and editing, A.I.D., H.M. and G.-J.E.N.; visualization, E.S.; supervision, H.M.; project administration, G.-J.E.N.; funding acquisition, G.-J.E.N. All authors have read and agreed to the published version of the manuscript.
Funding
This research was funded by the European Union’s Horizon 2020 research and innovation programme under grant agreement No 774109 (project “Intelligent Management System for Inte-grated Multi-trophic Aquaculture—IMPAQT”).
Institutional Review Board Statement
Not applicable.
Informed Consent Statement
Not applicable.
Data Availability Statement
The data presented in this study are available on request from the corresponding author.
Acknowledgments
The authors would like to thank the staff of the Laboratory of Applied Hydrobiology of the Agricultural University of Athens for their technical support in part of the RAS maintenance.
Conflicts of Interest
The authors declare no conflict of interest. The funders had no role in the design of the study; in the collection, analyses, or interpretation of data; in the writing of the manuscript, or in the decision to publish the results.
References
- FAO. The State of World Fisheries and Aquaculture 2020; FAO: Rome, Italy, 2020; Volume 32, ISBN 978-92-5-132692-3. [Google Scholar]
- Ahmed, N.; Turchini, G.M. Recirculating Aquaculture Systems (RAS): Environmental Solution and Climate Change Adaptation. J. Clean. Prod. 2021, 297, 126604. [Google Scholar] [CrossRef]
- Bregnballe, J. A Guide to Recirculation Aquaclture: An Introduction to the New Environmentlly Friendly and Highly Productive Closed Fish Farming Systems. FAO Eurofish Rep. 2015, 10–11. Available online: http://www.fao.org/3/a-i4626e.pdf (accessed on 1 March 2022).
- Martins, C.I.M.; Eding, E.H.; Verdegem, M.C.J.; Heinsbroek, L.T.N.; Schneider, O.; Blancheton, J.P.; d’Orbcastel, E.R.; Verreth, J.A.J. New Developments in Recirculating Aquaculture Systems in Europe: A Perspective on Environmental Sustainability. Aquac. Eng. 2010, 43, 83–93. [Google Scholar] [CrossRef]
- Dalsgaard, J.; Pedersen, L.-F.; Pedersen, P.B. Recirculation Technology: Science Meets Practice. Aquac. Eng. 2013, 53, 1. [Google Scholar] [CrossRef]
- Zhang, S.Y.; Li, G.; Wu, H.B.; Liu, X.G.; Yao, Y.H.; Tao, L.; Liu, H. An Integrated Recirculating Aquaculture System (RAS) for Land-Based Fish Farming: The Effects on Water Quality and Fish Production. Aquac. Eng. 2011, 45, 93–102. [Google Scholar] [CrossRef]
- Dahle, S.W.; Attramadal, K.J.K.; Vadstein, O.; Hestdahl, H.I.; Bakke, I. Microbial Community Dynamics in a Commercial RAS for Production of Atlantic Salmon Fry (Salmo salar). Aquaculture 2022, 546, 737382. [Google Scholar] [CrossRef]
- Bugten, A.V.; Attramadal, K.J.K.; Fossmark, R.O.; Rosten, T.W.; Vadstein, O.; Bakke, I. Changes in Rearing Water Microbiomes in RAS Induced by Membrane Filtration Alters the Hindgut Microbiomes of Atlantic Salmon (Salmo salar) Parr. Aquaculture 2022, 548, 737661. [Google Scholar] [CrossRef]
- Pulkkinen, J.T.; Kiuru, T.; Aalto, S.L.; Koskela, J.; Vielma, J. Startup and Effects of Relative Water Renewal Rate on Water Quality and Growth of Rainbow Trout (Oncorhynchus mykiss) in a Unique RAS Research Platform. Aquac. Eng. 2018, 82, 38–45. [Google Scholar] [CrossRef]
- Rojas-Tirado, P.; Pedersen, P.B.; Vadstein, O.; Pedersen, L.F. Changes in Microbial Water Quality in RAS Following Altered Feed Loading. Aquac. Eng. 2018, 81, 80–88. [Google Scholar] [CrossRef]
- McIntosh, D.; Ji, B.; Forward, B.S.; Puvanendran, V.; Boyce, D.; Ritchie, R. Culture-Independent Characterization of the Bacterial Populations Associated with Cod (Gadus morhua L.) and Live Feed at an Experimental Hatchery Facility Using Denaturing Gradient Gel Electrophoresis. Aquaculture 2008, 275, 42–50. [Google Scholar] [CrossRef]
- Attramadal, K.J.K.; Truong, T.M.H.; Bakke, I.; Skjermo, J.; Olsen, Y.; Vadstein, O. RAS and Microbial Maturation as Tools for K-Selection of Microbial Communities Improve Survival in Cod Larvae. Aquaculture 2014, 432, 483–490. [Google Scholar] [CrossRef]
- Powell, A.; Chingombe, P.; Lupatsch, I.; Shields, R.J.; Lloyd, R. The Effect of Ozone on Water Quality and Survival of Turbot (Psetta maxima) Maintained in a Recirculating Aquaculture System. Aquac. Eng. 2015, 64, 20–24. [Google Scholar] [CrossRef]
- Leonard, N.; Blancheton, J.P.; Guiraud, J.P. Populations of Heterotrophic Bacteria in an Experimental Recirculating Aquaculture System. Aquac. Eng. 2000, 22, 109–120. [Google Scholar] [CrossRef]
- Almeida, D.B.; Magalhães, C.; Sousa, Z.; Borges, M.T.; Silva, E.; Blanquet, I.; Mucha, A.P. Microbial Community Dynamics in a Hatchery Recirculating Aquaculture System (RAS) of Sole (Solea senegalensis). Aquaculture 2021, 539, 736592. [Google Scholar] [CrossRef]
- Blancheton, J.P.; Attramadal, K.J.K.; Michaud, L.; d’Orbcastel, E.R.; Vadstein, O. Insight into Bacterial Population in Aquaculture Systems and Its Implication. Aquac. Eng. 2013, 53, 30–39. [Google Scholar] [CrossRef]
- Attramadal, K.J.K.; Salvesen, I.; Xue, R.; Øie, G.; Størseth, T.R.; Vadstein, O.; Olsen, Y. Recirculation as a Possible Microbial Control Strategy in the Production of Marine Larvae. Aquac. Eng. 2012, 46, 27–39. [Google Scholar] [CrossRef]
- Bourne, D.G.; Høj, L.; Webster, N.S.; Swan, J.; Hall, M.R. Biofilm Development within a Larval Rearing Tank of the Tropical Rock Lobster, Panulirus ornatus. Aquaculture 2006, 260, 27–38. [Google Scholar] [CrossRef]
- Mizan, M.F.R.; Jahid, I.K.; Ha, S. Do Microbial Biofilms in Seafood: A Food-Hygiene Challenge. Food Microbiol. 2015, 49, 41–55. [Google Scholar] [CrossRef]
- Fletcher, M. Bacterial biofilms and biofouling. Curr. Opin. Biotechnol. 1994, 5, 302–306. [Google Scholar] [CrossRef]
- Schäfer, H.; Muyzer, G. Denaturing Gradient Gel Electrophoresis in Marine Microbial Ecology. In Methods in Microbiology; Academic Press Inc.: Cambridge, MA, USA, 2001; Volume 30, pp. 425–468. ISBN 0-12-521530-4. [Google Scholar]
- Muyzer, G.; de Waal, E.C.; Uitterlinden, A.G. Profiling of complex microbial populations by denaturing gradient gel electrophoresis analysis of polymerase chain reaction-amplified genes encoding for 16S rRNA. Appl. Environ. Microbiol. 1993, 59, 695–700. [Google Scholar] [CrossRef]
- Rombaut, G.; Suantika, G.; Boon, N.; Maertens, S.; Dhert, P.; Top, E.; Sorgeloos, P.; Verstraete, W. Monitoring of the Evolving Diversity of the Microbial Community Present in Rotifer Cultures. Aquaculture 2001, 198, 237–252. [Google Scholar] [CrossRef]
- Sandaa, R.A.; Magnesen, T.; Torkildsen, L.; Bergh, Ø. Characterisation of the Bacterial Community Associated with Early Stages of Great Scallop (Pecten maximus), Using Denaturing Gradient Gel Electrophoresis (DGGE). Syst. Appl. Microbiol. 2003, 26, 302–311. [Google Scholar] [CrossRef] [PubMed]
- Wietz, M.; Hall, M.R.; Høj, L. Effects of Seawater Ozonation on Biofilm Development in Aquaculture Tanks. Syst. Appl. Microbiol. 2009, 32, 266–277. [Google Scholar] [CrossRef] [PubMed]
- van der Meeren, T.; Brunvold, L.; Sandaa, R.A.; Bergh, Ø.; Castberg, T.; Thyrhaug, R.; Mangor-Jensen, A. Water Quality and Microbial Community Structure in Juvenile Atlantic Cod (Gadus morhua L.) Cultures. Aquaculture 2011, 316, 111–120. [Google Scholar] [CrossRef]
- Attramadal, K.J.K.; Minniti, G.; Øie, G.; Kjørsvik, E.; Østensen, M.A.; Bakke, I.; Vadstein, O. Microbial Maturation of Intake Water at Different Carrying Capacities Affects Microbial Control in Rearing Tanks for Marine Fish Larvae. Aquaculture 2016, 457, 68–72. [Google Scholar] [CrossRef]
- Attramadal, K.J.K.; Øien, J.V.; Kristensen, E.; Evjemo, J.O.; Kjørsvik, E.; Vadstein, O.; Bakke, I. UV Treatment in RAS Influences the Rearing Water Microbiota and Reduces the Survival of European Lobster Larvae (Homarus gammarus). Aquac. Eng. 2021, 94, 102176. [Google Scholar] [CrossRef]
- Brunvold, L.; Sandaa, R.A.; Mikkelsen, H.; Welde, E.; Bleie, H.; Bergh, Ø. Characterisation of Bacterial Communities Associated with Early Stages of Intensively Reared Cod (Gadus morhua) Using Denaturing Gradient Gel Electrophoresis (DGGE). Aquaculture 2007, 272, 319–327. [Google Scholar] [CrossRef]
- Tal, Y.; Watts, J.E.M.; Schreier, S.B.; Sowers, K.R.; Schreier, H.J. Characterization of the Microbial Community and Nitrogen Transformation Processes Associated with Moving Bed Bioreactors in a Closed Recirculated Mariculture System. Aquaculture 2003, 215, 187–202. [Google Scholar] [CrossRef]
- Standard Method 4500-NH3-H; Standard Methods for The Examination of Water and Wastewater. American Public Health Association, American Water Works Association, Water Environment Federation: Washington, DC, USA, 1992; pp. 4–84.
- Standard Method 4500-NO2-B; Standard Methods for The Examination of Water and Wastewater. American Public Health Association, American Water Works Association, Water Environment Federation: Washington, DC, USA, 1992; pp. 4–85.
- Bower, C.E.; Bidwell, J.P. Ionization of ammonia in seawater—Effects of temperature, pH and salinity. J. Fish. Res. Board Can. 1978, 35, 1012–1016. [Google Scholar] [CrossRef]
- Kostaki, M.; Chorianopoulos, N.; Braxou, E.; Nychas, G.J.; Giaouris, E. Differential Biofilm Formation and Chemical Disinfection Resistance of Sessile Cells of Listeria monocytogenes Strains under Monospecies and Dual-Species (with Salmonella enterica) Conditions. Appl. Environ. Microbiol. 2012, 78, 2586–2595. [Google Scholar] [CrossRef]
- Lindsay, D.; von Holy, A. Evaluation of Dislodging Methods for Laboratory-Grown Bacterial Biofilms. Food Microbiol. 1997, 14, 383–390. [Google Scholar] [CrossRef]
- Lytou, A.E.; Schoina, E.; Liu, Y.; Michalek, K.; Stanley, M.S.; Panagou, E.Z.; Nychas, G.E. Quality and Safety Assessment of Edible Seaweeds Alaria esculenta and Saccharina latissima Cultivated in Scotland. Foods 2021, 10, 2210. [Google Scholar] [CrossRef] [PubMed]
- Muyzer, G.; Smalla, K. Application of Denaturing Gradient Electrophoresis (DGGE) and Temperature Gradient Electrophoresis (TGGE) in Microbial Ecology. Antonie Van Leeuwenhoek 1998, 73, 127–141. [Google Scholar] [CrossRef] [PubMed]
- Doulgeraki, A.I.; Paramithiotis, S.; Nychas, G.J.E. Characterization of the Enterobacteriaceae Community That Developed during Storage of Minced Beef under Aerobic or Modified Atmosphere Packaging Conditions. Int. J. Food Microbiol. 2011, 145, 77–83. [Google Scholar] [CrossRef] [PubMed]
- Oliveros, J.C. Venny. An Interactive Tool for Comparing Lists with Venn’s Diagrams, 2007–2015. Available online: https://bioinfogp.cnb.csic.es/tools/venny/index.html (accessed on 1 March 2022).
- Fossmark, R.O.; Vadstein, O.; Rosten, T.W.; Bakke, I.; Košeto, D.; Bugten, A.V.; Helberg, G.A.; Nesje, J.; Jørgensen, N.O.G.; Raspati, G.; et al. Effects of Reduced Organic Matter Loading through Membrane Filtration on the Microbial Community Dynamics in Recirculating Aquaculture Systems (RAS) with Atlantic Salmon Parr (Salmo Salar). Aquaculture 2020, 524, 735268. [Google Scholar] [CrossRef]
- Holan, A.B.; Wold, P.A.; Leiknes, T.O. Intensive Rearing of Cod Larvae (Gadus morhua) in Recirculating Aquaculture Systems (RAS) Implementing a Membrane Bioreactor (MBR) for Enhanced Colloidal Particle and Fine Suspended Solids Removal. Aquac. Eng. 2014, 58, 52–58. [Google Scholar] [CrossRef]
- Olsen, L.M.; Hernández, K.L.; Van Ardelan, M.; Iriarte, J.L.; Bizsel, K.C.; Olsen, Y. Responses in Bacterial Community Structure to Waste Nutrients from Aquaculture: An in situ Microcosm Experiment in a Chilean Fjord. Aquac. Environ. Interact. 2017, 9, 21–32. [Google Scholar] [CrossRef]
- Dahle, S.W.; Bakke, I.; Birkeland, M.; Nordøy, K.; Dalum, A.S.; Attramadal, K.J.K. Production of Lumpfish (Cyclopterus lumpus L.) in RAS with Distinct Water Treatments: Effects on Fish Survival, Growth, Gill Health and Microbial Communities in Rearing Water and Biofilm. Aquaculture 2020, 522, 735097. [Google Scholar] [CrossRef]
- Gullian, M.; Espinosa-Faller, F.J.; Núñez, A.; López-Barahona, N. Effect of Turbidity on the Ultraviolet Disinfection Performance in Recirculating Aquaculture Systems with Low Water Exchange. Aquac. Res. 2012, 43, 595–606. [Google Scholar] [CrossRef]
- Song, T.; Zhang, X.; Li, J.; Wu, X.; Feng, H.; Dong, W. A Review of Research Progress of Heterotrophic Nitrification and Aerobic Denitrification Microorganisms (HNADMs). Sci. Total Environ. 2021, 801, 149319. [Google Scholar] [CrossRef]
- Luo, G.; Xu, J.; Meng, H. Nitrate Accumulation in Biofloc Aquaculture Systems. Aquaculture 2020, 520, 734675. [Google Scholar] [CrossRef]
- Rejish Kumar, V.J.; Sukumaran, V.; Achuthan, C.; Joseph, V.; Philip, R.; Bright Singh, I.S. Molecular Characterization of the Nitrifying Bacterial Consortia Employed for the Activation of Bioreactors Used in Brackish and Marine Aquaculture Systems. Int. Biodeterior. Biodegrad. 2013, 78, 74–81. [Google Scholar] [CrossRef]
- Liu, Y.; Ai, G.M.; Miao, L.L.; Liu, Z.P. Marinobacter Strain NNA5, a Newly Isolated and Highly Efficient Aerobic Denitrifier with Zero N2O Emission. Bioresour. Technol. 2016, 206, 9–15. [Google Scholar] [CrossRef] [PubMed]
- Anh, H.T.H.; Shahsavari, E.; Bott, N.J.; Ball, A.S. The Application of Marinobacter hydrocarbonoclasticus as a Bioaugmentation Agent for the Enhanced Treatment of Non-Sterile Fish Wastewater. J. Environ. Manag. 2021, 291, 112658. [Google Scholar] [CrossRef] [PubMed]
- Cytryn, E.; Minz, D.; Gelfand, I.; Neori, A.; Gieseke, A.; De Beer, D.; Van Rijn, J. Sulfide-Oxidizing Activity and Bacterial Community Structure in a Fluidized Bed Reactor from a Zero-Discharge Mariculture System. Environ. Sci. Technol. 2005, 39, 1802–1810. [Google Scholar] [CrossRef] [PubMed]
- Cytryn, E.; Van Rijn, J.; Schramm, A.; Gieseke, A.; De Beer, D.; Minz, D. Identification of Bacteria Potentially Responsible for Oxic and Anoxic Sulfide Oxidation in Biofilters of a Recirculating Mariculture System. Appl. Environ. Microbiol. 2005, 71, 6134–6141. [Google Scholar] [CrossRef][Green Version]
- Yoon, J.H.; Park, S.; Jung, Y.T.; Lee, J.S.; Lee, K.C. Paraperlucidibaca wandonensis Sp. Nov., Isolated from Seawater, and Emended Description of the Genus Paraperlucidibaca Oh et al. 2011. Int. J. Syst. Evol. Microbiol. 2013, 63, 4113–4117. [Google Scholar] [CrossRef]
- Soininen, L.; Grönroos, M.; Roslund, M.I.; Sinkkonen, A. Long-Term Storage Affects Resource Availability and Occurrence of Bacterial Taxa Linked to Pollutant Degradation and Human Health in Landscaping Materials. Urban For. Urban Green. 2021, 60, 127065. [Google Scholar] [CrossRef]
- Lofthus, S.; Bakke, I.; Tremblay, J.; Greer, C.W.; Brakstad, O.G. Biodegradation of Weathered Crude Oil in Seawater with Frazil Ice. Mar. Pollut. Bull. 2020, 154, 111090. [Google Scholar] [CrossRef]
- Donlan, R.M.; Costerton, J.W. Biofilms: Survival Mechanisms of Clinically Revelant Microorganisms. Clin. Microbiol. Revies 2002, 15, 167–193. [Google Scholar] [CrossRef]
- Finore, I.; Di Donato, P.; Mastascusa, V.; Nicolaus, B.; Poli, A. Fermentation Technologies for the Optimization of Marine Microbial Exopolysaccharide Production. Mar. Drugs 2014, 12, 3005–3024. [Google Scholar] [CrossRef]
- Panigrahi, A.; Saranya, C.; Sundaram, M.; Vinoth Kannan, S.R.; Das, R.R.; Satish Kumar, R.; Rajesh, P.; Otta, S.K. Carbon: Nitrogen (C:N) Ratio Level Variation Influences Microbial Community of the System and Growth as Well as Immunity of Shrimp (Litopenaeus Vannamei) in Biofloc Based Culture System. Fish Shellfish Immunol. 2018, 81, 329–337. [Google Scholar] [CrossRef] [PubMed]
- Li, J.; Chen, K.; Lin, X.; He, P.; Li, G. Production and Characterization of an Extracellular Polysaccharide of Antarctic Marine Bacteria Pseudoalteromonas Sp. S-15-13. Acta Oceanol. Sin. 2006, 25, 106–115. [Google Scholar]
- Roca, C.; Lehmann, M.; Torres, C.A.V.; Baptista, S.; Gaudêncio, S.P.; Freitas, F.; Reis, M.A.M. Exopolysaccharide Production by a Marine Pseudoalteromonas Sp. Strain Isolated from Madeira Archipelago Ocean Sediments. N. Biotechnol. 2016, 33, 460–466. [Google Scholar] [CrossRef]
- Holmström, C.; Kjelleberg, S. Marine Pseudoalteromonas Species Are Associated with Higher Organisms and Produce Biologically Active Extracellular Agents. FEMS Microbiol. Ecol. 1999, 30, 285–293. [Google Scholar] [CrossRef]
- Offret, C.; Desriac, F.; Le Chevalier, P.; Mounier, J.; Jégou, C.; Fleury, Y. Spotlight on Antimicrobial Metabolites from the Marine Bacteria Pseudoalteromonas: Chemodiversity and Ecological Significance. Mar. Drugs 2016, 14, 129. [Google Scholar] [CrossRef]
- Fernández-Álvarez, C.; Santos, Y. Identification and Typing of Fish Pathogenic Species of the Genus Tenacibaculum. Appl. Microbiol. Biotechnol. 2018, 102, 9973–9989. [Google Scholar] [CrossRef]
- Bourne, D.G.; Young, N.; Webster, N.; Payne, M.; Salmon, M.; Demel, S.; Hall, M. Microbial Community Dynamics in a Larval Aquaculture System of the Tropical Rock Lobster, Panulirus ornatus. Aquaculture 2004, 242, 31–51. [Google Scholar] [CrossRef]
- Giaouris, E.D.; Nychas, G.-J.E. The adherence of Salmonella Enteritidis PT4 to stainless steel: The importance of the air-liquid interface and nutrient availability. Food Microbiol. 2006, 23, 747–752. [Google Scholar] [CrossRef]


Publisher’s Note: MDPI stays neutral with regard to jurisdictional claims in published maps and institutional affiliations. |
© 2022 by the authors. Licensee MDPI, Basel, Switzerland. This article is an open access article distributed under the terms and conditions of the Creative Commons Attribution (CC BY) license (https://creativecommons.org/licenses/by/4.0/).