Article

Objective Evaluation of Fatigue-Associated Facial Expressions Using Measurements of Eye-Opening Degree, Motion Capture, and Heart Rate Variability Spectrum Analysis

1
Human Health Care Products Research, Kao Corporation, Tokyo 131-8501, Japan
2
Faculty of Human Sciences, University of East Asia, Yamaguchi 751-8503, Japan
3
Behavioral Science, Faculty of Medicine, University of Toyama, Sugitani 2630, Toyama 930-0194, Japan
*
Author to whom correspondence should be addressed.
Physiologia 2025, 5(4), 42; https://doi.org/10.3390/physiologia5040042
Submission received: 1 September 2025 / Revised: 10 October 2025 / Accepted: 10 October 2025 / Published: 14 October 2025
(This article belongs to the Special Issue Feature Papers in Human Physiology—3rd Edition)

Abstract

Background/Objectives: This study aimed to objectively assess fatigue levels using facial expressions. Methods: This study included 25 female nurses aged between 30 and 50 years. We compared their subjective and objective fatigue levels after a night shift, when accumulated fatigue was assumed, with those after a day off, when recovery was expected. Fatigue levels were subjectively assessed using questionnaires and were also quantified by the Visual Analog Scale (VAS). Objective evaluations included (1) the degree of eye-opening, (2) the maximum distance and speed of facial skin movement by tracking changes in coordinate values of facial markers on the skin during intentional smiling, and (3) analysis of high-frequency (HF) components and the low frequency-to-high frequency (LF/HF) ratio in heart rate variability (HRV). Results: After a night shift, compared to after a day off, subjective assessments of mental and physical fatigue in the questionnaires and VAS values of own fatigue were significantly elevated. Concurrently, objective evaluations revealed that the degree of eye-opening, along with the maximum movement distance and speed of the lower eyelid, cheek, and mouth corners during intentional smiling, were significantly reduced. Furthermore, the HF component, an index of parasympathetic activity, significantly decreased, whereas the LF/HF ratio, an index of sympathetic activity, significantly increased. Additionally, significant correlations were observed between subjective VAS estimation of fatigue levels and each objective parameter examined. Conclusions: Measuring facial parameters is an effective method for objectively assessing facial expressions of fatigue, and these changes are mediated through reduced parasympathetic nervous activity and increased sympathetic nervous activity during fatigue.

1. Introduction

In recent years, the number of working women has increased annually, with women entering a diverse range of fields. In this context, modern women, like men, face mental stress from work and interpersonal relationships, as well as fatigue and stress related to child-rearing and household responsibilities [1,2]. Consequently, they experience chronic fatigue, which can lead to emotional instability, impact both mental and physical well-being, and contribute to nonspecific complaints [3,4].
Assessing fatigue requires multiple evaluation methods. Consequently, fatigue has been measured using various approaches, including physiological, biochemical, and subjective assessments [5,6]. Subjective methods for evaluating work-related fatigue include the following: the Checklist Individual Strength, which measures chronic fatigue across four dimensions—subjective experience, motivation, concentration, and physical activity; the Maslach Burnout Inventory, which identifies burnout through three symptoms—emotional exhaustion, depersonalization, and reduced personal accomplishment; the Multidimensional Fatigue Inventory, composed of five scales (general fatigue, physical fatigue (PF), reduced activity, reduced motivation, and mental fatigue (MF)) to explore the nature and underlying processes of fatigue; the Chalder Fatigue Scale, a self-assessment tool for gauging fatigue severity; and the Shortened Fatigue Questionnaire, a brief and straightforward instrument for measuring PF intensity [7,8,9,10,11]. While these questionnaires have been validated and are widely used, they are limited in their ability to elucidate the causes and mechanisms of fatigue development due to their inherent subjectivity [5].
To evaluate fatigue, objective assessments are conducted using physiological tests (such as power spectrum analysis of heart rate variability and blood pressure variability, aortic stiffness measurements, and head-up tilt tests), biochemical tests (evaluating oxidative stress and antioxidant capacity), and immunological tests (quantifying reactivated human herpesvirus 6 and 7 in saliva) [12,13,14,15]. For example, Van Boxtel and Jessurun reported that electromyography (EMG), used to assess fatigue, revealed a gradual increase in activity—an EMG gradient—in facial muscles such as the frontalis, corrugator supercilii, and orbicularis oris, indicating increased energy mobilization to counteract the effects of fatigue [16].
However, obtaining fatigue assessment results through physiological tests or sample analyses can be time-consuming, and quantitatively evaluating fatigue using subjective methods, such as interviews, presents challenges. As a result, appropriate treatment for individuals experiencing fatigue may be delayed, which can contribute to chronic fatigue and associated social issues [17,18]. Accurate and prompt assessment of fatigue is therefore essential. Achieving this would enable the provision of appropriate, symptom-tailored treatment for individuals experiencing fatigue, ultimately reducing their mental and economic burdens and improving their quality of life.
Human facial expressions can convey a wide range of emotions, sensations, and variations in mental and physical states [19,20,21]. In recent years, there has been a notable increase in the number of women who are highly self-conscious and concerned about their facial expressions of fatigue [22,23,24,25,26]. However, scientific research on facial expressions of fatigue remains limited, with few objective studies examining the effects of fatigue on these expressions. Therefore, we aimed to objectively evaluate facial expressions of fatigue by measuring the degree of eye-opening and skin surface movement during intentional smiling using a motion capture method.

2. Methods

2.1. Participants

The study participants were 25 healthy female nurses [aged 30–50 years: 40.0 ± 1.4 years (mean ± Standard Error of the Mean (SEM))] employed at Toyama University Hospital. The nurses worked a three-shift system consisting of day shifts (8:30–17:15), semi-night shifts (15:30–23:15), and night shifts (23:00–9:00), as well as a two-shift system with day shifts (8:30–17:15) and night shifts (15:30–9:00). The night shift was scheduled to follow the day shift (8:30–17:15). The study used a crossover random-order design, with assessments conducted before the semi-night shift (after a day off; Control condition), following approximately 1.5 consecutive days of rest when fatigue was presumed to be at its lowest, and after the night shift (after a night shift; Fatigue condition), when fatigue was presumed to be at its highest.
This study received approval from the Toyama University Clinical Research Ethics Committee (License number: Rin23-27). All participants were informed about the study’s purpose and procedures, and written consent was obtained before participation. All clinical trials were conducted following a protocol approved by the University of Toyama Ethical Committee in accordance with the ethical standards outlined in the Declaration of Helsinki.

2.2. Experiment Overview

The experimental procedure was explained to the participants in advance, and data were collected using the following procedure:
(1)
The participants applied an appropriate amount of makeup remover to their hands, lathered it with lukewarm water, spread it over their faces to remove makeup, washed their faces, and rinsed thoroughly.
(2)
The participants completed a questionnaire and then rested for 20 min to acclimate to the temperature and humidity conditions in the environment-control room (room temperature: 24.0 °C; humidity: 50.0% RH).
(3)
A digital single-lens reflex camera was used to photograph the participants’ relaxed, full face (straight facial expression, neutral), from which the degree of eye-opening was calculated based on the images (the details are described in Section 2.3.3 “Measurement of the Degree of Eye-Opening”).
(4)
An electrocardiogram (ECG) electrode was placed at the V5 chest lead, and an ECG was recorded while the participants were at rest. After data acquisition, power spectrum analysis of heart rate variability was performed offline to assess autonomic nervous activity.
(5)
A three-dimensional facial imaging device captured participants’ relaxed, neutral facial expressions. Subsequently, a high-speed camera recorded motion during the intentional smiling process. In the offline analysis, a facial wireframe was aligned with the neutral facial expression image, and markers were placed on the facial surface according to representative grid points. The maximum movement distance (MMD) and speed of these markers were calculated from the motion-captured images and analyzed as indicators of fatigue (the details are described in Section 2.4 “Dynamics of intentional facial expressions”).
The above tests were conducted both after a day off (Control condition) and after a night shift (Fatigue condition). All steps (1–5) were performed on 15 participants, while all steps except for the ECG recording (step 4) were completed for the remaining ten participants.

2.3. Subjective Assessment of Fatigue

2.3.1. Fatigue Questionnaire

A questionnaire was developed to assess chronic fatigue based on the self-diagnosis checklist created as part of the Japanese Ministry of Education, Culture, Sports, Science and Technology’s research on consumer needs, titled “Research on the Molecular and Neural Mechanisms of Fatigue, Fatigue Sensation, and Defense Against It” [27,28]. The questionnaire included ten physical and ten mental/psychological symptoms presented in random order (Table 1). Participants were instructed to indicate the extent to which each item applied to them by selecting one of the following five points: 0 (not at all), 1 (not very much), 2 (somewhat), 3 (strongly), or 4 (very strongly). Based on these responses, total scores were calculated for the ten PF items (maximum score: 40), the ten MF items (maximum score: 40), and all 20 items combined [total fatigue (TF) = PF + MF; maximum score: 80].
The participants were required to rate each of the ten physical and ten mental and psychological symptoms by selecting one of the five points: 0 (not at all), 1 (not very much), 2 (somewhat), 3 (strongly), or 4 (very strongly).
Using the Japanese Ministry of Health, Labour and Welfare’s diagnostic criteria for chronic fatigue syndrome (CFS)—which differentiates between healthy individuals (those with a performance status score of 1 or less, able to carry on normal activities but occasionally feeling fatigued, and no abnormalities in clinical blood tests) and CFS patients—participants were classified based on their questionnaire scores into three categories: a safe zone (0 ≤ PF ≤ 8, 0 ≤ MF ≤ 10, 0 ≤ TF ≤ 19), a caution zone (9 ≤ PF ≤ 13, 11 ≤ MF ≤ 15, 20 ≤ TF ≤ 28), and a danger zone (PF ≥ 14, MF ≥ 16, TF ≥ 29) for PF, MF, and TF, respectively [28].

2.3.2. Visual Analog Scale Method

Facial expressions of fatigue were subjectively evaluated using the Visual Analog Scale (VAS) method. Participants were provided with a 100 mm line on a piece of paper, with the left end representing no facial fatigue and the right end representing extreme facial fatigue. While observing their own face in a mirror, participants marked a point along the line that reflected their subjectively perceived level of fatigue in their facial expressions. The experimenter then measured the distance from the left end, which was used to quantify the perceived intensity of facial fatigue.
Overall fatigue was also assessed using the VAS method. Participants were provided with a sheet containing a 100 mm line, with the left end representing no fatigue and the right end representing extreme fatigue. Participants marked a position along the line that reflected their perceived level of overall fatigue. The experimenter then measured the distance from the left end to this mark, recording it as the intensity of overall fatigue.

2.3.3. Measurement of the Degree of Eye-Opening

The experiment was conducted in a room where sunlight was blocked, and the lighting conditions were uniformly controlled. The participants sat upright in a chair with their head resting on a headrest, chin slightly retracted, and their gaze held horizontally forward, keeping the head and face motionless. The participant’s face was projected onto the LCD monitor of a digital single-lens reflex camera (EOS Kiss X3, Canon Inc., Tokyo, Japan) mounted on a tripod, with a grid line displayed to ensure proper facial alignment. A photograph of the participant’s full face in a relaxed, neutral state was taken from a shooting distance of 1.28 m. A standard zoom lens (EF-S18-55 mm F3.5-5.6 IS II, Canon Inc., Tokyo, Japan) was used at a 55 mm focal length, with a shutter speed of 1/30 s, aperture F5.6, ISO 400, Auto White Balance, and a strobe with diffuser to capture an image of approximately 15.1 million pixels. The measurement conditions were standardized across both the control and fatigue conditions.
Seven photographs were taken, with the first two serving as practice measurements without informing the participants. From the third measurement onward, the best conditions were selected based on the following criteria: (1) standing upright with the chest slightly forward and shoulders relaxed, (2) maintaining a relaxed, neutral facial expression, (3) keeping eyelids open without engaging the frontalis muscle, (4) directing the gaze horizontally toward the camera, (5) avoiding blinking, and (6) excluding measurements that exceeded three times the standard deviation (SD) of eye-opening. The JPEG images were processed with ten arbitrary points marked on the corneal edge. Based on known data for Japanese individuals (corneal horizontal diameter/vertical diameter ratio of 11.5/10.5) [29,30,31], the center, horizontal, and vertical diameters of each participant’s cornea were estimated using the curve fitting method (Figure 1Aa). This measurement was obtained using the Video-Rugle for Eyelid device (Medic Engineering Inc., Kyoto, Japan). The upper and lower scroll bars were aligned with the upper and lower eyelid margins, using the corneal center as the origin, to measure the distances from this center to both the upper and lower eyelid margins. Considering these values, the degree of eye-opening was calculated using the formula: ({[(distance from the center of the cornea to upper eyelid margin) + center vertical radius]/corneal vertical diameter} × 100).

2.4. Dynamics of Intentional Facial Expressions

2.4.1. Experimental Equipment

A motion capture method was used to record facial shape changes during expressions. To accurately capture dynamic changes, such as those observed in an intentional smile—movements that cannot be adequately recorded by a standard camera (30 fps)—a high-speed camera (FASTCAM MH4-10K, Photron Limited, Tokyo, Japan) with a temporal resolution of 250 fps and spatial resolution of 2540 ppi was employed in the wearable optical motion capture system. Four high-speed cameras were arranged in an arc, with two on each side of the participant’s front at a shooting distance of 1.6 m to ensure recognition of all facial markers. Given the high shutter speed (1/250 s), sufficient illumination was essential to avoid shadows on the face; therefore, lighting fixtures were positioned above each camera and on both sides of the participants. The three-dimensional coordinates of the markers (feature points) were obtained through passive stereo imaging, using triangulation principles applied to the images from the two cameras on each side.

2.4.2. Marker Placement

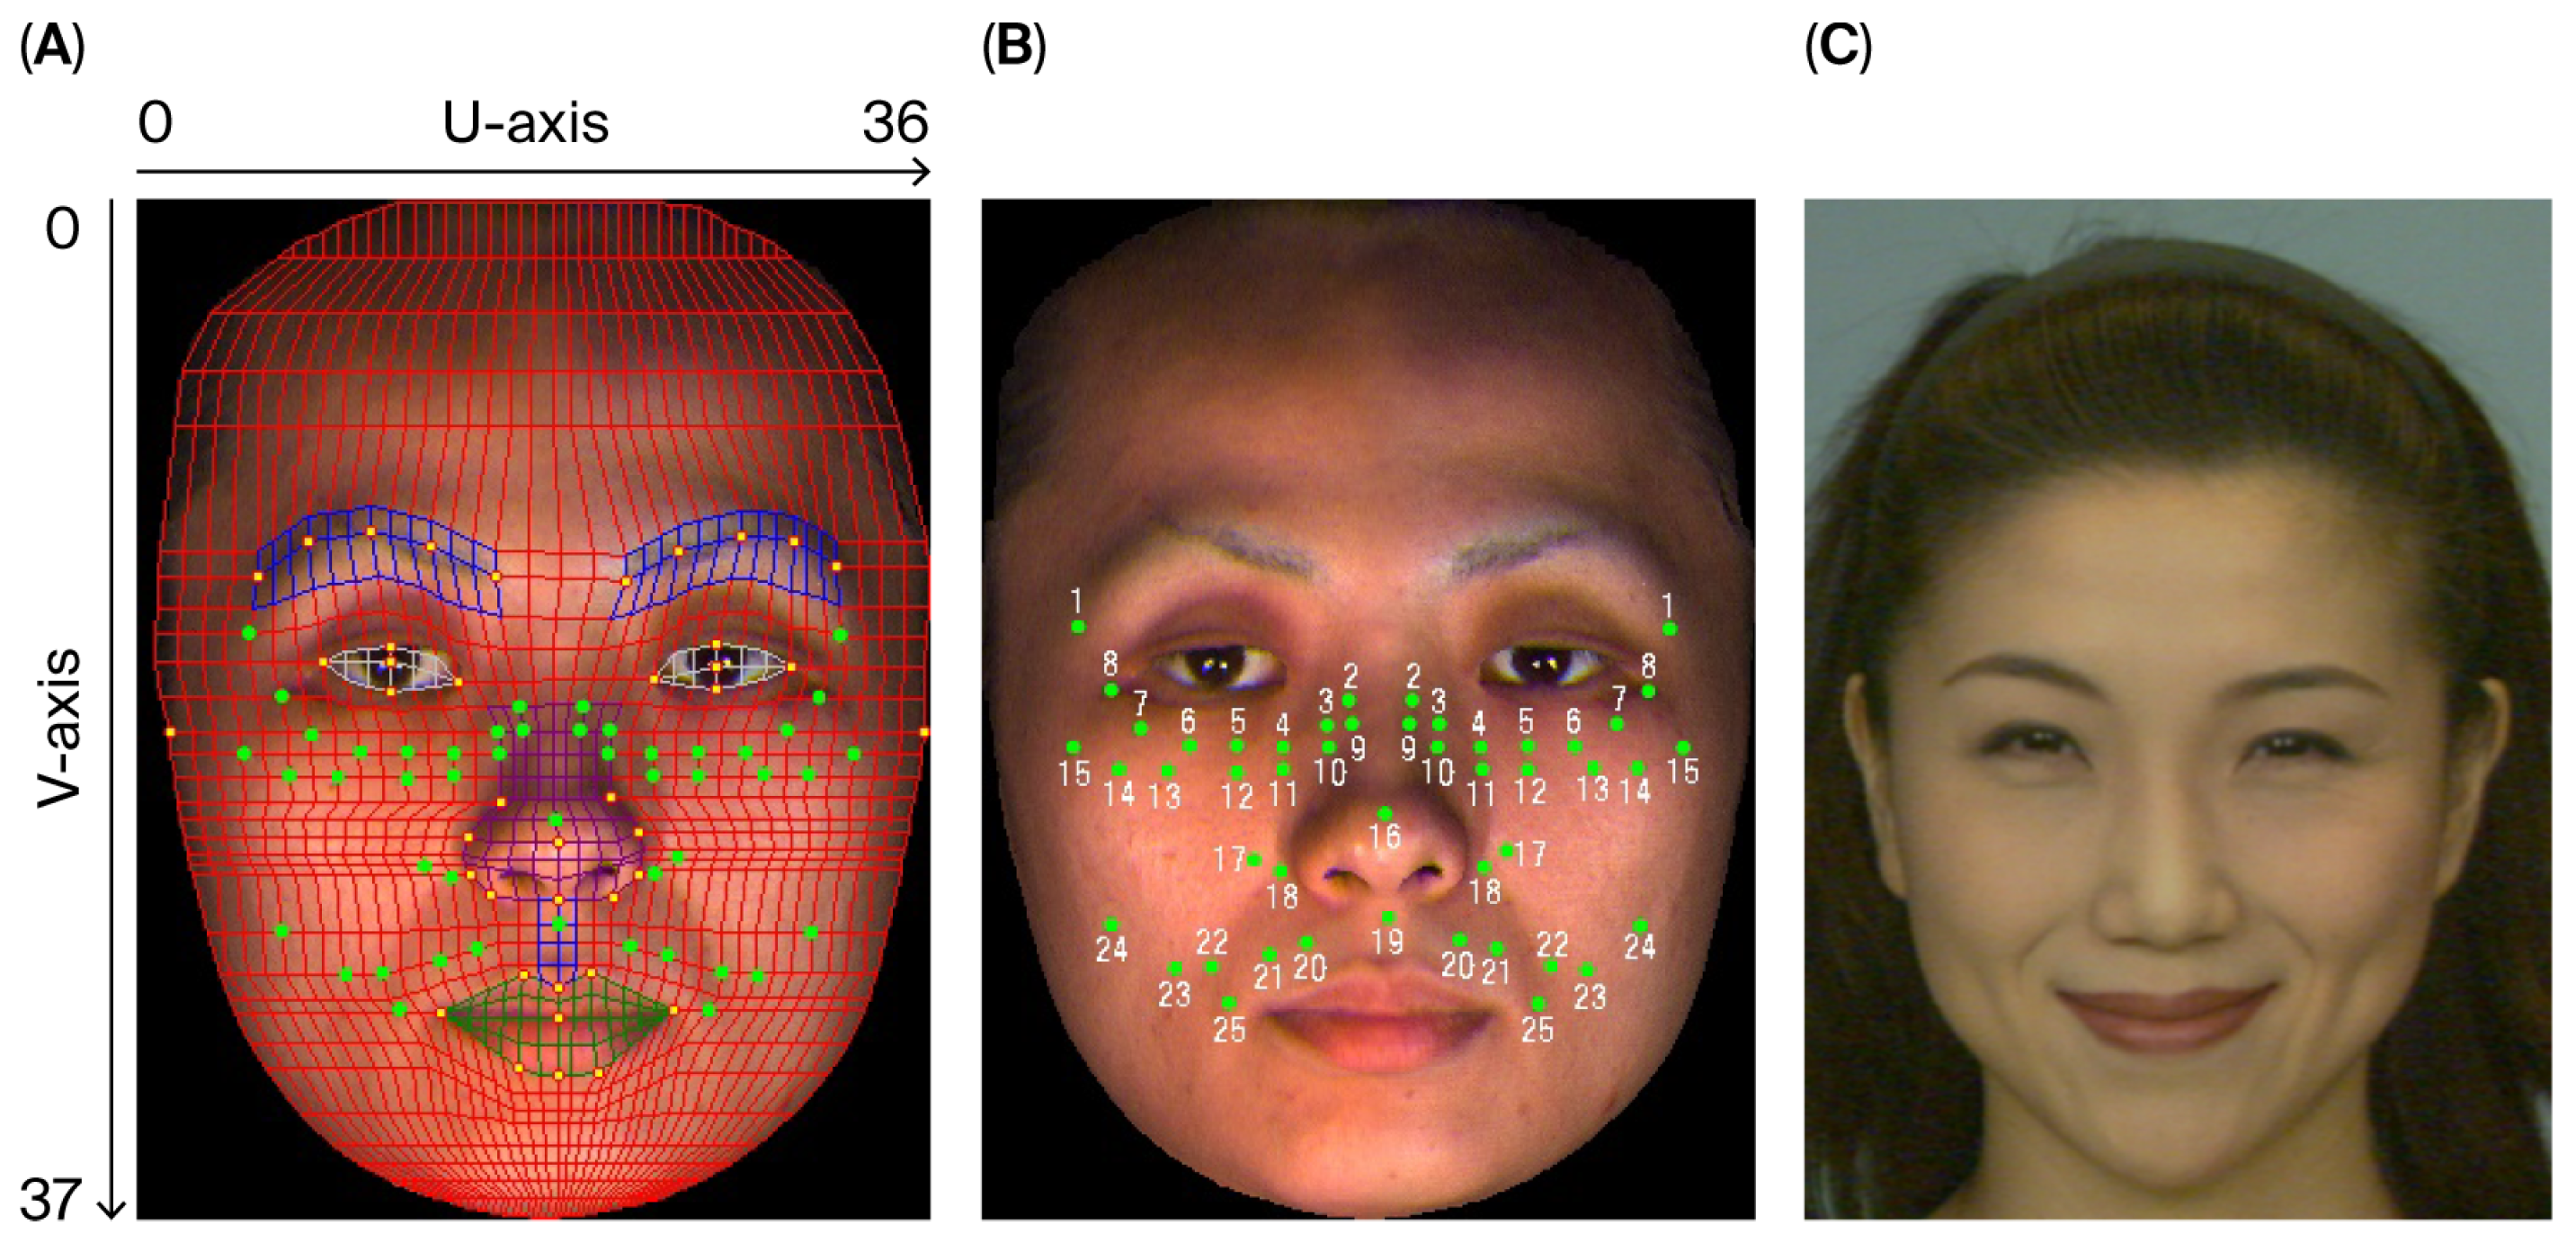
To begin, a three-dimensional facial imaging device (Danae 100SP, NEC Engineering Ltd., Tokyo, Japan) was used to capture the participant’s relaxed, neutral facial expression. A facial wireframe was then applied to this neutral expression image, with markers (25 points on each side, positioned symmetrically) placed at representative grid points, as shown in Figure 2A. The wireframe was subsequently removed in Figure 2B to highlight the 25 markers alone. This procedure was repeated for each participant, creating individual images similar to Figure 2A,B. Using Figure 2B as a reference, 25 green circles, each approximately 3 mm in diameter, were symmetrically applied to the participant’s face using eyeliner (Designing Eyeliner, Kao Corporation, Tokyo, Japan). During smiling, specific facial muscles are activated: (1) the orbital portion of the orbicularis oculi muscle lifts the cheeks, narrowing the eyes; and (2) the zygomaticus major muscle elevates the orbicularis oris muscle, pulling the corners of the mouth upward and backward. To capture these movements, markers were placed in the corresponding regions. Additionally, to account for head movement during imaging, three markers (#2, #3, #9 in Figure 2B) were positioned from the nose root to the nasal dorsum, as these points are expected to maintain their relative positions even with changes in facial expression (hereinafter referred to as fixed points). These three points served as reference points to correct for head movement by applying an affine transformation, aligning the coordinate data of each frame during expression with that of the neutral expression in the first frame. The movement distance was then calculated for the remaining 20 markers. Figure 2A,B originally show individual facial images; however, they are represented here using the average face of 25 participants, constructed via 3D analysis software (3D-Rugle, Medic Engineering Inc., Kyoto, Japan) based on a template wireframe model of facial shape [23,32].

2.4.3. Facial Expression Conditions

The participants were instructed to replicate the facial expressions of a female model (sourced from ATR-Promotions Inc., Kyoto, Japan: either a neutral or smiling expression) for 5 s at intervals of 5 s. For the smiling expression (Figure 2C), participants were asked to keep their mouths closed while recalling a joyful memory to match the model’s expression. Seven cycles were recorded, with each cycle involving a transition from neutral to smiling and back to neutral. The initial two cycles were designated as practice without notifying the participants, and the optimal measurements were selected from the third cycle onward. Criteria for selecting a good image included: (1) minimal head movement during capture, (2) stability of the fixed points—markers with consistent relative positions despite expression changes (confirmed via a chi-square test for goodness of fit), and (3) exclusion of measurements exceeding three times the SD for MMD and speed.

2.4.4. Analytical Methods

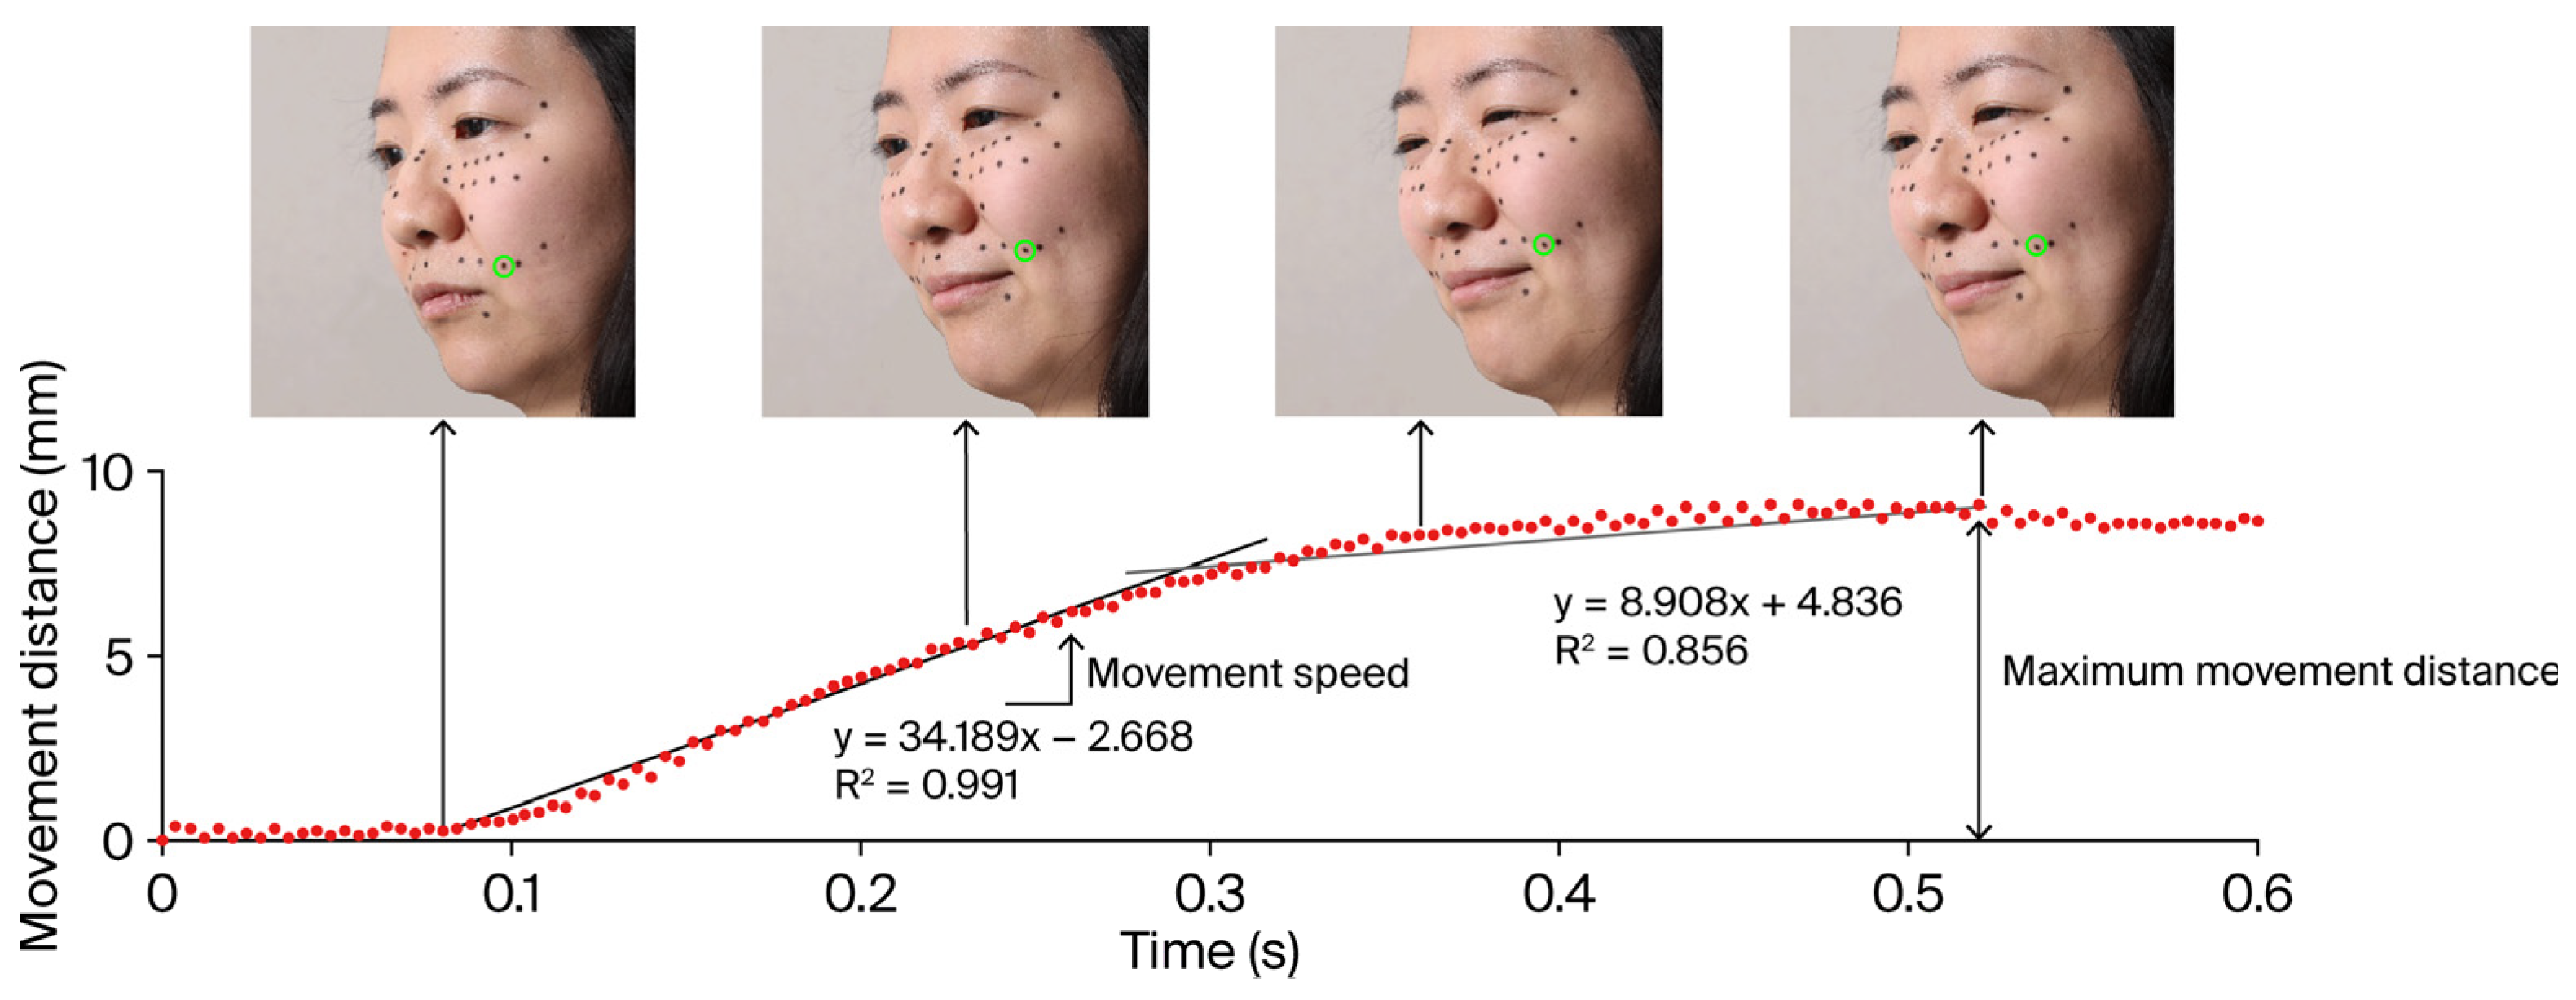
The smiling facial expression sequence was captured at a recording speed of 250 fps, beginning from the frame, showing a neutral expression just before the onset of the smile in the trial rated as optimal, and continuing to the frame where the smile was judged to reach its peak. An example of this smile progression is shown in Figure 3.
In the selected smiling expression scene, the displacement of facial feature points marked on the skin was automatically tracked using the Center of Gravity method. This approach involved generating an outline by distinguishing brightness differences between white and black areas in the image and tracking the center of gravity. The displacement was calculated using three-dimensional coordinates: x-coordinates indicated left and right movement, y-coordinates indicated up and down movement, and z-coordinates indicated front and back movement relative to the face, with the starting point as the zero reference. Parameters such as MMD, movement speed (MS), and others, as described below, were subsequently analyzed.
Figure 3 illustrates an example of the movement distance of point #22 (depicted as black circles within green circles) over time during a smiling expression. The movement distance initially rises sharply from the start of the smile, creating a steep slope, which then transitions into a gradual slope as the smile reaches its peak before declining. This intentional smile expression thus comprises two distinct phases: a fast MS at the beginning, followed by a slower MS in the later stage. To identify the transition point between these two speeds, the inflection point was determined using the least squares method by calculating the slopes in the initial and later segments to maximize the correlation coefficient. The “MMD” parameter represents the distance traveled by marked feature points from the initial frame with a neutral expression to the frame with the peak smile. The “MS” parameter specifically refers to the rapid MS at the start of the smile. These measurements of MMD and MS were calculated for each of the 20 points and used as indicators of fatigue levels.
Using the passive stereo method, we recorded the MMD and MS of the markers (feature points) during an intentional smiling expression. The graph indicates the movement distance (red circles) traveled at point #22 (black circles within green circles) along the time axis, from which MMD and MS were estimated. To protect the privacy of the nurses, these data were obtained from a professional model contracted to handle personal information. The data from this model were used only for this figure and not for any other analysis.

2.4.5. Accuracy of the Motion Capture Method

A calibration tool with 12 markers of known three-dimensional coordinates was photographed using two cameras with a fixed camera orientation, resulting in a root mean square (RMS) residual error of 66.8 μm, calculated based on the spatial relationships among the markers. Additionally, for dynamic calibration, a rotating calibration plate with eight markers of known inter-point distances was photographed with two cameras, yielding an RMS residual error of 190 μm based on the positional relationships among points.

2.5. ECG R-R Interval Variability Spectrum Analysis

An ECG electrode was positioned at the V5 precordial lead, and a resting ECG (Polymate AP1524, Digitex Lab. Co., Ltd., Tokyo, Japan) was recorded for 60 s. A trigger pulse synchronized with the R-wave peak was sent to a computer, enabling R-R interval measurement with a precision of 1 ms. Heart rate variability was analyzed by subjecting the R-R interval data to power spectral analysis using the maximum entropy method (R-R Interval Analysis, NoruPro Light Systems Inc., Tokyo, Japan). The power spectral density function (PSD) was then calculated over the 0.04 Hz to 0.40 Hz range. The power spectral density from 0.04 Hz to 0.15 Hz was defined as the low-frequency (LF) component, while that from 0.15 Hz to 0.40 Hz was defined as the high-frequency (HF) component. Following standard methods, the LF/HF ratio of R-R interval variability served as an index of sympathetic nerve activity, and HF as an index of parasympathetic (vagus) nerve activity averaged over 60 s [33,34,35,36].

2.6. Statistical Analysis

The data are presented as the mean ± SEM. The normality of data distribution was assessed using the Shapiro–Wilk test, and the homogeneity of variance for all normally distributed variables was assessed with Levene’s test. Significance tests included repeated measures two-way ANOVA (analysis of variance), repeated measures three-way ANOVA, paired t-tests, and Wilcoxon Signed-Rank Test. When the assumption of sphericity was violated in repeated measures ANOVA, the Greenhouse-Geisser correction method was applied. For multiple comparisons following repeated measures ANOVA, a simple main effects test utilizing the Bonferroni method was conducted. The correlation between the two variables was assessed using simple linear regression analysis or the Pearson product-moment correlation coefficient. A significance level of 5% or less was considered indicative of a significant difference. Statistical analyses were conducted using IBM SPSS Statistics for Windows, Version 25.0 (IBM Corp., New York, NY, USA).

3. Results

3.1. Evaluation of the Degree of Fatigue

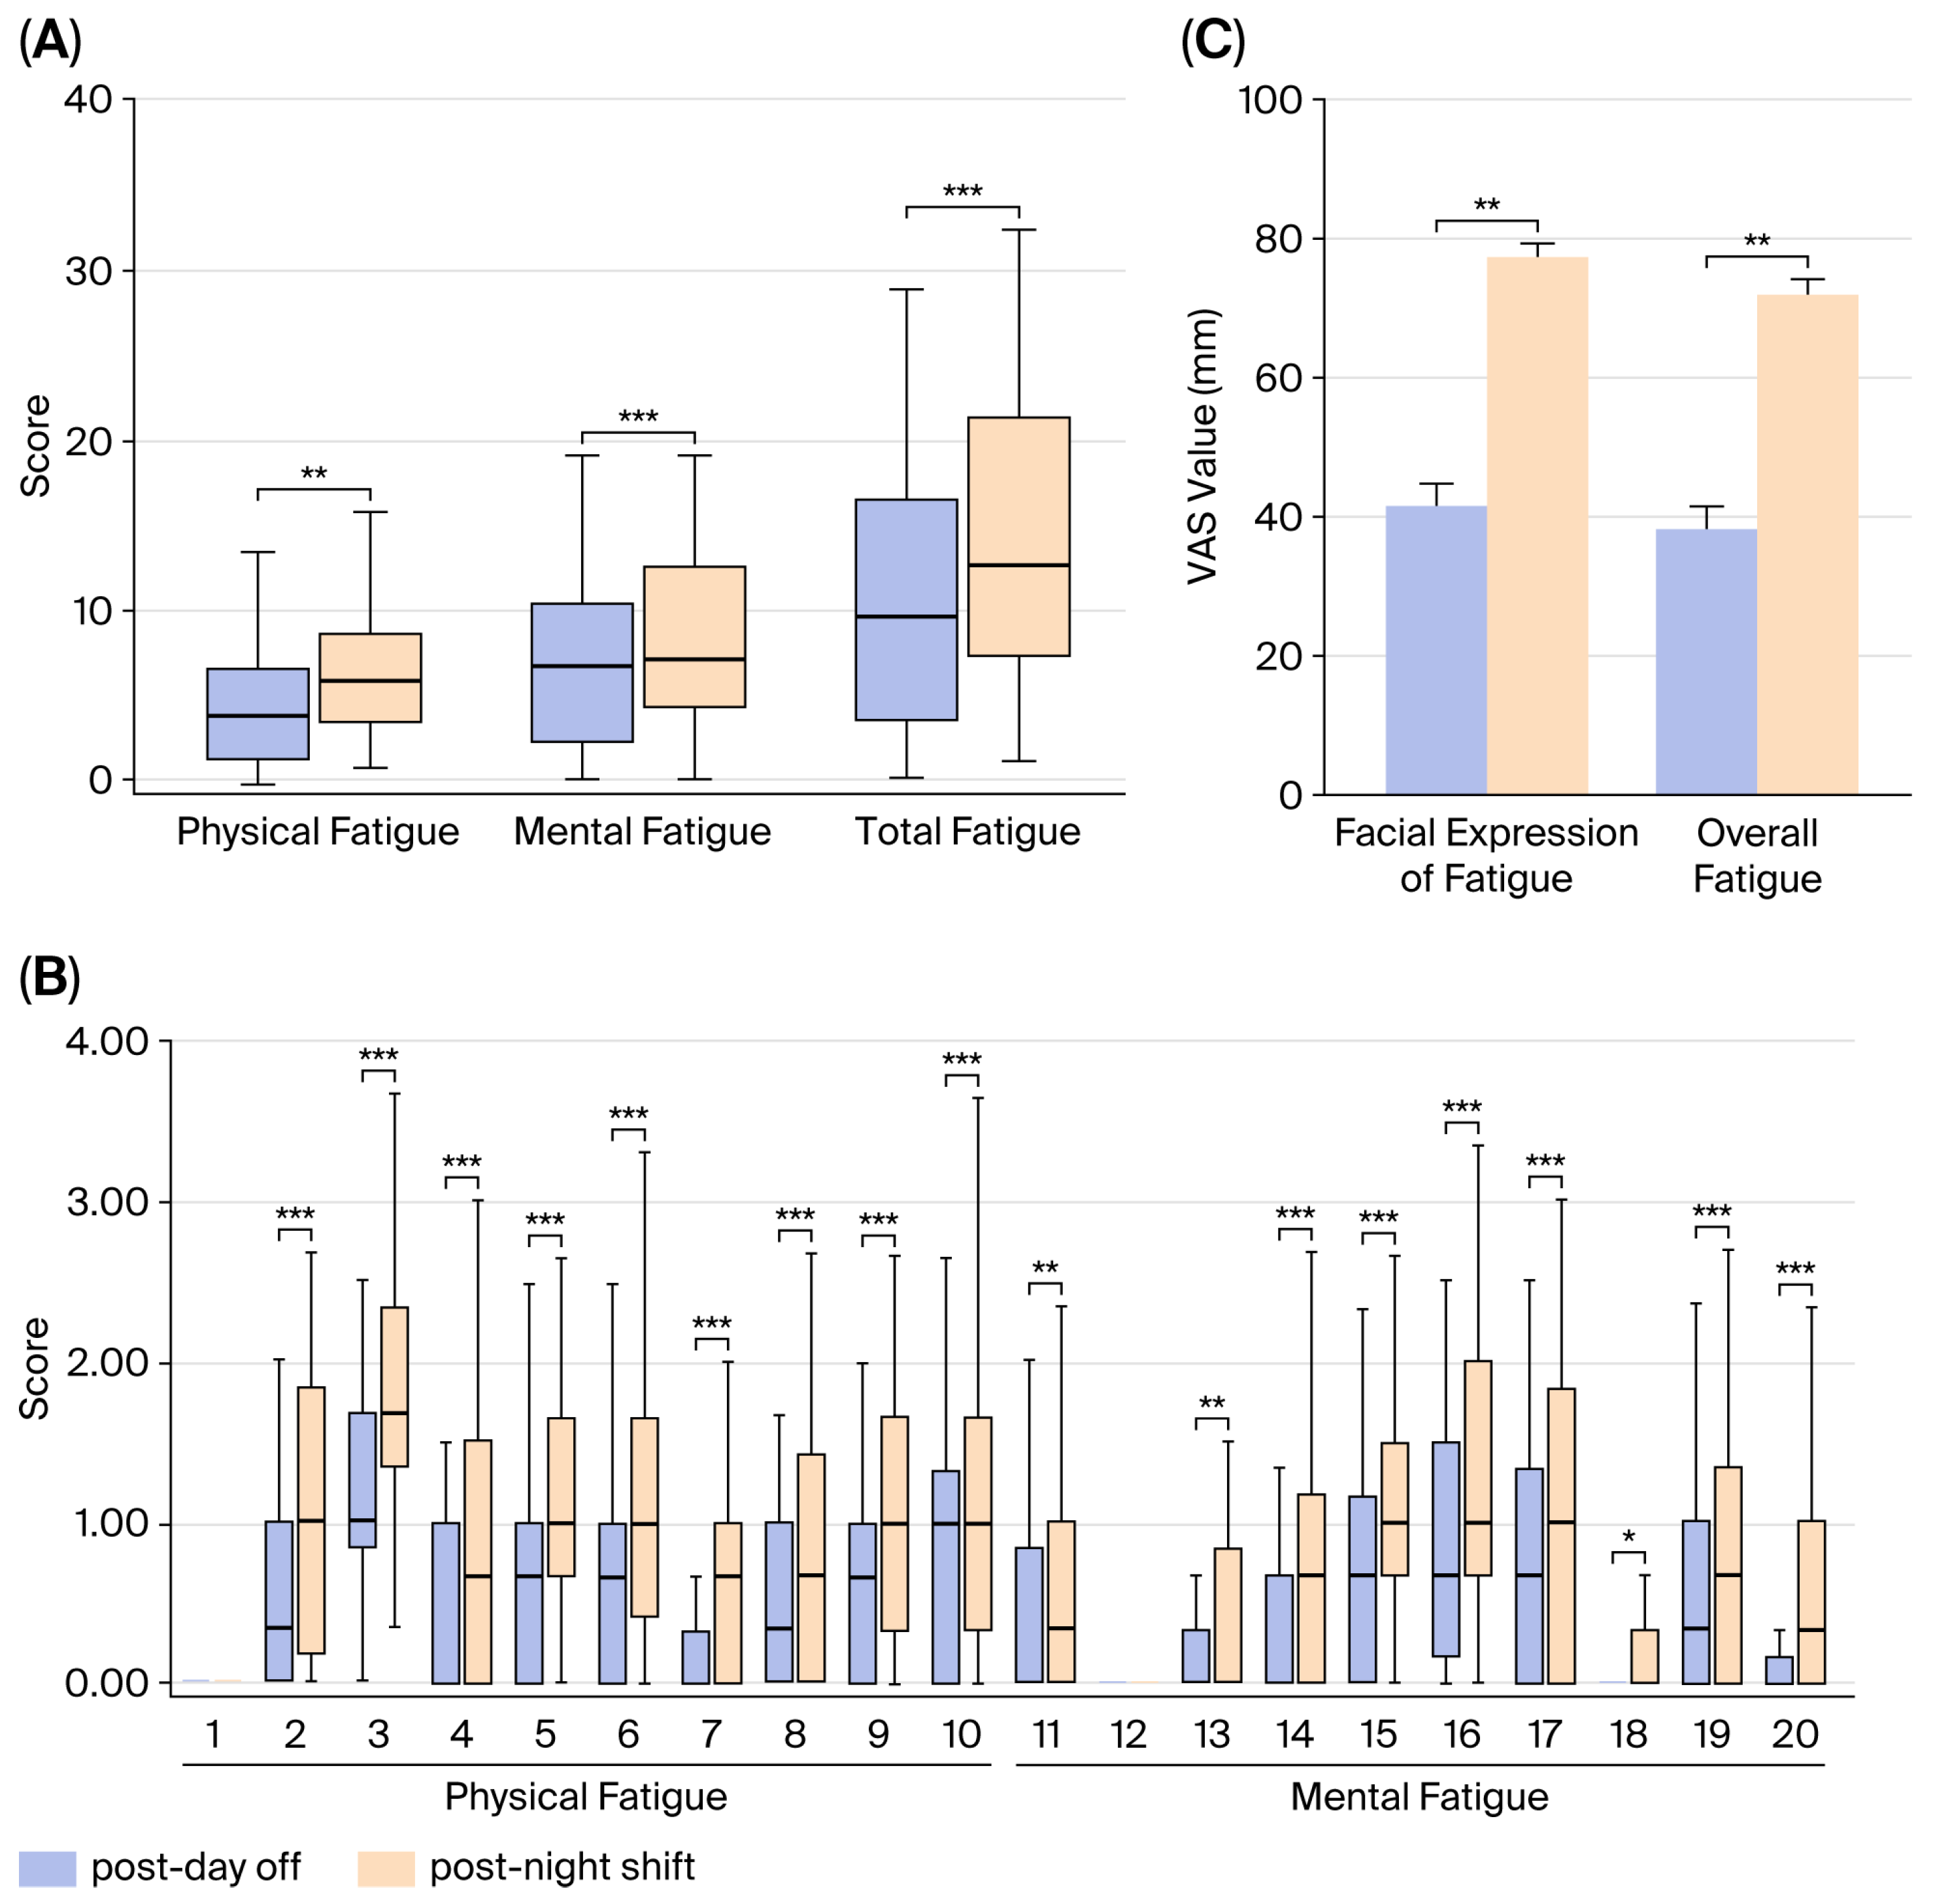
A comparison was conducted between the control state (after a day off) and the fatigue state (after a night shift) among 25 female nurses. Subjective physical and mental/psychological symptoms related to chronic fatigue were evaluated using a self-assessment fatigue checklist (Table 1). The results indicated that, compared to the control state, the fatigue state following a night shift was associated with significantly higher levels of PF, MF, and overall fatigue (Wilcoxon Signed-Rank Test, p < 0.01) (Figure 4A).
In the analysis of each item of PF, the items “Fatigue that persists despite a night’s sleep (Item #8),” “Experiencing significant fatigue even with minimal exercise or work (Item #3),” and “Muscle pain (Item #4)” were particularly affected, with significant increases in scores (Wilcoxon Signed-Rank test, p < 0.001) (Figure 4B). Additionally, in the analysis of each item of MF, the items “Concern about physical health (Item #14),” “Lack of motivation to work (Item #15),” “Trouble remembering minor details (Item #16)” and “Reduced concentration (Item #19)” were particularly affected, with significant increases in scores (Wilcoxon Signed-Rank test, p < 0.001) (Figure 4B).
Additionally, in this study, the evaluation scores were categorized into three zones: safe, caution, and danger. The findings revealed that, compared to the control condition (after a day off), PF, MF, and TF all increased in the fatigue condition (after a night shift). However, these scores remained within the safe zone (0 ≤ PF ≤ 8, 0 ≤ MF ≤ 10, 0 ≤ TF ≤ 19), suggesting that the participants had not yet reached a state of pathological chronic fatigue.
In the subjective assessment of fatigue using the VAS method, as shown in Figure 4C, the subjective assessment values (VAS values) for facial expression of fatigue and overall fatigue sensation were significantly elevated in the fatigue condition (after a night shift) compared to the control condition (after a day off) (paired t-test, p < 0.01). Consistent with the present results, the VAS method is particularly effective for comparing changes over time within participants, as it provides quantitative values and generates interval scale data with equal intervals, making it suitable for tests evaluating personal awareness of fatigue [37]. However, given that many nurses continue to work with accumulated fatigue [38], the recovery of fatigue awareness in the control condition (after a day off) is still considered high compared to that of generally healthy individuals [39].

3.2. Comparison of Degree of Eye-Opening

Figure 1B shows examples of the average face of 25 participants, highlighting differences in fatigue states between the (a) control (after a day off) and (b) fatigue (after a night shift) conditions. A significant difference in the degree of eye-opening is observed, indicating a fatigued facial expression in the fatigue condition. Specifically, compared to the control condition, the fatigue condition demonstrates a notable reduction in the degree of eye-opening, drooping of the upper eyelid, and an increased rate of narrowing of the palpebral fissure. These changes suggest the presence of a fatigued facial expression.
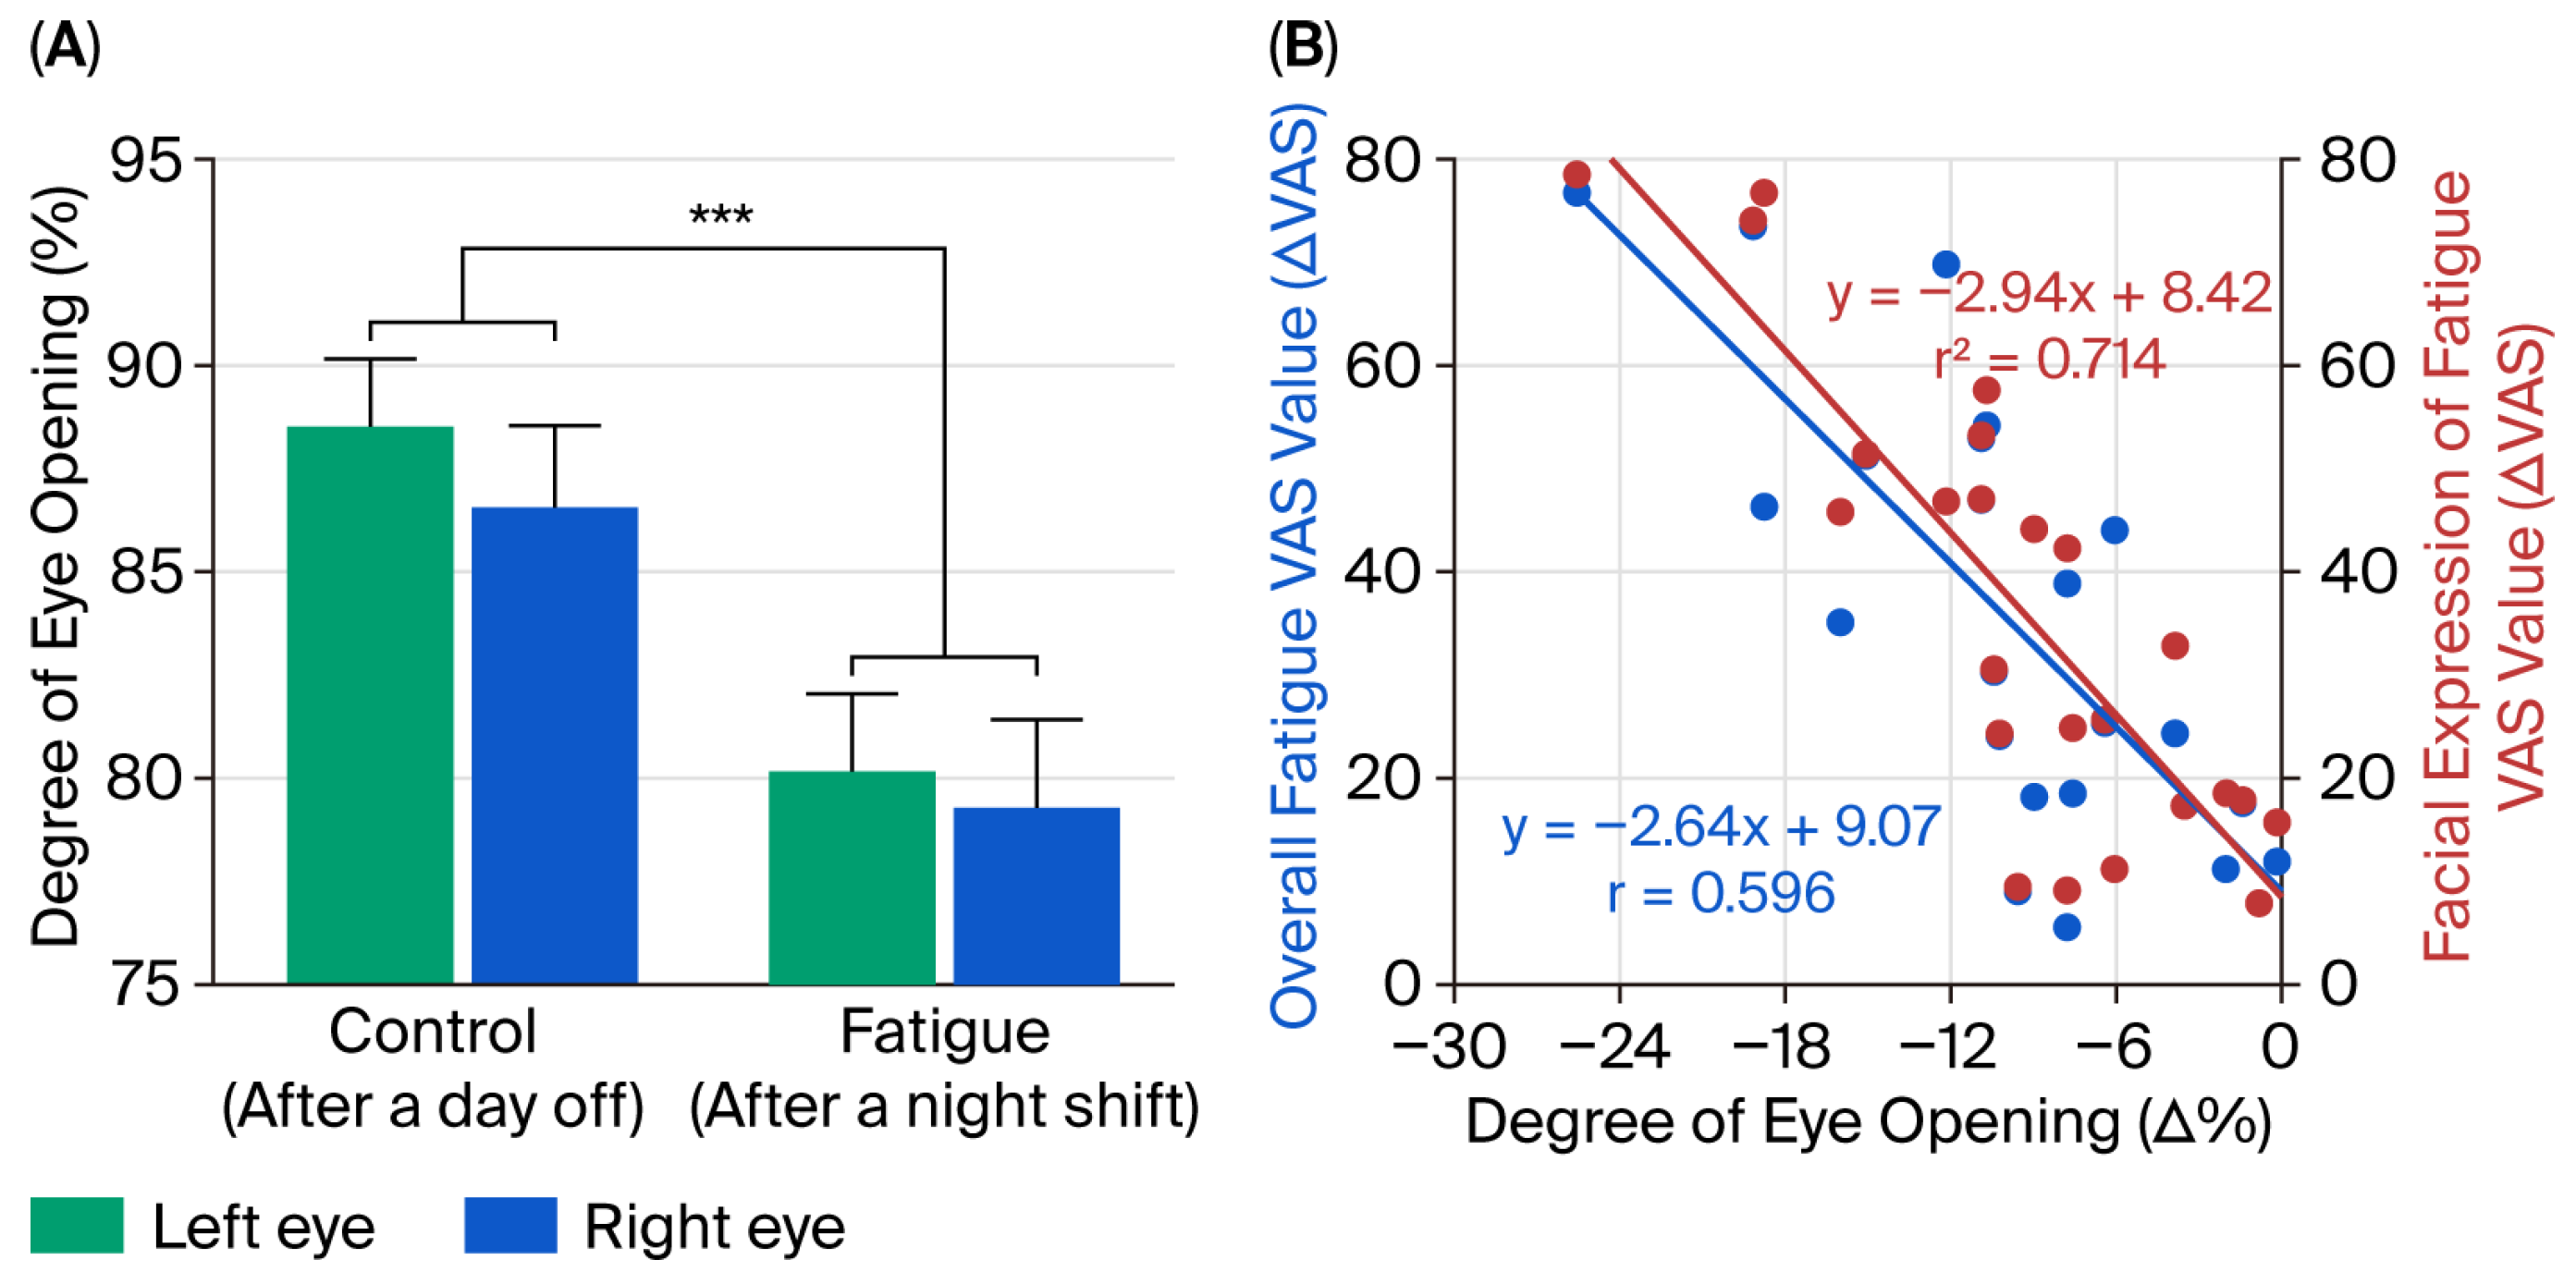
The mean degrees of eye-opening are presented in Figure 5A and were analyzed using repeated measures of two-way ANOVA. The results indicated no significant interaction between fatigue state (after a day off versus after a night shift) and laterality (left eye versus right eye) [F(1, 24) = 3.126, p = 0.09]. However, a significant main effect of the fatigue state was observed [F(1, 24) = 59.411, p < 0.001].

3.3. Relationship Between the Degree of Eye-Opening and Subjective Assessment of Fatigue

Figure 5B shows a scatter plot (red circles) illustrating the change in the degree of eye-opening (Δ%)—calculated by subtracting the degree of eye-opening after a day off from the value obtained after a night shift—as the independent variable [x]. The dependent variable [y] represents the change in subjective assessment of facial expression of fatigue (ΔVAS), determined by subtracting the VAS value for facial expression of fatigue after a day off from the corresponding value after a night shift. A simple regression analysis was conducted to assess the relationship between Δ% [x] and ΔVAS [y], revealing a significant negative correlation [F(1, 24) = 57.264, p < 0.001]. Additionally, the relationship (blue circles) between the change in the degree of eye-opening (Δ%) [x] and the change in subjective assessment of overall fatigue (ΔVAS)—defined as the overall fatigue VAS value after a night shift minus the overall fatigue VAS value after a day off—was also analyzed through simple regression. This analysis similarly identified a significant negative correlation [F(1, 24) = 34.023, p < 0.001]. These findings indicate that as the degree of eye-opening decreases, both the VAS value for facial expression of fatigue and the VAS value for overall fatigue increase.

3.4. Effects of the Fatigue State on Movements of Facial Parts During Intentional Smiling

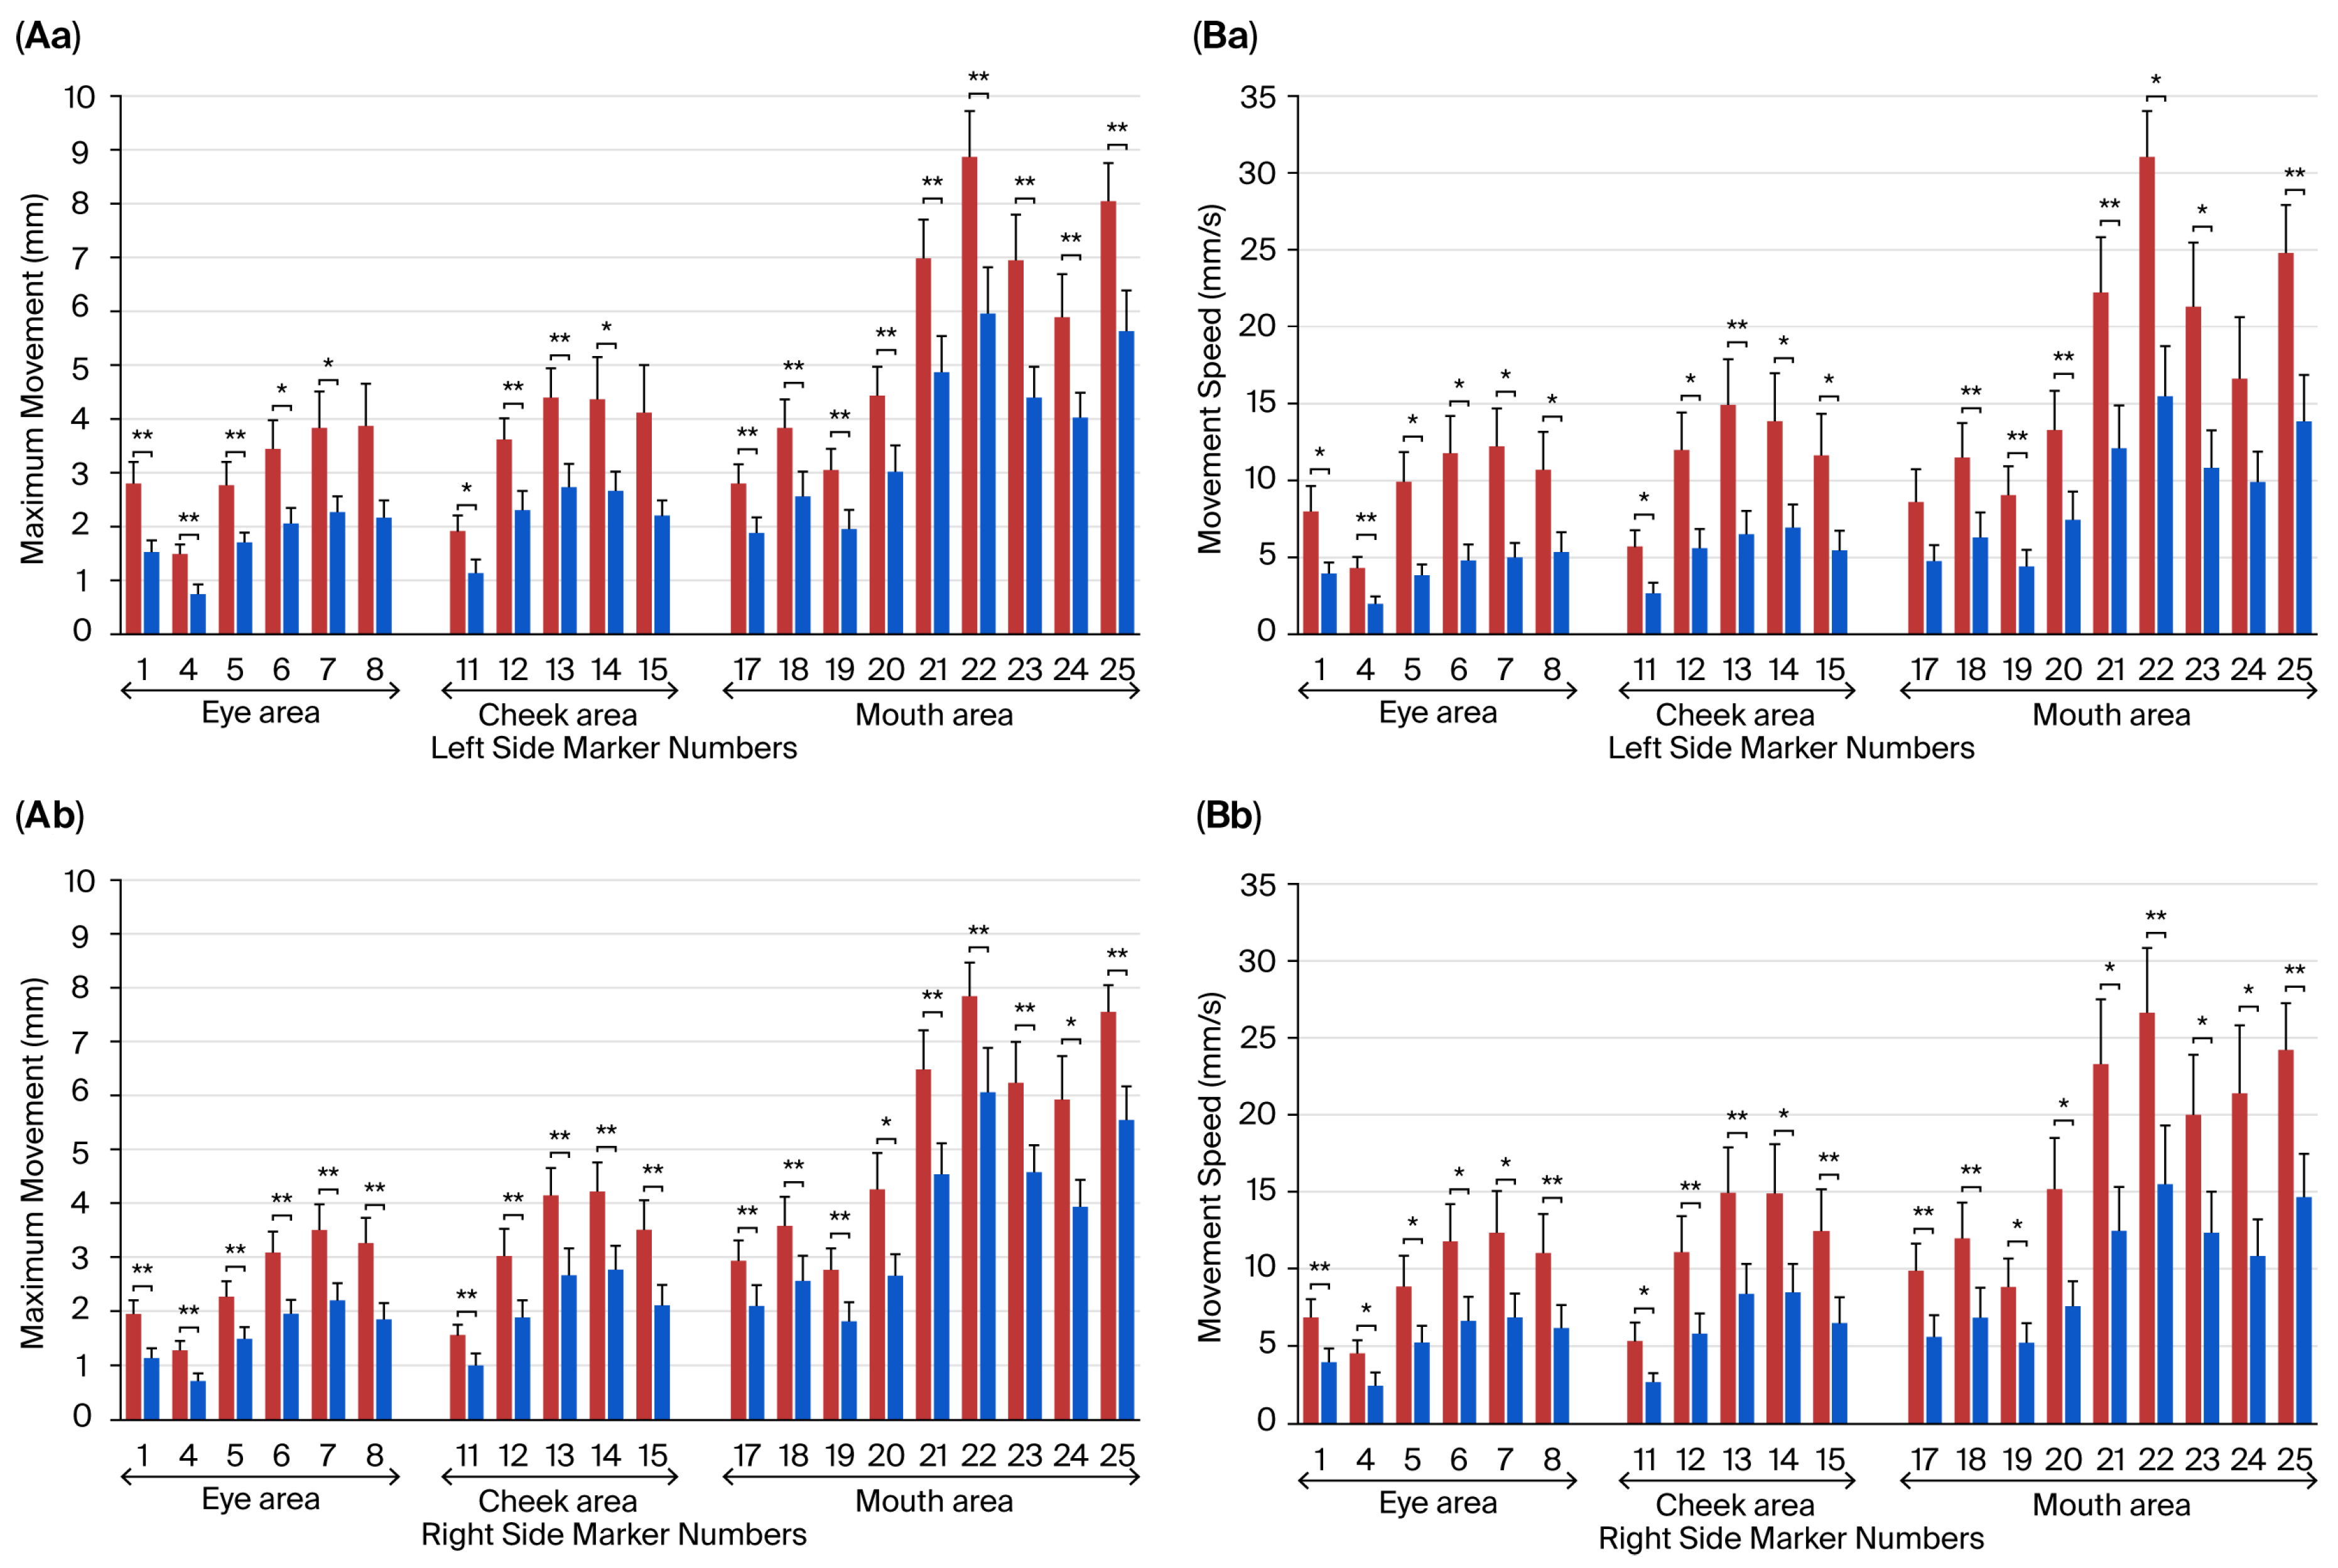
The movement distance and speed of the markers attached to the facial surface during smiling expressions were assessed (Figure 6). Figure 6Aa illustrates the MMD on the left side of the face, while Figure 6Ab depicts the MMD on the right side. The MMD was analyzed using a repeated-measure three-way ANOVA (with Greenhouse-Geisser correction), with laterality (right or left side), face location, and fatigue state (control or fatigue) as factors. The analysis revealed a significant main effect of face location [F(1.163, 15.113) = 40.043, p < 0.001] and a significant main effect of fatigue state [F(1, 13) = 27.035, p < 0.001]. However, no two-way interactions were observed: laterality and face location [F(1.119, 14.546) = 0.069, p = 0.824]; face location and fatigue state [F(1.145, 14.891) = 2.749, p = 0.115]; and fatigue state and laterality [F(1, 13) = 0.561, p = 0.467]. There was also no three-way interaction [F(1.429, 18.575) = 0.010, p = 0.969]. Multiple comparison tests (simple main effects tests using the Bonferroni method) indicated that all markers, except for #10, #16, and the immobile points (#2, #3, #9), showed significantly lower movement distances in the fatigue condition (after a night shift) compared to the control condition (after a day off) (Bonferroni test, p < 0.05, 0.01).
Figure 6Ba illustrates the MS on the left side of the face, while Figure 6Bb depicts the MS on the right side. The maximum MS was analyzed using a repeated measures three-way ANOVA (with Greenhouse-Geisser correction), incorporating laterality (right or left side), face location, and fatigue state (control or fatigue) as factors. The analysis revealed a significant main effect of face location [F(1.103, 14.342) = 17.149, p < 0.001], a significant main effect of fatigue state [F(1, 13) = 9.512, p = 0.009], and a significant interaction between face location and fatigue state [F(1.303, 16.944) = 6.258, p = 0.017]. However, no interactions were observed between the other two factors: laterality and face location [F(1.193, 15.514) = 0.015, p = 0.934]; fatigue state and laterality [F(1, 13) = 0.658, p = 0.432]; or among all three factors [F(1.394, 18.116) = 0.700, p = 0.460]. Multiple comparison tests (simple main effects tests using the Bonferroni method) indicated that all markers, except for #10, #16, and the immobile markers (#2, #3, #9), showed significantly lower MS in the fatigue condition (after a night shift) compared to the control condition (after a day off) (Bonferroni test, p < 0.05, 0.01). Additionally, the MMD and MS were greatest around the corners of the mouth, followed by the cheeks, and smallest around the eyes: MMD was 4.62 ± 0.46 mm (corners of the mouth) > 2.82 ± 0.33 mm (cheeks) > 2.23 ± 0.23 mm (around the eyes), and MS was 13.70 ± 2.29 mm/s (corners of the mouth) > 8.77 ± 1.58 mm/s (cheeks) > 7.00 ± 1.19 mm/s (around the eyes). These results demonstrate that fatigue (after a night shift) reduces the expression of smiles.

3.5. Relationship Between the Subjective Assessment of Fatigue and Facial Movement Distance and Speed During Intentional Smiling

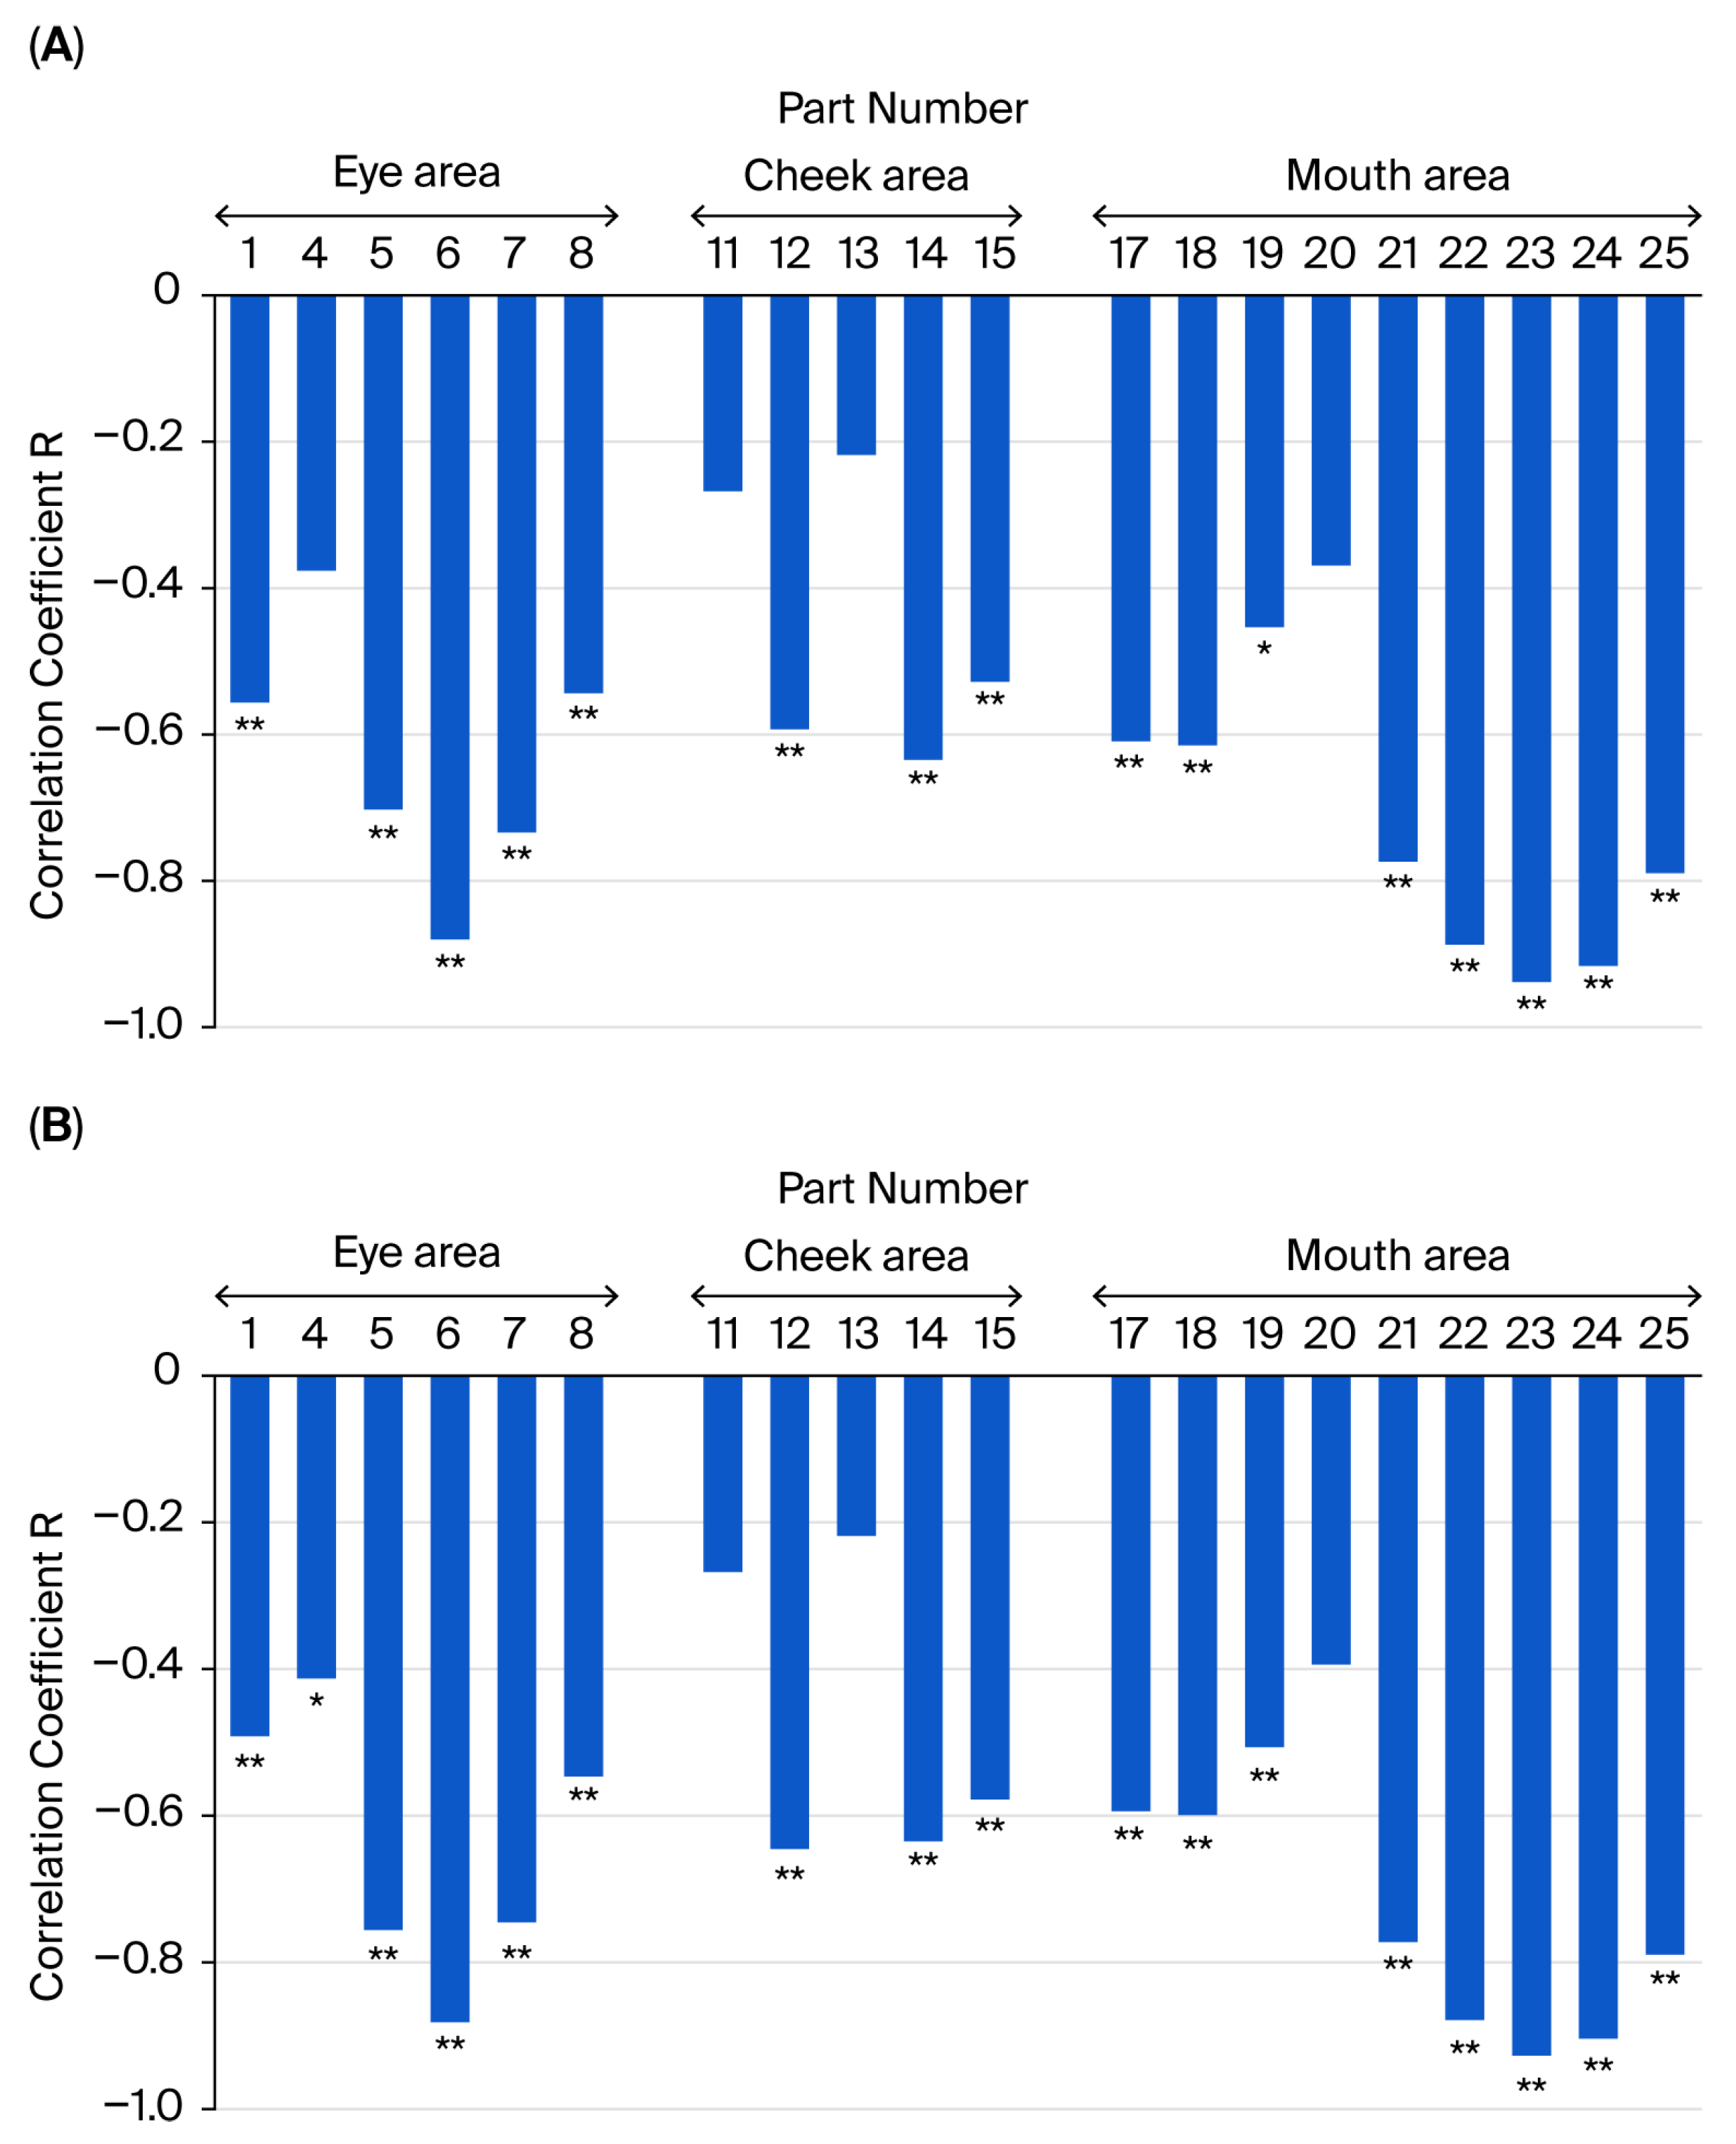
Pearson’s product-moment correlation analysis was conducted to examine the relationship between the relative MMD (%) during intentional smiling in the fatigue condition {[(MMD after a night shift)/(MMD after a day off)] × 100} and the change in the subjective assessment of fatigue facial expressions (VAS value) (ΔVAS), calculated as the VAS value of fatigue facial expressions after a night shift minus the VAS value after a day off (Figure 7A). The results revealed a significant negative correlation between the relative MMD (%) and the change in the VAS value for facial expression of fatigue. The VAS value (ΔVAS) showed a significant negative correlation at all points except for markers #4, #11, #13, and #20 (marker #19, p < 0.05; other markers, p < 0.01) (Figure 7A). Additionally, the analysis assessed the relationship between relative MS (%) {[(MS after a night shift)/(MS after a day off)] × 100} and the change in the subjective assessment of fatigue facial expressions (ΔVAS) (Figure 7B). The results also indicated a significant negative correlation was also observed between relative MS (%) and the change in the VAS value for facial expression of fatigue (ΔVAS) at all points except for markers #11, #13, and #20 (marker #4, p < 0.05; other markers, p < 0.01) (Figure 7B). These findings suggest that a higher rating of facial expression fatigue correlates with a reduced expression of intentional smiles.

3.6. Evaluation of Autonomic Nervous Activity and Its Relationship with Fatigue State

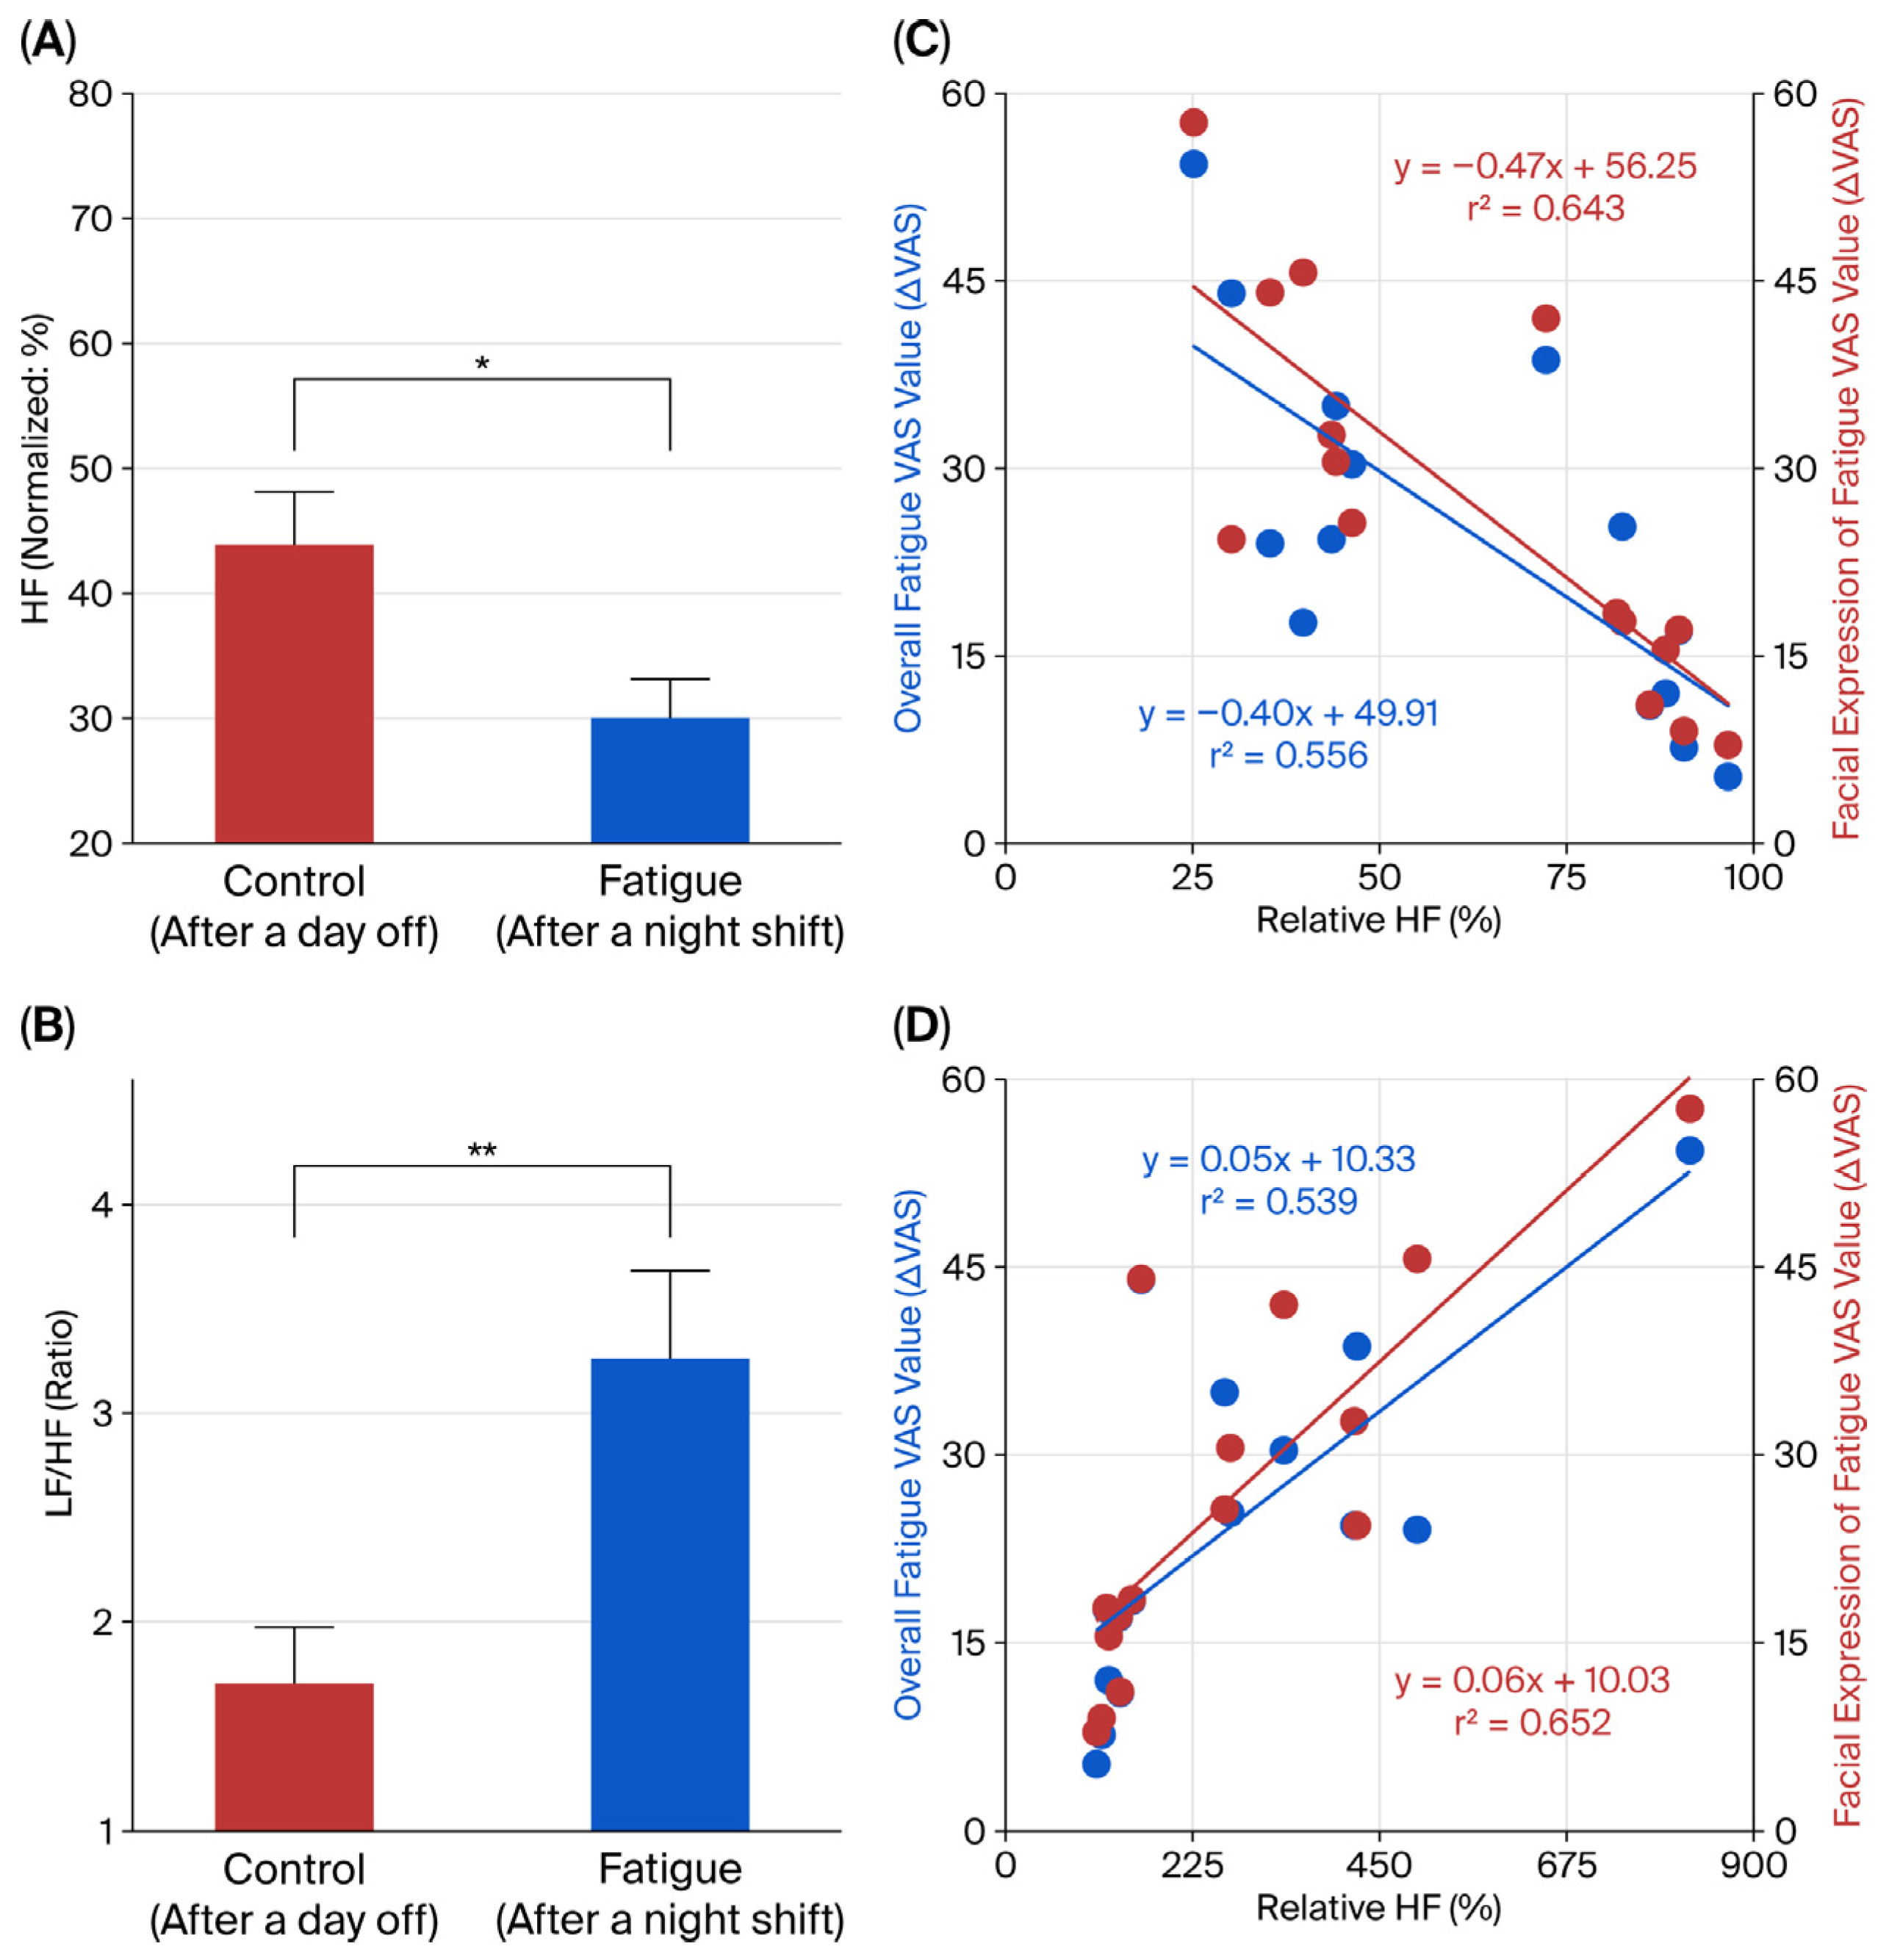
ECG R-R interval variability spectrum analysis revealed significant findings regarding autonomic nerve activity. As shown in Figure 8A, the high-frequency (HF) component, an index of parasympathetic nerve activity, was significantly lower in the fatigue condition (after a night shift) compared to the control condition (after a day off) (paired t-test, p < 0.05). Additionally, Figure 8B shows that the LF/HF ratio, indicative of sympathetic nerve activity, was significantly elevated in the fatigue condition (paired t-test, p < 0.01). These results demonstrate a decrease in parasympathetic nerve activity and an increase in sympathetic nerve activity in the fatigue condition compared to the control condition.
Figure 8C presents a scatter plot (red circles) illustrating the relative HF value (%) in the fatigue condition {[(HF norm after a night shift)/(HF norm after a day off)] × 100} [x] as the independent variable, alongside the change in subjective assessment of facial expression of fatigue (VAS value) (ΔVAS) [y], which represents the difference obtained by subtracting the facial expression of fatigue VAS value after the day off from the VAS value after the night shift. A simple regression analysis indicated a significant negative correlation between these two variables [F(1, 13) = 23.426, p = 0.001] (R2 = 0.643). Similarly, the figure also includes a scatter plot (blue circles) that displays the relative HF value (%) [x] in the fatigue condition as the independent variable and the change in the subjective assessment of overall fatigue (VAS value) (ΔVAS) [y], defined as the difference between the overall fatigue VAS value after the night shift and that after the day off. This analysis yielded a significant negative correlation between the relative HF value (%) [x] after the night shift and the change in the overall fatigue VAS value (ΔVAS) [y] [F(1, 13) = 16.288, p = 0.001] (R2 = 0.556).
Figure 8D displays a scatter plot where the relative LF/HF ratio (%) in the fatigue condition {[(LF/HF after a night shift)/(LF/HF after a day off)] × 100} [x] serves as the independent variable, while the change in the subjective assessment of fatigue facial expression (VAS value) (Δ%) [y] represents the dependent variable (red circles). A simple regression analysis was conducted to evaluate the relationship between these two variables, revealing a significant positive correlation [F(1, 13) = 24.338, p = 0.001] (R2 = 0.652). Additionally, the figure includes another scatter plot where the relative LF/HF value (%) in the fatigue condition [x] is the independent variable, and the change in the subjective assessment of overall fatigue (VAS value) (ΔVAS) [y] is the dependent variable (blue circles). This analysis also indicated a significant positive correlation between the two variables [F(1, 13) = 15.200, p = 0.002] (R2 = 0.539).
The findings indicate a significant correlation between autonomic nervous system activity and fatigue. Specifically, under the fatigue condition: (1) the relative HF value, which indicates parasympathetic nervous activity, decreased, coinciding with an increase in the change in the subjective evaluation of facial expression of fatigue (change in VAS value for facial expression of fatigue, ΔVAS) and an increase in the change in the subjective evaluation of overall fatigue (change in overall fatigue VAS value, Δ%); (2) the relative LF/HF ratio, indicating sympathetic nervous activity, increased, alongside an increase in the change in the subjective evaluation of facial expression of fatigue (ΔVAS) and an increase in the subjective evaluation of overall fatigue (Δ%).

4. Discussion

4.1. Subjective and Objective Assessment of Fatigue

We found that fatigue is manifested in facial expressions and developed an objective method to evaluate these expressions. Initially, we aimed to quantify the subjective assessment of chronic fatigue and the subjective evaluation of fatigue-related facial expressions in female nurses, who are believed to experience accumulated fatigue due to disruptions in their daily rhythms and lack of sleep from shift work. Their roles involve assisting with medical treatments while standing, conducting constant ward rounds, providing postoperative care, handling emergencies, and managing sudden changes in patients’ conditions. Chronic fatigue was assessed through a fatigue awareness survey using a self-diagnosis checklist developed as part of the Japanese Ministry of Education, Culture, Sports, Science and Technology’s research on consumer needs [27,28]. The results indicated a significant increase in fatigue levels in the fatigue condition (after a night shift) compared to the control condition (after a day off). Furthermore, the subjective assessment of overall fatigue as well as fatigue-related facial expressions, evaluated using the VAS method, also showed a significant increase in the fatigue condition compared to the control condition.
Next, we aimed to objectively assess the degree of fatigue in the same participants. We employed an objective evaluation method, ECG R-R interval variability spectrum analysis, to explore the relationship between subjective fatigue—specifically, overall fatigue and the participants’ assessment of fatigued facial expressions—and autonomic nervous activity. Our results indicated a decrease in parasympathetic nervous activity and an increase in sympathetic nervous activity as fatigue levels rose. We had previously noted a trend of decreasing parasympathetic nervous activity in response to induced fatigue from a short-term mental arithmetic load, leading us to predict that parasympathetic activity would decline as fatigue increased, which was confirmed in our findings [40]. Previous literature has established a connection between fatigue and autonomic nervous activity. For instance, CFS, first reported in the United States during the 1980s, is characterized by pathological fatigue and malaise severe enough to interfere with daily activities; studies have indicated that CFS is associated with increased sympathetic nervous activity and decreased parasympathetic activity [41,42]. Additionally, variations in autonomic nervous activity have been linked to daily fluctuations in fatigue levels [43]. These findings support the relationship we have observed between fatigue perception and autonomic nervous activity. Furthermore, we identified a significant correlation between the participants’ assessments of fatigued facial expressions and autonomic nervous activity.
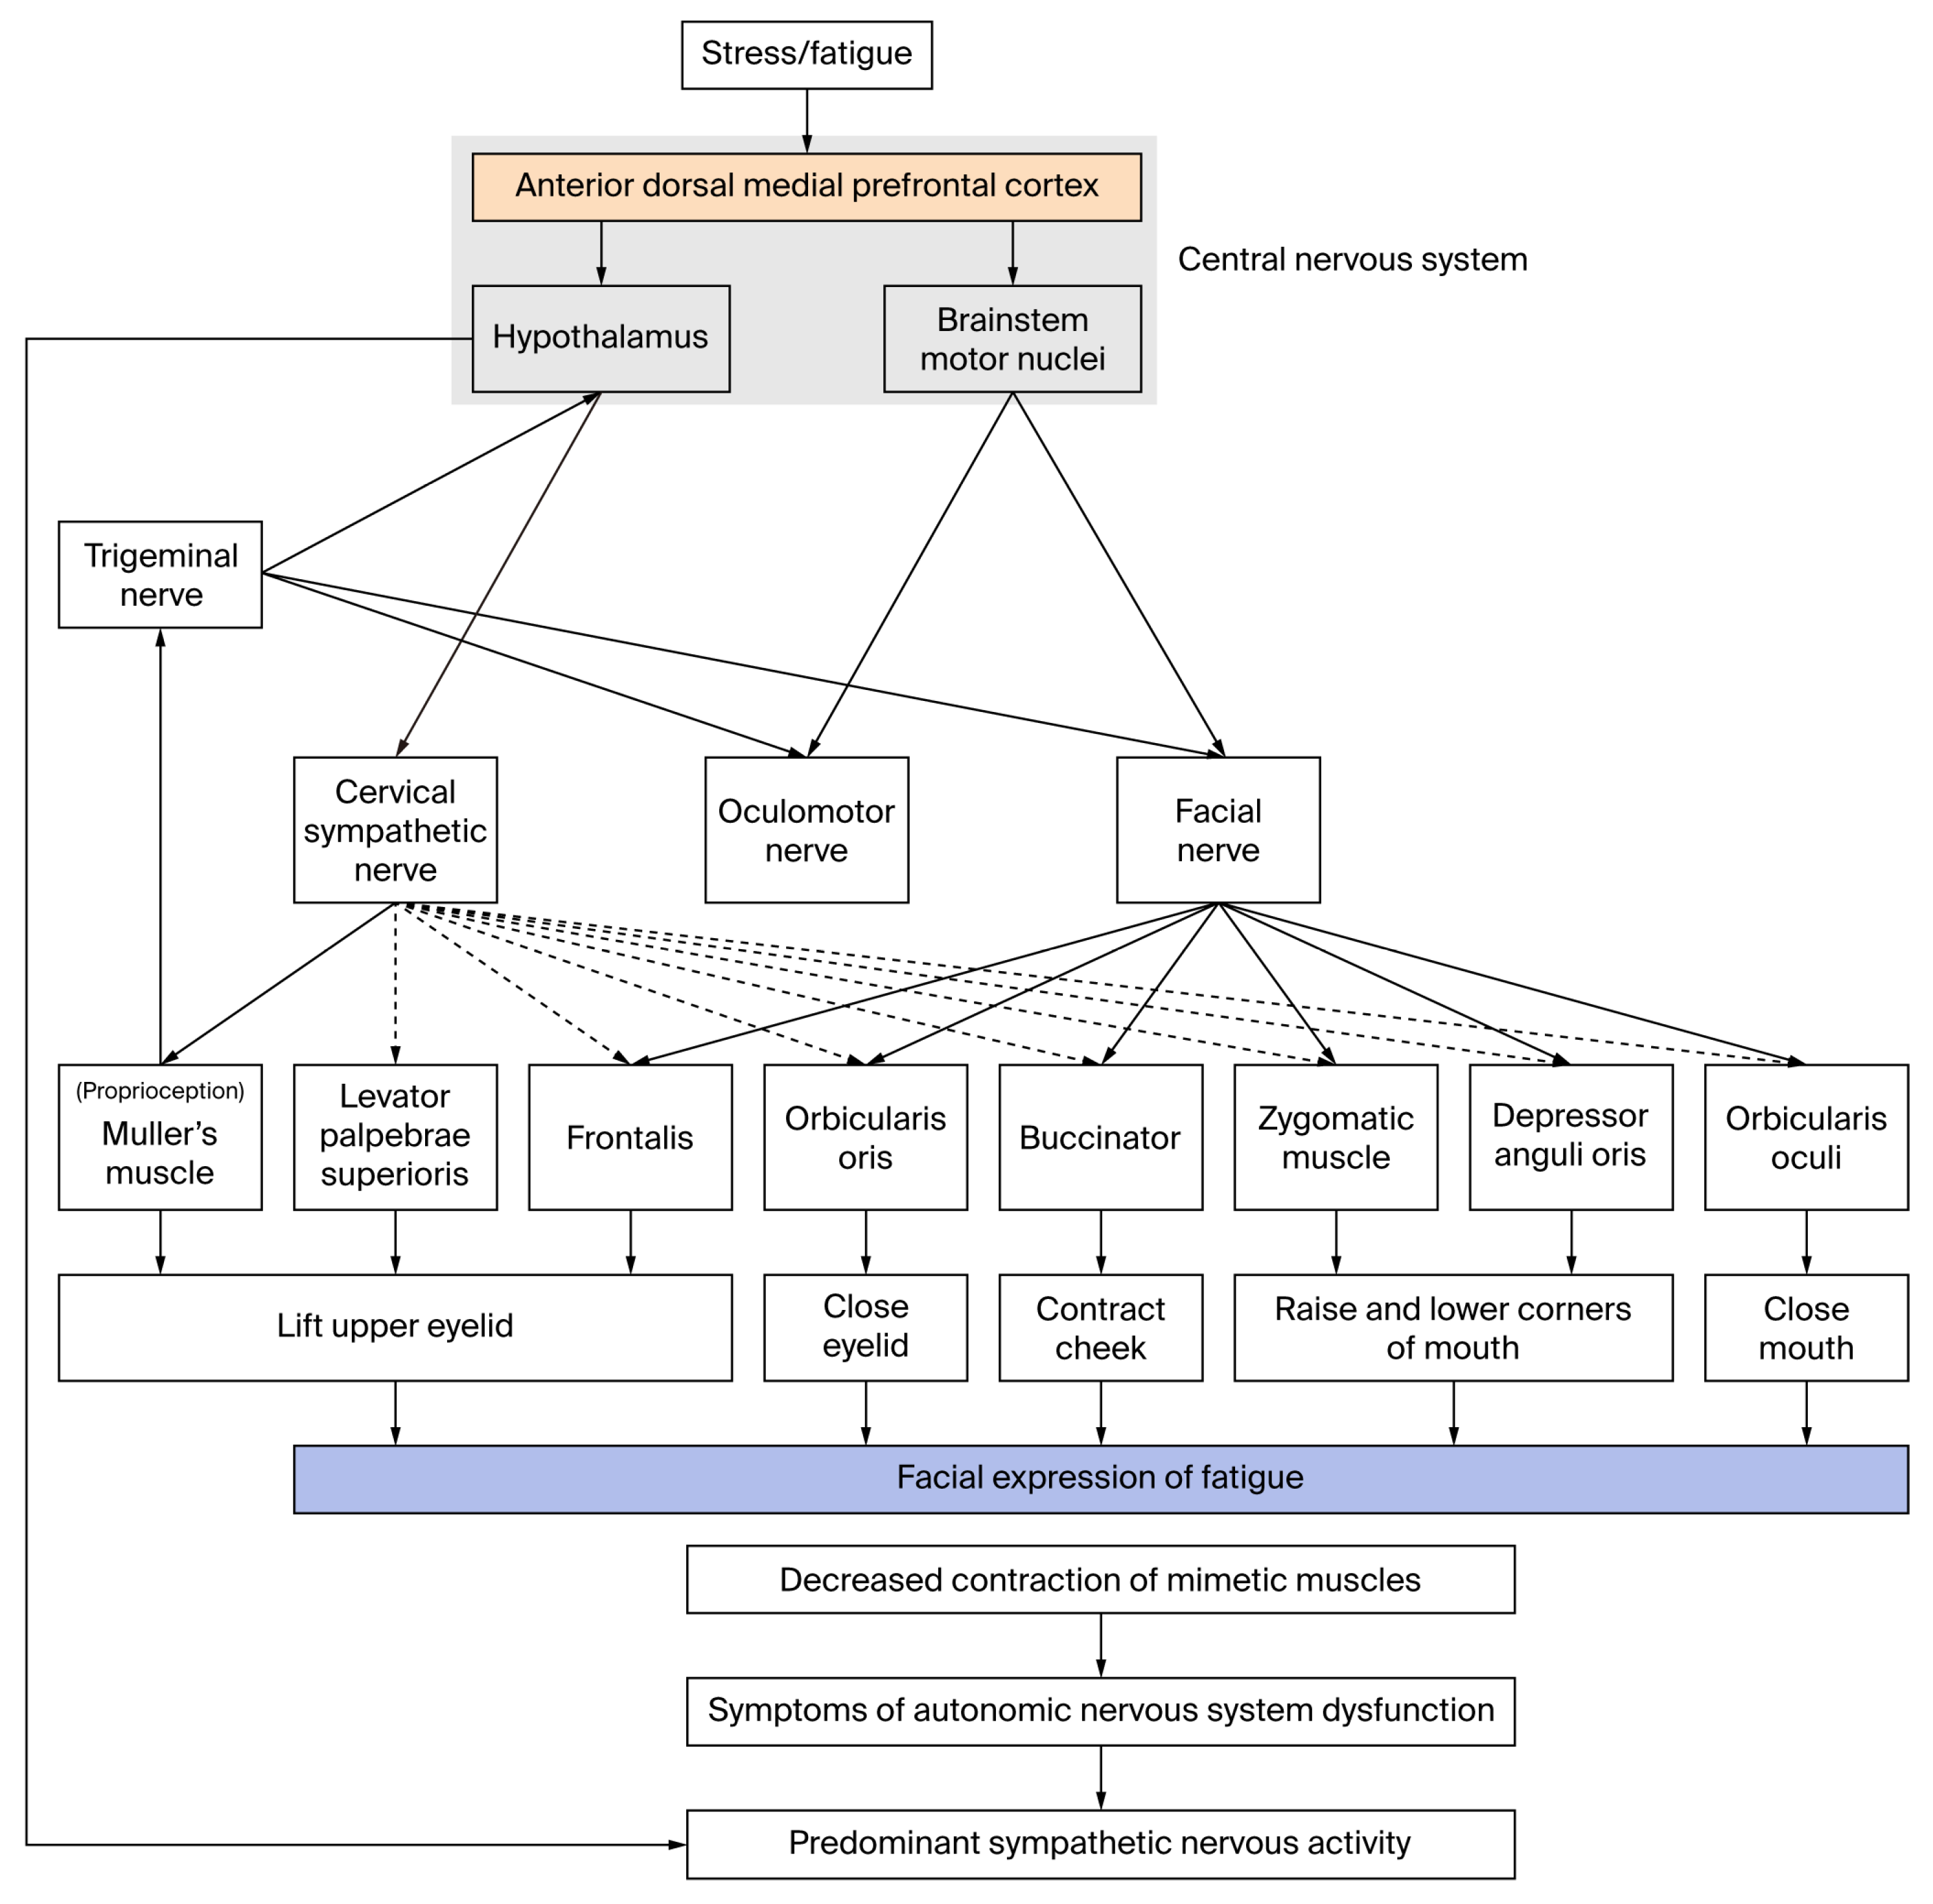
Second, the evaluation of eye-opening indicated a decrease in the degree of eye-opening associated with fatigue. This suggests that measuring the extent of eye-opening could serve as an indicator of fatigue levels. Physiologically, when a fatigued facial expression is displayed, activity in the anterior dorsal medial prefrontal cortex increases, as illustrated in Figure 9. This heightened activity may lead to an increase in sympathetic nerve activity [40,44]. Furthermore, it has been proposed that signals from mechanoreceptors in the Müller muscle are transmitted to the hypothalamus via the trigeminal nerve, thereby further enhancing sympathetic nervous activity (see the next paragraph for details). Consequently, it is proposed that the Müller muscle, which is innervated by sympathetic nerves and responsible for opening the palpebral fissure, may become fatigued, resulting in a decrease in contractile force. This reduction would lower the upper eyelid and narrow the palpebral fissure. Additionally, it is suggested that prolonged excessive release of acetylcholine (ACh) at the neuromuscular junction by sympathetic nerves [45] could diminish ACh levels in the synapses, thereby reducing the contractile force of the levator palpebrae superioris muscle. These two mechanisms are believed to contribute to the observed decrease in eye-opening. Thus, this phenomenon in the fatigue condition may stem from increased sympathetic nervous system activity induced by fatigue.
When a fatigued facial expression is exhibited, heightened activity in the anterior dorsal medial prefrontal cortex results in increased hypertonic sympathetic nervous activity, which induces fatigue of the Müller muscle. Additionally, it has been proposed that signals from mechanoreceptors in the Müller muscle are transmitted to the hypothalamus via the trigeminal nerve, thereby further enhancing sympathetic nervous activity. The increased sympathetic activity may induce an excessive release of ACh at the neuromuscular junctions of the other mimetic muscles, leading to the depletion of ACh in these junctions and reducing their movements.
Third, under conditions of fatigue, significant changes were observed in the movement of mimetic muscles during intentional smiling, with both MS and MMD notably reduced. Furthermore, the MS and MMD were greatest around the corners of the mouth, followed by the cheeks, and smallest around the eyes. These findings suggest that the placement of the markers was appropriate for the analysis. In the method used for this experiment, the movement distance of the marker overtime during a smile expression initially exhibited a steep increase, followed by a gentler slope, peaking before gradually declining. This change in movement distance appears to reflect a nonlinear progression over time. By identifying the point where the slope changes as an inflection point, it can be inferred that the MS during smiling consists of a rapid component in the initial phase and a slower component in the later phase. The mimetic muscles are composed of mixed muscle fibers, including fast-twitch fibers that contract quickly and voluntarily and slow-twitch fibers that contract involuntarily. During intentional smiling, fast-twitch muscle fibers are activated first, followed by slow-twitch fibers, which contract reflexively and help maintain tension [46]. Therefore, the inflection point is thought to correspond to the transition from fast-twitch to slow-twitch muscle fiber contraction.

4.2. Physiological Mechanisms of Facial Expressions of Fatigue

Figure 9 illustrates a proposed mechanism for the expression of facial fatigue. When a facial expression of fatigue is exhibited, increased activity in the anterior dorsal medial prefrontal cortex leads to heightened sympathetic nerve activity, resulting in hypertonicity, as previously discussed in the section on eye-opening [40,44]. Concurrently, muscle fatigue diminishes the contractile force of the facial muscles. Although facial muscles lack muscle spindles, mechanoreceptors in the Müller muscle have been reported to compensate for this deficiency by transmitting signals from the trigeminal nerve to the hypothalamus, thereby enhancing sympathetic nerve activity [47].
When a fatigued individual intentionally smiles, increased activity of both the sympathetic and facial nerves may lead to hypertonicity in the zygomatic and orbicularis oculi muscles. This condition can result in a decrease in ACh, subsequently reducing the movement of the lower eyelid, cheeks, and corners of the mouth. In contemporary society, prolonged use of visual display terminals and the rising prevalence of smartphones and tablets have contributed to an increase in symptoms such as eye strain [48]. Facial muscles are constantly active and have a low innervation ratio, meaning a single motor neuron controls a relatively small number of muscle fibers, allowing for nuanced expressions [49]. While awake, the levator palpebrae superioris muscle must contract involuntarily to raise the upper eyelid and maintain an open palpebral fissure. However, as eye strain accumulates, it becomes increasingly difficult for this muscle alone to lift the upper eyelid. Notably, the neural circuits regulating the Müller muscle and periodontal ligament lack inhibitory neurons that would suppress input from mechanoreceptors [50]. This absence can lead to further hypertonicity of sympathetic nerve activity, exacerbating eye strain. Moreover, it has been suggested that the central pattern generator (CPG) may play a role in the coordinated movement of facial muscles [51]. The activity of the CPG can be modulated by factors such as stress and fatigue. Under the influence of higher brain centers, the CPG adjusts movement patterns based on afferent input from peripheral sensory receptors [52], which may lead to reduced contraction force and speed of facial muscles.

4.3. Applications to Cosmetology and Medicine

In recent years, morphing technology—an image synthesis technique that creates images to bridge the gaps between different shapes and express gradual changes in a video—has advanced significantly [53]. By analyzing the gradient of movement distance over time (MS) observed in this study during smiling, it may be feasible to generate video images. This approach could serve as an experimental stimulus in research investigating the relationship between facial expression recognition and the dynamic emulation of expressions presented in facial images.
A survey conducted among Japanese women in their 30s to 50s identified three key factors contributing to perceived facial youthfulness: estimated age (based on facial appearance), liveliness, and cleanliness, with liveliness being particularly significant [54]. It has been noted that when assessing liveliness, people often focus on the eyes, with “eye power” emerging as a major determinant. Enhancing facial image processing to increase eye power has been shown to significantly improve perceptions of youthfulness [54]. Eye power encompasses sensory information and perception related to various facial features and is rated on a five-point scale based on eye width, gaze intensity, and iris clarity [54]. In contrast, the degree of eye-opening developed in this study is quantified by standardizing the vertical diameter of the cornea as the percentage of corneal coverage by the upper and lower eyelids in digital photographs. While both indices effectively capture variable characteristics of the eye region, the degree of eye-opening is deemed more advantageous due to its objective quantification. Consequently, the degree of eye-opening, along with facial parameters and ECG R-R interval variability spectrum analysis, is considered valuable for objectively expressing fatigue. Specifically, the degree of eye-opening is anticipated to facilitate straightforward measurements in daily life, as it can visually reflect subtle changes in facial expressions indicative of fatigue.

4.4. Limitations

This study assessed the degree of eye-opening in female nurses aged 30 to 50 years and found a significant decrease in the fatigue condition (after a night shift) compared to the control condition (after a day off). This finding suggests an increased prevalence of drooping upper eyelids and narrowing of the palpebral fissure in the fatigue condition. The eyelids are elevated by the levator palpebrae superioris and Müller’s muscle, which pull up the tarsal plate connected to the aponeurosis. As the aponeurosis sags with age, effective transmission of muscle force to the tarsal plate is hindered, making it challenging to lift the eyelids and potentially resulting in age-related ptosis. When evaluating facial expressions of fatigue using the degree of eye-opening, comparisons over time among participants are straightforward. However, as individuals age, the vertical range of the palpebral fissure narrows, and the degree of eye-opening diminishes. Therefore, it is crucial to compare results within the same age group or across a narrow age range in older individuals. A health and nutrition survey conducted in South Korea found that approximately one-fifth of individuals in their 60s experience age-related ptosis [55]; however, this condition is estimated to be less common among the 30 to 50-year-old participants in this study.
This study focused on female nurses. To determine the generalizability of these findings going forward, future research should include men and individuals in a variety of non-nursing professions, where mental and physical demands differ.
Furthermore, when implementing this method as a practical tool for monitoring workers’ fatigue in the future, there is a possibility that subjects may consciously open their eyes wider during the test, which could influence the results. To overcome this limitation, future research should consider introducing a method to detect conscious eye movements by performing electromyography on the facial area and monitoring these movements. Additionally, we should consider establishing a simplified evaluation method by measuring the eye-opening degree at maximum conscious effort, using that value as a reference, and normalizing the eye-opening degree during fatigue assessment accordingly. Applying this method will make it possible to determine whether the eyes are consciously opening wide based on differences in the eye-opening degree and its range of movement observed in daily and non-daily life.
In this study, fatigue was evaluated by comparing two conditions: resting state and fatigued state. However, fatigue assessment based on a single observation remains challenging. Recently, methods for directly identifying patterns specific to certain states from single datasets have been reported. For example, Morales et al. (2017) demonstrated that absolute indicators, such as the absolute power in specific frequency bands of single-channel EEG, can be used to continuously monitor changes in mental states ranging from alertness to fatigue [56]. Furthermore, Makhmudov et al. (2024) reported that deep learning models, such as convolutional neural networks (CNNs), can extract complex features related to fatigue from a single facial image and detect drowsiness with high accuracy [57]. Based on these findings, future research should aim to combine absolute indicators capable of evaluating fatigue in a single state with the methods used in this study to improve evaluation accuracy. Additionally, it is necessary to expand the number of participants for large-scale data collection, taking into account confounding factors such as age, and to apply machine learning analysis to establish a universal and highly reliable method for fatigue assessment in a single state.

5. Conclusions

In the present study, we compared subjective ratings of fatigue and objective parameters between the control (non-fatigue) and fatigue conditions and analyzed the relationships between the subjective ratings and objective parameters. The results indicated that subjective ratings were increased in the fatigue condition compared with the control condition and were significantly correlated to objective parameters. Based on these findings, measurements of eye-opening, facial parameters (MMD and MS during intentional smiling using motion capture), and autonomic nerve activity assessed through ECG R-R interval fluctuation spectrum analysis are considered effective methods for objectively evaluating facial expressions of fatigue. As illustrated in Figure 9, changes in these parameters are believed to be associated with decreases in parasympathetic nerve activity during fatigue and reductions in facial muscle activity due to excessive sympathetic nerve tension. In conclusion, the objective evaluation methods employed—specifically, the degree of eye-opening, facial parameters, and ECG R-R interval fluctuation spectrum analysis—are valuable indicators of fatigue. Notably, the degree of eye-opening is particularly easy to measure, making it a promising candidate for future applications in medicine and cosmetology.

Author Contributions

Conceptualization, Y.N., M.H. and K.K.; formal analysis, Y.N., K.T. and H.N.; investigation, Y.N., K.T. and E.H.; methodology, Y.N. and H.N.; writing—original draft, Y.N.; writing—review & editing, Y.N., K.T., M.H., E.H., K.K. and H.N.; supervision, K.K. and M.H.; project administration, Y.N. and H.N. All authors have read and agreed to the published version of the manuscript.

Funding

The study was financialy supported partly by Kao Corporation and University of Toyama. The funders had no role in study design, data collection and analysis, decision to publish, or preparation of the manuscript.

Institutional Review Board Statement

This study received approval from the Toyama University Clinical Research Ethics Committee (License number: Rin23-27).

Informed Consent Statement

Informed consent was obtained from all participants involved in the study.

Data Availability Statement

The data presented in this study are available on request from the corresponding author due to restrictions (e.g., privacy, legal or ethical reasons).

Acknowledgments

The authors thank the volunteers who participated in this study. Additionally, we are grateful to Sachiko Oh-ishi (Kitasato University) for her encouragement. We also express appreciation to Haruna Hiraga, a researcher at the Human Health Care Products Research, for her help in conducting this study.

Conflicts of Interest

Author YN, MH and KK were employed by Kao Corporation. The funders had no role in the design of the study; in the collection, analyses, or interpretation of data; in the writing of the manuscript; or in the decision to publish the results.

Abbreviations

The following abbreviations are used in this manuscript:
AChAcetylcholine
CPGCentral Pattern Generator
CFSChronic Fatigue Syndrome
ECGElectrocardiogram
EMGElectromyography
HFHigh Frequency (component of heart rate variability)
IBMInternational Business Machines
LFLow Frequency (component of heart rate variability)
LF/HFLow Frequency-to-High Frequency Ratio
MFMental Fatigue
MMDMaximum Movement Distance
MSMovement Speed
PFPhysical Fatigue
RMSRoot Mean Square
SDStandard Deviation
SEMStandard Error of the Mean
TFTotal Fatigue
VASVisual Analog Scale

References

  1. Suzuki, A.; Akamatsu, R. Sex differences in relationship between stress responses and lifestyle in Japanese workers. Saf. Health Work 2014, 5, 32–38. [Google Scholar] [CrossRef] [PubMed]
  2. Sasaki, N. Mental health of working mothers. Kosodate wo shinagara hataraku jyosei no sutoresu to mentaruherusu. Jpn. J. Occup. Ment. Health 2023, 31, 21–24. (In Japanese) [Google Scholar] [CrossRef]
  3. Rosendal, M.; Olesen, F.; Fink, P. Management of medically unexplained symptoms. BMJ 2005, 330, 4–5. [Google Scholar] [CrossRef] [PubMed]
  4. Gender Equality Bureau Cabinet Office. Available online: https://www.gender.go.jp/research/kenkyu/health_ishiki.html (accessed on 2 May 2024).
  5. Veldhuizen, I.J.; Gaillard, A.W.; de Vries, J. The influence of mental fatigue on facial EMG activity during a simulated workday. Biol. Psychol. 2003, 63, 59–78. [Google Scholar] [CrossRef]
  6. Iida, T.; Ito, Y.; Kanazashi, M.; Murayama, S.; Miyake, T.; Yoshimaru, Y.; Tatsumi, A.; Ezoe, S. Effects of psychological and physical stress on oxidative stress, serotonin, and fatigue in young females induced by objective structured clinical examination: Pilot study of u-8-OHdG, u-5HT, and s-HHV-6. Int. J. Tryptophan Res. 2021, 14, 11786469211048443. [Google Scholar] [CrossRef]
  7. Vercoulen, J.H.; Swanink, C.M.; Fennis, J.F.; Galama, J.M.; van der Meer, J.W.; Bleijenberg, G. Dimensional assessment of chronic fatigue syndrome. J. Psychosom. Res. 1994, 38, 383–392. [Google Scholar] [CrossRef]
  8. Schaufeli, W.B.; Leiter, M.P.; Maslach, C.; Jackson, S.E. Maslach Burnout Inventory—General survey. In Maslach Burnout Inventory Manual, 3rd ed.; Consulting Psychologists Press: Palo Alto, CA, USA, 1996; pp. 19–26. [Google Scholar]
  9. Smets, E.M.A.; Garssen, B.; Bonke, B.; De Haes, J.C.J.M. The multidimensional Fatigue Inventory (MFI) psychometric qualities of an instrument to assess fatigue. J. Psychosom. Res. 1995, 39, 315–325. [Google Scholar] [CrossRef]
  10. Chalder, T.; Berelowitz, G.; Pawlikowska, T.; Watts, L.; Wessely, S.; Wright, D.; Wallace, E.P. Development of a fatigue scale. J. Psychosom. Res. 1993, 37, 147–153. [Google Scholar] [CrossRef]
  11. Alberts, M.; Smets, E.M.A.; Vercoulen, J.H.M.M.; Garssen, B.; Bleijenberg, G. Verkorte vermoeidheidsvragenlijst: Een praktisch hulpmiddel bij het scoren van vermoeidheid [Abbreviated fatigue questionnaire’: A practical tool in the classification of fatigue]. Ned. Tijdschr. Geneeskd. 1997, 141, 1526–1530. (In German) [Google Scholar]
  12. Słomko, J.; Estévez-López, F.; Kujawski, S.; Zawadka-Kunikowska, M.; Tafil-Klawe, M.; Klawe, J.J.; Morten, K.J.; Szrajda, J.; Murovska, M.; Newton, J.L.; et al. Autonomic phenotypes in chronic fatigue syndrome (CFS) are associated with illness severity: A cluster analysis. J. Clin. Med. 2020, 9, 2531. [Google Scholar] [CrossRef]
  13. Jason, L.A.; McGarrigle, W.J.; Vermeulen, R.C.W. The head-up tilt table test as a measure of autonomic functioning among patients with myalgic encephalomyelitis/chronic fatigue syndrome. J. Pers. Med. 2024, 14, 238. [Google Scholar] [CrossRef] [PubMed]
  14. Nojima, J.; Motoki, Y.; Tsuneoka, H.; Kuratsune, H.; Matsui, T.; Yamamoto, M.; Yanagihara, M.; Hinoda, Y.; Ichihara, K. “Oxidation stress index” as a possible clinical marker for the evaluation of non-Hodgkin lymphoma. Br. J. Haematol. 2011, 155, 528–530. [Google Scholar] [CrossRef] [PubMed]
  15. Kondo, K.; Sashihara, J.; Shimada, K.; Takemoto, M.; Amo, K.; Miyagawa, H.; Yamanishi, K. Recognition of a novel stage of betaherpesvirus latency in human herpesvirus 6. J. Virol. 2003, 77, 2258–2264. [Google Scholar] [CrossRef]
  16. Van Boxtel, A.; Jessurun, M. Amplitude and bilateral coherency of facial and jaw-elevator EMG activity as an index of effort during a two-choice serial reaction task. Psychophysiology 1993, 30, 589–604. [Google Scholar] [CrossRef] [PubMed]
  17. Burton, C. Beyond somatisation: A review of the understanding and treatment of medically unexplained physical symptoms (MUPS). Br. J. Gen. Pract. 2003, 53, 231–239. [Google Scholar]
  18. Saito, T. Contested illness to solve the social issues in modern medicine: Beyond mind-body dualism. Mitome rare nu yamai to gendaiiryo no shakaiteki kadai: Shinshin ni genron wo koete. Clin. Eval. 2016, 44, 381–386. (In Japanese) [Google Scholar]
  19. Fujimura, T. The functional role of facial expressions in communication. Jpn. J. Physiol. Psychol. Psychophysiol. 2017, 35, 3–13. (In Japanese) [Google Scholar] [CrossRef]
  20. Sato, W.; Hyniewska, S.; Minemoto, K.; Yoshikawa, S. Facial expressions of basic emotions in Japanese laypeople. Front. Psychol. 2019, 10, 259. [Google Scholar] [CrossRef]
  21. Suzuki, A. Emotion elicitation using facial expression images: A perspective from research on facial expression recognition and person perception. Kao hyoujyou gazou ni yoru kanjyou kanki: Kao hyoujyou (taijin) ninchi kenkyuu kara no shiten. Jpn. J. Res. Emot. 2022, 29, 58–63. (In Japanese) [Google Scholar]
  22. Arai, S. Skin care products for skin darkness or dullness. Kusumi to kiso keshouhin. Jpn. J. Cosmetol. 1994, 18, 149–153. (In Japanese) [Google Scholar]
  23. Suzuki, M.; Nagashima, Y.; Yada, Y.; Morishima, S.; Yamada, H. Fatigue and an expression of women belong to the same generation. Dou sedai jyosei no hirou kan to hyoujyou no kankei. J. Facial. Stud. 2009, 9, 245. (In Japanese) [Google Scholar]
  24. Ohjimi, H. Mechanisms of facial aging. Youbou rouka no mekanizumu. J. Anti Aging Med. 2014, 10, 45–52. (In Japanese) [Google Scholar]
  25. Flament, F.; Pierre, J.; Delhommeau, K.; Adam, A.S. How a working day-induced- tiredness may alter some facial signs in differently-aged Caucasian women. Int. J. Cosmet. Sci. 2017, 39, 467–475. [Google Scholar] [CrossRef] [PubMed]
  26. Flament, F.; Qiu, H.; Abric, A.; Charbonneau, A. Assessing changes in some facial signs of fatigue in Chinese women, induced by a single working day. Int. J. Cosmet. Sci. 2019, 41, 21–27. [Google Scholar] [CrossRef]
  27. Kuratsune, H.; Watanabe, Y. Heidelberg chronic fatigue syndrome. In Fatigue Science for Human Health; Watanabe, Y., Evengård, B., Natelson, B.H., Jason, L.A., Kuratsune, H., Eds.; Springer: Berlin/Heidelberg, Germany, 2008; pp. 67–88. [Google Scholar]
  28. Kuratsune, H.; Kuratsune, K. Industrial fatigue screening. In The Latest Science of Fatigue-from Japan: Proposals for Anti-Fatigue and Anti-Overwork. Sangyou Hirou Tokutei Kenshin; Watanabe, Y., Ed.; Ishiyaku Publishers: Tokyo, Japan, 2010; pp. 148–153. (In Japanese) [Google Scholar]
  29. Bron, A.J.; Tripathi, R.C.; Tripathi, B.J. The eyeball and its dimensions. In Wolff’s Anatomy of the Eye and Orbit; Chapman & Hall Medical: London, UK, 1997; pp. 211–232. [Google Scholar]
  30. Dawson, D.G.; Ubels, J.L.; Edelhauser, H.F. Cornea and sclera. In Adler’s Physiology of the Eye; Levin, L.A., Nilsson, S.F.E., Ver Hoeve, J.J., Wu, S., Eds.; Elsevier: Amsterdam, The Netherlands; Saunders: Philadelphia, PA, USA, 2011; pp. 71–130. [Google Scholar]
  31. Takagi, S.; Ohjimi, H.; Tan, J.; Eto, A. Factors that influence the postoperative upper eyelid position following surgery for involutional blepharoptosis. J. Plast. Reconstr. Aesthet. Surg. 2022, 75, 278–285. [Google Scholar] [CrossRef]
  32. Miyashita, W.; Nakahara, R. Three-dimensional average faces in Japanese with normal occlusion-evaluation of construction method and reproducibility. Nihonjin seijyou kougousha no sanjigenteki heikingao Sakusei houhou oyobi saigensei no kenshou. Orthod. Waves. 2005, 64, 36–43. (In Japanese) [Google Scholar]
  33. Akselrod, S.; Gordon, D.; Ubel, F.A.; Shannon, D.C.; Berger, A.C.; Cohen, R.J. Power spectrum analysis of heart rate fluctuation: A quantitative probe of beat-to-beat cardiovascular control. Science 1981, 213, 220–222. [Google Scholar] [CrossRef]
  34. Pagani, M.; Lombardi, F.; Guzzetti, S.; Rimoldi, O.; Furlan, R.; Pizzinelli, P.; Sandrone, G.; Malfatto, G.; Dell’Orto, S.; Piccaluga, E. Power spectral analysis of heart rate and arterial pressure variabilities as a marker of sympatho-vagal interaction in man and conscious dog. Circ. Res. 1986, 59, 178–193. [Google Scholar] [CrossRef]
  35. Berger, R.D.; Saul, J.P.; Cohen, R.J. Transfer function analysis of autonomic regulation. I. Canine atrial rate response. Am. J. Physiol. 1989, 256, H142–H152. [Google Scholar] [CrossRef]
  36. Saul, J.P.; Berger, R.D.; Albrecht, P.; Stein, S.P.; Chen, M.H.; Cohen, R.J. Transfer function analysis of the circulation: Unique insights into cardiovascular regulation. Am. J. Physiol. 1991, 261, H1231–H1245. [Google Scholar] [CrossRef]
  37. Freeman, K.; Smyth, C.; Dallam, L.; Jackson, B. Pain measurement scales: A comparison of the visual analogue and faces rating scales in measuring pressure ulcer pain. J. Wound Ostomy Cont. Nurs. 2001, 28, 290–296. [Google Scholar] [CrossRef]
  38. Kikuchi, Y.; Ishii, N. The relationship between self-awareness of fatigue symptoms and working conditions in female nurses. Jyosei kangoshi no hirou no jikaku shoujyou to kinmu no kankei. Sangyo Eiseigaku Zasshi 2015, 57, 230–240. (In Japanese) [Google Scholar] [CrossRef] [PubMed]
  39. Ministry of Health, Labour and Welfare Science Research Results Database. Available online: https://mhlw-grants.niph.go.jp/project/19790 (accessed on 30 August 2024).
  40. Takamoto, K.; Hori, E.; Urakawa, S.; Katayama, M.; Nagashima, Y.; Yada, Y.; Ono, T.; Nishijo, H. Thermotherapy to the facial region in and around the eyelids altered prefrontal hemodynamic responses and autonomic nervous activity during mental arithmetic. Psychophysiology 2013, 50, 35–47. [Google Scholar] [CrossRef] [PubMed]
  41. Wyller, V.B.; Saul, J.P.; Amlie, J.P.; Thaulow, E. Sympathetic predominance of cardiovascular regulation during mild orthostatic stress in adolescents with chronic fatigue. Clin. Physiol. Funct. Imaging 2007, 27, 231–238. [Google Scholar] [CrossRef] [PubMed]
  42. Burton, A.R.; Rahman, K.; Kadota, Y.; Lloyd, A.; Vollmer-Conna, U. Reduced heart rate variability predicts poor sleep quality in a case–control study of chronic fatigue syndrome. Exp. Brain Res. 2010, 204, 71–78. [Google Scholar] [CrossRef]
  43. Tanaka, M.; Mizuno, K.; Yamaguti, K.; Kuratsune, H.; Fujii, A.; Baba, H.; Matsuda, K.; Nishimae, A.; Takesaka, T.; Watanabe, Y. Autonomic nervous alterations associated with daily level of fatigue. Behav. Brain Funct. 2011, 7, 46. [Google Scholar] [CrossRef]
  44. Yasui, H.; Takamoto, K.; Hori, E.; Urakawa, S.; Nagashima, Y.; Yada, Y.; Ono, T.; Nishijo, H. Significant correlation between autonomic nervous activity and cerebral hemodynamics during thermotherapy on the neck. Auton. Neurosci. 2010, 156, 96–103. [Google Scholar] [CrossRef]
  45. Passatore, M.; Grassi, C.; Filippi, G.M. Sympathetically-induced development of tension in jaw muscles: The possible contraction of intrafusal muscle fibres. Pflugers Arch. 1985, 405, 297–304. [Google Scholar] [CrossRef]
  46. Yuzuriha, S.; Matsuo, K.; Hirasawa, C.; Moriizumi, T. Refined distribution of myelinated trigeminal proprioceptive nerve fibres in Mueller’s muscle as the mechanoreceptors to induce involuntary reflexive contraction of the levator and frontalis muscles. J. Plast. Reconstr. Aesthet. Surg. 2009, 62, 1403–1410. [Google Scholar] [CrossRef]
  47. Matsuo, K. Stretching of the Mueller muscle results in involuntary contraction of the levator muscle. Ophthalmic Plast. Reconstr. Surg. 2002, 18, 5–10. [Google Scholar] [CrossRef]
  48. Ministry of Health, Labor and Welfare. Available online: https://www.mhlw.go.jp/toukei/itiran/roudou/saigai/anzen/08/02.html#6 (accessed on 14 September 2024).
  49. Bear, M.F.; Connors, B.W.; Paradiso, M.A. Neuroscience: Exploring the Brain; Jones & Bartlett Publishers Learning: Burlington, MA, USA, 2016; pp. 453–482. [Google Scholar]
  50. Lund, J.P.; Lamarre, Y.; Lavigne, G.; Duquet, G. Human jaw reflexes. Adv. Neurol. 1983, 39, 739–755. [Google Scholar]
  51. Shepherd, S.V.; Lanzilotto, M.; Ghazanfar, A.A. Facial muscle coordination in monkeys during rhythmic facial expressions and ingestive movements. J. Neurosci. 2012, 32, 6105–6116. [Google Scholar] [CrossRef]
  52. Grillner, S. Biological pattern generation: The cellular and computational logic of networks in motion. Neuron 2006, 52, 751–766. [Google Scholar] [CrossRef]
  53. Cosker, D.; Krumhuber, E.; Hilton, A.; Facs, A. Valid 3D dynamic action unit database with applications to 3D dynamic morphable facial modeling. In Proceedings of the 13th IEEE International Conference on Computer Vision (ICCV), Barcelona, Spain, 6–13 November 2011; Metaxas, S., Quan, L., Sanfeliu, A., van Gool, L., Eds.; IEEE Publications: Barcelona, Spain, 2011; pp. 2296–2303. [Google Scholar] [CrossRef]
  54. Taira, A.; Igarashi, T.; Gyoba, J. Cognitive structure of youthful facial impression in young women—Understanding youthfulness in women in their 30s through comparison with women in their 50s. Jakunen josei ni okeru wakawakashii kao no inshou ninchi kouzou—50 dai josei to no hikaku wo tooshita 30 dai josei ni okeru wakawakashisa no rikai. Trans. Jpn. Soc. Kansei Eng. 2022, 21, 425–430. (In Japanese) [Google Scholar] [CrossRef]
  55. Kim, M.H.; Cho, J.; Zhao, D.; I Woo, K.; Kim, Y.-D.; Kim, S.; Yang, S.W. Prevalence and associated factors of blepharoptosis in Korean adult population: The Korea National Health and Nutrition Examination survey 2008-2011. Eye 2017, 31, 940–946. [Google Scholar] [CrossRef]
  56. Morales, J.M.; Díaz-Piedra, C.; Rieiro, H.; Roca-González, J.; Romero, S.; Catena, A.; Fuentes, L.J.; Di Stasi, L.L. Monitoring driver fatigue using a single-channel electroencephalographic device: A validation study by gaze-based, driving performance, and subjective data. Accid. Anal. Prev. 2017, 109, 62–69. [Google Scholar] [CrossRef]
  57. Makhmudov, F.; Turimov, D.; Xamidov, M.; Nazarov, F.; Cho, Y.I. Real-Time Fatigue Detection Algorithms Using Machine Learning for Yawning and Eye State. Sensors 2024, 24, 7810. [Google Scholar] [CrossRef]
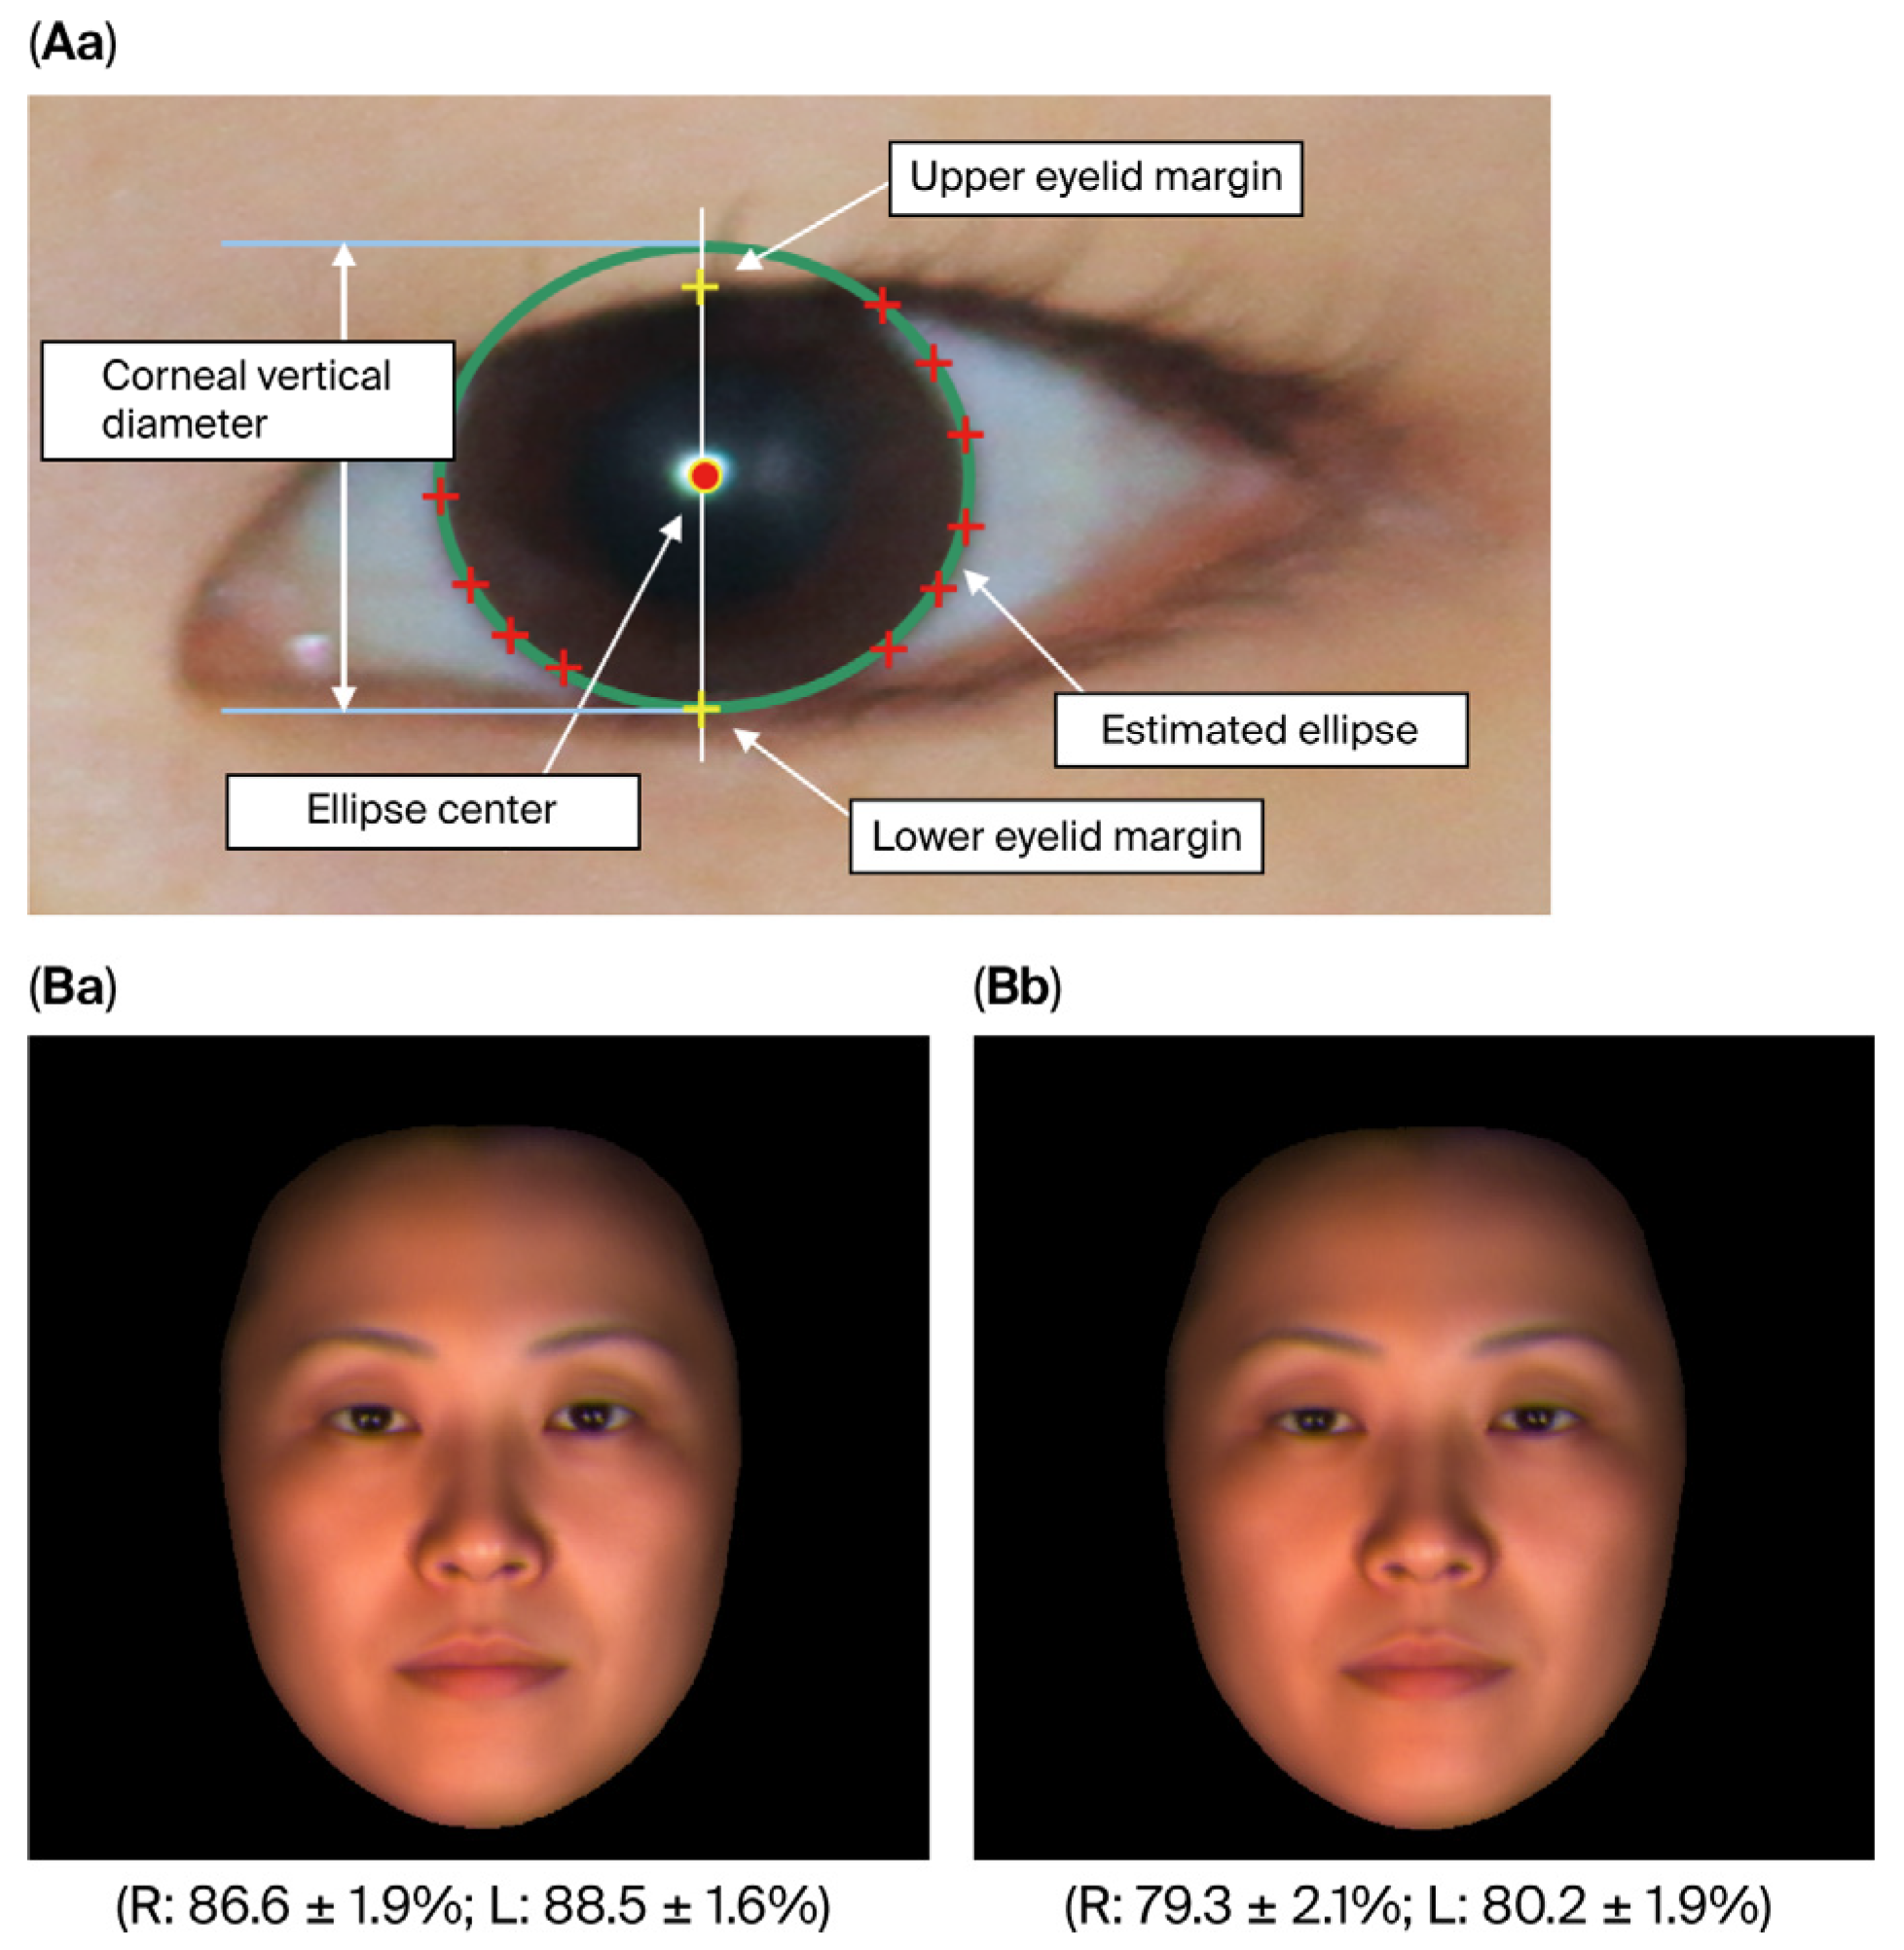
Figure 1. Method for calculating the degree of eye-opening and example comparison. (Aa): The degree of eye-opening was calculated as follows: ten arbitrary points were designated along the edge of the cornea. Based on known data for Japanese individuals (corneal horizontal diameter/corneal vertical diameter = 11.5/10.5) and using a curve fitting method, the corneal center, horizontal diameter, and vertical diameter were estimated from these points. A coordinate system was then established with the corneal center as the origin. In this system, the Y coordinates of the upper eyelid margin and corneal submargin were recorded, and the degree of eye-opening was calculated using the following formula: degree of eye-opening (%) = (upper eyelid margin Y coordinate—corneal submargin Y coordinate)/corneal vertical diameter × 100. (B): Comparative example of eye-opening degree (average face of all participants). We measured the degree of eye-opening (%) (mean ± SEM) from facial images of 25 female nurses taken (Ba) after a day off and (Bb) after a night shift. R, right eye; L, left eye.
Physiologia 05 00042 g001
Figure 2. Outline of the motion capture method. (A): To facilitate measurement, a face wireframe was applied to a neutral facial image, with markers (green circles) positioned based on representative grid points, totaling 25 points on each side of the face. While individual facial images were used in actual measurements, this diagram illustrates the markers on an averaged face for the 25 participants. (B): The face wireframe has been removed from the marker placement diagram in (A). (C): Still image of an intentional smiling expression, which was shown to the participants. The image was purchased from ATR-Promotions (the rights holder of the image). Copyright: ATR-Promotions, republished with permission.
Physiologia 05 00042 g002
Figure 3. Example analyses using the motion capture method.
Physiologia 05 00042 g003
Figure 4. Subjective assessment of fatigue using the self-diagnosis fatigue checklist (A) and VAS (B) in the control and fatigue conditions. (A): A self-diagnosis checklist was used to evaluate fatigue, with total scores of the ten physical and ten mental/psychological symptoms (listed in Table 1) rated on a five-point scale. (B): Evaluation points for each item on the self-diagnosis fatigue checklist. The ten physical symptoms and ten mental/psychological symptoms were evaluated on a five-point scale. (C): VAS assessment of fatigue expression of own faces and overall fatigue. In the data representation, red columns correspond to the control condition (post-day off), and blue columns represent the fatigue condition (post-night shift). Data are presented as the mean ± SEM across 25 subjects. * (p < 0.05), ** (p < 0.01), and *** (p < 0.001) indicate statistically significant differences from the control as determined by Wilcoxon Signed-Rank Test. ** (p < 0.01) indicates a statistically significant difference from the control as determined by a paired t-test.
Physiologia 05 00042 g004
Figure 5. Effects of fatigue state on eye-opening (A) and relationships between subjective (VAS) assessment of fatigue and degree of eye-opening (B). (A): Comparison of the degree of eye-opening based on fatigue state. Photographs of the entire face were taken after a day off (Control) and following a night shift (Fatigue) to calculate the degree of eye-opening. Data represent the mean values of 25 participants ± SEM, with blue columns indicating the right eye and green columns indicating the left eye. Statistically significant differences from the control condition are marked with ***, indicating p < 0.001 (main effect of fatigue state). (B): The relationships between changes in subjective (VAS) assessment of fatigue [changes in VAS assessment of facial expression of fatigue (red circles) and changes in VAS assessment of overall fatigue (blue circles)] and changes in the degree of eye-opening are illustrated. Changes in facial expression of fatigue VAS value (ΔVAS) are calculated by subtracting the facial expression of fatigue VAS value obtained after the day off from the value obtained after the night shift. The change in overall fatigue VAS value (ΔVAS) is obtained by subtracting the overall fatigue VAS value after the day off from the value after the night shift. Changes in the degree of eye-opening (Δ%) are derived by subtracting the degree of eye-opening after the day off from the degree after the night shift. The regression line for the fatigue expression VAS value is y = −2.94x − 8.42, with a coefficient of determination R2 = 0.714. For the overall fatigue VAS value, the regression line is y = −2.64x − 9.07, with a coefficient of determination R2 = 0.59.
Physiologia 05 00042 g005
Figure 6. Effect of fatigue states on maximum movement distance and movement speed of each facial part during intentional smiling. (A): Comparison of maximum movement distances of the markers (feature points) on the left side of the face (Aa) and the right side of the face (Ab) when intentionally smiling, depending on the level of fatigue. (B): Comparison of marker movement speed based on fatigue state. (Ba) Movement speed of markers on the left side of the face and (Bb) movement speed of markers on the right side of the face during intentional smiling, reflecting variations due to fatigue levels. Data are presented as mean ± SEM from 25 cases. Red columns represent the control condition (after a day off), while blue columns indicate the fatigue condition (after a night shift). Asterisks (*) and double asterisks (**) signify statistically significant differences compared to the control condition at p < 0.05 and p < 0.01, respectively, as determined by a multiple comparison test using the Bonferroni method. Data for points that did not show a significant difference are not shown here.
Physiologia 05 00042 g006
Figure 7. Relationship between subjective assessment of facial expression of fatigue and maximum movement distance and movement speed of each part of the face when intentionally smiling. (A): Relationship between changes in subjective assessment of facial expression of fatigue [changes in facial expression of fatigue VAS value (ΔVAS)] and relative MMD (%) of markers (feature points) on each part of the face when smiling. (B): Relationship between changes in subjective assessment of facial expression of fatigue [change in facial expression of fatigue VAS value (ΔVAS)] and relative MS (%) of markers (feature points) on various parts of the face when smiling. Change in facial expression of fatigue VAS value (ΔVAS): Facial expression of fatigue VAS value after a night shift minus facial expression of fatigue VAS value after a day off; relative MMD (%): ratio of MMD after a night shift if MMD after a day off is taken as 100%; relative MS (%): ratio of MS after a night shift if MS after a day off is taken as 100%. * and ** indicate a statistically significant correlation at p < 0.05 and p < 0.01.
Physiologia 05 00042 g007
Figure 8. Effect of fatigue states on ECG R-R interval variability spectrum. (A,B): Effect of fatigue states on HF norm (normalized high-frequency component of heart rate variability) (A) and LF/HF (ratio of the low and high-frequency components of the power spectrum of the HR variability) (B). Red columns, control condition (after a day off); Blue columns, fatigue condition (after a night shift). (C): Relationship between changes in subjective (VAS) assessment of fatigue [overall fatigue (blue circles) and facial expression of fatigue (red circles)] and relative HF. Overall fatigue VAS value (ΔVAS), the overall fatigue VAS value after a night shift minus the overall fatigue VAS value after a day off; relative HF (%), {(HF norm after a night shift) × 100}/(HF norm after a day off); facial expression of fatigue VAS value (ΔVAS), the facial expression of fatigue VAS value after a night shift minus the facial expression of fatigue VAS value after a day off. (D): Relationship between changes in subjective (VAS) assessment of fatigue [overall fatigue (blue circles) and facial expression of fatigue (red circles)] and relative LF/HF. Relative LF/HF (%), {(LF/HF after night shift) × 100}/(LF/HF after day off). Data are given as mean ± SEM (n = 15). * and ** indicate statistically significant difference at p < 0.05 and p < 0.01 by paired t-test compared to control.
Physiologia 05 00042 g008
Figure 9. Mechanism of facial expression of fatigue (hypothesis).
Physiologia 05 00042 g009
Table 1. Subjective assessment of fatigue using the self-diagnosis fatigue checklist.
ItemsPhysical SymptomsItemsMental/Psychological Symptoms
1Slight fever11Decline in cognitive ability
2Feeling tired or sluggish12Difficulty sleeping
3Experiencing significant fatigue even with minimal exercise or work13Feelings of depression
4Muscle pain14Concern about physical health
5Recent loss of bodily strength15Lack of motivation to work
6Swollen lymph nodes16Trouble remembering minor details
7Headache or a heavy feeling in the head17Occasional dizziness from bright light
8Fatigue that persists despite a night’ sleep18Periods of feeling dazed
9Sore throat19Reduced concentration
10Joint pain20Persistent oversleeping
Disclaimer/Publisher’s Note: The statements, opinions and data contained in all publications are solely those of the individual author(s) and contributor(s) and not of MDPI and/or the editor(s). MDPI and/or the editor(s) disclaim responsibility for any injury to people or property resulting from any ideas, methods, instructions or products referred to in the content.