Article

Exercise-Induced Acute Physiological Responses of Velocity, Power, and Temperature in Paralympic and Conventional Powerlifting Athletes

by
Rafael Luiz Mesquita Souza
1,2,
Felipe J. Aidar
1,2,3,4,
Leonardo dos Santos
1,2,
Jymmys Lopes dos Santos
1,
Lúcio Marques Vieira Souza
5,
Andre Luiz Gomes Carneiro
6,
Paulo Francisco de Almeida-Neto
7,
Breno Guilherme de Araújo Tinoco Cabral
7,
Anderson Carlos Marçal
1 and
Pantelis T. Nikolaidis
8,*
1
Graduate Program of Movement Science, Federal University of Sergipe (UFS), São Cristovão 49100-000, Brazil
2
Group of Studies and Research of Performance, Sport, Health and Paralympic Sports (GEPEPS), Federal University of Sergipe (UFS), São Cristovão 49100-000, Brazil
3
Department of Physical Education, Federal University of Sergipe (UFS), São Cristovão 49100-000, Brazil
4
Graduate Program of Physiological Science, Federal University of Sergipe (UFS), São Cristovão 49100-000, Brazil
5
Physical Education Course, State University of Minas Gerais-UEMG, Passos 37900-001, Brazil
6
Department of Physical Education, State University of Montes Claros (UNIMONTES), Montes Claros 39401-089, Brazil
7
Department of Physical Education, Federal University of Rio Grande do Norte (UFRN), Natal 59078-970, Brazil
8
School of Health and Caring Sciences, University of West Attica, 12243 Athens, Greece
*
Author to whom correspondence should be addressed.
Physiologia 2025, 5(3), 23; https://doi.org/10.3390/physiologia5030023
Submission received: 6 May 2025 / Revised: 28 June 2025 / Accepted: 3 July 2025 / Published: 9 July 2025
(This article belongs to the Special Issue Exercise Physiology and Biochemistry: 2nd Edition)

Abstract

Background/Objectives: In powerlifting, velocity indicators and skin temperature have been utilized to control training loads for both conventional athletes and athletes with disabilities. Therefore, the present study evaluated maximum velocity (Vmax), mean propulsive velocity (MPV), power (POWER) output, and skin temperature (ST) following a 5 × 5 training session at 80% of one-repetition maximum (1RM) in conventional powerlifters (CP) and paralympic powerlifters (PP). Methods: A total of 24 male athletes (12 CP and 12 PP) underwent a 5 × 5 training session at 80% 1RM. Post-session, velocity indicators, power output, and ST were assessed at 45% 1RM. Results: Only the CP group exhibited significant differences in Vmax (p < 0.015), MPV (p < 0.007), and power output (p < 0.022) between time points. Regarding ST, only the PP group showed differences (p < 0.004) in the sternal portion of the pectoral major. For the long head of the triceps brachii, differences were observed between groups in the post-session measurement (p > 0.024) and for the PP group only in the post-session measurement (p < 0.002). Conclusion: This study demonstrated that in following a traditional training session (80% 1RM), assessments at 45% 1RM revealed different effects in velocity, power output, and ST measures between CP and PP groups. These findings suggest that within the same sport discipline, training variables may have distinct impacts across different categories of athletes, and further research is needed to evaluate these different responses.

1. Introduction

Conventional powerlifting (CP) and Paralympic powerlifting (PP) are modalities where athletes aim to lift the heaviest possible loads. In PP, only the bench press (BP) event is performed due to lower limb impairments [1,2]. In powerlifting in general, 5 × 5 training is a consolidated methodology for developing muscular strength, based on five sets of five repetitions, and its effectiveness lies in progressive overload, based on the manipulation of variables, including low volume and high intensity [3]. Training variables are controlled using various assessment methods, including velocity analysis [4]. Velocity-based training (VBT) control has shown superior results compared to percentage-based 1RM methods, being less injurious, more individualized, and time efficient [5]. The real-time analysis, conducted by an encoder attached to the PA bar, examines the relative percentage of repetition maximum (%RM) while monitoring velocity indicators, thereby regulating exercise intensity [6].
Mean propulsive velocity (MPV) is a reliable indicator for controlling velocity and neuromuscular fatigue, thus managing force, velocity, and power loss [7]. Comparisons between PP and CP athletes revealed MPV differences in assessments, with PP athletes achieving lower velocities in 45% of 1RM tests and CP athletes attaining higher velocities in 80% of 1RM tests [8]. Research indicates that MPVs can accurately detect optimal power loads for each exercise [9,10]. Another study, aiming to define the optimal combination of relative velocity and load during BP for maximum mechanical power out, showed that 75% of maximum velocity was the optimal load for achieving peak power [10,11]. High-load training (≥80% 1RM) in both PP and CP requires proper control to avoid negative impacts, such as excessive fatigue, hormonal imbalances, and excessive increase in skin temperature [12,13].
Skin temperature (ST) is used for injury control and prevention, with thermal differences >0.7°C between muscle sides potentially indicating abnormalities [14]. Thermal responses vary by recovery periods, training, joints involved, and muscle mass engaged, and differences exceeding > 1.6°C are risky, prompting training interruption [15,16]. A study comparing two types of training in PP athletes, increases in temperature for the sternal pectoral (PE) and long head of the triceps brachii (TBCL), were observed above 0.7°, indicating increases within normal standards [15]. Interestingly, for CP, there are still no studies investigating the impact of ST, making it difficult to make extrapolations or comparisons with PP [17]. Associated with this, some studies observed that PP athletes would be stronger than CP athletes [18]. It was also observed that PP athletes would present different responses in some indicators of strength, velocity, and symmetry, to training concerning CP athletes [8,18]. Regarding strength, male PP athletes lifted heavier loads than CP athletes in six of the eight categories [18]. On the other hand, it was observed that PP athletes presented smaller asymmetries than CP athletes [8]. However, to date, this has not been well explained and this fact could be due to the fact that PP athletes use wheelchairs and crutches for movement, which would be a justification for these findings.
In this sense, only two studies Mesquita Souza et al [8] and Van Den Hoek et al [18] sought to compare and understand the different responses to training between PP and CP, and neither of them analyzed velocity and temperature indicators together. Thus, the results of both studies demonstrate differences in strength, asymmetry, and VPM indicators, indicating that there is a need for a better understanding of training methods and their physiological repercussions. In view of the above, the present study aims to evaluate and compare velocity measurements (VPM and Vmax), power and local temperature of the long head of the triceps brachii (TB), and the sternal portion of the pectoralis major (PM) between CP and PP athletes at an intensity of 45% of 1RM after a conventional training session in BP.

2. Materials and Methods
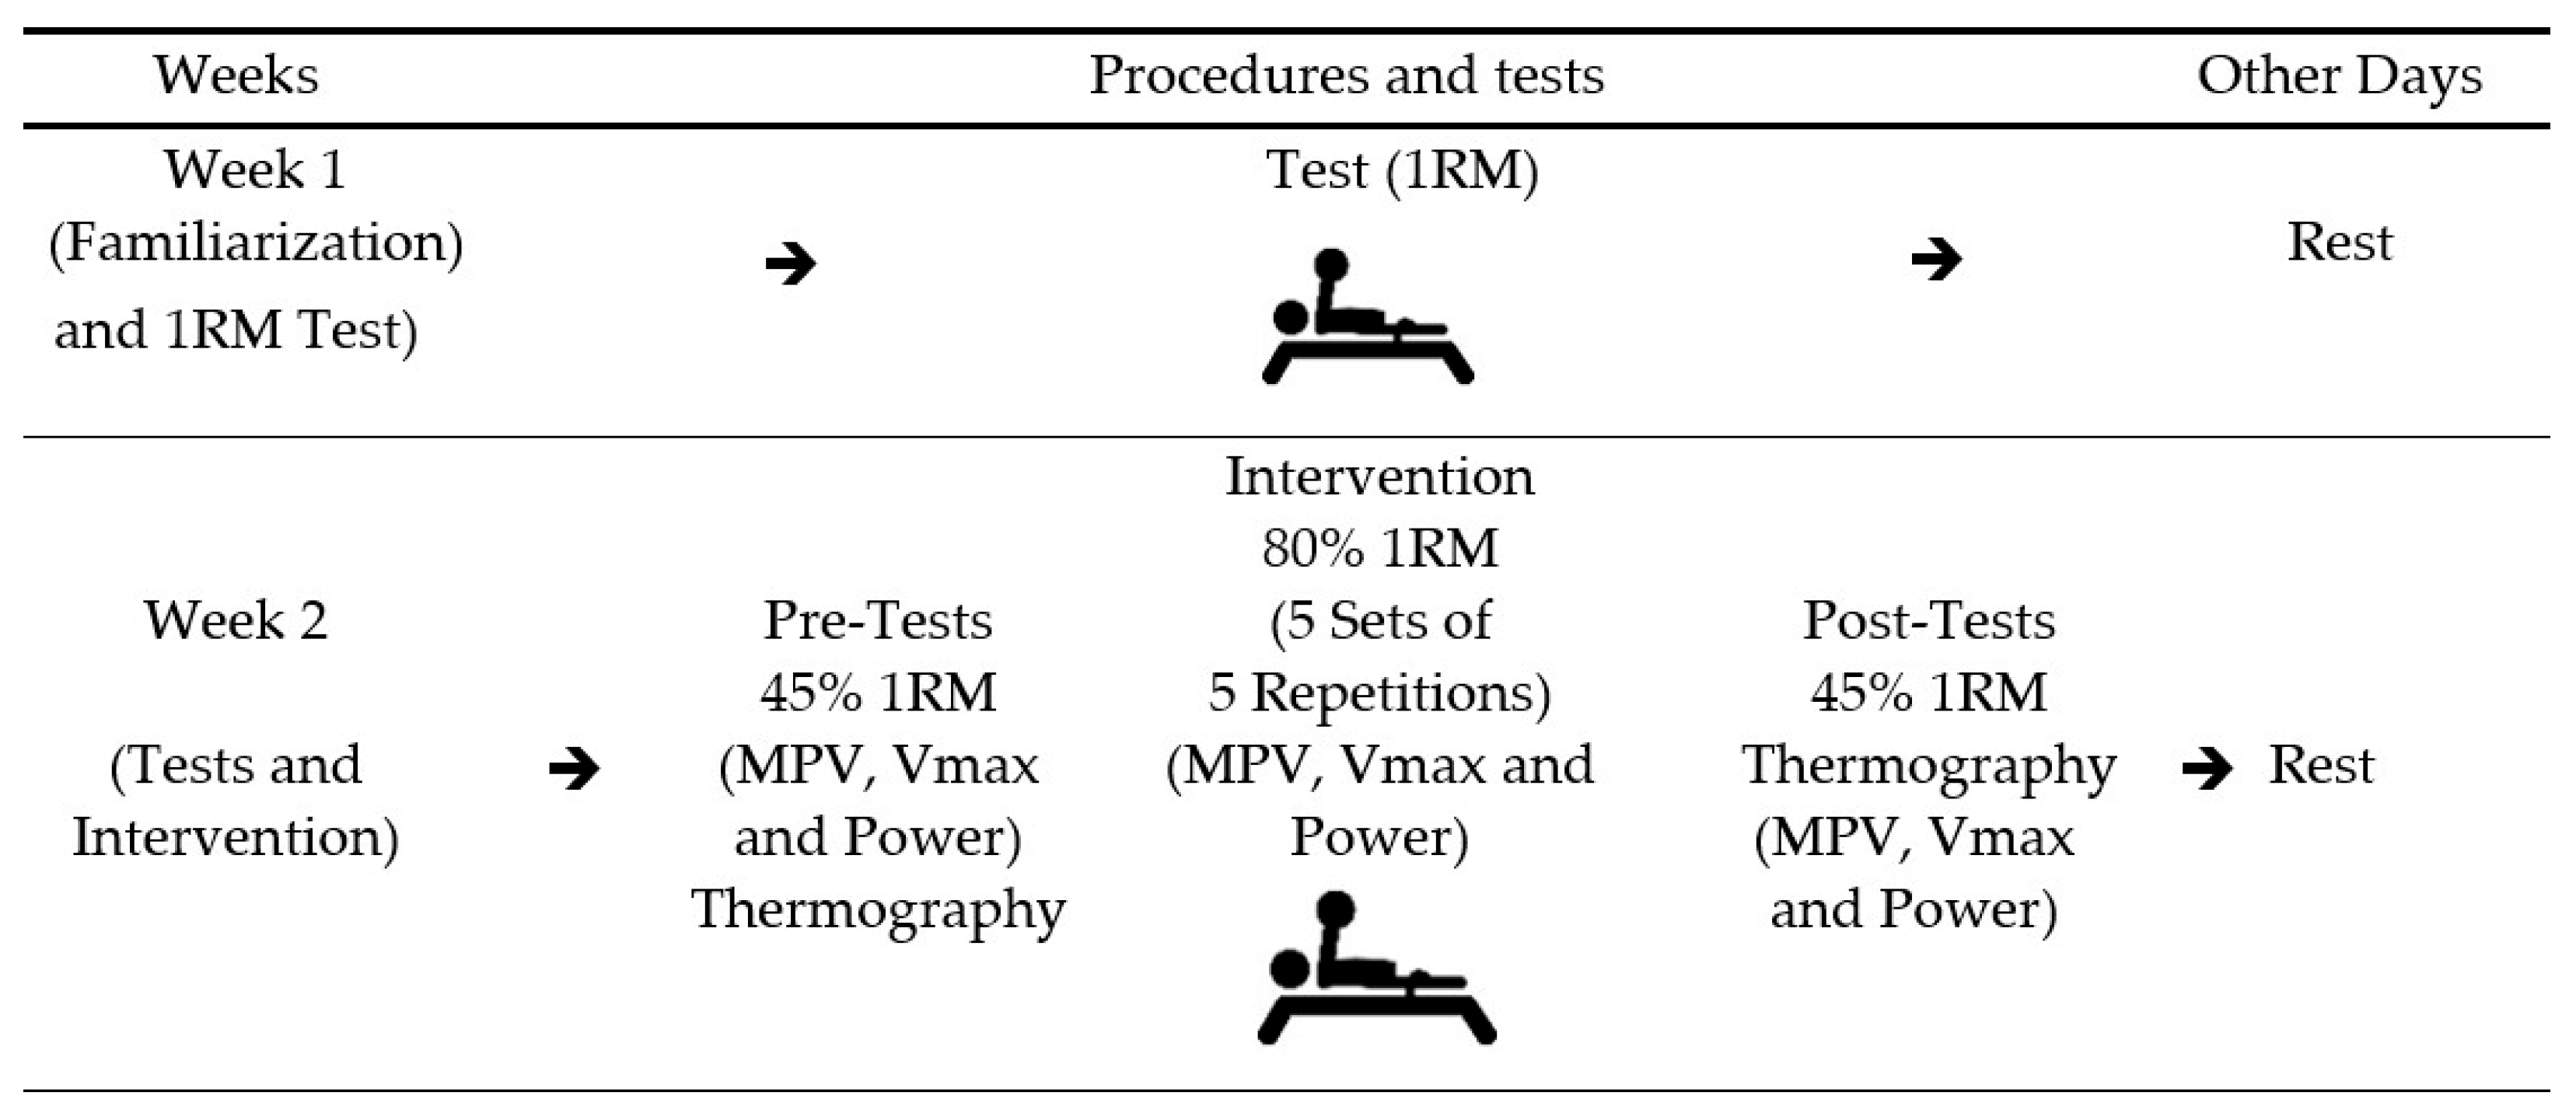
2.1. Study Design

The research was conducted over two weeks. During the first week, participants familiarized themselves with the equipment and protocols, and performed a one-repetition maximum (1RM) test in the bench press (BP). In the second week, participants executed four repetitions at 45% of 1RM, followed by five sets of five repetitions (5 × 5) at 80% of 1RM, and a second set at 45% of 1RM. The second set with 45% 1RM was performed after the 5 × 5 intervention at 80% 1RM. It should be noted that 45% of 1RM has been performed as a way of seeing the fatigue gradient, since it presents an approximate velocity of 1.0 m/s [4]. Throughout the study, a minimum interval of 72 h was maintained between assessments, whether for familiarization or testing purposes. Muscular activity was evaluated using surface electromyography (sEMG). Surface electrodes were applied during the first and last sets of the 5 × 5 protocol to record the electromyographic activity of the pectoral major (PM) and the long head of the triceps brachii (TB) muscles (Figure 1). The training was a 5 × 5 system, where five repetitions were used [3], with a minimum 3 min rest between training series.
Tests were conducted on Mondays between 8:00 AM and 12:00 PM. Participants were instructed to maintain their regular dietary habits, abstain from consuming alcoholic beverages, and avoid physical activities in the 48 h preceding the tests and intervention. These guidelines were confirmed through interviews with the participants before testing. Environmental thermal control was monitored, with ambient temperature maintained between 22 °C and 24 °C.

2.2. Sample

The study population consisted of 24 male subjects (12 CP and 12 PP) aged between 18 and 35 years. The CP group had an average of one year of training experience, while the PP group had an average of two years (Table 1). The PP athletes were associated with an extension project from the Department of Physical Education at the Federal University of Sergipe, Brazil. All athletes competed at the national level, were qualified for competition in their modality [2,19], and ranked among the top ten in their respective categories. Regarding disabilities, six athletes had lower limb malformations (arthrogryposis); one had polio sequelae; four were amputees; and one had a spinal cord injury due to an accident, with an injury below the eighth thoracic vertebra. The sample size was determined using the open-source software G*Power® (version 3.0; Berlin, Germany), adopting an “F family statistic (ANOVA)” with a standard α < 0.05, β = 0.80, and an observed effect size of 1.33 for the rate of force development (RFD) in weightlifting athletes [20]. This allowed for an estimated sample power of 0.80, with a minimum of eight individuals per group, suggesting that the sample is adequate. The project was submitted to and approved by the Research Ethics Committee of the Federal University of Sergipe, in accordance with the ethical principles expressed in the Declaration of Helsinki (1964, revised in 1975, 1983, 1989, 1996, 2000, 2008, and 2013) of the World Medical Association.
The inclusion criteria used were having at least 18 months of experience in the sport and effectively participating in competitions in the sport. Additionally, Paralympic athletes had to be classified and eligible for the Paralympic sport [2]. Exclusion criterion was the use of any type of illicit resource during the tests or in any stage of the study. It is important to mention that both CP and PP athletes presented values that place them at a similar level to high-performance athletes, where the weight lifted divided by body weight presented values greater than 1.4. PP athletes compete at a national level and participated in international competitions. CP athletes are recreational athletes and normally compete at a regional and national level.

2.3. Instruments/Procedures

Body weight measurements for athletes were conducted using a Michetti electronic platform scale (São Paulo, Brazil), which is designed to accommodate seated athletes. This scale has a maximum capacity of 300 kg and dimensions of 1.50 m × 1.50 m. For non-athlete males, a high-precision Dellamed scale was employed. The bench press exercise was performed on an official flat bench measuring 210 cm, with a 220 cm bar and weight plates, all manufactured by Eleiko (Halmstad, Sweden) and approved by the International Paralympic Committee. This equipment selection ensures standardization and compliance with international competition standards, which is particularly important for the Paralympic athletes involved in the study [2].

2.3.1. Maximum Load Test (1RM)

A one-repetition maximum (1RM) assessment was carried out to determine the training load for both athlete groups. This evaluation took place during the first week. Initially, each subject chose a weight that they anticipated could be lifted successfully, and additional increments were added until their maximal lifting capacity was reached. In cases where an athlete failed to complete the lift, the load was decreased by approximately 2.4% to 2.5%. A recovery period of 3 to 5 min was provided between trials. Notably, this 1RM test was performed 72 h prior to the commencement of the training sessions.

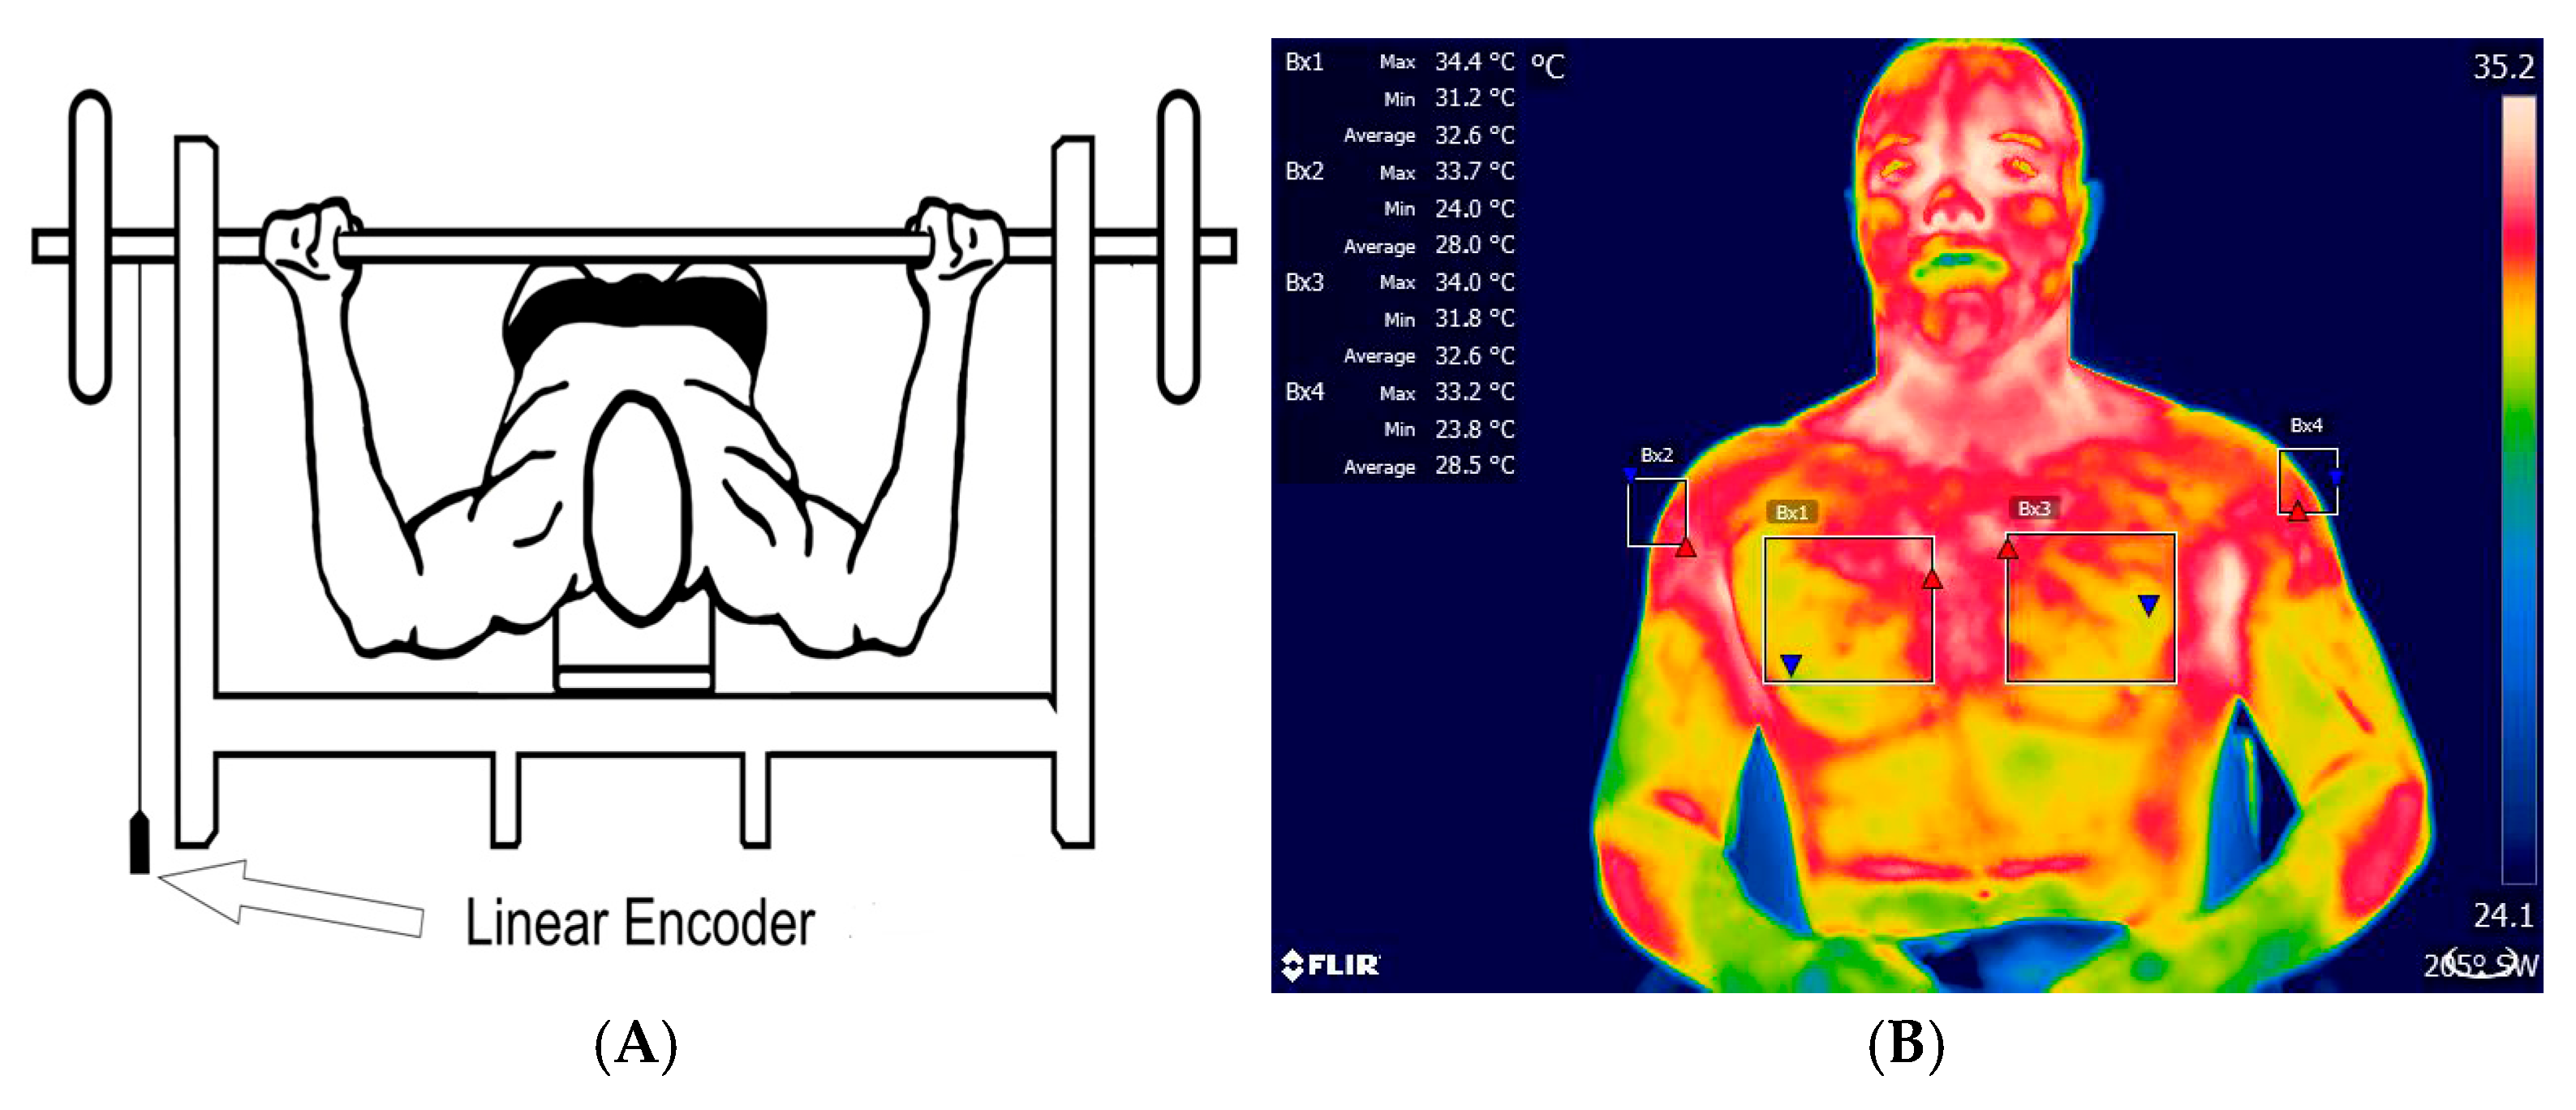
2.3.2. Dynamic Force Measurements

For the measurements of mean propulsive velocity (MPV), maximum velocity (Vmax), and power (POWER), the linear encoder from the Speed4Lift force measurement system (Vitruve, Madrid, Spain) was used. The encoder was fixed on the bench press bar to measure the vertical displacement velocity. The analysis of these parameters was conducted before and after the training session using a load of 45% of 1RM, where the velocity would be close to 1.0 m/s. This methodology aligns with current practices in velocity-based training research, providing reliable data on biomechanical responses to training, which is crucial for optimizing training protocols and understanding specific adaptations in powerlifting athletes. Velocity data recorded for the concentric phase were considered to begin at the ascending component of the movement, ending with full elbow extension. Velocity assessment at an MPV of 1 m/s has been used to measure training fatigue, and this velocity would be associated with a load of 45% and 80% of 1RM [4,22]. The evaluations with 45% of 1RM were performed before and after training, both in CP and PP. In total, 80% of 1RM was tested in set 1 and set 5 in both CP and PP. Both in the 45% test, which used four repetitions, and in the 80% test, which used five repetitions, the values are the averages of the performance [6,19] (Figure 2A).

2.3.3. Skin Temperature Measurement

Infrared thermography was employed to record athletes’ skin temperature. Subjects were instructed to remain seated and as calm as possible to avoid affecting readings. Athletes were advised to refrain from any physical activity 48 h before testing and to abstain from caffeine, stimulants, or alcohol consumption. Participants were instructed to avoid intense physical activity in the 24 h prior to the assessment, as well as the consumption of alcohol or caffeine. In addition, they were advised not to use creams or lotions on their skin in the 6 h prior to the procedure. To obtain the thermograms, the athlete remained seated, avoiding sudden movements, keeping their arms uncrossed, and refraining from scratching for at least 10 min, ensuring the acclimatization process [16,23]. Tests were conducted in a controlled environment with ambient temperature ranging between 22 °C and 24 °C and relative humidity around 50%, as recorded by a Hikari HTH-240 thermo-hygrometer (Hikari, Shenzhen, China) [24]. A FLIR T640sc thermal imaging camera (FLIR, Stockholm, Sweden) was utilized, featuring a temperature range of −40 °C to 2000 °C, accuracy of 2%, sensitivity of <0.035, infrared spectral band of 7.5–14 µm, refresh rate of 30 Hz, and resolution of 640 × 480 pixels [20]. Thermal images of the clavicular region of the pectoralis major muscle and the long head of the triceps brachii were captured (Figure 2B), and the attachment of the linear encoder to the bar is also graphically represented (Figure 2A).

2.3.4. Load Determination

In the first session, a 1RM test was conducted. Each subject initiated the attempt with a weight they believed they could lift only once with maximal effort. Weight increments were added until the maximum load that could be lifted once was achieved. If the athlete failed to complete a single repetition, 2.4 to 2.5% of the load used in the test was subtracted. Subjects rested for 3–5 min between 2 and 3 attempts. This test was performed 72 h before the evaluative process, which occurred in the second session. During the second session, athletes performed a preliminary warm-up for the upper limbs and a specific warm-up on the flat bench press with 30% of a 1RM load, executing 10 slow repetitions (3.0 × 1.0 s, eccentric × concentric) and 10 fast repetitions (1.0 × 1.0 s, eccentric x concentric). Following this phase, athletes performed a set of 4 repetitions at 45% of 1RM intensity, followed by a 5 × 5 protocol with 80% of 1RM load, allowing 3 to 5 min of rest interval. Finally, another set of 4 repetitions at 45% of 1RM was completed. The initial and final sets at 45% 1RM were considered as the pre- and post-intervention measurements, respectively. During the tests, the athletes did not perform any training, and were instructed to continue their normal daily routines, avoiding intense activities or physical exercises [6,19].

2.4. Statistical Analysis

Descriptive statistics were performed considering measures of central tendency, mean ± standard deviation (X ± SD), and a 95% confidence interval (95% CI). The Shapiro–Wilk test was used to verify the normality of the variables, given the sample size. A two-way repeated measures ANOVA was conducted to evaluate differences between PP and CP and the moments, as well as a Bonferroni post-hoc tests [21]. The temperature and dynamic strength indicators were evaluated with 45% of 1RM before and after the intervention. With a load of 80% of 1RM, the dynamic strength indicators were evaluated in the first and last series. In the variables in which differences between PP and CP were previously demonstrated, the ANCOVA test was then used, where the discrepant value was adopted as a covariate. Statistical analysis was performed using the Statistical Package for the Social Sciences (SPSS 25.0) (IBM, New York, NY, USA). The adopted significance level was p < 0.05. η2p = partial eta squared (small effect ≤0.05, medium effect 0.05 to 0.25, large effect 0.25 to 0.50, and very large effect > 0.50) [22,23].

3. Results

In Table 2, for the 45% condition, the CP group’s MPV increased significantly from 0.93 ± 0.23 m/s (95% CI: 0.78–1.09) before to 0.98 ± 0.24 m/s (95% CI: 0.82–1.14) after (p = 0.007, η2ₚ = 0.412, large effect). Similarly, Vmax improved from 1.24 ± 0.27 m/s (95% CI: 1.01–1.43) to 1.31 ± 0.28 m/s (95% CI: 1.12–1.50) (p = 0.015, η2ₚ = 0.388, small effect), and POWER output increased from 439.72 ± 131.32 W (95% CI: 351.50–527.95) to 454.09 ± 118.77 W (95% CI: 374.29–533.88) (p = 0.022, η2ₚ = 0.314, large effect).
In contrast, the PP group did not exhibit significant differences at 45% of 1RM. Their MPV declined slightly from 0.92 ± 0.17 m/s (95% CI: 0.80–1.04) to 0.83 ± 0.17 m/s (95% CI: 0.71–0.94), and Vmax decreased from 1.26 ± 0.20 m/s (95% CI: 1.12–1.39) to 1.14 ± 0.19 m/s (95% CI: 1.01–1.27). For power output, PP values went from 524.42 ± 140.50 W (95% CI: 430.03–618.81) before to 478.78 ± 134.72 W (95% CI: 388.27–569.30) after training.
For MPV at 80% of 1RM, the CP group recorded similar values before and after (0.46 ± 0.11 m/s [95% CI: 0.40–0.53] vs. 0.45 ± 0.11 m/s [95% CI: 0.38–0.52]), whereas the PP group showed a significant increase from 0.35 ± 0.10 m/s (95% CI: 0.29–0.42) pre to 0.49 ± 0.19 m/s (95% CI: 0.37–0.61) post (p = 0.037 for CP contrasts and p = 0.043 for PP contrasts, η2ₚ = 0.305).
Regarding Vmax at 80% of 1RM, CP maintained comparable velocities (0.65 ± 0.12 m/s [95% CI: 0.57–0.72] pre 0.64 ± 0.16 m/s [95% CI: 0.54–0.74] post, while the PP group improved significantly from 0.50 ± 0.14 m/s (95% CI: 0.41–0.59) to 0.67 ± 0.25 m/s (95% CI: 0.51–0.83) (p = 0.019, η2ₚ = 0.399).
Finally, for power output at 80% of 1RM, the CP group experienced a reduction from 375.98 ± 91.21 W (95% CI: 318.03–433.94) to 337.73 ± 80.12 W (95% CI: 286.83–388.64), while the PP group showed a significant increase from 386.79 ± 199.35 W (95% CI: 260.13–513.45) to 460.99 ± 222.15 W (95% CI: 319.84–602.14) (p = 0.034, η2ₚ = 0.427).
In Figure 3, for thermography in the PP group, there is a difference in the sternal portion of the pectoralis major muscle between before (33.28 ± 1.47, 95% CI 32.19–34.17) and after (35.13 ± 1.77, 95% CI 33.98–36.37, p = 0.004 η2ₚ = 0.443 large effect) measurements. Differences were observed in the long head of the triceps brachii muscle, after the session between CP (33.00 ± 1.26, 95% CI 32.15–33.85) and PP (34.18 ± 1.53, 95% CI 33.14–35.21) (p = 0.024, η2ₚ = 0.536, very large effect) groups, and within the PP group, between before (31.90 ± 1.13, 95% CI 31.14–32.67) and after (34.18 ± 1.53, 95% CI 33.14–35.21, p = 0.004 η2ₚ = 0.493, large effect) measurements.

4. Discussion

This study aimed to evaluate the parameters of mean propulsive velocity (MPV), maximum velocity (Vmax), and power, as well as the local temperature of the long head of the triceps brachii and the sternal portion of the pectoralis major, in conventional powerlifting (CP) and Paralympic powerlifting (PP) athletes. The evaluation was conducted at an intensity of 45% of one-repetition maximum (1RM) following a standard training session in the bench press.

4.1. MPV, Vmax, and Power

Differences were found between the CP and PP groups, both under submaximal conditions and at loads close to relative maximum. While CP tends to show consistent improvements in MPV, Vmax, and power at loads of 45% of 1RM, PP shows a less favorable response to this intensity, but responds positively at loads of 80% of 1RM. These velocity parameters have been evaluated in other studies and indicated as modulators of stimulus intensity and neuromuscular fatigue effect in training sessions [9,11]. According to a previous study, MPV establishes a highly reliable load–velocity relationship when compared to other velocity variables, with mean velocity showing the strongest relationship to relative intensity percentage, followed by MPV [25,26,27].
MPV has been associated with neuromuscular fatigue, which gradually develops as exercise repetitions are performed, reducing velocity during the training session and in pre- and post-session tests. The magnitude of this reduction was observed to be greater in the bench press compared to exercises such as squats [28]. These variations differ from the findings in this study for both groups, which exhibit different results between intensities of 45% and 80%.
In some ways, the discrepancies between CP and PP may have occurred, in part, due to the distinct neuromuscular adaptations of each group. In a study involving individuals trained in bench press and squat without disabilities, the loss of velocity was interpreted as a direct indicator of the accumulation of metabolic stress and fatigue [28]. On the other hand, in our study, PP athletes, who predominantly use their upper limbs in everyday life, demonstrated different responses. Under high loads (80% of 1RM), these athletes maintain or even improve their velocity, suggesting a specific adaptation that optimizes muscle recruitment under high tension [19].
The observed divergence can be interpreted from theoretical data, which propose a specific threshold of velocity loss for each exercise [29]. The magnitude of this percentage loss indicates fatigue and defines the optimal termination points for a set. In the case of PP athletes, the need for high loads (80% of 1RM) to achieve velocity gains suggests an adaptation resulting from the constant use of the upper limbs, thereby modifying the force–velocity profile and fatigue threshold [8,9,10,11,12,13,14,15,16,17,18,19,20,21,22,23,24,25,26,27,28,29,30].
Our results demonstrate reductions in velocity and power parameters for the PP in 45% of 1RM, but not in 80% of 1RM, which is different to the CP, where these parameters increased. Interestingly, in a recent study, PP athletes were exposed to two types of training: traditional with 80% of 1RM and eccentric with 110% of 1RM. For traditional training, there was no significant reduction in MPV between pre- and post-intervention measurements, supporting partially the findings of the present study [19].
The velocity loss indicator has been increasingly evaluated for training purposes in maximum strength modalities, demonstrating a linear relationship between velocity reduction and higher %1RM [8,9,10,11]. Nevertheless, in elite competitors, a reduction in velocity and power measures is expected, as demonstrated in studies evaluating athletes from various modalities [31,32,33,34]. Furthermore, when comparing two velocity reduction profiles (15% vs. 25%), athletes achieved greater neuromuscular adaptations with the bigger percentage of reduction [29].
In addition, recent studies, such as that by Mesquita Souza et al. [8], examined differentiated responses to training stimuli between CP and PP athletes. The findings reveal specific adaptations resulting from functional limitations. Similarly, van den Hoek et al. [18] observed that, in certain aspects, PP athletes exhibit distinct adaptive responses compared to conventional athletes.
Despite the widespread use of velocity reduction for training load control, the method’s precision remains under constant debate, particularly when compared to traditional methods such as %1RM. Nevertheless, %1RM carries considerable disadvantages, with one of the primary issues being the need to perform daily maximum strength tests to predict training load percentages, as factors such as sleep, nutrition, fatigue, and movement velocity can impact force production [35,36]. This ongoing debate highlights the complexity of accurately quantifying and controlling training loads in strength-based sports, emphasizing the need for further research to optimize training methodologies and performance outcomes [37].
In addition to velocity indicators, our study evaluated power output, which also showed different results between groups. CP athletes experienced an increase in power, while Paralympic powerlifting (PP) athletes tended towards a decrease. Power has been investigated as an important factor for adjusting optimal workload to improve human movement [10]. Consequently, power has been identified as a critical capacity for athletic performance, defined by the formula (power = velocity × force), meaning that increasing either velocity or force will also increase power [8,32].
Studies associating velocity loss with neuromuscular adaptations concluded that the closer to failure during training sets, the greater the losses in velocity and power [33,34]. Accordingly, our study’s training session was conducted with fixed sets. However, with 80% of 1RM, during training and comparing series 1 with series 5, PP athletes, in the initial set, had lower velocities in both MPV and Vmax than CP athletes [38,39,40]. However, in the final set, PP athletes had higher absolute values than CP athletes, and these findings are in line with other studies [7,19,35]. Regarding power, there were differences only between sets 1 and 5 in PP.

4.2. Skin Temperature

Skin temperature in the long head of the triceps brachii (TB) and sternal portion of the pectoral major (PM) muscles showed significant alterations in both groups. Infrared thermography in sports has been used to understand thermal changes in muscle tissue after exercise or training, providing data for a better understanding of injury prevention, biomechanical alterations, and imbalances [16,25]. In the sternal portion of the pectoralis major and in the triceps brachii, differences were observed between the time before and after in the PP athletes. In the triceps brachii, a difference was observed between the time after between the PP and the CP athletes. However, the temperature difference of less than 0.4 °C does not present a risk of injury for any of the athletes.
Physiologically, after exposure to overload, blood flow increases to the exercised area, causing changes in the thermal pattern, as observed in the sternal portion of the pectoral major (PM) and long head of the triceps brachii (TB) in the Paralympic powerlifting (PP) group [24]. Although an increase in post-exercise temperature values is expected, when these values exceed normal patterns, the risk of injury may increase [41]. Consequently, when the temperature surpasses values above 1.6 °C, a higher risk of injury is observed, necessitating the interruption of training [37,38]. The high intensity applied by strength athletes has been identified as a relevant factor for the increase in ST [39,40]. However, a recent study analyzing the thermal pattern during a traditional strength training session in non-athletes and PP athletes did not find thermal differences [42,43].
Thermal responses demonstrate how training load, exercise type, muscle groups and joints involved, cardiovascular and hemodynamic systems, among others, result in complex physiological responses that trigger adaptations and internal adjustments created by training [44]. This may partially explain the different results found in this study regarding ST responses between groups. Reinforcing the previous data, research applying different types of exercises, intensities, set volumes, and distinct populations also found ambiguous results regarding thermal responses [45,46].
Corroborating with the previous exposition, when analyzing three effects of different training methods traditional (TRAD), time under tension (TUT), and vascular occlusion (OCL) ST in athletes, immediately after training, ST was reduced in all groups, but significant reductions were only observed for OCL and TUT [47]. In another study evaluating the impact of the drop set method and set volume (three sets vs. six sets) on ST, an increase in temperature was evident immediately after training, and the higher volume of sets generated a greater thermal response [48].
Another factor that may influence and explain the differences in skin temperature (ST) behavior between groups in this study is the training level, as Paralympic powerlifting (PP) athletes are more experienced than conventional powerlifting (CP) athletes. Research demonstrated that after anaerobic exercise, trained women exhibit a more rapid increase in ST and maintain a more refined thermoregulatory management compared to untrained individuals [49]. Corroborating this finding, when men with different training levels were subjected to an effort test, they demonstrated similar thermoregulatory kinetics as observed in our study [46].

4.3. Train Considerations

Our study represents the first comprehensive evaluation and analysis of velocity, power, and skin temperature parameters among athletes from different weightlifting categories. To date, two studies [17,24] conducted similar analyses, focusing exclusively on Paralympic weightlifting (PP) athletes. Thus, it appears that PP and CP athletes tend to present distinct adaptations related to PP limitations and greater use of the upper limbs in daily life, in addition to the response to different training intensities.
Thus, it seems that PP athletes tend to have lower initial velocity and higher velocity at the end; however, in terms of fatigue, there were differences in the temperature of the triceps, with no differences in the chest. Regarding fatigue expressed through velocity, it was observed that PP athletes had less fatigue expressed through velocity. This may be due to adaptation, since many people use their upper limbs to propel the wheelchair and to move around using crutches [50].

4.4. Limitations

The study has several limitations that require caution in interpreting the results. The intervention was acute, which prevents extrapolation to chronic effects, as long-term training models and duration may cause different effects on the evaluated parameters. External factors, such as sleep duration, nutrition, and use of ergogenic substances, were not controlled, except for illicit substances. The findings are specific to the athletic population, and effects on non-athletes may differ. Furthermore, additional studies are necessary to elucidate the remaining gaps regarding parameters for training control and to assist coaches and athletes in better decision-making, thus ensuring the best possible performance.

5. Conclusions

The findings of the present study demonstrate significant differences in the physiological and mechanical responses between conventional (CP) and Paralympic (PP) powerlifting athletes in terms of velocity and power, as assessed at 45% and 80% of 1RM. In the CP group, mean propulsive velocity (MPV) and maximum velocity (Vmax) indices showed significant increases after the training session at 45% of 1RM, accompanied by an increase in power, suggesting an efficient neuromuscular response and adequate adaptation to the submaximal stimulus.
In contrast, PP athletes demonstrated a tendency for these parameters to decrease at lighter loads, possibly reflecting specific adaptations resulting from the continuous use of the upper limbs for locomotion and other functional demands inherent to their condition. When assessed at 80% of 1RM, the results were reversed: while the CP group maintained their velocity indices at a practically stable level or showed a slight reduction, the PP group showed significant increases in MPV and Vmax, as well as in power production. This differentiated response suggests that Paralympic athletes may have a distinct fatigue threshold, which allows them to optimize performance at higher loads. In summary, the data suggest that load prescription in resistance training should be individualized, taking into account the intrinsic characteristics of each group.
Monitoring velocity parameters emerges as a valuable tool to quantify neuromuscular fatigue and adjust the training stimulus according to the effort level and specific adaptations of each athlete. These results contribute to the refinement of training strategies, providing support for the implementation of safer and more effective approaches for both conventional and Paralympic athletes, with the aim of optimizing performance gains without inducing excessive fatigue. These findings contribute to the understanding of acute responses to high-intensity resistance training in powerlifting athletes, highlighting the importance of category-specific considerations in training program design and performance monitoring.
The practical applications obtained from the study indicate that PP athletes tend to present greater thermal alteration, however, without additional risks. Still, regarding dynamic strength indicators, PP athletes tend to present greater adaptation to training with greater loads, notably 80% of 1 RM. However, new studies are necessary to evaluate other indicators, such as muscle activation and static strength indicators, among others.

Author Contributions

Conceptualization, R.L.M.S. and F.J.A.; methodology, L.d.S.; software, J.L.d.S.; validation, L.M.V.S. and A.L.G.C. formal analysis, P.F.d.A.-N.; investigation, R.L.M.S.; and F.J.A., resources, B.G.d.A.T.C. and A.C.M.; data curation, F.J.A.; writing—original draft preparation, R.L.M.S.; writing—review and editing, all authors; visualization, J.L.d.S.; supervision, P.T.N. and B.G.d.A.T.C.; project administration, F.J.A. All authors have read and agreed to the published version of the manuscript.

Funding

This research received no external funding.

Institutional Review Board Statement

This study was performed in line with Resolution 466/2012 of the National Research Ethics Commission (CONEP) of the National Health Council and following the ethical principles of the Declaration of Helsinki (1964, revised in 2013) of the World Medical Association. This study was approved by the Research Ethics Committee of the Federal University of Sergipe (ID-CAAE: 67953622.7.0000.5546) under statement number 6.523.247, dated 22 November 2023.

Informed Consent Statement

Informed consent was obtained from all subjects involved in the study.

Data Availability Statement

The data that support this study can be obtained from the address: www.ufs.br/, department of Physical Education, accessed on 12 June 2024.

Conflicts of Interest

The authors declare no conflict of interest.

References

  1. Spence, A.-J.; Helms, E.R.; Sousa, C.A.; McGuigan, M.R. Range of Motion Predicts Performance in National-Level New Zealand Male Powerlifters. J. Strength Cond. Res. 2023, 37, 123–128. [Google Scholar] [CrossRef]
  2. International Paralympic Committee. Para Powerlifting Rules and Regulations. Available online: https://www.paralympic.org/powerlifting/rules (accessed on 30 May 2025).
  3. Austin, D.; Mann, B. Powerlifting: The Complete Guide to Technique, Training, and Competition; Human Kinetics: Champaign, IL, USA, 2021. [Google Scholar]
  4. González-Badillo, J.J.; Sánchez-Medina, L. Movement Velocity as a Measure of Loading Intensity in Resistance Training. Int. J. Sports Med. 2010, 31, 347–352. [Google Scholar] [CrossRef]
  5. Dorrell, H.F.; Smith, M.F.; Gee, T.I. Comparison of Velocity-Based and Traditional Percentage-Based Loading Methods on Maximal Strength and Power Adaptations. J. Strength Cond. Res. 2020, 34, 46–53. [Google Scholar] [CrossRef] [PubMed]
  6. Moore, J.; Dorrell, H. Guidelines and Resources for Prescribing Load Using Velocity Based Training. IUSCA Journal 2020, 1. [Google Scholar] [CrossRef]
  7. Sanchez-Medina, L.; Perez, C.E.; Gonzalez-Badillo, J.J. Importance of the Propulsive Phase in Strength Assessment. Int. J. Sports Med. 2010, 31, 123–129. [Google Scholar] [CrossRef]
  8. Mesquita Souza, R.L.; Aidar, F.J.; Villar, R.; Greco, G.; Santos, L.D.; Poli, L.; Lima de Santana, J.; Carvutto, R.; Gama de Matos, D.; Badicu, G.; et al. Assessment of Asymmetry at Different Intensities between Conventional and Paralympic Powerlifting Athletes. Heliyon 2023, 9, e16211. [Google Scholar] [CrossRef] [PubMed]
  9. Conceição, F.; Fernandes, J.; Lewis, M.; Gonzaléz-Badillo, J.J.; Jimenéz-Reyes, P. Movement Velocity as a Measure of Exercise Intensity in Three Lower Limb Exercises. J. Sports Sci. 2016, 34, 1099–1106. [Google Scholar] [CrossRef]
  10. Jandačka, D.; Beremlijski, P. Determination of Strength Exercise Intensities Based on the Load-Power-Velocity Relationship. J. Hum. Kinet. 2011, 28, 33–44. [Google Scholar] [CrossRef]
  11. Loturco, I.; Pereira, L.A.; Abad, C.C.C.; Tabares, F.; Moraes, J.E.; Kobal, R.; Kitamura, K.; Nakamura, F.Y. Bar Velocities Capable of Optimising the Muscle Power in Strength-Power Exercises. J. Sports Sci. 2017, 35, 734–741. [Google Scholar] [CrossRef]
  12. Studencki, M.; Ignatjeva, A.; Nitychoruk, M.; Gołaś, A.; Smółka, W.; Maszczyk, A. Effect of Bench Press at a Specified Movement Tempo on Post-Exercise Testosterone and Cortisol Levels. Phys. Act. Rev. 2021, 9, 111–119. [Google Scholar] [CrossRef]
  13. Viegas, F.; de Mello, M.T.; Rodrigues, S.A.; Costa, C.M.A.; Freitas, L.d.S.N.; Rodrigues, E.L.; Silva, A. The use of thermography and its control variables: A systematic review. Rev. Bras. Med. Esporte 2020, 26, 82–86. [Google Scholar] [CrossRef]
  14. Menezes, P.; Rhea, M.R.; Herdy, C.; Simão, R. Effects of Strength Training Program and Infrared Thermography in Soccer Athletes Injuries. Sports 2018, 6, 148. [Google Scholar] [CrossRef] [PubMed]
  15. Naperalsky, M.; Ruby, B.; Slivka, D. Environmental Temperature and Glycogen Resynthesis. Int. J. Sports Med. 2010, 31, 561–566. [Google Scholar] [CrossRef]
  16. Quesada, J.I.P.; Carpes, F.P. Application of Infrared Thermography in the Assessment of Sport Equipment. In Elsevier eBooks; Woodhead Publishing: Sawston, UK, 2019; pp. 37–69. [Google Scholar] [CrossRef]
  17. Filho, G.F.d.S.; Aidar, F.J.; Getirana-Mota, M.; Brito, C.J.; Aedo-Muñoz, E.; de Almeida Paz, Â.; de Souza Leite Júnior, J.A.; Vieira, E.L.M.; Nikolaidis, P.T. Analysis of Velocity, Power and Skin Temperature in Paralympic Powerlifting Athletes with Fixed and Variable Resistance. Sports 2024, 12, 250. [Google Scholar] [CrossRef]
  18. Van Den Hoek, D.; Garrett, J.; Howells, R.; Latella, C. Paralympians Are Stronger Than You Know: A Comparison of Para and Nondisabled Powerlifting Bench Press World Records. J. Strength Cond. Res. 2023, 37, 452–456. [Google Scholar] [CrossRef] [PubMed]
  19. Jovanović, M.; Flanagan, E.P. Researched applications of velocity based strength training. J. Aust. Strength Cond. 2014, 22, 58–69. [Google Scholar]
  20. Hopkins, W.G.; Marshall, S.W.; Batterham, A.M.; Hanin, J. Progressive Statistics for Studies in Sports Medicine and Exercise Science. Med. Sci. Sports Exerc. 2009, 41, 3–13. [Google Scholar] [CrossRef]
  21. Ball, R.; Weidman, D. Analysis of USA Powerlifting Federation Data from January 1, 2012–June 11, 2016. J. Strength Cond. Res. 2018, 32, 1843–1851. [Google Scholar] [CrossRef]
  22. Jukic, I.; King, A.; Sousa, C.A.; Prnjak, K.; McGuigan, M.R. Implementing a velocity-based approach to resistance training: The reproducibility and sensitivity of different velocity monitoring technologies. Sci. Rep. 2023, 13, 7152. [Google Scholar] [CrossRef]
  23. Sánchez-Cuevas, F.; Fernández-Cuevas, I.; García-Márquez, C.; González, F.; López, J.; Arbelo-Casas, S.; de la Torre, A.; Martín-Ruiz, P.; Abad-Flores, A.; Serrano, G.; et al. Classification of Factors Influencing the Use of Infrared Thermography in Humans: A Review. Infrared Phys. Technol. 2015, 71, 28–50. [Google Scholar] [CrossRef]
  24. Santos, L.C.V.; Aidar, F.J.; Villar, R.; Greco, G.; de Santana, J.L.; Marçal, A.C.; de Almeida-Neto, P.F.; de Araújo Tinoco Cabral, B.G.; Badicu, G.; Nobari, H.; et al. Evaluation of the Training Session in Elite Paralympic Powerlifting Athletes Based on Biomechanical and Thermal Indicators. Sports 2023, 11, 151. [Google Scholar] [CrossRef]
  25. Neves, E.B.; Moreira, T.R.; Lemos, R.; Vilaça-Alves, J.; Rosa, C.; Reis, V.M. Using Skin Temperature and Muscle Thickness to Assess Muscle Response to Strength Training. Rev. Bras. Med. Esporte 2015, 21, 350–354. [Google Scholar] [CrossRef]
  26. Cohen, J. Statistical Power Analysis for the Behavioral Sciences, 2nd ed.; Routledge: New York, NY, USA, 1988; ISBN 978-0-203-77158-7. [Google Scholar]
  27. Cohen, J. A Power Primer. Psychol. Bull. 1992, 112, 155–159. [Google Scholar] [CrossRef]
  28. Pareja-Blanco, F.; Rodríguez-Rosell, D.; Sánchez-Medina, L.; Gorostiaga, E.M.; González-Badillo, J.J. Effects of velocity loss during resistance training on athletic performance, strength gains and muscle adaptations: A systematic review. Sports Med. 2020, 50, 161–175. [Google Scholar] [CrossRef]
  29. Weakley, J.; Mann, B.; Banyard, H.; McLaren, S.; Scott, T.; Garcia-Ramos, A. Velocity-Based Training: From Theory to Application. Strength Cond. J. 2020, 43, 31–49. [Google Scholar] [CrossRef]
  30. Sánchez-Medina, L.P.; Gnzález-Badillo, J.J. Velocity Loss as an Indicator of Neuromuscular Fatigue during Resistance Training. Med. Sci. Sports Exerc. 2011, 43, 1725–1734. [Google Scholar] [CrossRef]
  31. González-Badillo, J.J.; Yañez-García, J.M.; Mora-Custodio, R.; Rodríguez-Rosell, D. Velocity Loss as a Variable for Monitoring Resistance Exercise. Int. J. Sports Med. 2017, 38, 217–225. [Google Scholar] [CrossRef]
  32. Sander, A.; Keiner, M.; Wirth, K.; Schmidtbleicher, D. Influence of a 2-Year Strength Training Programme on Power Performance in Elite Youth Soccer Players. Eur. J. Sport Sci. 2013, 13, 445–451. [Google Scholar] [CrossRef]
  33. Teles, L.J.L.; Aidar, F.J.; de Matos, D.G.; Marçal, A.C.; Almeida-Neto, P.F.d.; Neves, E.B.; Moreira, O.C.; Ribeiro Neto, F.; Garrido, N.D.; Vilaça-Alves, J.; et al. Static and Dynamic Strength Indicators in Paralympic Power-Lifters with and without Spinal Cord Injury. Int. J. Environ. Res. Public Health 2021, 18, 5907. [Google Scholar] [CrossRef]
  34. Izquierdo, M.; González-Badillo, J.J.; Häkkinen, K.; Ibáñez, J.; Kraemer, W.J.; Altadill, A.; Eslava, J.; Gorostiaga, E.M. Effect of Loading on Unintentional Lifting Velocity Declines during Single Sets of Repetitions to Failure during Upper and Lower Extremity Muscle Actions. Int. J. Sports Med. 2006, 27, 718–724. [Google Scholar] [CrossRef] [PubMed]
  35. Rodiles-Guerrero, L.; Cornejo-Daza, P.J.; Sánchez-Valdepeñas, J.; Alcazar, J.; Rodriguez-Lopez, C.; Sánchez-Moreno, M.; Alegre, L.M.; León-Prados, J.A.; Pareja-Blanco, F. Specific Adaptations to 0%, 15%, 25%, and 50% Velocity-Loss Thresholds During Bench Press Training. Int. J. Sports Physiol. Perform. 2022, 17, 1231–1241. [Google Scholar] [CrossRef] [PubMed]
  36. Liao, K.-F.; Wang, X.-X.; Han, M.-Y.; Li, L.-L.; Nassis, G.P.; Li, Y.-M. Effects of Velocity Based Training vs. Traditional 1RM Percentage-Based Training on Improving Strength, Jump, Linear Sprint and Change of Direction Speed Performance: A Systematic Review with Meta-Analysis. PLoS ONE 2021, 16, e0259790. [Google Scholar] [CrossRef]
  37. Orange, S.T.; Hritz, A.; Pearson, L.; Jeffries, O.; Jones, T.W.; Steele, J. Comparison of the Effects of Velocity-Based vs. Traditional Resistance Training Methods on Adaptations in Strength, Power, and Sprint Speed: A Systematic Review, Meta-Analysis, and Quality of Evidence Appraisal. J. Sports Sci. 2022, 40, 1220–1234. [Google Scholar] [CrossRef] [PubMed]
  38. Cormie, P.; McBride, J.M.; McCaulley, G.O. Validation of Power Measurement Techniques in Dynamic Lower Body Resistance Exercises. J. Appl. Biomech. 2007, 23, 103–118. [Google Scholar] [CrossRef] [PubMed]
  39. Loturco, I.; Nakamura, F.Y.; Kobal, R.; Gil, S.; Abad, C.C.C.; Cuniyochi, R.; Pereira, L.A.; Roschel, H. Training for Power and Speed: Effects of Increasing or Decreasing Jump Squat Velocity in Elite Young Soccer Players. J. Strength Cond. Res. 2015, 29, 2771–2779. [Google Scholar] [CrossRef]
  40. Sánchez-Moreno, M.; Cornejo-Daza, P.J.; González-Badillo, J.J.; Pareja-Blanco, F. Effects of Velocity Loss During Body Mass Prone-Grip Pull-up Training on Strength and Endurance Performance. J. Strength Cond. Res. 2020, 34, 911–917. [Google Scholar] [CrossRef]
  41. Abate, M.; Di Carlo, L.; Di Donato, L.; Romani, G.L.; Merla, A. Comparison of Cutaneous Thermal Response to a Standardised Warm up in Trained and Untrained Individuals. J. Sports Med. Phys. Fitness 2013, 53, 209–215. [Google Scholar] [PubMed]
  42. Vieira, S.G.; Sillero-Quintana, M.; da Silva, A.G.; Marins, K.O.; Marins, J.C.B. Thermographic Response Resulting from Strength Training: A Preliminary Study. Apunt. Sports Med. 2020, 55, 120–127. [Google Scholar] [CrossRef]
  43. Fraga, G.S.; Aidar, F.J.; Matos, D.G.; Marçal, A.C.; Santos, J.L.; Souza, R.F.; Carneiro, A.L.; Vasconcelos, A.B.; Da Silva-Grigoletto, M.E.; van den Tillaar, R.; et al. Effects of Ibuprofen Intake in Muscle Damage, Body Temperature and Muscle Power in Paralympic Powerlifting Athletes. Int. J. Environ. Res. Public Health 2020, 17, 5157. [Google Scholar] [CrossRef]
  44. Nybo, L.; Rasmussen, P.; Sawka, M.N. Performance in the Heat-Physiological Factors of Importance for Hyperthermia-Induced Fatigue. Compr. Physiol. 2014, 4, 657–689. [Google Scholar] [CrossRef]
  45. Charkoudian, N. Mechanisms and Modifiers of Reflex Induced Cutaneous Vasodilation and Vasoconstriction in Humans. J. Appl. Physiol. 2010, 109, 1221–1228. [Google Scholar] [CrossRef] [PubMed]
  46. Neves, E.B.; Vilaca-Alves, J.; Antunes, N.; Felisberto, I.M.V.; Rosa, C.; Reis, V.M. Different Responses of the Skin Temperature to Physical Exercise: Systematic Review. In Proceedings of the 2015 37th Annual International Conference of the IEEE Engineering in Medicine and Biology Society (EMBC), Milano, Italy, 25–29 August 2015; pp. 1307–1310. [Google Scholar] [CrossRef]
  47. De Almeida Barros, N.; Aidar, F.J.; De Matos, D.G.; De Souza, R.F.; Neves, E.B.; De Araujo Tinoco Cabral, B.G.; Carmargo, E.A.; Reis, V.M. Evaluation of Muscle Damage, Body Temperature, Peak Torque, and Fatigue Index in Three Different Methods of Strength Gain. Int. J. Exerc. Sci. 2020, 13, 1352–1365. [Google Scholar] [CrossRef]
  48. Uchôa, P.; Matos, F.; Neves, E.B.; Saavedra, F.; Rosa, C.; Reis, V.M.; Vilaça-Alves, J. Evaluation of Two Different Resistance Training Volumes on the Skin Surface Temperature of the Elbow Flexors Assessed by Thermography. Infrared Phys. Technol. 2018, 93, 178–183. [Google Scholar] [CrossRef]
  49. Formenti, D.; Ludwig, N.; Gargano, M.; Gondola, M.; Dellerma, N.; Caumo, A.; Alberti, G. Thermal Imaging of Exercise-Associated Skin Temperature Changes in Trained and Untrained Female Subjects. Ann. Biomed. Eng. 2012, 41, 863–871. [Google Scholar] [CrossRef]
  50. de Resende, M.A.; Vasconcelos Resende, R.B.; Reis, G.C.; Barros, L.d.O.; Bezerra, M.R.S.; Matos, D.G.d.; Marçal, A.C.; Almeida-Neto, P.F.d.; Cabral, B.G.d.A.T.; Neiva, H.P.; et al. The Influence of Warm-Up on Body Temperature and Strength Performance in Brazilian National-Level Paralympic Powerlifting Athletes. Med. Kaunas Lith. 2020, 56, 538. [Google Scholar] [CrossRef]
Figure 1. Experimental study design. Legend: 1 RM: one repetition maximum; MPV: mean propulsive velocity; and Vmax: maximum velocity.
Physiologia 05 00023 g001
Figure 2. Detail of the placement of the linear encoder connected to the bar (A), and infrared thermography photo model (B).
Physiologia 05 00023 g002
Figure 3. Temperature assessed through thermography of (A) the sternal pectoral and (B) brachial triceps, before and after, of the conventional (CP) and Paralympic (PP) powerlifting groups.
Physiologia 05 00023 g003
Table 1. Sample characteristics.
Conventional Powerlifting (CP)Paralympic
Powerlifting (PP)
PCohen’s d
Age (years)29.84 ± 4.2130.81 ± 8.050.715XXX
Body weight (Kg)78.52 ± 7.9570.00 ± 16.130.115XXX
Experience (years)1.81 ± 0.412.84 ± 1.310.0161.108
1RM bench press test (Kg)118.49 ± 17.71122.02 ± 38.060.440XXX
1RM/body mass1.51 ± 0.61 *1.71 ± 0.42 *0.175XXX
The load lifted by the athletes ranked them among the top 10 in their categories at the national level. 1 RM/body mass values > 1.4 for the bench press is considered elite for athletes [21]. * Significant difference. SD = standard deviation.
Table 2. Mean propulsive velocity (MPV), maximum velocity (Vmax), and power before and after 45% and 80% of 1RM (mean ± SD, and CI 95%).
BeforeAfter
CPPPCPPPpη2
MPV 45%
(m/s)
0.93 ± 0.23 a
(0.78–1.09)
0.92 ± 0.17
(0.80–1.04)
0.98 ± 0.24 a
(0.82–1.14)
0.83 ± 0.17
(0.71–0.94)
“a” p = 0.007*0.412
Vmax 45%
(m/s)
1.24 ± 0.27 a
(1.01–1.43)
1.26 ± 0.20
(1.12–1.39)
1.31 ± 0.28 a
(1.12–1.50)
1.14 ± 0.19
(1.01–1.27)
“a” p = 0.015*0.388
Power 45%
(W)
439.72 ± 131.32 a
(351.50–527.95)
524.42 ± 140.50
(430.03–618.81)
454.09 ± 118.77 a
(374.29–533.88)
478.78 ± 134.72
(388.27–569.298)
“a” p = 0.022*0.314
MPV 80%
(m/s)
0.46 ± 0.11 a,b
(0.40–0.53)
0.35 ± 0.10
(0.29–0.42)
0.45 ± 0.11 a
(0.38–0.52)
0.49 ± 0.19 b
(0.37–0.61)
“a” p = 0.037*
“b” p = 0.043#
0.305*
0.313#
Vmax 80%
(m/s)
0.65 ± 0.12 a
(0.57–0.72)
0.50 ± 0.14
(0.41–0.59)
0.64 ± 0.16
(0.54–0.74)
0.67 ± 0.25 a
(0.51–0.83)
“a” p = 0.019#0.399
Power 80%
(W)
375.98 ± 91.21
(318.03–433.94)
386.79 ± 199.35 a
(260.13–513.45)
337.73 ± 80.12
(286.83–388.64)
460.99 ± 222.15 a
(319.84–602.14)
“a” p = 0.034*0.427
p < 0.05 (ANOVA). η2ₚ = partial eta square (small effect ≤ 0.05, medium effect 0.05 to 0.25, high effect 0.25 to 050, and very high effect (>050). * Intraclass, and # interclass. PP: Paralympic powerlifters; and CP: conventional powerlifters. In the variables in which there were differences at the time before, the discrepant variable was used as a covariate and an ANCOVA was performed. Covariant. The repeated letters (a-a, b-b), represent where the statistical differences are.
Disclaimer/Publisher’s Note: The statements, opinions and data contained in all publications are solely those of the individual author(s) and contributor(s) and not of MDPI and/or the editor(s). MDPI and/or the editor(s) disclaim responsibility for any injury to people or property resulting from any ideas, methods, instructions or products referred to in the content.

