Abstract
Introduction: Oral rehydration reduces thirst sensation (TS), which may negatively affect autonomic function, measured by heart-rate variability (HRV). However, it is unclear if this effect is independent of hydration changes. This study examines whether TS influences autonomic function between intravenous and oral rehydration. Methods: Twelve males (mean ± SD; age, 29 ± 12 years; 74.7 ± 7.9 kg; 179.4 ± 7.0 cm; VO2max, 49.8± 6.6 mL·kg−1·min−1) cycled at 55% VO2max for 90 min followed by a 12 km time trial. Two experimental conditions were performed in a counterbalanced, randomized order; (a) the high thirst (HT) group were infused 25 mL of isotonic saline every 5 min via an intravenous tube, and (b) the low thirst (LT) group ingested 25 mL of water every 5 min. TS and heart rate were collected every 5 min. HRV was assessed pre exercise, post steady-state exercise, and post time trial. HRV parameters included time domain, frequency domain, and non-linear measures analyzed by two-way repeated measures ANOVA. Results: There was a significant time x condition for the root mean square of successive RR interval differences (RMSSDlog), high-frequency (HF) power, and SD1 (p < 0.05). In LT, RMSSDlog decreased from Pre to Mid (3.71 ± 0.61 ms to 2.53 ± 1.15 ms, p < 0.01) and Pre to Post (2.18 ± 0.90 ms, p < 0.01) but stabilized from Mid to Post (p = 0.39). High-frequency (HF) power in HT was maintained from Pre (3.7 ± 0.6 nu) to Mid (3.4 ± 0.8 nu, p = 0.21) but decreased from Pre to Post (2.5 ± 0.7 nu, p < 0.01) and Mid to Post (p < 0.01). LT decreased in HF power from Pre (3.7 ± 0.5 nu) to Mid (3.0 ± 0.8 nu, p < 0.01) and Pre to Post (3.0 ± 0.7 nu, p < 0.01); Mid and Post was maintained (p = 0.99). SD1, decreased in HT (Pre: 3.4 ± 0.4 ms, Mid: 2.0 ± 1.1 ms, Post: 1.1 ± 0.5 ms; all comparisons p < 0.05). In LT, SD1 decreased from Pre (3.4 ± 0.6 ms) to Mid (2.18 ± 1.15 ms, p < 0.01) and Pre to Post (1.83 ± 0.90 ms, p < 0.01), but stabilized Mid to Post (p = 0.39). Conclusion: Satiating thirst through oral rehydration increases parasympathetic activity post exercise, reducing stress and increasing recovery between exercise bouts. These findings have implications for optimizing rehydration strategies in sports and occupational settings.
1. Introduction
Intravenous rehydration (IV) is employed for its efficiency to deliver fluids in challenging scenarios and is often compared to oral rehydration (drinking) to provide fluid balance in the body [1]. Although it is understood that both are adequate for restoring hydration, they differ in physiological impact. IV rehydration is particularly beneficial in cases of severe dehydration, including but not limited to conditions such as severe muscle cramping, significant body mass loss (>5%), and nausea, vomiting, or diarrhea associated with illness, among others [2,3]. Furthermore, IV rehydration provides immediate fluid replenishment, which has been suggested to benefit the cardiovascular system by reducing strain through rapid plasma volume restoration [3]. Conversely, drinking requires gastric emptying and intestinal absorption before fluids contribute to systemic circulation which takes between 20 and 45 min [1,3,4,5,6]. Despite these limitations, oral rehydration is more accessible and can be more practical in non-emergency settings and has been demonstrated to reduce thirst sensation and faster exercise time-trial performance [7,8,9].
Notably, drinking mitigates thirst sensation, which is an important physiological signal in the maintenance of hydration status. Interestingly, the act of drinking may also influence autonomic regulation, as measured by heart-rate variability (HRV) [10,11]. HRV is a sensitive, noninvasive marker of autonomic cardiovascular regulation, reflecting sympathetic and parasympathetic activity. Its rapid responsiveness to physiological stressors serves as a valuable tool for evaluating cardiovascular resilience, autonomic function, and recovery in clinical and performance settings [12,13]. In this context, previous studies have investigated the relationship between drinking and HRV. For example, Routledge et al. demonstrated that drinking 500 mL of water increased cardiac vagal activity, as indicated by higher HRV measures through the root mean square of successive differences (RMSSD) and high frequency (HF) power; both of which are HRV-derived variables measuring parasympathetic activity [10]. Furthermore, Young et al. demonstrated a body mass loss of <1% by exposure in a heated environment (30 °C) supplemented by subsequent rehydration with two 150 mL drinks, which increased HRV and parasympathetic activity [11]. Parasympathetic activation during drinking may be attributed to mechanisms such as gastric distension [14,15,16,17,18] and decreased plasma osmolality in the portal vein [19,20] which have previously been demonstrated to increase parasympathetic activity.
Despite the potential increases in parasympathetic activity by drinking, the introduction of fluid influences hydration status, which is an important factor in influencing HRV. To control hydration status, IV infusion may be utilized, isolating the effects of hydration and thirst. Additionally, IV rehydration has been demonstrated to contribute to improved cardiovascular function by restoring plasma volume, which maintains cardiac output and blood pressure during exercise [1,3,4,5,6]. Given that IV rehydration may improve the cardiovascular system during exercise, this may also improve HRV after exercise, because it may support parasympathetic reactivation and reduce sympathetic dominance, thereby facilitating stress reduction and recovery. Therefore, the purpose of this study is to compare the stress response, measured by HRV, during the thirst sensation, independent of hydration status. These findings have important implications for rehydration recommendations to maximize recovery and stress reduction between bouts of activity in contexts such as sports, occupational settings, and military operations, where recovery and stress reduction between bouts are crucial in the maintenance of performance.
2. Results
As this research is part of a larger study, urine, blood measurements, Trec, and HR are presented in a previous manuscript (Sekiguchi et al. [21], 2025; under review). In summary, urine and blood markers confirmed that there were no differences in hydration status at any time point between HT and LT.
2.1. Thirst and Hydration Measures
Thirst was higher in HT compared to LT after 15 min and throughout the 12 km time-trial (the figure can be found in Sekiguchi et al. [21], p ≤ 0.05). In addition, there were no differences in body mass loss at Mid (LT, 1.7 ± 0.7%; HT, 1.6 ± 0.7%; p = 0.38) and Post between LT and HT (LT, 2.4 ± 0.8%; HT, 2.3 ± 0.5%; p = 0.76).
2.2. Decreases in HRV and Vagal Activity Measured by Time Domain
SDNN decreased across all time points (Pre: 3.7 ± 0.4 ms, Mid: 2.8 ± 0.8 ms, Post: 2.4 ± 0.7 ms; Pre vs. Mid, Pre vs. Post, Mid vs. Post, p < 0.01). SDNN was higher in HT (3.1 ± 0.8 ms) than LT (2.9 ± 0.9 ms, p = 0.04). A significant time × condition interaction revealed a progressive SDNN decline in HT (T Pre: 3.8 ± 0.2 ms, T Mid: 2.7 ± 0.9 ms, T Post: 2.1 ± 0.5 ms; Pre vs. Mid, Pre vs. Post, p < 0.01; Mid vs. Post, p = 0.016). In LT, SDNN decreased from Pre to Mid (Pre: 3.8 ± 0.5; Mid: 3.0 ± 0.8 ms, p < 0.01) and Pre to Post (2.6 ± 0.7 ms, p < 0.01) but remained stable from Mid to Post (p = 0.19).
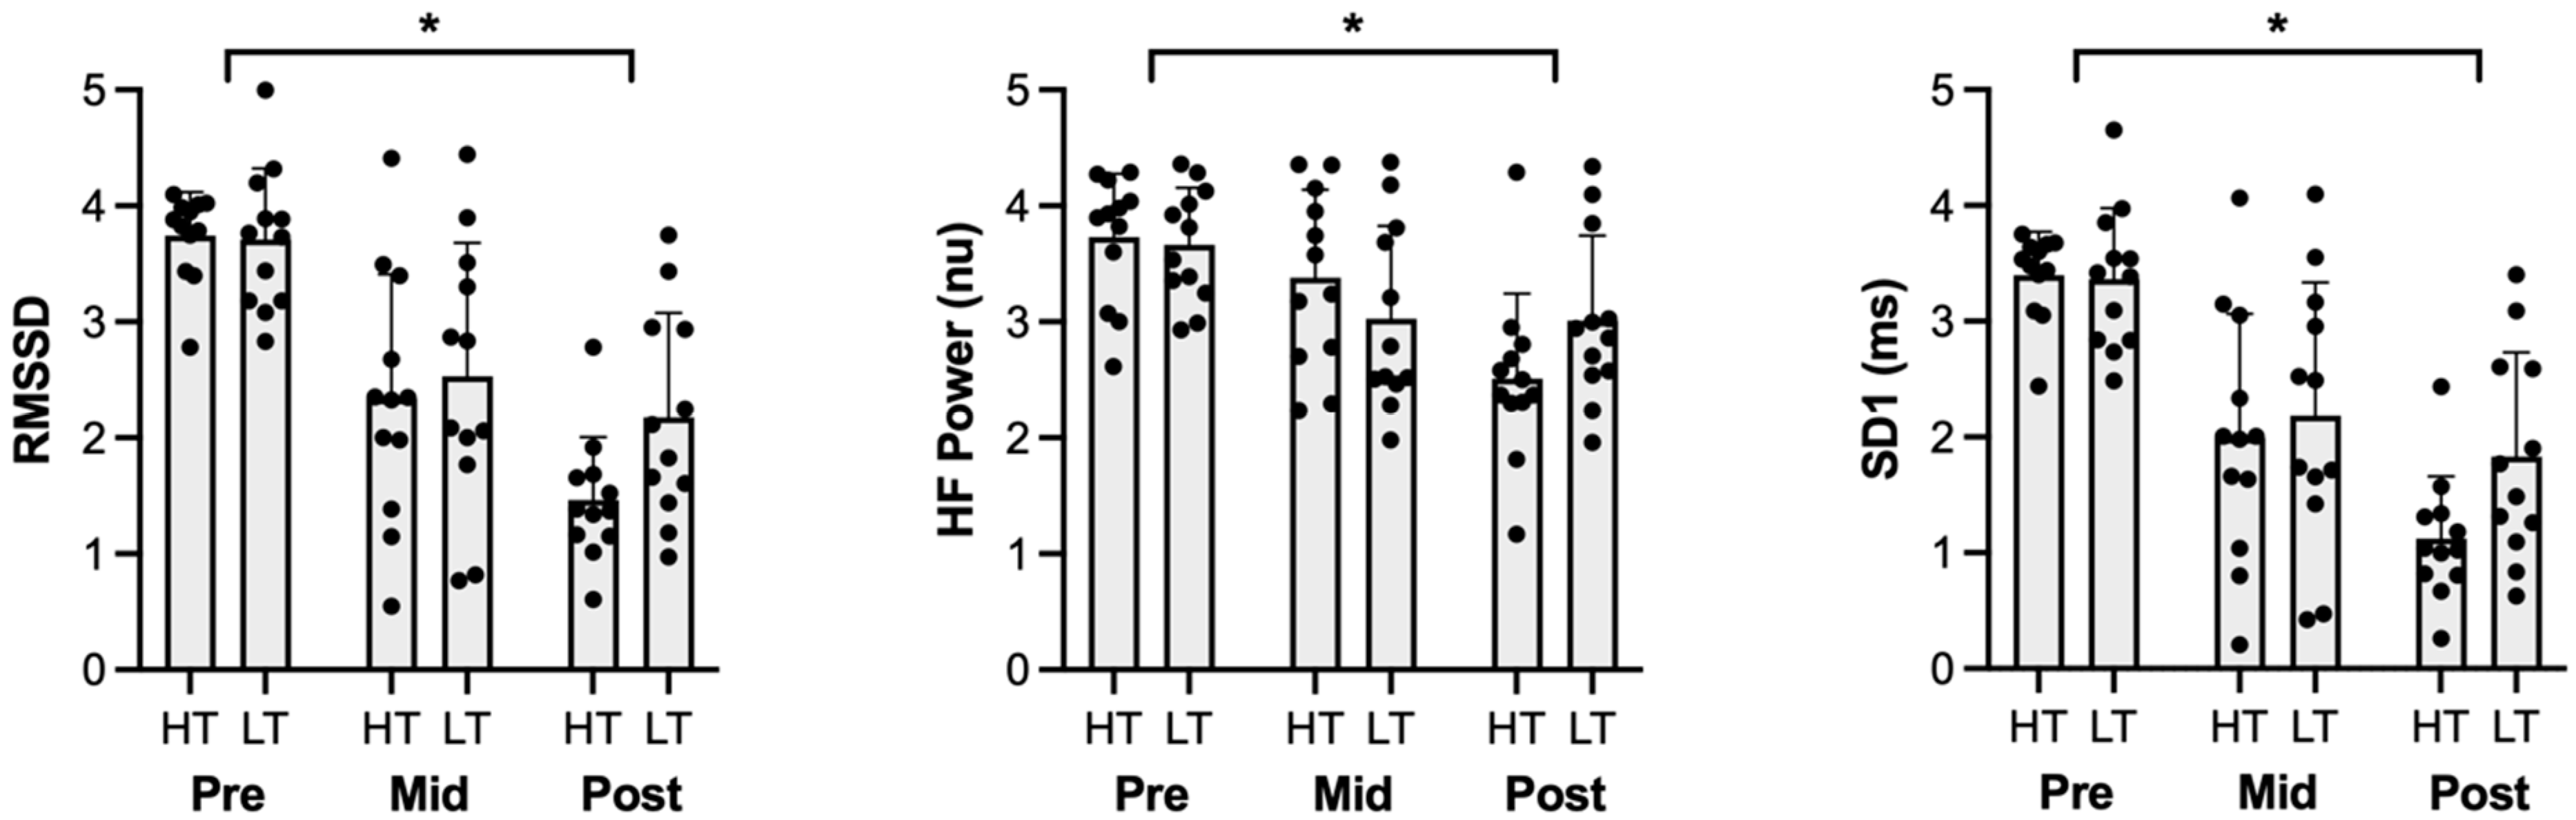
RMSSD decreased across all time points (Pre: 3.7 ± 0.5, Mid: 2.4 ± 1.1, Post: 1.8 ± 0.8; Pre vs. Mid, Pre vs. Post, Mid vs. Post, p < 0.01; Figure 1). There were no differences between conditions (p = 0.09). A significant time × condition interaction indicated a progressive RMSSD decline in HT (Pre: 3.7 ± 0.4, Mid: 2.3 ± 1.1, Post: 1.5 ± 0.5; Pre vs. Mid, Pre vs. Post Mid vs. Post, p < 0.01). RMSSD in the LT condition decreased from Pre to Mid (Pre: 3.7 ± 0.61; Mid: 2.5 ± 1.15, p < 0.01) and Pre to Post (2.2 ± 0.90, p < 0.01) but remained stable from Mid to Post (p = 0.39).
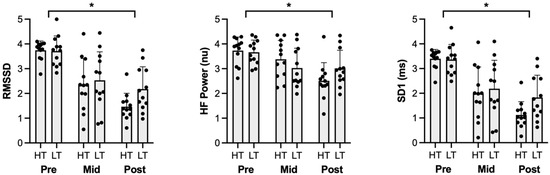
Figure 1.
Parasympathetic heart-rate variability metrics for Pre, Mid, and Post time points. RMSSD, HF Power, and SD1 experienced significant reductions across all time points, irrespective of condition. HT: high thirst, LT: low thirst, RMSSD: root mean square of successive differences, HF: high frequency, SD1: standard deviation of the Poincaré plot perpendicular to the line of identity. * Signifies significant difference (p < 0.05).
2.3. Decreases Parasympathetic Activity Measured by Frequency Domain
LF power increased across all time points (Pre: 54.9 ± 20 nu, Mid: 67.2 ± 24.6 nu, Post: 78.3 ± 20.7 nu, Pre vs. Mid, Pre vs. Post, p < 0.01; Mid vs. Post, p = 0.017). There were no significant differences between conditions (p = 0.4) or interactions (p = 0.07).
HF power decreased across all time points (Pre: 3.7 ± 0.5 nu, Mid: 3.2 ± 0.8 nu, Post: 2.8 ± 0.8 nu, Pre vs. Mid, Pre vs. Post, p < 0.01; Figure 1). There were no significant differences between conditions (p = 0.8). A significant time × condition interaction demonstrated that HF power was maintained during HT from Pre (3.7 ± 0.6 nu) to Mid (3.4 ± 0.8 nu, p = 0.21) but decreased from Pre to Post (2.5 ± 0.7 nu, p < 0.01) and from Mid to Post (p < 0.01). In LT, HF power decreased from Pre (3.7 ± 0.5 nu) to Mid (3.0 ± 0.8 nu, p < 0.01) and from Pre to Post (3.0 ± 0.7 nu, p < 0.01), but no differences from Mid to Post (p = 0.99).
The LF/HF ratio increased across time points (Pre: 0.2 ± 0.9, Mid: 0.9 ± 1.2, Post: 1.5 ± 1.1; Pre vs. Mid, p = 0.01, Pre vs. Post, p < 0.01, Mid vs. Post p = 0.016). There were no significant differences between conditions (p = 0.97). A significant time × condition interaction revealed that in HT, the LF/HF ratio remained unchanged from Pre (0.2 ± 0.9) to Mid (0.7 ± 1.2, p = 0.29), but increased from Pre to Post (1.9 ± 1.0, p < 0.01) and from Mid to Post (p < 0.01). In LT, the LF/HF ratio increased from Pre (0.3 ± 0.9) to Mid (1.2 ± 1.3, p = 0.01) and from Pre to Post (1.2 ± 1.1, p = 0.017), whereas Mid to Post remained unchanged (p = 0.99).
2.4. Parasympathetic and Sympathovagal Balance Is Decreased Measured by Non-Linear Measures
SD1 decreased across all time points (Pre: 3.4 ± 0.0 ms, Mid: 2.1 ± 1.1 ms, Post: 1.5 ± 0.8 ms; Pre vs. Mid, Pre vs. Post, Mid vs. Post, p < 0.01; Figure 1). There were no differences between groups (p = 0.09). A significant time × condition interaction revealed a decline in HT (Pre: 3.4 ± 0.4 ms, Mid: 2.0 ± 1.1 ms, Post: 1.1 ± 0.5 ms; Pre vs. Mid, Pre vs. Post, Mid vs. Post, p = 0.021). In LT, SD1 decreased from Pre (3.4 ± 0.6 ms) to Mid (2.2 ± 1.2 ms, p < 0.01) and Pre to Post (1.8 ± 0.9 ms, p < 0.01) but remained stable from Mid to Post (p = 0.39).
SD2 increased between all time points (Pre: 2.0 ± 0.5 ms, Mid: 3.1 ± 1.3 ms, Post: 3.4 ± 1.1 ms; Pre vs. Mid, Pre vs. Post Mid vs. Post, p < 0.01). SD2 was higher in LT (3.4 ± 0.8 ms) than HT (3.1 ± 0.9 ms, p = 0.03). A significant time × condition interaction showed SD2 declined in HT over all time points (Pre: 4.0 ± 0.3 ms, Mid: 3.0 ± 0.9 ms, Post: 2.4 ± 0.5 ms; Pre vs. Mid, Pre vs. Post, p < 0.01, Mid to Post, p = 0.02). In LT, SD2 decreased from Pre (4.0 ± 0.4 ms) to Mid (3.2 ± 0.7 ms, p = 0.01) and Pre to Post (2.9 ± 0.7 ms, p < 0.01) but did not change from Mid to Post (p = 0.16).
SD1/SD2 ratio increased over between Pre (1.9 ± 0.5) to Mid (3.07 ± 1.34, p < 0.01) and Pre to Post (3.4 ± 1.1, p < 0.01), but not Mid vs. Post (p = 0.3). No difference between conditions (p = 0.5) or a significant time × condition interaction (p = 0.09) was observed.
3. Discussion
The present study investigated the effects of thirst sensation with oral and IV rehydration on autonomic regulation measured by HRV. This study finds that oral fluid ingestion and further reduced thirst resulted in greater parasympathetic activation, as evidenced by increased RMSSD and HF power, and decreased SD1, compared to IV rehydration.
3.1. Reducing Thirst Increases Parasympathetic Activation
The act of drinking increased parasympathetic activity, consistent with previous studies [10,11]. Despite prior studies investigating drinking irrespective of exercise, the collective findings suggest that drinking is essential in maintaining parasympathetic activity between exercise bouts. This is important because greater parasympathetic activation between exercise bouts has been demonstrated to increase subsequent performance by facilitating cardiovascular recovery and reducing physiological stress [22,23,24]. This may explain the faster time trials observed in the drinking conditions compared to IV, since there was an attenuation of parasympathetic variables after the 90 min of exercise and after the 12 km time trial (Mid to Post) [21].
The increase in parasympathetic activity may be explained by two mechanisms. First, the oropharyngeal reflex, which is activated by drinking and subsequently suppresses thirst, plays a role in regulating drinking behavior [8]. This may be a potential mechanism, because the aim of this study was to induce thirst sensation, and activation in this region has been associated with a reduced thirst response. Furthermore, Casa and colleagues3 demonstrated that stimulating the oropharyngeal region through oral drinking increased stroke volume compared to IV infusion. Stroke volume was not measured in our study; however, this suggests that increasing stroke volume while maintaining hydration status through the stimulation of the oropharyngeal reflex may be why parasympathetic activity increased. Thus, the stimulation of this reflex may influence the observed stress response.
The mechanism, proposed by Routledge et al., is gastric distension [10]. Gastric distension from water intake or ballon have been shown in both animal [14,15,16,17] and human studies [18] to enhance sympathetic activity [14,15,16,17]. In the current study, the drinking condition provided repeated small boluses of water, which may have continuously stimulated vagal afferents throughout the protocol, thereby contributing to sustained increases in HRV. Conversely, IV rehydration bypasses the gastrointestinal system, potentially explaining the lower parasympathetic activation observed. This may suggest that drinking itself and further, satiating thirst, is essential in parasympathetic maintenance during rest and exercise. However, the contribution of each mechanism has not been tested to our knowledge. Therefore, future research should investigate these mechanisms and their specific roles in autonomic regulation.
It is important to highlight one potential mechanism which involves IV rehydration and improvements in cardiovascular function [1]. IV rehydration facilitates rapid plasma volume restoration, thereby reducing cardiovascular strain which can maintain cardiovascular regulation, thereby increasing HRV by potentially reducing sympathetic activation and increasing parasympathetic activation during exercise. The current study demonstrates that the IV condition demonstrated an improved HRV measured by SDNN, irrespective of time. However, this was the only HRV-related variable significantly affected between conditions. This suggests that while IV rehydration may rapidly restore plasma volume, its impact on autonomic regulation during exercise may be limited. More research is necessary to confirm these findings.
3.2. Thirst Sensation and Sympathetic and Sympathovagal Responses
While parasympathetic activity increased during the drink condition, sympathetic-associated variables such as LF power were not significantly altered by thirst sensation. Despite the absence of changes in LF power, sympathovagal balance, as reflected by the LF/HF ratio and SD2, suggests a shift toward sympathetic dominance. However, this is likely driven by parasympathetic withdrawal rather than increased sympathetic activity. This reduction in parasympathetic tone may contribute to a shift in towards sympathetic activity, even in the absence of direct sympathetic activation. Furthermore, the current findings suggest that exercise may predominantly influence autonomic regulation more than thirst. Given that exercise influences sympathetic activity greater than thirst, this emphasizes the importance of drinking to increase parasympathetic activity between bouts of exercise. It is also possible that the HRV metrics used in this study were not sensitive enough to detect subtle sympathetic changes. Future research should incorporate direct assessments of autonomic function, such as muscle sympathetic nerve activity or plasma catecholamine measurements, to validate these findings and further elucidate the physiological mechanisms governing autonomic regulation during exercise and thirst.
3.3. Limitations
One limitation is that thirst involves both physiological and psychological aspects that could not be delineated within the context of this study, thus potentially influencing the HRV responses. However, this overlap strengthens the validity of the results, as it is applicable to how thirst is perceived in real-world contexts. Understanding thirst and its complexities emphasizes the importance of implementation of hydration strategies.
4. Methods
4.1. Participants
Twelve healthy male participants (mean ± standard deviation [SD]; age, 29 ± 12 years; body mass, 74.7 ± 7.9 kg; height, 179.4 ± 7.0 cm; maximal oxygen consumption [VO2max], 49.8 ± 6.6 mL·kg−1·min−1) were recruited for this study. Exclusion criteria were cardiovascular, metabolic, or respiratory disease, chronic health problems that affect thermoregulation, a history of heat-related illnesses, and currently taking medication influencing body temperature. Participants provided written and informed consent approved by the Institutional Review Board to take part in this study. Sample-size calculations by G*Power (version 3.1, Dusseldorf, Germany) determined six participants as the minimum to achieve the desired power level of 0.9, which was based on a previous study comparing IV and drinking [25].
4.2. Experimental Protocol
This study implemented a randomized cross-over design, with subjects visiting the laboratory on three separate occasions (Figure 2). The first visit was a maximal oxygen test to determine exercise intensity for the exercise protocol. The second and third visits involved an exercise testing protocol completed in randomized order.
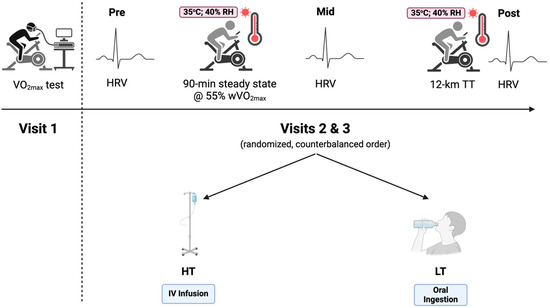
Figure 2.
Experimental study design. HRV: heart-rate variability; HT: high thirst; LT: low thirst; TT: time trial; VO2max: maximal oxygen consumption. Created with Biorender.com.
4.2.1. Visit 1: VO2max
Before testing, subjects provided a urine sample to ensure euhydration, which was determined as a urine-specific gravity (USG) of ≤1.020 (digital urine specific gravity refractometer, Atago, Tokyo, Japan). Participants then performed a warmup at a self-selected pace on an electronically braked cycle ergometer (Excalibur sport, Lode, Groningen, The Netherlands). Once participants subjectively determined their readiness, a step protocol was used, beginning at 150 W and increasing 50 W every 2 min until volitional exhaustion. Heart rate (HR) (H10®, Polar Electro™, Kempele, Finland), oxygen consumption (TrueOne® Metabolic Measurement System, PARVO MEDICS Inc., Sandy, UT, USA), respiratory exchange ratio and rating of perceived exertion (RPE) were collected throughout each phase of the step protocol. Exercise intensity for each trial was calculated from VO2max and wVO2max.
4.2.2. Visits 2 and 3: Experimental Conditions
Participants performed under two experimental conditions. In the high thirst (HT) condition, participants were IV-infused 25 mL of isotonic saline every 5 min via the antecubital fossa vein (SurFlash® Polyurethane IV Catheter 18G 1-1/4”, Terumo Medical Corporation, Somerset, NJ, USA) to induce thirst while preserving hydration status. Conversely, in the oral rehydration group or low thirst (LT) condition, participants consumed 25 mL of water orally every 5 min, matching the infused volume, to reduce the thirst sensation while maintaining equivalent hydration. Independent of the hydration method, the protocol was the same. Participants were randomized to their respective starting conditions based on participant number, with odd numbers assigned to the HT condition and even numbers to the LT condition.
On arrival, participants provided a urine sample, and the protocol proceeded if USG was <1.020. If participants did not meet euhydration requirements, another visit was scheduled. Urine was also analyzed for urine osmolality. Following urine collection, nude body mass was recorded before exercise, and a rectal thermistor (YSI probe, MP160; BIOPAC Systems Inc., Goleta, CA, USA) was inserted 10 cm past the anal sphincter to measure core temperature (Trec). Participants then entered an environmentally controlled heat chamber, where they remained for a 15 min equilibrium period before testing commenced. During this period, venous blood samples were drawn to assess hematocrit (HemataStat II, EKF Diagnostics, Penarth, UK) and hemoglobin (HemoPoint H2, Stanbio Laboratory, Boerne, TX, USA) for plasma volume change calculations. Participants laid supine while heart-rate variability (HRV) data were collected for five minutes using three ECG leads (Pre-) (YSI probe, MP160; BIOPAC Systems Inc., Goleta, CA, USA).
Once equilibrium was complete, participants performed steady-state cycling at 55% of their peak watt oxygen consumption (wVO2max) for 90 min in the heat (ambient temperature, 34.9 ± 0.6 °C; relative humidity, 30.3 ± 0.9%; wind speed, 3.4 miles·h−1). Trec and thirst sensation were measured every 5 min. The thirst scale consisted of a 125 mm line, with 0 mm (“not at all”) indicating no thirst and 125 mm (“extremely”) representing extreme thirst sensations. Thirst levels were quantified by treating the 0 mm anchor as 0% thirst and the 125 mm anchor as 100%. After completing the 90 min cycling protocol (Mid-), a second blood sample was collected, followed by a 3 min HRV assessment laying supine. Participants then performed a 12 km cycling time trial (Post-). Upon completion, nude body mass and a final blood sample were collected, followed by a five-minute HRV measurement.
All cardiac frequency recordings (R-R intervals) were extracted using Biopac AcqKnowledge software and analyzed in Kubios HRV Premium (version 3.5.0). Seven HRV variables were calculated: two in the time domain, five in the frequency domain, and two in the non-linear domain. Time-domain indices included the standard deviation of normal-to-normal intervals (SDNN), the root mean square of successive differences (RMSSD). Frequency-domain measures included low-frequency power (LF, 0.04–0.15 Hz), LF power normalized unites (nu) high-frequency power (HF, 0.15–0.4 Hz), HF power nu, and the LF:HF ratio. Non-linear indices included the standard deviation of the Poincaré plot perpendicular to (SD1), along (SD2) the line of identity, the SD1/SD2 ratio, sample entropy (SampEn), and detrended fluctuation analysis (DFAα1). Readers are encouraged to view the following reviews for further information for the HRV variables analyzed [26,27].
4.3. Statistical Analyses
Data were tested for normality using Shapiro–Wilk’s normality test, and all HRV variables were log transformed before selecting appropriate statistical analysis. For parametric data, a 3 × 2 (time × group) repeated ANOVA with Tukey’s post hoc analysis was utilized for SDNN, RMSSD, LF power, HF power, LF/HF ratio, SD1, SD2, and SD1/SD2 ratio. For non-parametric data, the Aligned Rank Transform (ART) was applied, followed by Holm–Bonferroni post hoc analysis for LF power. All analysis was conducted using RStudio Version 2025.03.0 (RStudio, Inc., Boston, MA, USA) and significance was set at a priori at p < 0.05.
5. Conclusions
The current study provides evidence that thirst sensation reduces parasympathetic activity overall, impacting sympathovagal balance. These findings highlight the importance of frequent drinking to limit thirst sensation to reduce stress and improve recovery between bouts of exercise. Moreover, this study reiterates the maintenance proper hydration and when exercising in heated environments. Our findings suggest that fluid replacement strategies should aim to preemptively mitigate the thirst sensation before it arises, while simultaneously minimizing dehydration with fluid replacement. Understanding the importance of stress of thirst on the stress response is essential for contexts such as sports, occupational settings, and military operations, where stress management is crucial in performance.
Author Contributions
Y.S. and A.T.K. designed research; Y.S., A.T.K. conducted research; Y.S., A.T.K., R.A.D. and M.S.K. analyzed the data. A.T.K. wrote the paper. Y.S. had primary responsibility for final content. All authors have read and agreed to the published version of the manuscript.
Funding
This study was supported by Yamaha Sport Challenge Grant.
Institutional Review Board Statement
The study was conducted in accordance with the Declaration of Helsinki, and approved by the Institutional Review Board of Texas Tech University (IRB2021-642, 27 November 2021).
Informed Consent Statement
Informed consent was obtained from all subjects involved in the study.
Data Availability Statement
Dataset available on request from the authors.
Acknowledgments
The authors would like to acknowledge the undergraduates who helped help collected the data.
Conflicts of Interest
The authors declare no conflicts of interest.
References
- Casa, D.J.; Ganio, M.S.; Lopez, R.M.; McDermott, B.P.; Armstrong, L.E.; Maresh, C.M. Intravenous versus Oral Rehydration: Physiological, Performance, and Legal Considerations. Curr. Sports Med. Rep. 2008, 7, S41. [Google Scholar] [CrossRef]
- Pyne, S. Intravenous Fluids Post Marathon. Sports Med. 2007, 37, 434–436. [Google Scholar] [CrossRef] [PubMed]
- Casa, D.J.; Maresh, C.M.; Armstrong, L.E.; Kavouras, S.A.; Herrera, J.A.; Hacker, F.T., Jr.; Keith, N.R.; Elliott, T.A. Intravenous versus oral rehydration during a brief period: Responses to subsequent exercise in the heat. Med. Sci. Sports Exerc. 2000, 32, 124–133. [Google Scholar] [CrossRef]
- Casa, D.J.; Maresh, C.M.; Armstrong, L.E.; Kavouras, S.A.; Herrera-Soto, J.A.; Hacker, F.T., Jr.; Scheett, T.P.; Stoppani, J. Intravenous versus Oral Rehydration during a Brief Period: Stress Hormone Responses to Subsequent Exhaustive Exercise in the Heat. Int. J. Sport Nutr. Exerc. Metab. 2000, 10, 361–374. [Google Scholar] [CrossRef]
- Kenefick, R.W.; Maresh, C.M.; Armstrong, L.E.; Castellani, J.W.; Riebe, D.; Echegaray, M.E.; Kavorous, S.A. Plasma vasopressin and aldosterone responses to oral and intravenous saline rehydration. J. Appl. Physiol. 2000, 89, 2117–2122. [Google Scholar] [CrossRef] [PubMed]
- Kenefick, R.W.; O’moore, K.M.; Mahood, N.V.; Castellani, J.W. Rapid IV versus Oral Rehydration: Responses to Subsequent Exercise Heat Stress. Med. Sci. Sports Exerc. 2006, 38, 2125. [Google Scholar] [CrossRef]
- Adams, J.D.; Sekiguchi, Y.; Suh, H.G.; Seal, A.D.; Sprong, C.A.; Kirkland, T.W.; Kavouras, S.A. Dehydration Impairs Cycling Performance, Independently of Thirst: A Blinded Study. Med. Sci. Sports Exerc. 2018, 50, 1697–1703. [Google Scholar] [CrossRef]
- Figaro, M.K.; Mack, G.W. Regulation of fluid intake in dehydrated humans: Role of oropharyngeal stimulation. Am. J. Physiol.-Regul. Integr. Comp. Physiol. 1997, 272, R1740–R1746. [Google Scholar] [CrossRef]
- Robertson, G.L. Abnormalities of thirst regulation. Kidney Int. 1984, 25, 460–469. [Google Scholar] [CrossRef]
- Routledge, H.C.; Chowdhary, S.; Coote, J.H.; Townend, J.N. Cardiac vagal response to water ingestion in normal human subjects. Clin. Sci. 2002, 103, 157–162. [Google Scholar] [CrossRef]
- Young, H.A.; Cousins, A.; Johnston, S.; Fletcher, J.M.; Benton, D. Autonomic adaptations mediate the effect of hydration on brain functioning and mood: Evidence from two randomized controlled trials. Sci. Rep. 2019, 9, 16412. [Google Scholar] [CrossRef]
- Aubert, A.E.; Seps, B.; Beckers, F. Heart rate variability in athletes. Sports Med. 2003, 33, 889–919. [Google Scholar] [CrossRef] [PubMed]
- Sekiguchi, Y.; Huggins, R.A.; Curtis, R.M.; Benjamin, C.L.; Adams, W.M.; Looney, D.P.; West, C.A.; Casa, D.J. Relationship Between Heart Rate Variability and Acute:Chronic Load Ratio Throughout a Season in NCAA D1 Men’s Soccer Players. J. Strength. Cond. Res. 2021, 35, 1103–1109. [Google Scholar] [CrossRef] [PubMed]
- Vacca, G.; Vono, P. The primary reflex effects of distension of the stomach on heart rate, arterial pressure and left ventricular contractility in the anaesthetized pig. Pflügers Arch. 1993, 425, 248–255. [Google Scholar] [CrossRef] [PubMed]
- Longhurst, J.C.; Ibarra, J. Sympathoadrenal mechanisms in hemodynamic responses to gastric distension in cats. Am. J. Physiol.-Heart Circ. Physiol. 1982, 243, H748–H753. [Google Scholar] [CrossRef]
- Vacca, G.; Mary, D.; Battaglia, A.; Grossini, E.; Molinari, C. The effect of distension of the stomach on peripheral blood flow in anaesthetized pigs. Exp. Physiol. 1996, 81, 385–396. [Google Scholar] [CrossRef]
- Longhurst, J.C.; Spilker, H.L.; Ordway, G.A. Cardiovascular reflexes elicited by passive gastric distension in anesthetized cats. Am. J. Physiol.-Heart Circ. Physiol. 1981, 240, H539–H545. [Google Scholar] [CrossRef]
- Rossi, P.; Andriesse, G.I.; Oey, P.L.; Wieneke, G.H.; Roelofs, J.M.M.; Akkermans, L.M.A. Stomach distension increases efferent muscle sympathetic nerve activity and blood pressure in healthy humans. J. Neurol. Sci. 1998, 161, 148–155. [Google Scholar] [CrossRef]
- Haberich, F.J. Osmoreception in the portal circulation. Fed. Proc. 1968, 27, 1137–1141. [Google Scholar]
- Nakai, M. Cardiovascular Responses to Gastric Hypo-Osmolar Stimulation in Anesthetized Dogs. Jpn. J. Physiol. 1993, 43, 335–346. [Google Scholar] [CrossRef]
- Sekiguchi, Y.; Ky, A.T.; Benjamin, C.L.; Griswold, J.A.; Kavouras, S.A.; Adams, J.D. Thirst sensation decreases exercise performance and increases core temperature and heart rate independent of hydration status. Under Review.
- Goldberger, J.J.; Le, F.K.; Lahiri, M.; Kannankeril, P.J.; Ng, J.; Kadish, A.H. Assessment of parasympathetic reactivation after exercise. Am. J. Physiol.-Heart Circ. Physiol. 2006, 290, H2446–H2452. [Google Scholar] [CrossRef] [PubMed]
- Buchheit, M.; Millet, G.P.; Parisy, A.; Pourchez, S.; Laursen, P.B.; Ahmaidi, S. Supramaximal Training and Postexercise Parasympathetic Reactivation in Adolescents. Med. Sci. Sports Exerc. 2008, 40, 362. [Google Scholar] [CrossRef] [PubMed]
- Buchheit, M.; Laursen, P.B.; Ahmaidi, S. Parasympathetic reactivation after repeated sprint exercise. Am. J. Physiol.-Heart Circ. Physiol. 2007, 293, H133–H141. [Google Scholar] [CrossRef] [PubMed]
- Maresh, C.M.; Herrera-Soto, J.A.; Armstrong, L.E.; Casa, D.J.; Kavouras, S.A.; Hacker, F.T., Jr.; Elliott, T.A.; Stoppani, J.; Scheett, T.P. Perceptual responses in the heat after brief intravenous versus oral rehydration. Med. Sci. Sports Exerc. 2001, 33, 1039. [Google Scholar] [CrossRef]
- Shaffer, F.; Ginsberg, J.P. An Overview of Heart Rate Variability Metrics and Norms. Front. Public. Health 2017, 5, 258. [Google Scholar] [CrossRef]
- Tiwari, R.; Kumar, R.; Malik, S.; Raj, T.; Kumar, P. Analysis of Heart Rate Variability and Implication of Different Factors on Heart Rate Variability. Curr. Cardiol. Rev. 2021, 17, 11–20. [Google Scholar] [CrossRef]

Disclaimer/Publisher’s Note: The statements, opinions and data contained in all publications are solely those of the individual author(s) and contributor(s) and not of MDPI and/or the editor(s). MDPI and/or the editor(s) disclaim responsibility for any injury to people or property resulting from any ideas, methods, instructions or products referred to in the content. |
© 2025 by the authors. Licensee MDPI, Basel, Switzerland. This article is an open access article distributed under the terms and conditions of the Creative Commons Attribution (CC BY) license (https://creativecommons.org/licenses/by/4.0/).