
Monitoring of Salivary Secretory Immunoglobulin A Quantified Two Methods During High-Altitude Volleyball Training Camp


Abstract
1. Introduction
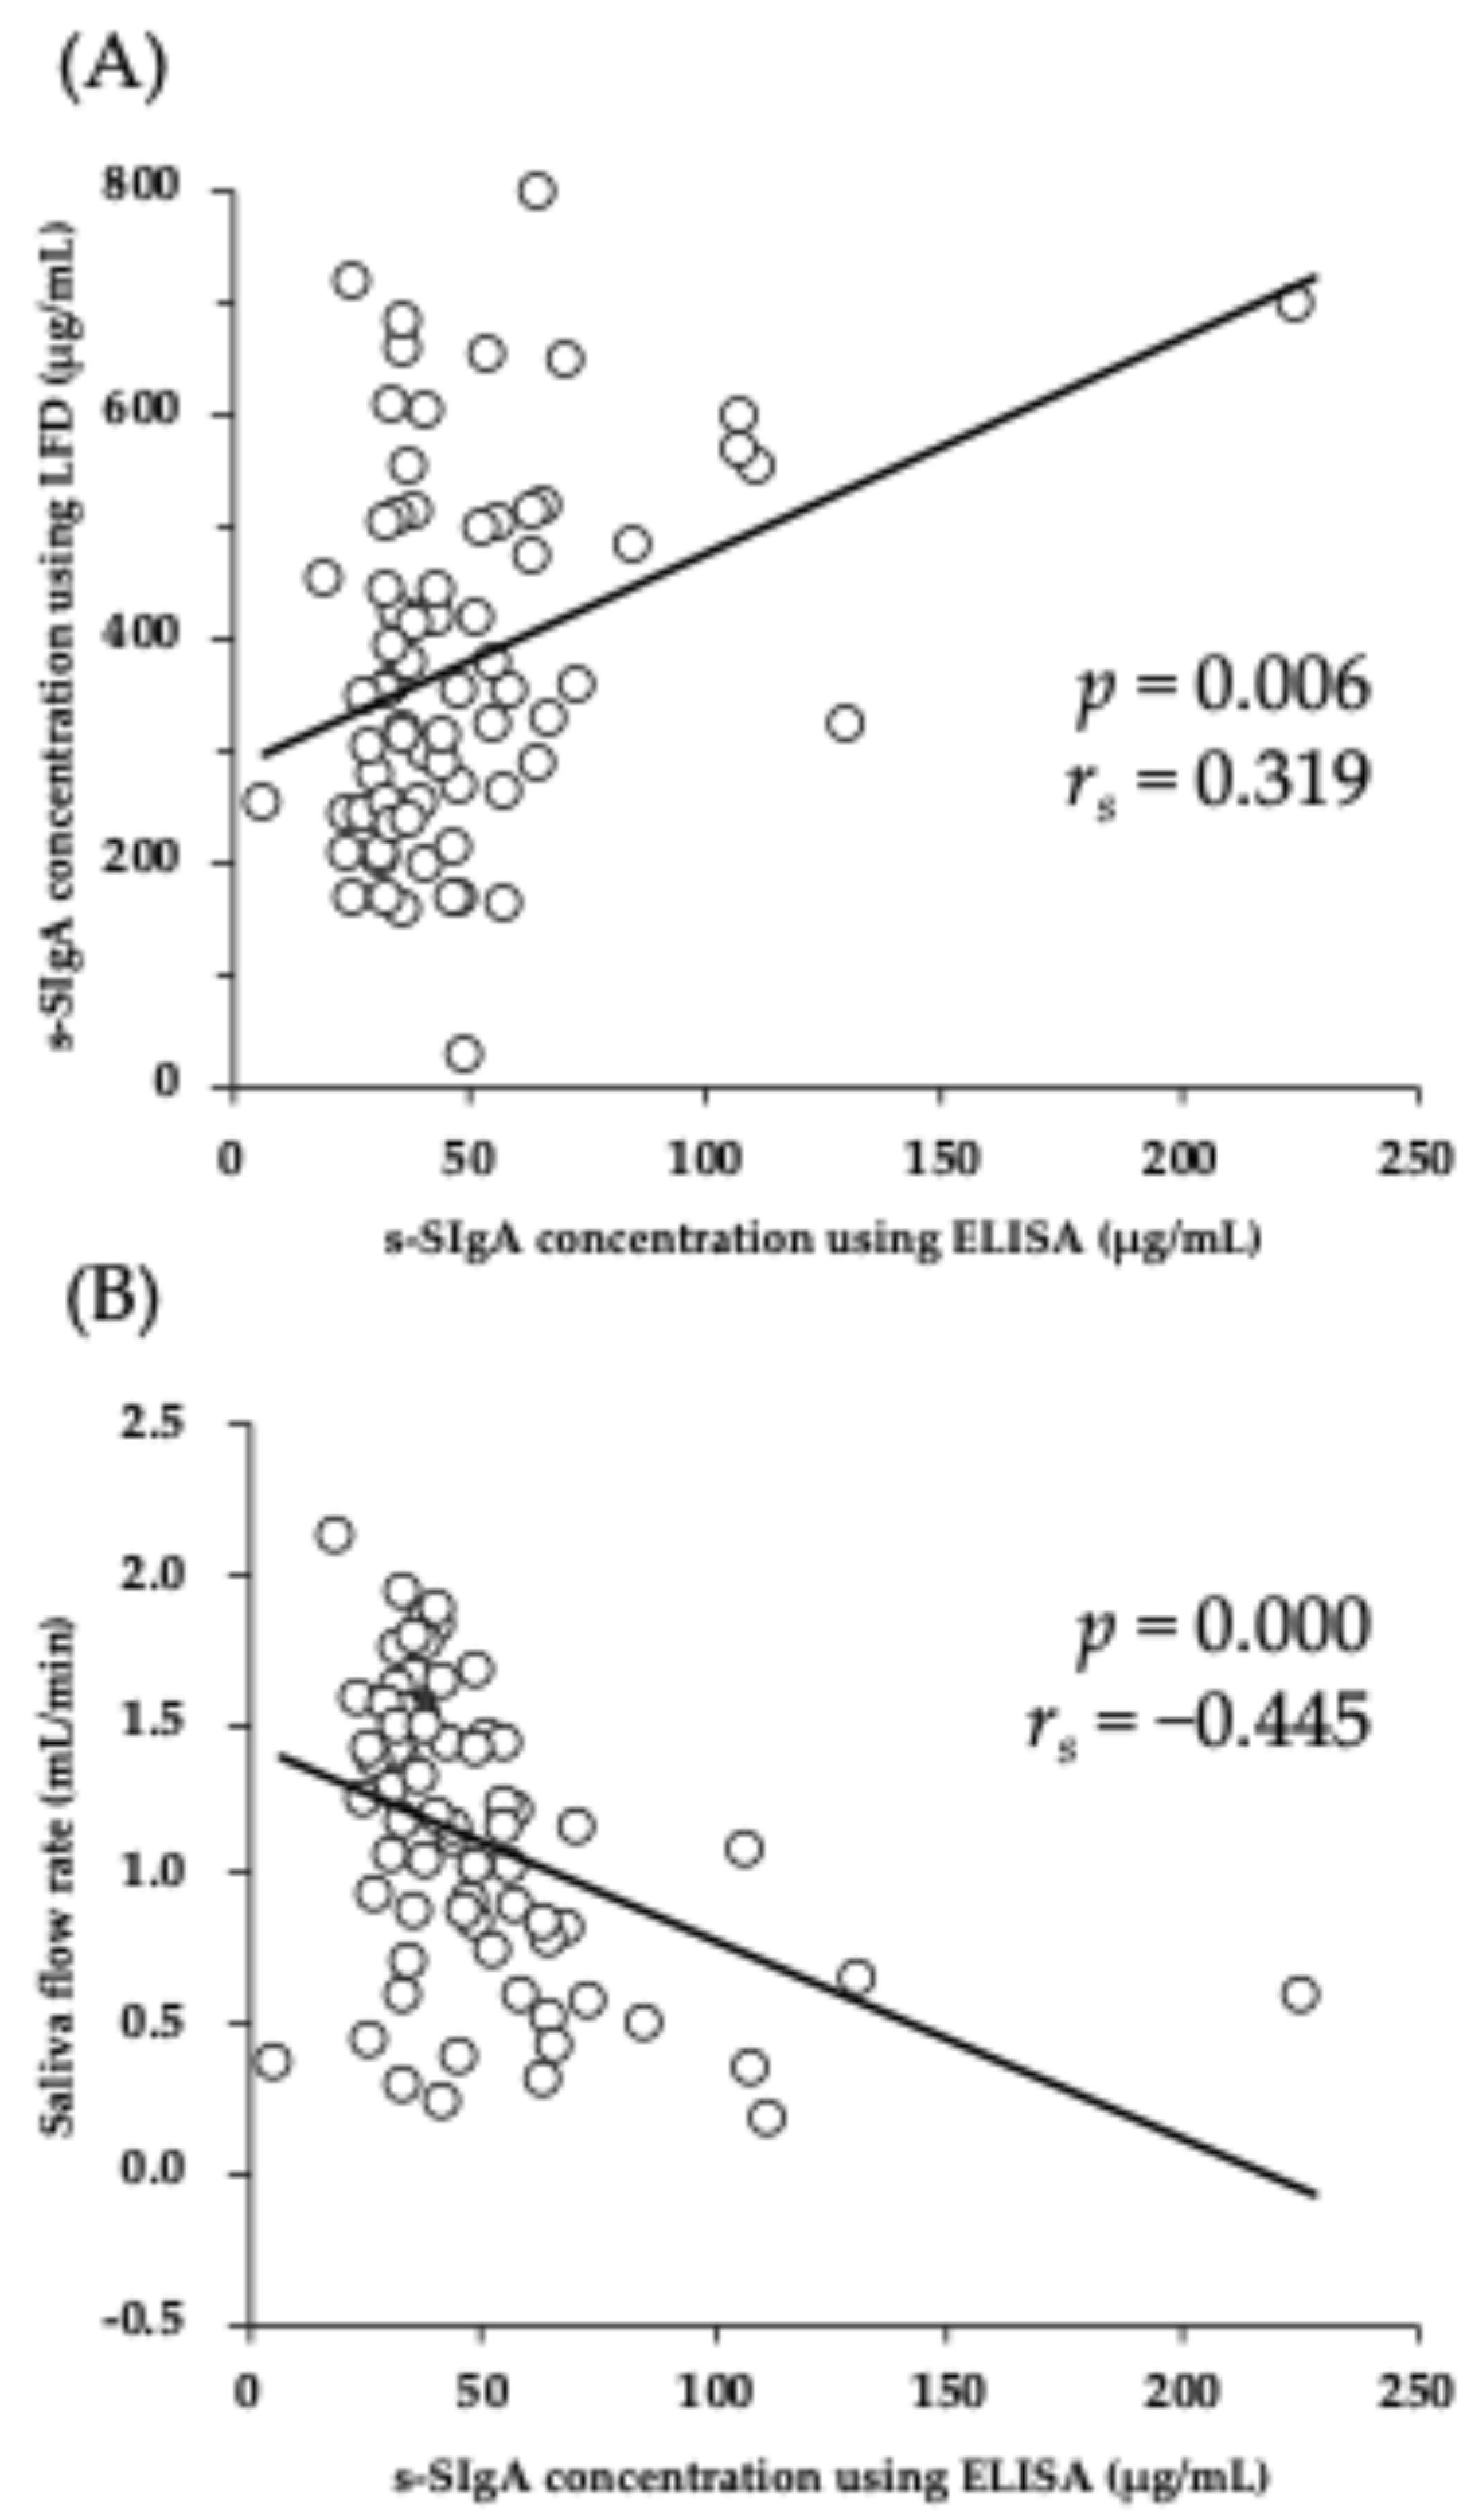
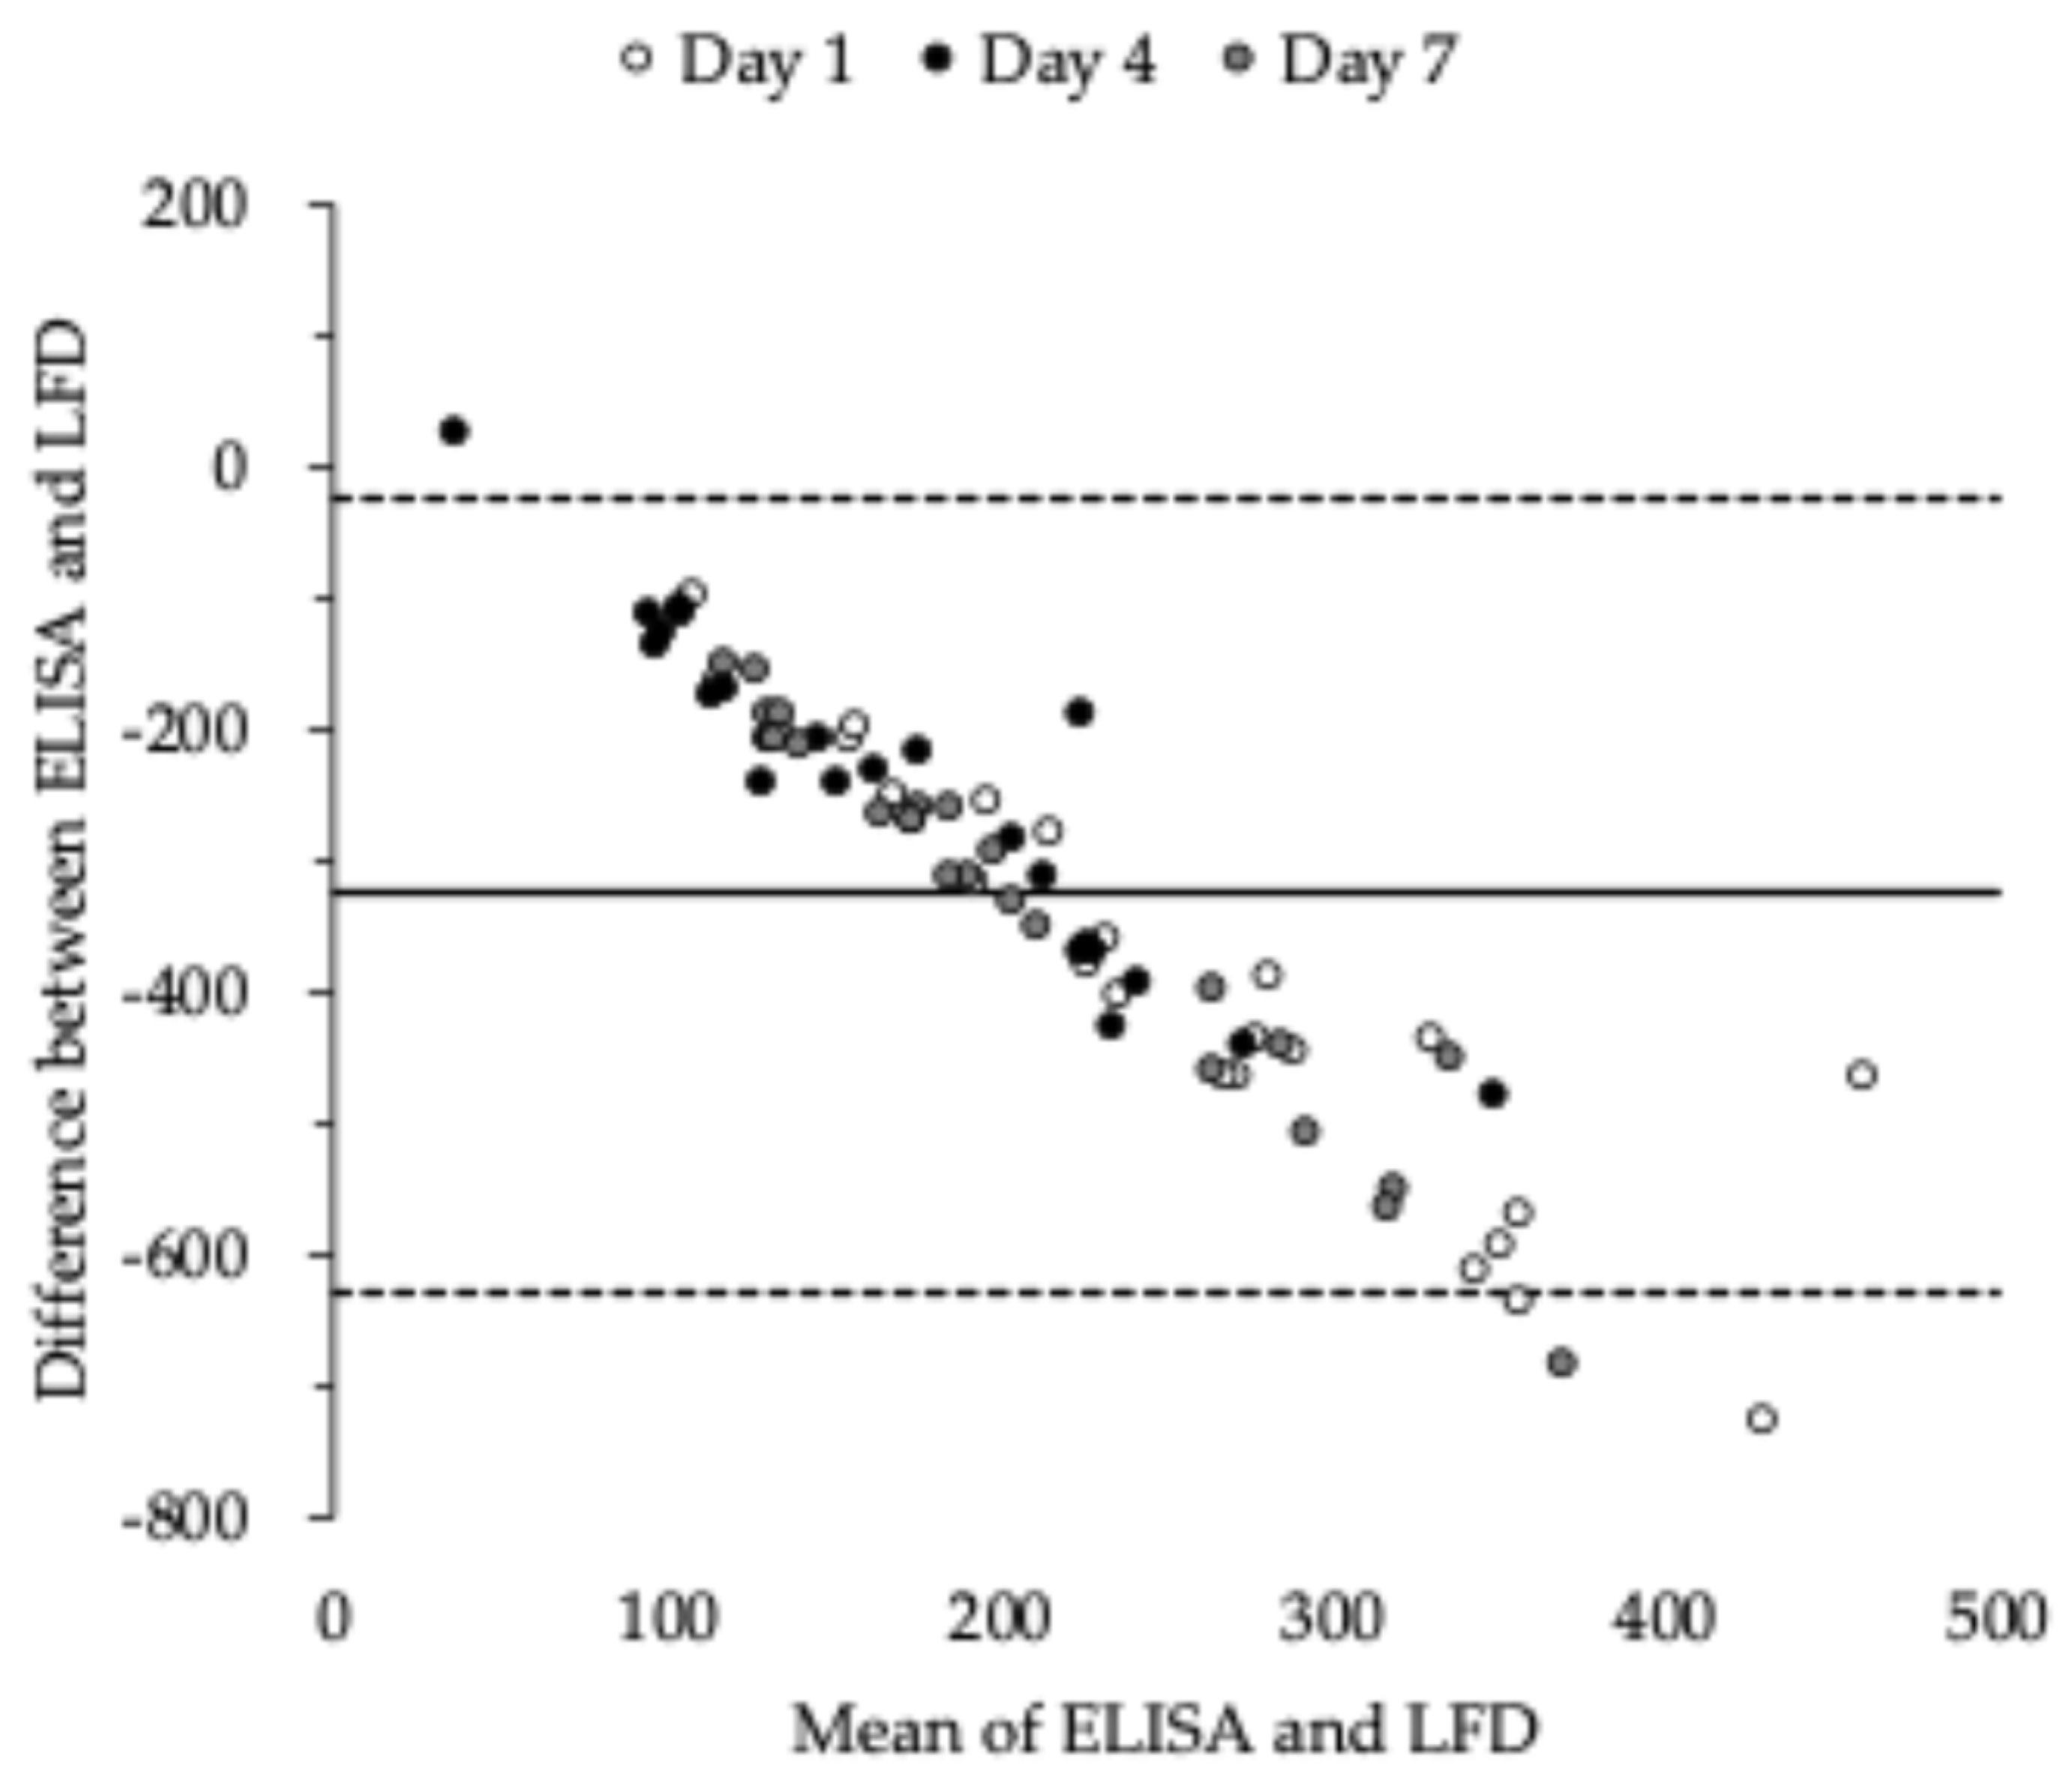
2. Results
3. Discussion
4. Materials and Methods
4.1. Ethics Approval
4.2. Experimental Approach
4.3. Participants
4.4. Saliva Sampling and Analysis
4.5. Physical Strength
4.6. Subjective Evaluation of Questionnaire
4.7. Statistical Analysis
5. Conclusions
Author Contributions
Funding
Institutional Review Board Statement
Informed Consent Statement
Data Availability Statement
Acknowledgments
Conflicts of Interest
References
- Nieman, D.C. Exercise, upper respiratory tract infection, and the immune system. Med. Sci. Sports Exerc. 1994, 26, 128–139. [Google Scholar] [CrossRef] [PubMed]
- Lamm, M.E. Interaction of antigens and antibodies at mucosal surfaces. Annu. Rev. Microbiol. 1997, 51, 311–340. [Google Scholar] [CrossRef] [PubMed]
- Mazanec, M.B.; Nedrud, J.G.; Kaetzel, C.S.; Lamm, M.E. A three-tiered view of the role of IgA in mucosal defense. Immunol. Today 1993, 14, 430–435. [Google Scholar] [CrossRef]
- Neville, V.; Gleeson, M.; Folland, J.P. Salivary IgA as a risk factor for upper respiratory infections in elite professional athletes. Med. Sci. Sports Exerc. 2008, 40, 1228–1236. [Google Scholar] [CrossRef]
- Fahlman, M.M.; Engels, H.J. Mucosal IgA and URTI in American college football players: A year longitudinal study. Med. Sci. Sports Exerc. 2005, 37, 374–380. [Google Scholar] [CrossRef]
- Moreira, A.; De Moura, N.R.; Coutts, A.; Costa, E.C.; Kempton, T.; Aoki, M.S. Monitoring internal training load and mucosal immune responses in futsal athletes. J. Strength Cond. Res. 2013, 27, 1253–1259. [Google Scholar] [CrossRef] [PubMed]
- Novas, A.M.; Rowbottom, D.G.; Jenkins, D.G. Tennis, Incidence of URTI and salivary IgA. Int. J. Sports Med. 2003, 24, 223–229. [Google Scholar] [CrossRef]
- Demel, U.; Domej, W.; Tilz, G.P. Function and repertoire of the immune system in body’s defense. Wien. Med. Wochenschr. 2000, 150, 175–177. [Google Scholar] [PubMed]
- Bailey, D.M.; Davies, B.; Castell, L.M.; Collier, D.J.; Milledge, J.S.; Hulin, D.A.; Seddon, P.S.; Young, L.S. Symptoms of infection and acute mountain sickness; associated metabolic sequelae and problems in differential diagnosis. High Alt. Med. Biol. 2003, 4, 319–331. [Google Scholar] [CrossRef]
- Wagenmakers, A.J. Amino acid metabolism, muscular fatigue and muscle wasting. Speculations on adaptations at high altitude. Int. J. Sports Med. 1992, 13, S110–S113. [Google Scholar] [CrossRef] [PubMed]
- Sone, R.; Yamamoto, K.; Ohishi, K. Effect of pre-season training camp on oral immune functions in elite collegiate volleyball players. J. Phys. Fit. Sports Med. 2021, 10, 39–44. [Google Scholar] [CrossRef]
- Watanabe, K.; Jesmin, S.; Murase, Y.; Takeda, T.; Shiraki, T.; Sengoku, Y. Effects of Repetitive Altitude Training on Salivary Immunoglobulin A Secretion in Collegiate Swimmers. J. Clin. Med. Res. 2019, 11, 550–555. [Google Scholar] [CrossRef] [PubMed]
- Akimoto, T.; Kumai, Y.; Akama, T.; Hayashi, E.; Murakami, H.; Soma, R.; Kuno, S.; Kono, I. Effects of 12 months of exercise training on salivary secretory IgA levels in elderly subjects. Br. J. Sports Med. 2003, 37, 76–79. [Google Scholar] [CrossRef]
- Murase, Y.; Shimizu, K.; Tanimura, Y.; Hanaoka, Y.; Watanabe, K.; Kono, I.; Miyakawa, S. Salivary extracellular heat shock protein 70 (eHSP70) levels increase after 59 min of intense exercise and correlate with resting salivary secretory immunoglobulin A (SIgA) levels at rest. Cell Stress Chaperones 2016, 21, 261–269. [Google Scholar] [CrossRef] [PubMed]
- Coad, S.; Gray, B.; Wehbe, G.; McLellan, C. Physical demands and salivary immunoglobulin A responses of elite Australian rules football athletes to match play. Int. J. Sports Physiol. Perform. 2015, 10, 613–617. [Google Scholar] [CrossRef] [PubMed]
- Owen, A.L.; Wong, D.P.; Dunlop, G.; Groussard, C.; Kebsi, W.; Dellal, A.; Morgans, R.; Zouhal, H. High-intensity training and salivary immunoglobulin A responses in professional top-level soccer players: Effect of training intensity. J. Strength Cond. Res. 2016, 30, 2460–2469. [Google Scholar] [CrossRef] [PubMed]
- Watanabe, K.; Jesmin, S.; Takeda, T.; Shiraki, T. Influence of Altitude Training on Brain Natriuretic Peptide and Atrial Natriuretic Peptide in Japanese Collegiate Swimmers. Int. J. Sport Exerc. Health Res. 2019, 3, 14–18. [Google Scholar] [CrossRef]
- Coad, S.; Mclellan, C.; Whitehouse, T.; Gray, B. Validity and reliability of a novel salivary immunoassay for individual profiling in applied sports science. Res. Sports Med. 2015, 23, 140–150. [Google Scholar] [CrossRef]
- Hopkins, W.G.; Marshall, S.W.; Batterham, A.M.; Hanin, J. Progressive statistics for studies in sports medicine and exercise science. Med. Sci. Sports Exerc. 2009, 41, 3–13. [Google Scholar] [CrossRef] [PubMed]
- Moreira, A.; Mortatti, A.L.; Arruda, A.F.S.; Freitas, C.G.; de Arruda, M.; Aoki, M.S. Salivary IgA response and upper respiratory tract infection symptoms during a 21-week competitive season in young soccer players. J. Strength Cond. Res. 2014, 28, 467–473. [Google Scholar] [CrossRef] [PubMed]
- Shimizu, K.; Sato, H.; Suga, Y.; Yamahira, S.; Toba, M.; Hamuro, K.; Kakumoto, K.; Kohda, N.; Akama, T.; Kono, I.; et al. The effects of Lactobacillus pentosus strain b240 and appropriate physical training on salivary secretory IgA levels in elderly adults with low physical fitness: A randomized, double-blind, placebo-controlled trial. J. Clin. Biochem. Nutr. 2014, 54, 61–66. [Google Scholar] [CrossRef] [PubMed]
- Morgans, R.; Owen, A.; Doran, D.; Drust, B.; Morton, J.P. Prematch salivary secretory immunoglobulin A in soccer players from the 2014 World Cup qualifying campaign. Int. J. Sports Physiol. Perform. 2015, 10, 401–403. [Google Scholar] [CrossRef]
- Bland, J.M.; Altman, D.G. Statistical methods for assessing agreement between two methods of clinical measurement. Lancet 1986, 1, 307–310. [Google Scholar] [CrossRef] [PubMed]


| Variable (n = 24) | Day 1 | Day 4 | Day 7 | Main Effect (Time) |
|---|---|---|---|---|
| Age (years) | 19.7 ± 1.3 | – | – | – |
| Height (cm) | 183.7 ± 9.2 | – | – | – |
| Body weight (kg) | 78.2 ± 10.9 | – | – | – |
| Volleyball experience (years) | 10.5 ± 2.7 | – | – | – |
| Total condition (mm) | 67.5 ± 17.3 | 66.6 ± 21.3 | 68.2 ± 16.4 | 0.859 |
| Fatigue (mm) | 43.2 ± 16.7 | 34.5 ± 20.2 * | 40.2 ± 16.8 | 0.075 |
| Psychological stress (mm) | 57.8 ± 18.1 | 57.5 ± 22.3 | 58.2 ± 22.2 | 0.977 |
| Physical stress (mm) | 44.3 ± 17.4 | 33.8 ± 19.9 * | 38.1 ± 13.5 | 0.015 |
| Upper-body incompatibility (mm) | 71.1 ± 18.3 | 56.3 ± 29.1 * | 59.6 ± 25.5 | 0.021 |
| Lower-body incompatibility (mm) | 47.1 ± 19.7 | 37.2 ± 23.8 | 42.8 ± 17.8 | 0.155 |
| Previous day’s performance (mm) | 48.0 ± 16.5 | 53.6 ± 20.8 | 45.8 ± 19.8 | 0.194 |
| Appetite (mm) | 59.9 ± 26.7 | 50.9 ± 29.3 * | 50.8 ± 28.7 * | 0.028 |
| Handgrip strength (kg) | 50.6 ± 8.0 | 48.4 ± 6.6 * | 48.7 ± 6.9 * | 0.008 |
| Vertical jump (cm) | 64.1 ± 7.1 | 61.5 ± 7.9 | 62.4 ± 8.6 | 0.160 |
| Saliva flow rate (mL/min) | 1.04 ± 0.51 | 1.22 ± 0.47 * | 1.09 ± 0.48 | 0.012 |
| ELISA: s-SIgA concentration (µg/mL) | 61.0 ± 40.3 | 46.6 ± 26.4 * | 42.9 ± 17.2 * | 0.003 |
| ELISA: s-SIgA secretion rates (µg/min) | 53.6 ± 25.0 | 53.3 ± 23.9 | 42.9 ± 17.1 * | 0.028 |
| LFD: s-SIgA concentration (µg/mL) | 453.0 ± 174.0 | 294.5 ± 133.5 * | 382.8 ± 144.7 * | 0.000 |
| Time | Day 1 | Day 2 | Day 3 | Day 4 | Day 5 | Day 6 | Day 7 |
|---|---|---|---|---|---|---|---|
| AM session (9:00–12:00) | Measure | Technical Training | Technical Training | Measure | Technical Training | Technical Training | Measure |
| PM session (15:00–18:00) | Tactical Training | Tactical Training | Tactical Training | OFF | Match Training | Match Training | Match Training |
Disclaimer/Publisher’s Note: The statements, opinions and data contained in all publications are solely those of the individual author(s) and contributor(s) and not of MDPI and/or the editor(s). MDPI and/or the editor(s) disclaim responsibility for any injury to people or property resulting from any ideas, methods, instructions or products referred to in the content. |
© 2025 by the authors. Licensee MDPI, Basel, Switzerland. This article is an open access article distributed under the terms and conditions of the Creative Commons Attribution (CC BY) license (https://creativecommons.org/licenses/by/4.0/).
Share and Cite
Sone, R.; Yamamoto, K.; Tamai, S.; Goji, H.; Ohishi, K. Monitoring of Salivary Secretory Immunoglobulin A Quantified Two Methods During High-Altitude Volleyball Training Camp. Physiologia 2025, 5, 8. https://doi.org/10.3390/physiologia5010008
Sone R, Yamamoto K, Tamai S, Goji H, Ohishi K. Monitoring of Salivary Secretory Immunoglobulin A Quantified Two Methods During High-Altitude Volleyball Training Camp. Physiologia. 2025; 5(1):8. https://doi.org/10.3390/physiologia5010008
Chicago/Turabian StyleSone, Ryota, Kenji Yamamoto, Shinsuke Tamai, Honoka Goji, and Kenji Ohishi. 2025. "Monitoring of Salivary Secretory Immunoglobulin A Quantified Two Methods During High-Altitude Volleyball Training Camp" Physiologia 5, no. 1: 8. https://doi.org/10.3390/physiologia5010008
APA StyleSone, R., Yamamoto, K., Tamai, S., Goji, H., & Ohishi, K. (2025). Monitoring of Salivary Secretory Immunoglobulin A Quantified Two Methods During High-Altitude Volleyball Training Camp. Physiologia, 5(1), 8. https://doi.org/10.3390/physiologia5010008