Article

Physiological Performance of Mimosa pudica L. under Different Light Quality and Photoperiods

Plant Bioenergetics and Biotechnology Laboratory, Department of Botany, Mohanlal Sukhadia University, Udaipur 313001, Rajasthan, India
*
Author to whom correspondence should be addressed.
Physiologia 2022, 2(4), 132-153; https://doi.org/10.3390/physiologia2040012
Submission received: 15 September 2022 / Revised: 27 October 2022 / Accepted: 28 October 2022 / Published: 2 November 2022

Abstract

:
In the present study, we examined the light quality and photoperiod-dependent physiological performance of Mimosa pudica. Plants were grown in pots under white, blue, green and red-light compositions under 12 h per day (12/12 h) and 24 h per day (24/0 h) for 12 days. After 12 days, the physiological parameters’ morphology, fresh weight, chlorophyll fluorescence and biochemical analyses, which include antioxidants, lipid peroxidation, pigment content and carbohydrate content were also measured. Necrosis was found in red, blue and green light and the plant was senesced at the end of the experiment. The blue 24-h light period showed the highest pigment and antioxidant content, whereas the lowest was observed in green light conditions. The OJIP curve was complete in white light, hence it was not completely formed in red, blue and green light. The phenomenological parameters also fluctuated in different light conditions. Photosynthesis ultimately results in starch content, which was highest in blue light and lowest in red light. Different monochromatic light qualities inhibited plant growth by reducing the activity of photosynthetic apparatus in plants. White light was more effective in driving photosynthesis and promoting the plant growth, while green and red light showed a suppressive effect on plants’ growth. The 24 h photoperiod was also accompanied by various spectra to reduce the plants’ growth. The results clearly indicate that the photoperiod and light spectrum must be considered before growing plants in a greenhouse.

1. Introduction

Various abiotic factors such as temperature, light, water, gases and minerals are essential for the plant life-cycle. Among them, light is an important environmental factor that is the chief source of energy for plant photosynthesis and affects the growth and development of plants [1]. Plants have many photoreceptors to sense the quantity and quality of light, likewise cryptochrome, phytochrome, phytotropins etc. These photoreceptors sense light and change it into biochemical signals, which lead to changes in the physiology and morphology of plants [2]. In recent years, much research has proved that Light-Emitting Diodes (LEDs) are a suitable light source for lighting growth chambers and greenhouses for crop production [3]. For plants to perform their photosynthesis, it has been shown that a combination of different light spectrums, such as red, blue and white of varying intensities, is efficient and effective [4].
A specific spectrum stimulates different morphological and physiological responses in plants [5]. Any change in light quality can alter the physiology, morphology, growth and development of plants. However, these effects vary from species to species of plants [6]. In many plant species, stomatal opening was promoted by blue light, which enhanced the photosynthesis and dry matter production [7]. Plants grown under blue light regulated the formation of chlorophyll which increased chlorophyll a/b ratio, Light-Harvesting Complexes and Rubisco enzyme activity [8]. According to reports, long-term exposure to monochromatic red light lowers photosynthetic efficiency and causes photodamage [9]. On the contrary, blue light, perceived by cryptochrome and phototropins, enhances photosynthesis by increasing light absorption efficiency, minimizing photodamage and regulating gas exchange between leaves and the atmosphere [10]. Green light is more intense at deeper leaf tissue than blue or red light because green light is absorbed by chlorophyll less than either of the other spectra [11]. Green light variously affects seed germination, stem elongation, leaf hyponasty, leaf expansion, photosynthesis and biomass accumulation [12]. In tomatoes, plants cultivated using monochromatic light (red, blue and green) showed lower height, biomass and leaf area than those grown under white (W) light [13]. Blue (B) and Red (R) LED increased the shoot regeneration, chlorophyll, carotenoid, and polyphenol in Swertia chirata [14].
Plant growth is mostly regulated by the photoperiod, which play a role as a signal. The photoperiod affects the vegetative growth and flower initiation of plants, secondary metabolite levels, and fresh and dry weights [15]. An important environmental factor that is directly linked to the development and quality of crops cultivated in greenhouses is photosynthetic daily light integral. The daily light integral (the product of the light intensity and the photoperiod (DLI)) can be increased through the application of supplementary light; additionally, increasing the DLI in certain situations can shorten growth cycles, promote carbohydrate accumulation and increase the crop yield and the nutritional quality of plants [16]. Previous studies reported the extension of the photoperiod in a weak light environment to enhance DLIs, which could replace the high-intensity light [17]. It was found that lettuce plants grown under red and blue continuous light for 15 days obtained greater shoot biomass and ascorbate pool size without leaf injury [18].
Under different light environment, plant faces stress condition which enhanced the production of reactive oxygen species (ROS). The ROSs play a pivotal role in plant metabolism and stress responses which regulates cell wall development and activates the antimicrobial defense mechanism [19]. However, as toxic by-products of aerobic metabolism, ROSs also damage plants’ cells as well as photosynthetic apparatuses, nucleic acids, protein and oxidized the membrane [20]. The main sources of ROS are the photosynthetic electron transport chains in photosystems I and II as well as photorespiration, which can affect chlorophyll stability and reduce photosynthetic activity. [21]. Plants have triggered various mechanisms to alleviate these damages by increases heat dissipation, ROS scavenging antioxidant enzymes, e.g., superoxide dismutase (SOD), catalase (CAT), peroxidase (POD) and ascorbate peroxidase (APX), soluble antioxidants, e.g., flavonoids, anthocyanins and various types of secondary metabolites [22].
Information on the absorption of radiation and the resulting photosynthetic reactions, as well as changes in the optical properties of leaves, can be a sensitive indicator of the physiological state of the plant and can characterize its needs, especially for photosynthetically active radiation [23]. The chlorophyll a fluorescence parameters have been used as markers to determine the status of photosynthetic apparatus, photochemical activity, and photosynthetic electron transport [24]. Previous studies have shown that the parameters of the fluorescence of chlorophyll a in leaves of plants cultured in a controlled environment are affected by light quality [25], quantity [26], or photoperiod [27].
Mimosa pudica L. (Fabaceae), is an annual or perennial herb. M. Pudica is reported to have sedative, emetic, and tonic properties, and has traditionally been used to treat various disorders such as alopecia, diarrhea, dysentery, insomnia, tumors, and various urogenital infections [28]. In the Mimosa genus, previous studies were mainly focused on chemical compounds, and clinical applications [29,30]. There has been no much study that investigates light quality effects on physiology of the M. pudica. This experiment was based on the hypothesis that the quality and duration of the applied light could have an effect on M. pudica and how its photosynthetic system would be responded as well as its physiological parameters. The aim of this study is to investigate the effect of different spectra light on morphology, physiology, antioxidant activity, proline and starch content of M. pudica.

2. Material and Methods

2.1. Growth and Light Conditions

The plants of M. pudica were collected from a plant nursery, Udaipur, India and grown in a pot with sterilized soil containing necessary minerals under controlled environment conditions with 23 °C temperature and relative humidity. The plants of M. pudica were placed on light shelves and were subjected to 12-day exposure to red light (RL) with a wavelength at 600–660 nm, blue light (BL) with a wavelength at 420–480 nm, white light (WL) with a wavelength at 380–760 nm and green light (GL) with a wavelength at 500–560 nm (Figure 1). Black sheet was used to cover each shelf to prevent light contamination. Plants were kept in two photoperiodic conditions, 12/12 h and 24/0 h (continuous light) at an equal light intensity of 135 μmol m−2s−1 photosynthetic PFD, which was kept constant by maintaining the distance between the LEDs and the plant canopy. The absorption spectra of white, blue, red and green LED were measured with the help of Perkin Elmer UV/Vis spectrometer which showed a peak at 422 nm, 491 nm and 609 nm, respectively. Plants were harvested for analyses on the 0th, 3rd, 6th, 9th and 12th day of light treatment. Plants grown at 12/12 h light periods in each condition were considered as control plants.

2.2. Biochemical Analysis

Superoxide dismutase (SOD) activity was assayed as per the method given by Beauchamp and Fridovich (1971) with slight modifications [31]. The inhibition ability of photochemical reduction of nitro blue tetrazolium (NBT) by SOD was measured. SOD measures the inhibition of the photochemical reduction of NBT by the enzyme in the reaction mixture at 560 nm.
Catalase activity was determined by Aebi (1984) [32]. Catalase catalyzes the decomposition of H2O2 to water and oxygen. Catalase activity can be measured subsequently either by the decomposition of H2O2 or the liberation of O2. H2O2 shows a constant increase in absorption along with the decreasing wavelength in the UV range. The difference in extinction per unit time gives measure of catalase activity.
The Guaiacol H2O2 method was used for assaying the activity of peroxidase [33]. To a clean cuvette with a 1.0 cm light path, 2.0 mL of 0.05 M phosphate buffer, pH 7.0, 1.0 mL of 1% guaiacol and 0.2 mL of enzyme extract were added and the absorbance was set zero at 470 nm. A total of 0.2 mL of 0.3% hydrogen peroxide was quickly mixed to initiate the reaction and changes in absorbance were recorded for every 15 s up to 3 min. Increase in absorbance per unit time was calculated from the linear phase of enzyme velocity.
Free proline was assessed spectrophotometrically as per the rules of Bates et al., (1973) [34]. Then, 200 mg of leaf samples were homogenized by pestle mortar utilizing 5 mL 3% sulfosalicylic acid and centrifuged at 5000 rpm for 15 min. The supernatant was utilized for proline estimation. Proline content was expressed as mg g-1 fresh weight of tissue.
Lipid peroxidation was tested in the leaves of both control and experimental plants. The MDA content in samples was estimated by the method of Heath and Packer (1968) [35]. The MDA content was determined by subtracting the absorbance of the supernatant at 600 nm from 532 nm and using an absorbance coefficient at 155 mM cm−1.
Starch was measured by the method described by McCready et al. (1950) [36]. The absorbance was recorded at 630 nm. The final content of starch was calculated from a standard curve plotted with a known concentration of glucose.
The chlorophyll content was determined by extracting leaf material in DMF using Porra et al. (1989) [37]. Fresh leaves from the experimental plants were taken for the determination of photosynthetic pigments e.g., total Chl. The absorbance of the supernatant was recorded at 646.8, 663.84 and 750 nm using a double beam UV–Vis Spectrophotometer (Shimandzu, Kyoto, Japan).

2.3. Fluorescence Analysis

Chlorophyll fluorescence measurements were performed on intact leaves on the 0th and 12th day of the light treatments. During the measurements, the middle portion of the first fully expanded leaf was dark-adapted for 20 min using a leaf clip (Hansatech Instruments, King’s Lynn, England). A Plant Efficiency Analyzer, Handy PEA (Hansatch Instruments, King’s Lynn, England), was used to analyze the parameters of chlorophyll fluorescence just after dark adaptation. On a logarithmic timescale, the chlorophyll fluorescence transients were recorded up to 1 s. The OJIP transient for chlorophyll fluorescence (also known as the OJIP curve) was then calculated. The OJIP curve provides valuable information on the function and activity of photosystem II [38]. Selected parameters quantifying activity of PSII were calculated from the original data as described by Strasser et al. (2000) [39].

2.4. Statistics

The graphs were created using Microsoft Office, and the data analysis was carried out using SPSS (v. 21.0) software. In the paper, all values are means of three independent replicates. Data were statistically analysed using one-way ANOVA tests, and significant differences were determined using Tukey (HSD) tests at p ≤ 0.05.

3. Results

3.1. Plant Morphology and Growth Characteristics

Prominent morphological variation was observed under different light conditions (Figure 1 and Figure 2). At the end of the experiment the leaves of 12/12 h and CL-light grown plants showed senescence in RL, BL and GL (Figure 1 and Figure 2). The leaves were pale green and a red color was found on the margins of the leaves. The extent of change was more pronounced in the case of GL as compared to that of WL, RL and BL irradiated plants.

3.2. Biochemical Changes in Light

3.2.1. Effects on SOD Activity

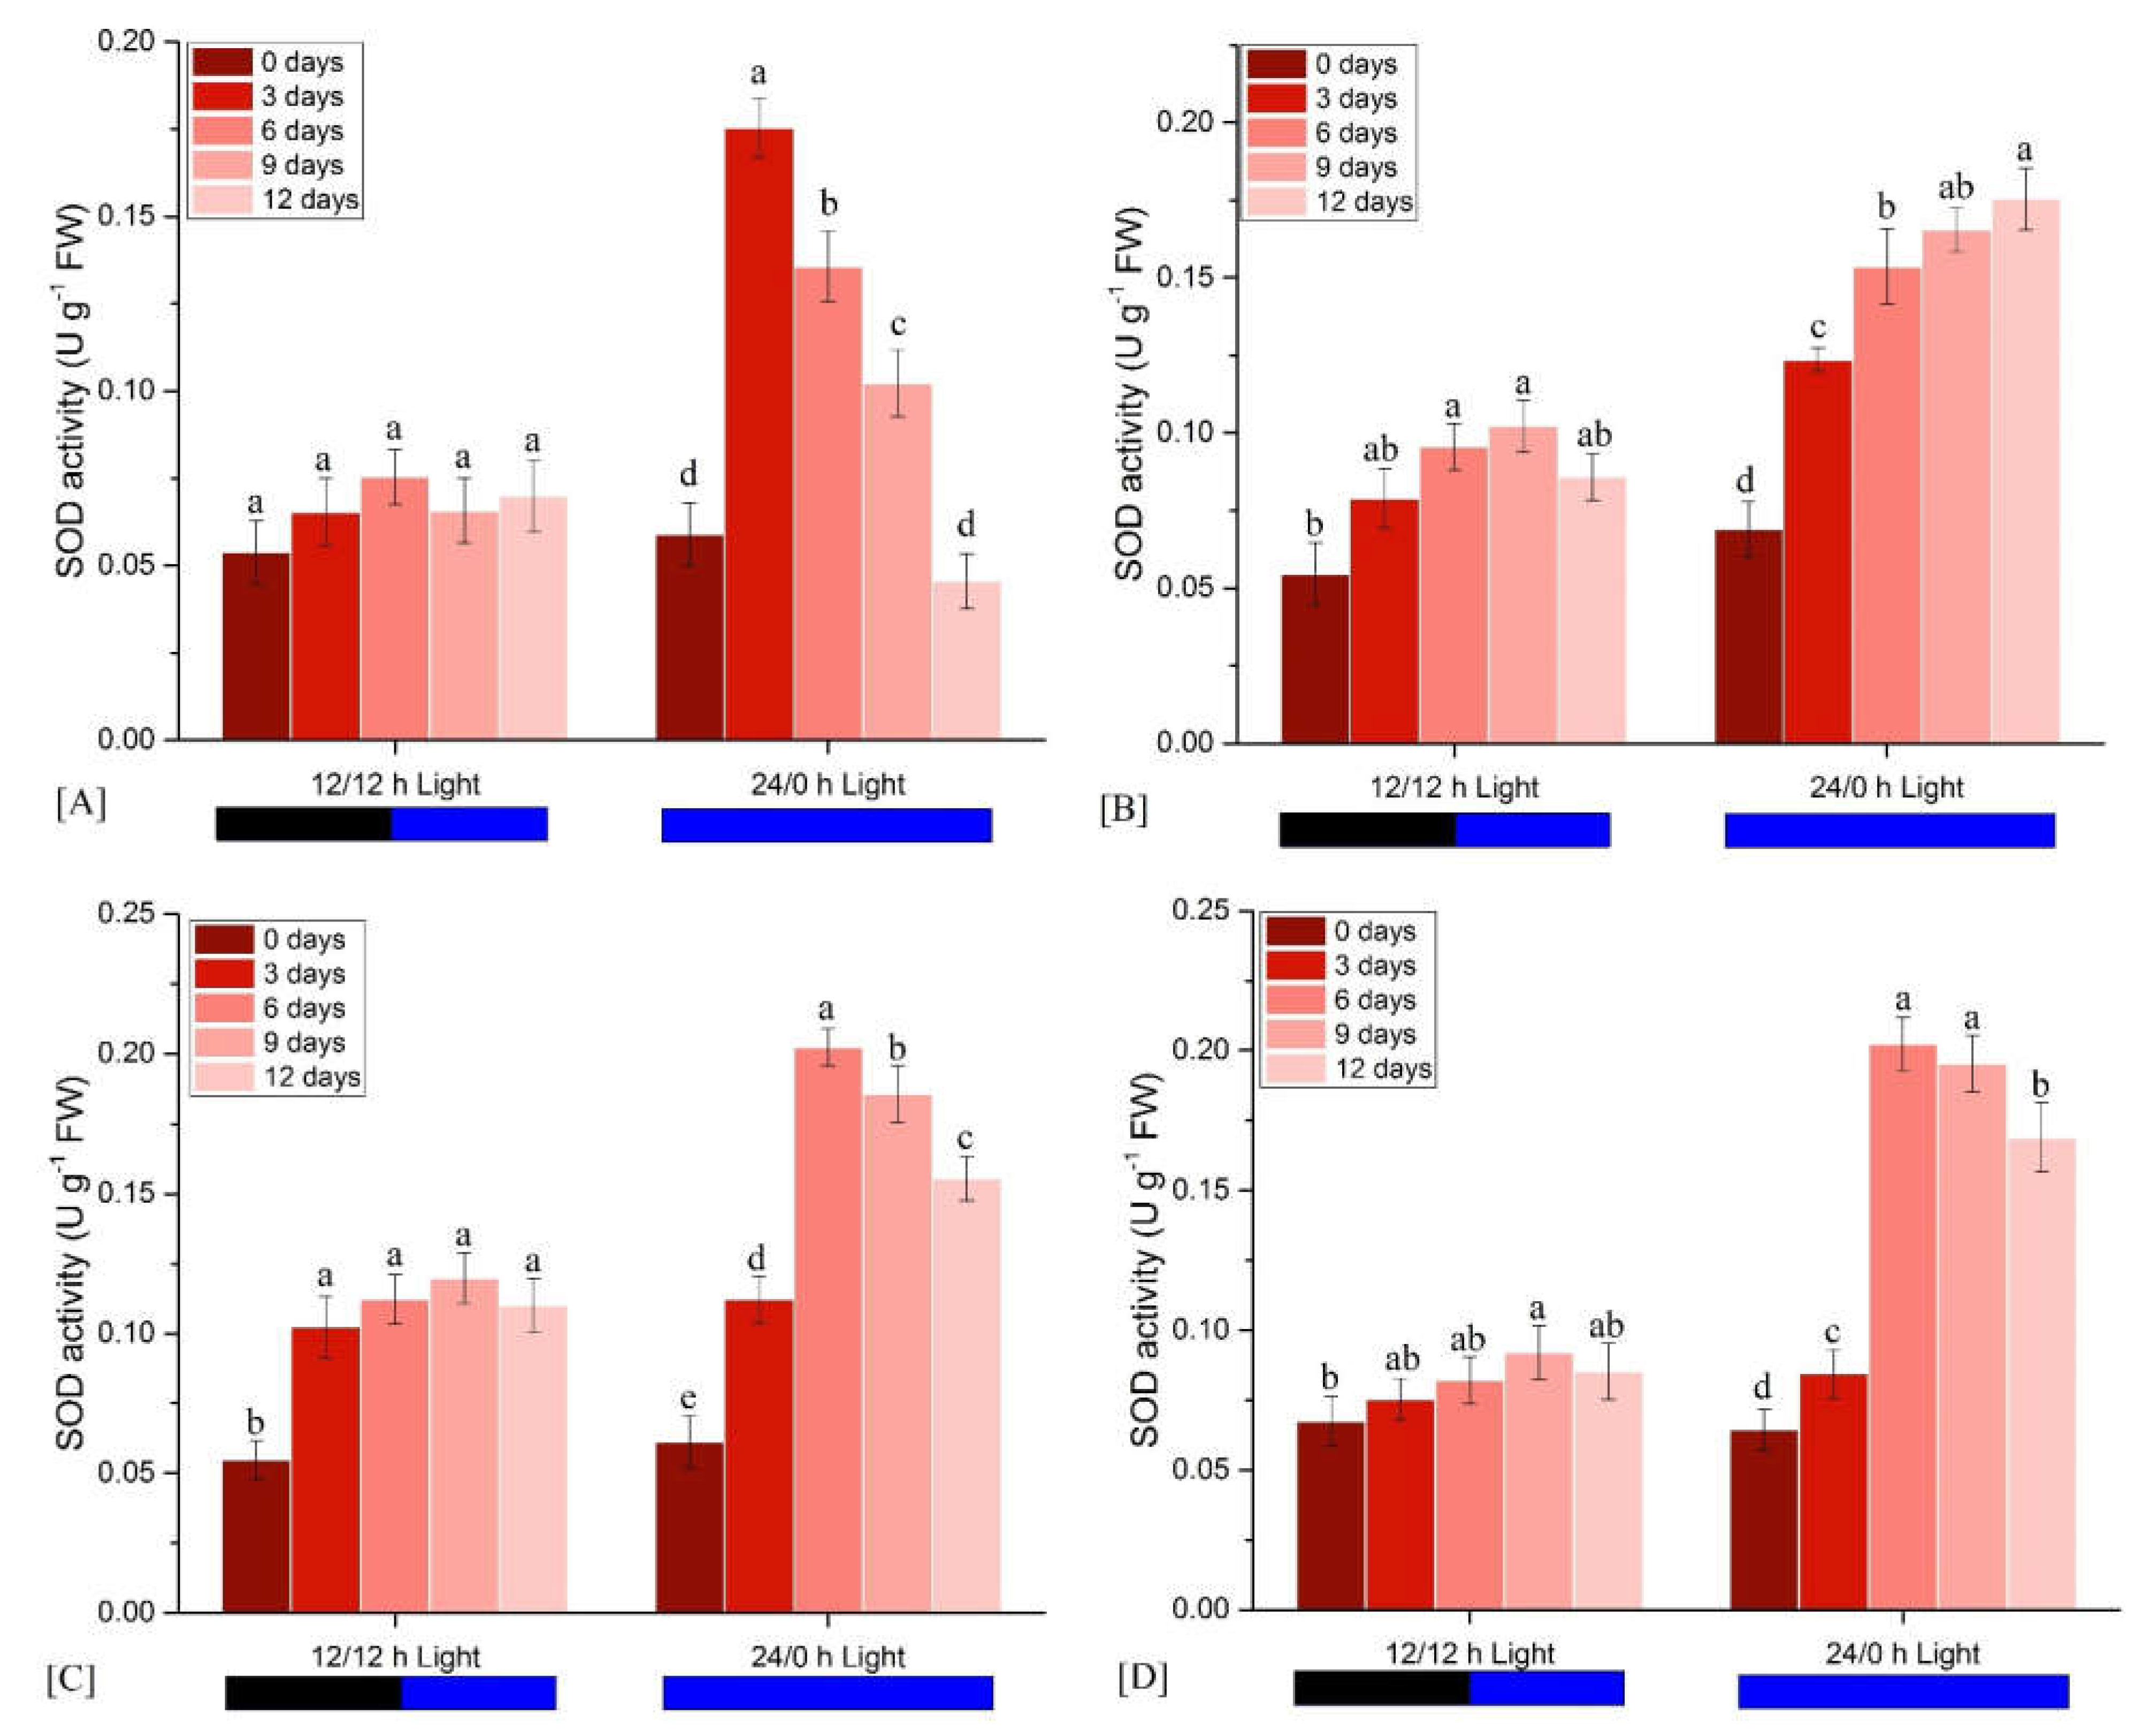
In continuous WL conditions, the SOD enzyme activity increased drastically on the 3rd day, then, thereafter it reduced up to the 12th day. In 12/12 h WL, the activity of enzyme enhanced was reduced up to the 6th day, after that it remained constant for the 12th day (Figure 3A). The BL figure shows that in the CL, enzyme activity was highest on the 12th day. In 12 h BL conditions, the activity initially increased for the 9th day and then decreased until the 12th day (Figure 3B). The activity was increased in the continuous GL from the 0th day to the 6th day and then continuously decreased in the next few days (Figure 3). The 12/12 h light period also showed an increase in activity trend (Figure 3C). In the red CL, the enzyme activity increased from the 3rd to the 6th day. After that, it continued to decrease up to the 12th day. A mild increase in activity was also observed in 12/12 h RL conditions (Figure 3D).

3.2.2. Effects on Catalase Activity

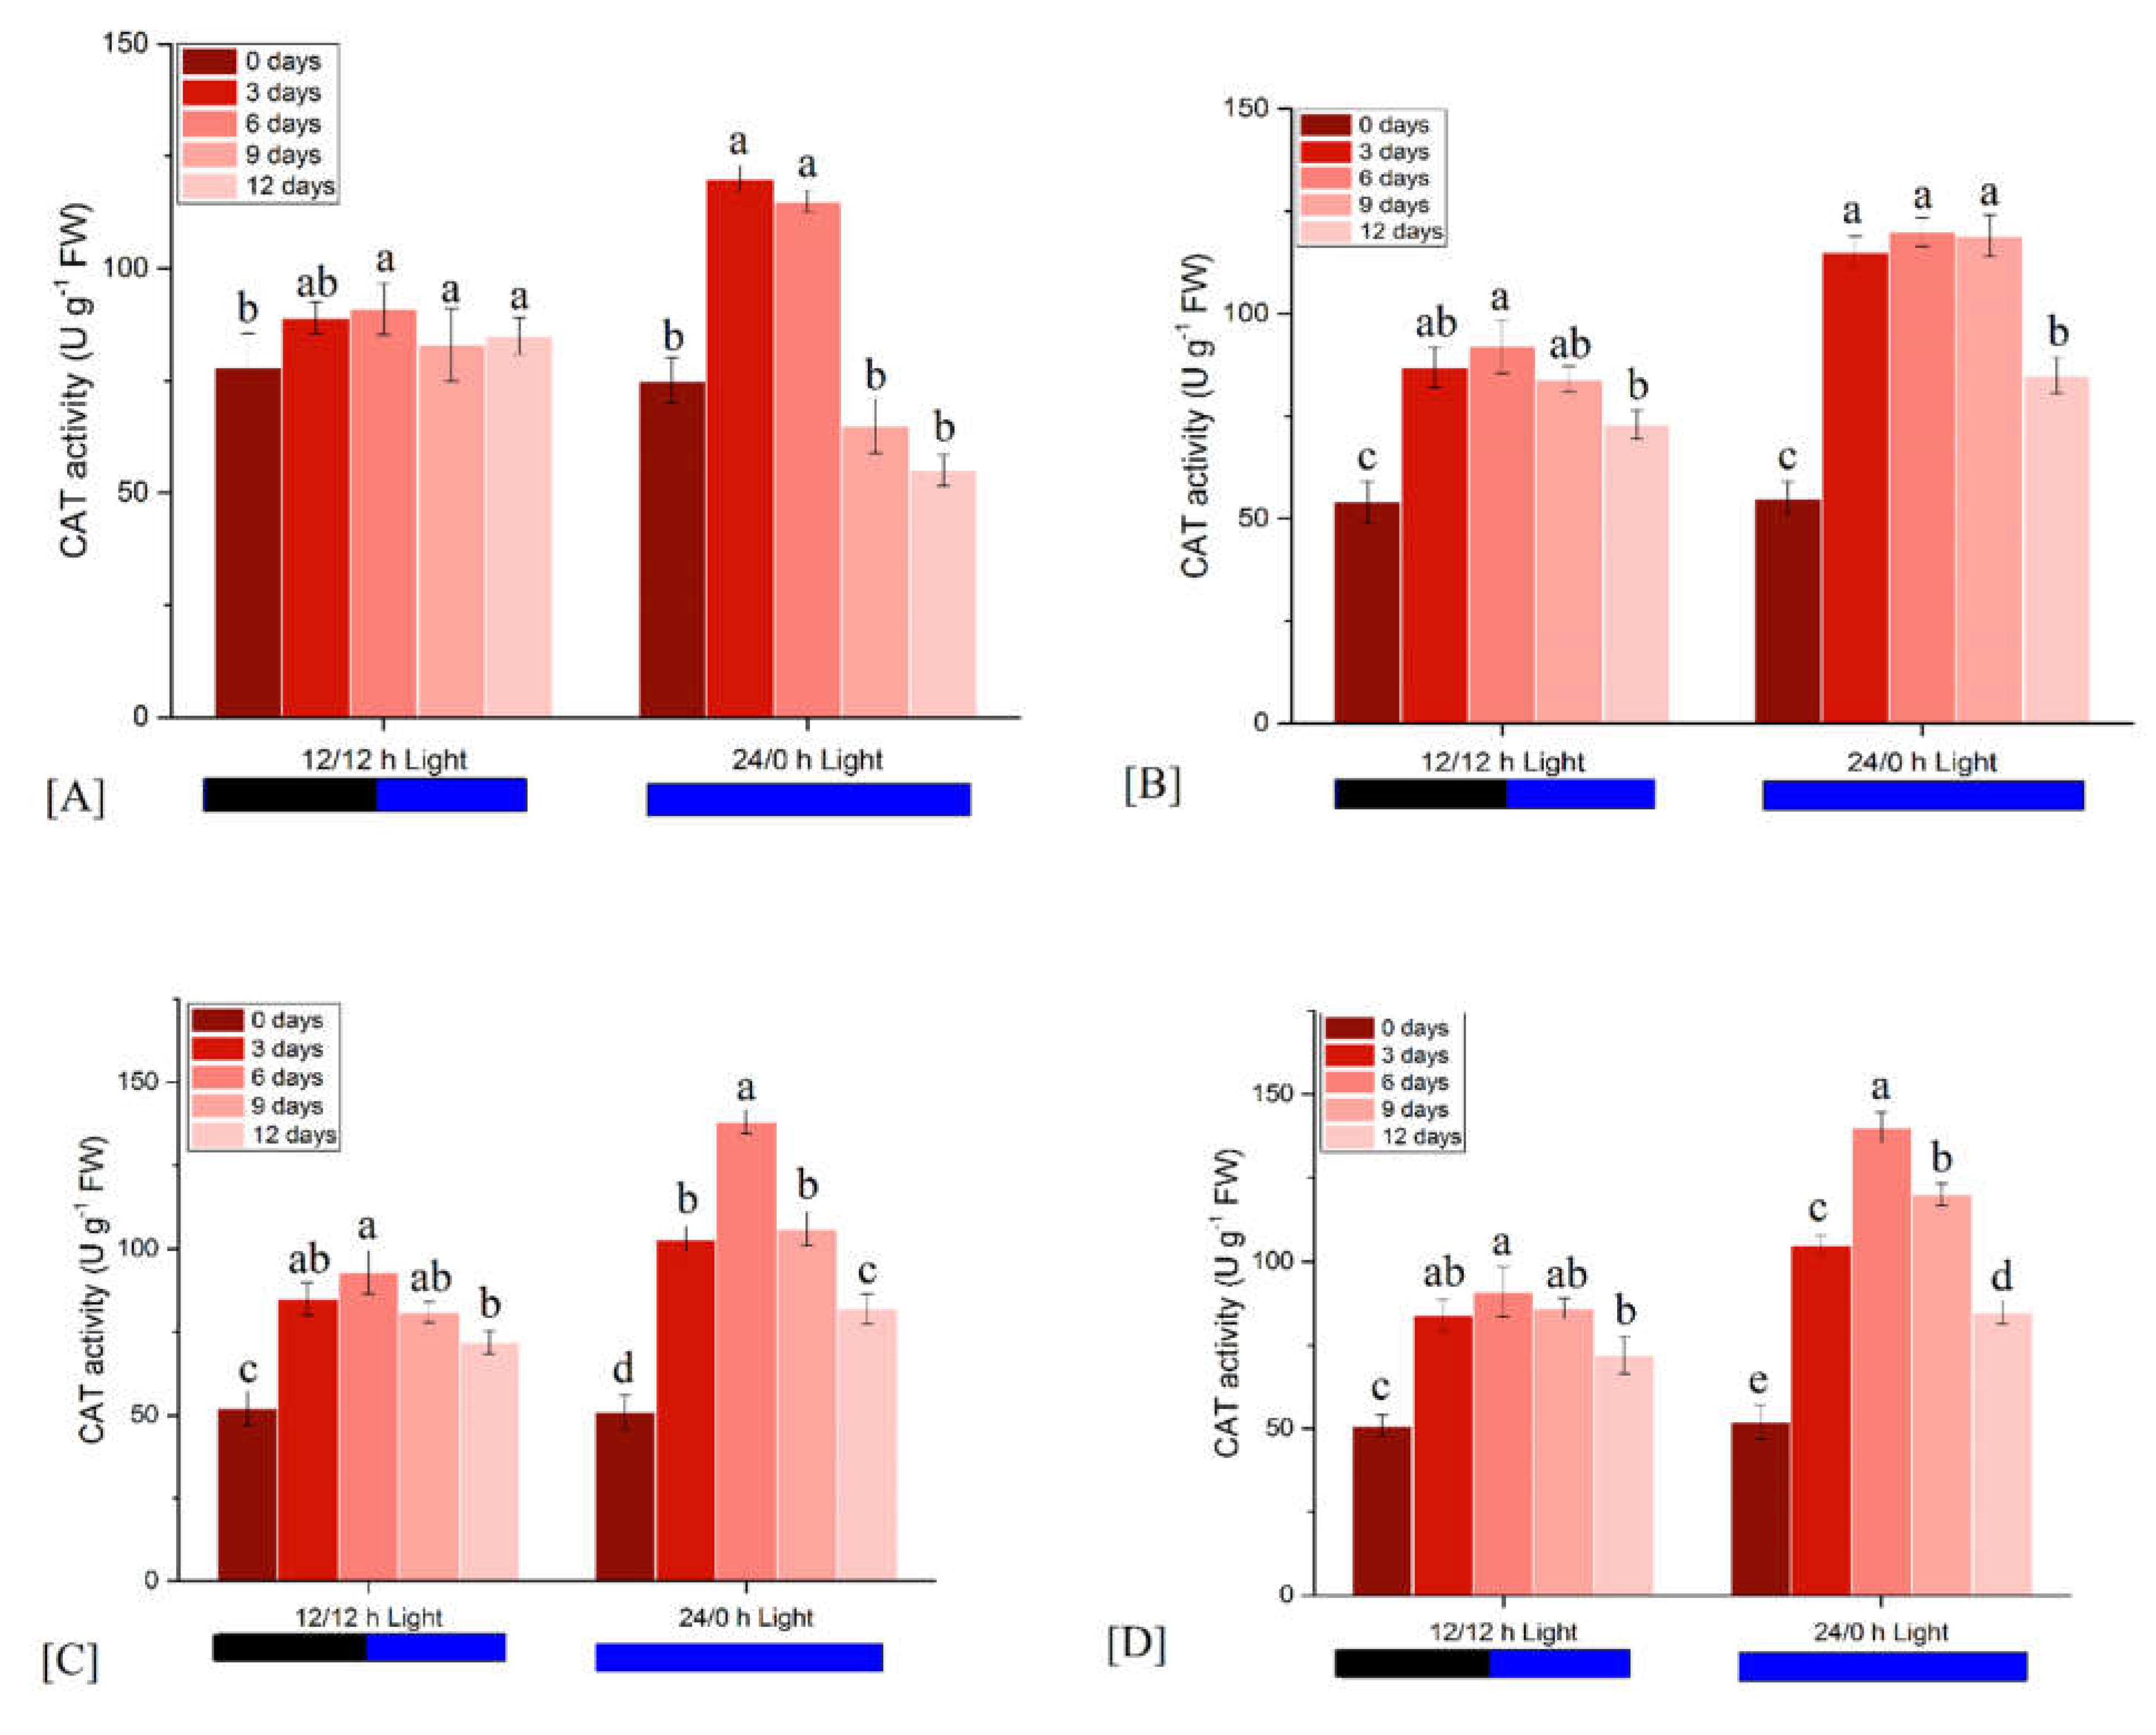
In white CL, the catalase enzyme showed its maximum activity on the 3rd day. After that, it tended to be reduced. In the 12/12 h WL, the catalase activity was increased for the 3rd day and then remained constant (Figure 4A). BL raised the activity of the enzyme, and after that, it declined in the next few days in CL conditions (Figure 4). A similar trend was also observed in 12/12 h light (Figure 4B). In GL, enzyme activity increased up to the 6th day, and then declined for the later days in the CL (Figure 4). As compared to the 12/12 h light period, the activity increased for the 6th day and then decreased in the following days (Figure 4C). In RL, the catalase enzyme activity increased up to the 6th day of the 12/12 h light period and then decreased mildly for further days. However, in CL conditions, the activity was also increased in the initial days and then reduced for the next few days (Figure 4D).

3.2.3. Effects on GPOD Activity

From the 0th day to the 6th day of 12/12 h WL, the enzyme activity enhanced. After that, it reduced up to the 12th day. In the CL, the activity was increased on the 3rd day and then continuously decreased (Figure 5A). The figures showed that blue CL altered the GPOD activity. It increased drastically for 6 days and then tended to reduce for the next few days. As compared to the 12/12 h light period, the activity was decreased on the 3rd day and increased on the 6th day. After that, it remained constant on further days (Figure 5B). In green continuous light, it increased continuously till the 9th day and then remained constant for further days. In 12/12 h light conditions, the activity was enhanced from the 0th day to 6th day and then tended to be reduced (Figure 5C). After cultivation in the red CL, the GPOD activity significantly increased till the 6th day and then showed a trend of reduction. In the 12/12 h photoperiod, the enzyme value showed a lower amount as compared to the CL, and it showed a similar trend as observed in the CL up to the 12th day (Figure 5D).

3.2.4. Effects on MDA Content

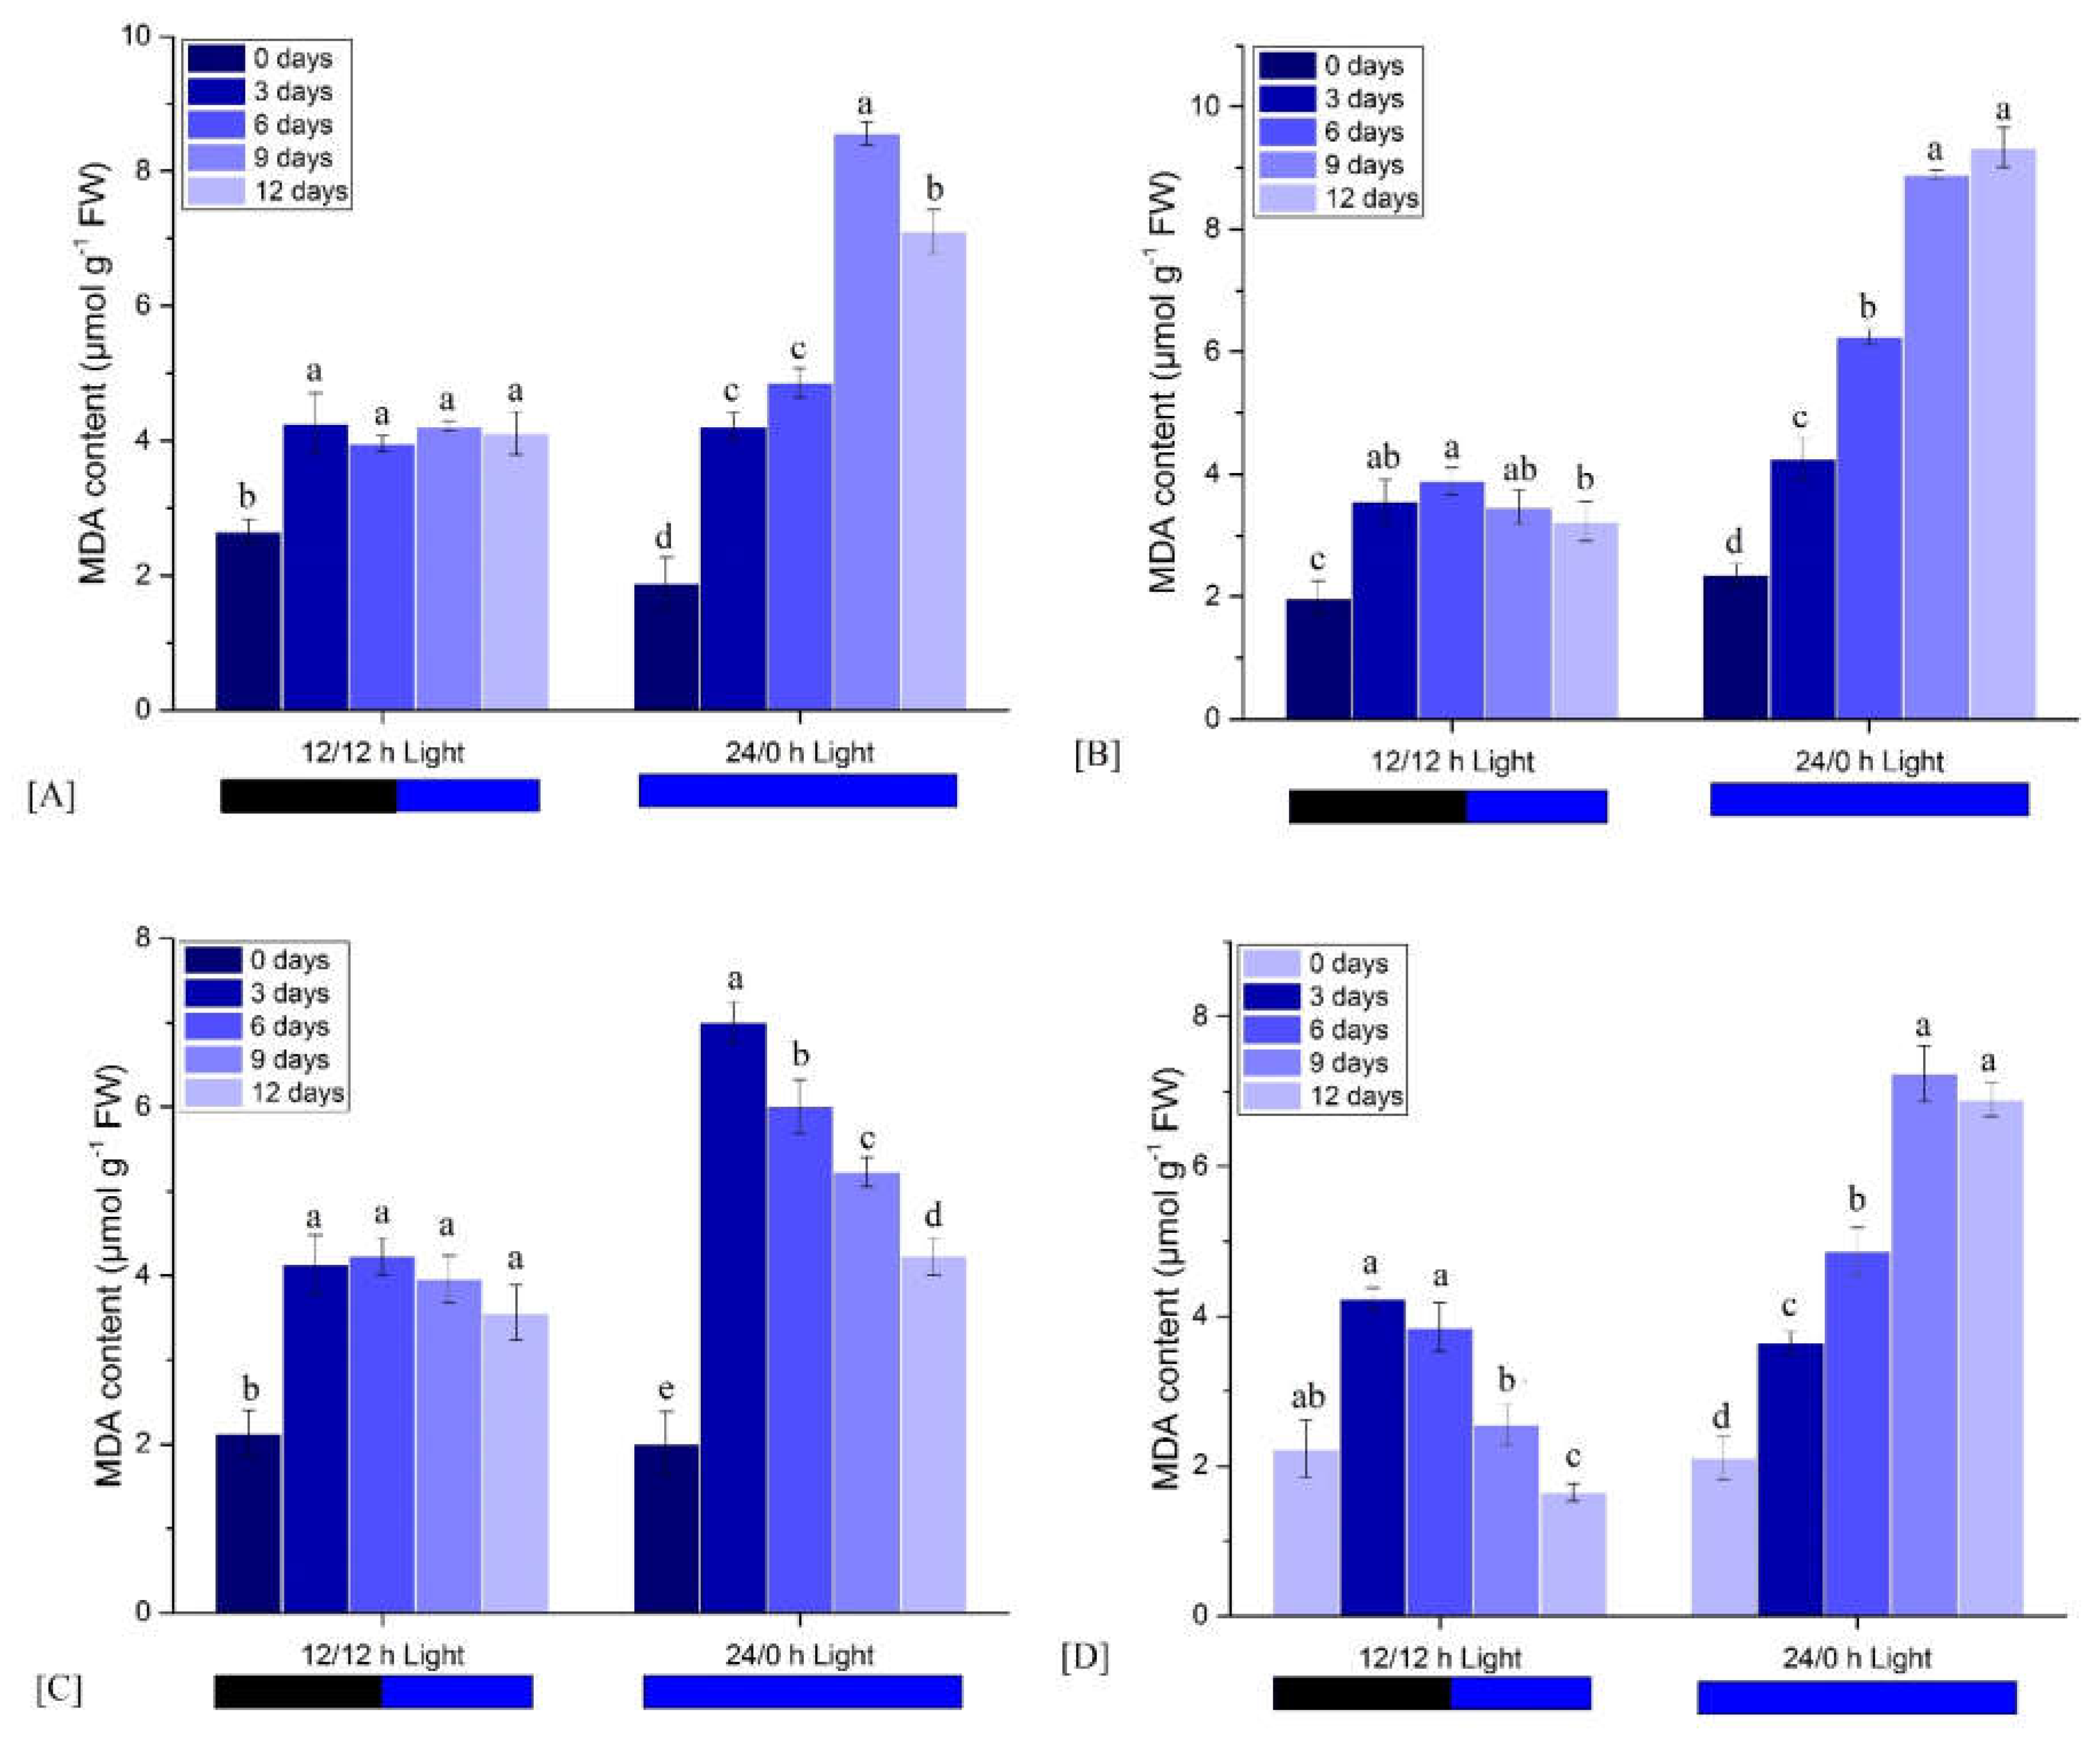
In white CL, the content increased drastically from the 0th day to the 9th day, and after that it reduced continuously. In the 12/12 h light period, the content was increased for the 3rd day and then tended to reduce for further days (Figure 6A). It increased in the blue CL throughout the experiment. The 12/12 h BL period showed an opposite trend, in that the content was enhanced in the first 6 days after treatment, and after that, it decreased up to the 12th day (Figure 6B). The GL significantly enhanced the lipid peroxidation content in the CL from the 0th to 3rd days and then remained decreased for the next few days. In the 12/12 h light period, the amount was increased slightly for 3 days, and after that, it was reduced for the next few days (Figure 6C). The figure showed that the RL increased the amount of MDA in green CL till the 9th day, and after it remained constant for further days. The 12/12 h RL period followed the opposite trend, and it initially increased for 3 days (Figure 6D). After that, it reduced significantly for further days (Figure 6D).

3.2.5. Effects on Proline Content

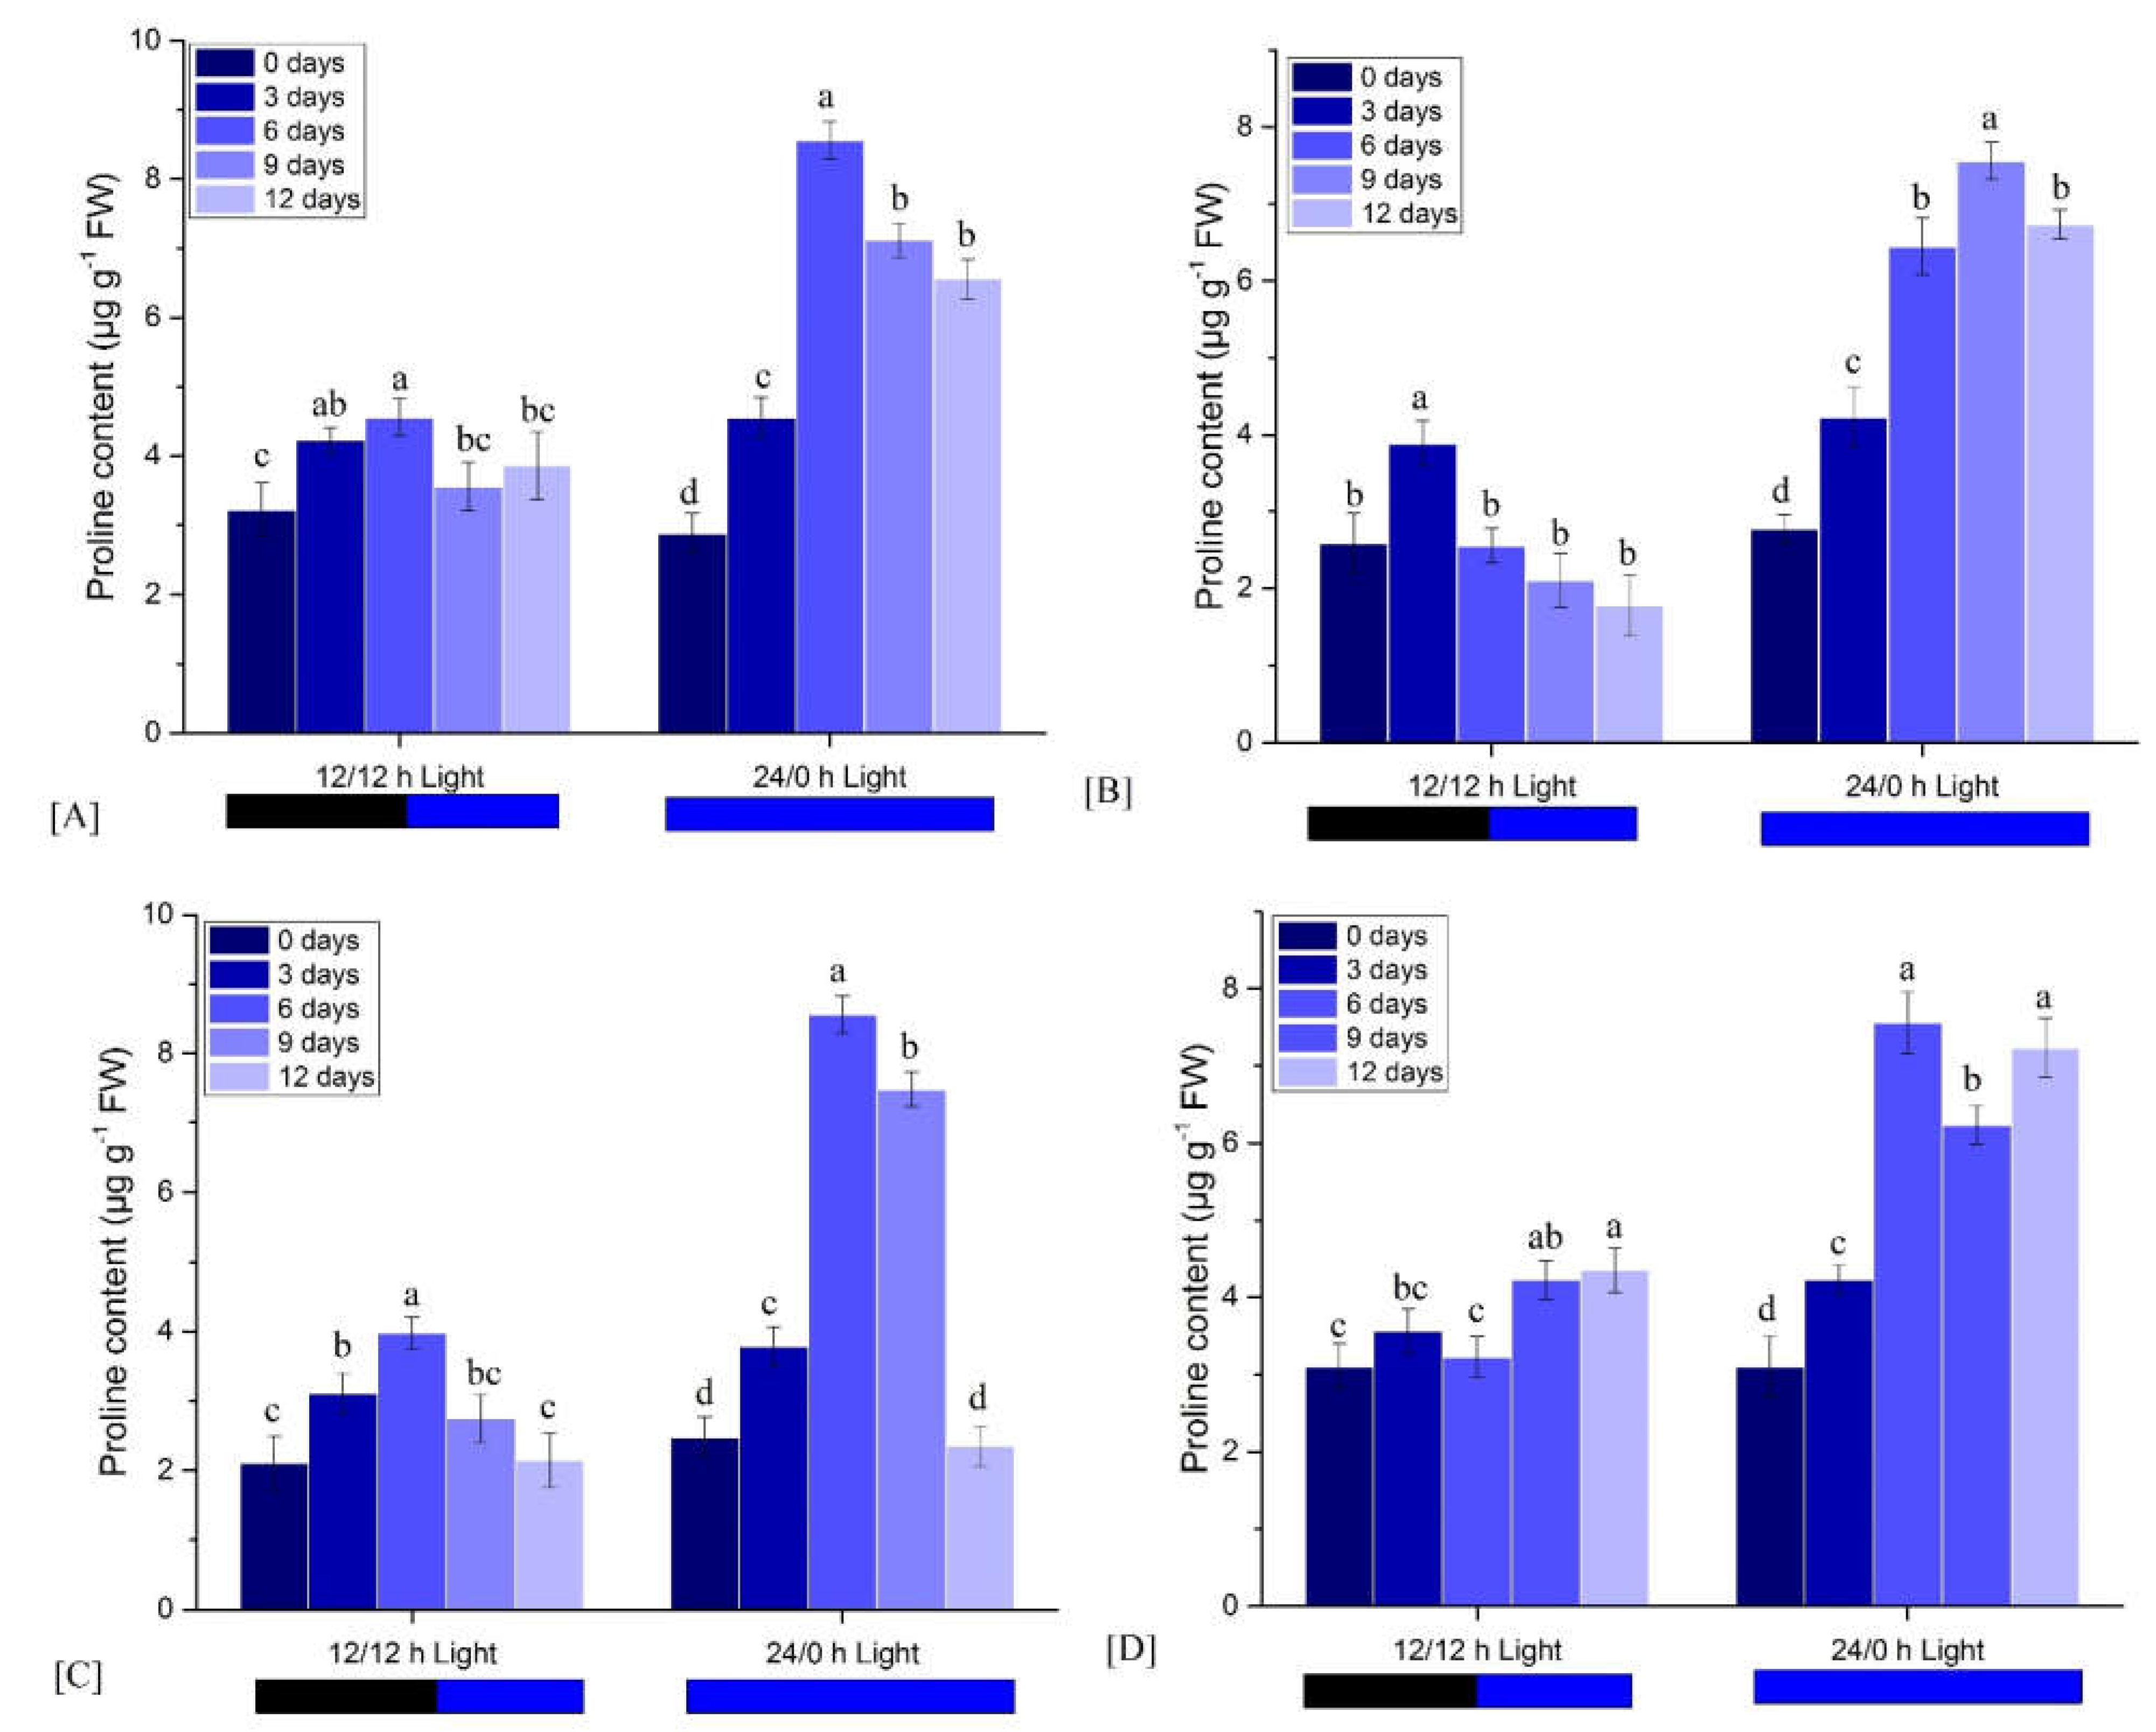
The content was increased from the 0th to 6th day, and after that, it mildly decreased in further days of white CL. In the 12/12 h light period, the content was increased slowly from 0th to the 3rd day, and after that, it was reduced till the 12th day (Figure 7A). The content of proline rises in blue CL conditions for the first 6 days after treatment with light, and then it remains increased for the next few days. The 12/12 h light period mildly enhanced the amount of proline, but it was reduced till the 12th day after treatment (Figure 7B). In green CL, the proline content was significantly enhanced in light for the first day and remained content till further days (Figure 7C). The figure showed that in red CL conditions, the content of proline was raised for 9 days, and from the 9th to 12th day it remained constant. The 12/12 h light period enhanced the proline content for the 3rd day, and after that it was reduced till the 12th day (Figure 7D).

3.2.6. Effects of Starch Content

In white CL, the content was drastically increased by the 3rd day, and after that, from the 6th to the 12th day, it continuously decreased. The 12/12 h light period enhanced the starch content through the experiment (Figure 8A). The figure showed that the blue CL caused an initial increase in starch content for the 0th to the 6th day, and after that, it was reduced in the next days. In the 12/12 h BL period, the content was continuously increased from the 0th to the 12th day (Figure 8B). GL initially increased the content of starch for the 6th day, but then it tended to be reduced. Rather than a 12/12 h light period, it showed an altered effect that it continuously increased from the 0th to the 12th day (Figure 8C). According to the figure, the starch content was enhanced in red CL for 9 days and then it tended to be reduced for further days (Figure 8D). However, the 12/12 h light period showed opposed results, and it continuously increased till the 12th day (Figure 8D).

3.2.7. Effects of Chlorophyll Content

Chlorophyll content increased by the 3rd day in WL and then drastically reduced in further days. However, the 12/12 h WL period showed an enhancement in content throughout the experiment (Figure 9A). The BL figure shows that CL enhanced the content till the 6th day, and after that, it tended to be reduced. In 12/12 h light conditions, the content initially increased for the 9th day, and then it decreased for the 12th day (Figure 9B). The chlorophyll content increased in the CL under GL condition on the 6th day and continued to decrease until the 12th day. Changes in chlorophyll content were also observed in 12/12 h light conditions (Figure 9C). The chlorophyll was increased in RL conditions under CL for the 6th day and continuously decreased in the following days. The 12/12 h light period also showed an increase in content throughout the experiment (Figure 9D).

3.3. Biophysical Studies of Light Quality in M. pudica

Artificial light significantly altered the growth and productivity of M. pudica through the modulation of photosynthetic processes. In the present studies, the impacts of different lights on chlorophyll fluorescence kinetics, phenomenological energy fluxes, density of reaction centers, and performance index were studied on M. pudica.

3.3.1. Chlorophyll a Fluorescence

Light quality significantly altered the chlorophyll a fluorescence OJIP kinetics in M. pudica. In 12/12 h light period-grown plants, two intermediate peaks FJ (chlorophyll fluorescence at 2 ms) and Fi (chlorophyll fluorescence at 300 ms) were formed between FO and FM, forming a typical fluorescence OJIP curve for chlorophyll a. The chlorophyll a fluorescence increased continuously from initial (FO) to maximal (FM) fluorescence intensity in M. pudica growing under 12/12 h light period conditions. In CL, the JI and IP phase of the OJIP curve was suppressed under BL, GL and RL at the 12th day of experiment (Figure 10B–D).
FM was slightly decreased on the 12th day in white, blue, green and red CL as compared to the 12/12 h light period. On the 12th day in 12/12 h, a significant reduction in FM was reported as compared with 12/12 h WL light condition and plants were failed to form a complete OJIP curve (Figure 10A). The results clearly indicate that CL significantly decrease fluorescence at 100 µs (F2), fluorescence at 300 µs (F3) and maximal fluorescence (when all PS II reaction centers are closed) in M. pudica.

3.3.2. Phenomenological Energy Fluxes

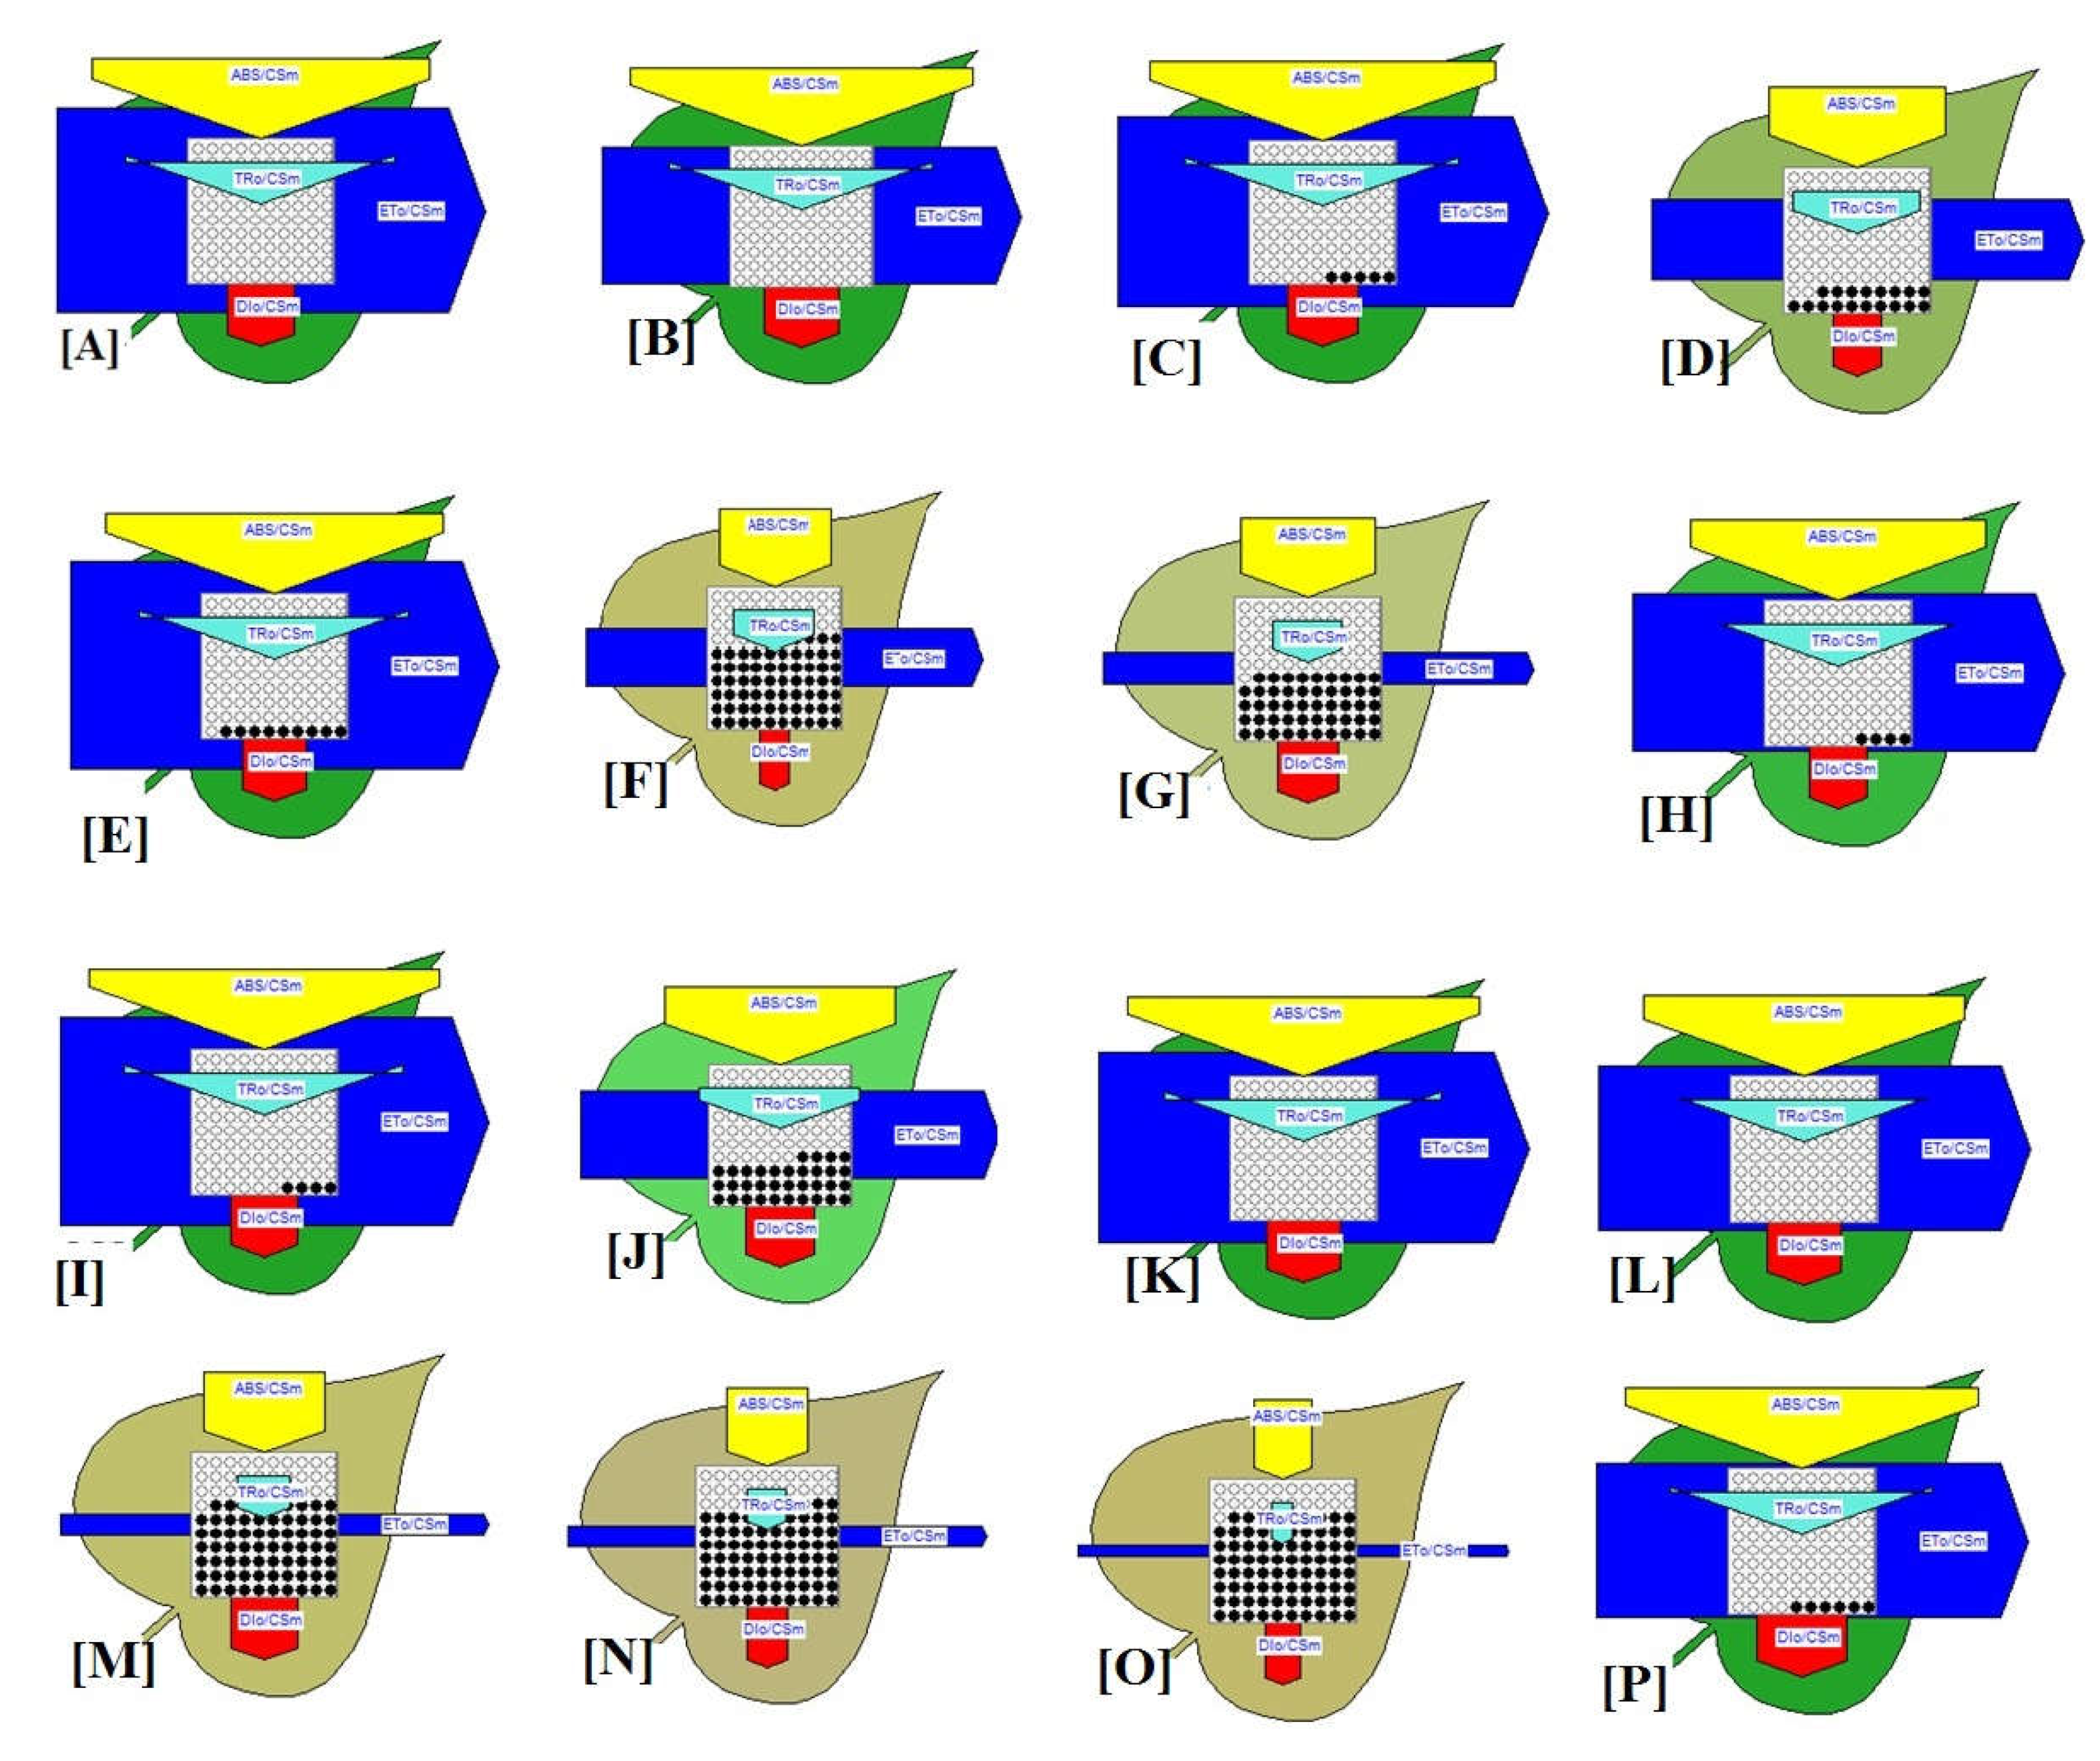
Phenomenological energy fluxes mean absorption flux per cross-section (ABS/CS), trapped energy flux per cross-section (TR/CS), electron transport flux per cross-section (ET/CS) and dissipated energy flux per cross-section (DI/CS) are significantly modulated by light period in M. pudica (Figure 11). Absorption flux per cross-section (ABS/CS) did not alter in 12/12 h WL and 12/12 h GL throughout the experiment (Figure 11E,H). The lowest values of ABS/CS were noticed on the 12th day in 12/12 h BL and GL (Figure 11F,H). The absorption potential per cross-section significantly declined in plants growing in the continuous WL, BL and GL; meanwhile, no significant changes were observed in the red CL. The electron transport efficiency of M. pudica was found sensitive to CL. CL drastically reduced the electron transfer system in WL, BL and GL whereas 12/12 h light period reduced trapping in BL and GL. The ET and DI were changed in a similar manner as the ABS and TR were changed (Figure 11E–H).

3.3.3. Density of Active Reaction Centers

The number of active PS II reaction centers (RC/CS) was high in the initial days, and then decreased with the last days (Figure 11). The lowest numbers of active reactions center were recorded on the 12th day of the WL, BL and GL continuous light. In the 12/12 h light period, the inactive reaction was increased on the 12th day in BL and GL. Active and inactive PSII reaction centers are presented diagrammatically by white and black circles, respectively, in the leaf models (Figure 11E–H).

3.3.4. Yield and Flux Ratio

The quantum yield of primary photochemistry FV/FM (ΦPo) was not much affected in the 12h light period, which reflects the overall photosynthetic potential of active PSII reaction centers. However, a significant decline in FV/FM was recorded on the last day of CL, which was the lowest in red CL. In the 12/12 h light period, ΦEo was increased in WL and BL, whereas in GL and RL, it was reduced. Similarly, in the CL, it was reduced that was lowest in RL. ΦDo was not changed in 12/12 h WL and BL while it was decreased in the GL and RL periods. In the CL, it was enhanced in each light condition (Table 1).

3.3.5. Performance Index

Photosynthesis performance on absorbance basis; PIABS was determined in M. pudica exposed to various light conditions (Table 1). Different light spectra led to a significant effect on the performance index on an absorption basis (PIABS) in M. pudica. PIABS declined sharply in CL on the 12th day in each light condition and the lowest was in RL. The performance index on an absorption basis (PIABS) was not significantly affected in 12/12 h light period but it was reduced in GL (Table 1).

4. Discussion

In this study, the effects of a range of spectral compositions of LED light on the physiology of M. pudica plants were quantified. The observations underlying these calculations and the implications of these results are discussed below. In the current study, M. pudica development was considerably hindered by GL and RL, whereas WL and BL had no significant impacts. Light quality significantly affects the morphological characteristics of M. pudica, especially in GL and RL, leading to enhanced senescence effects. Light is an important factor to initiate and/or modulate senescence rates both in the vegetative as well as the flowering stages [40]. Reduction in chlorophyll and overproduction of reactive oxygen species (ROS) might be the basis of the senescence symptoms. In a similar study, WL and BL prevented senescence, whereas GL and RL promoted this in cucumber plants [41,42].
Light affects the synthesis of photosynthetic pigments, which affects photosynthesis, and thus, plays an important role in plant growth and development [43]. Chlorophyll absorbs light energy and transfers it to the chloroplasts for photosynthesis [19]. The lighting system severely affects the pigment concentration in M. pudica, as seen by chlorophyll content. In this study, M. pudica had the highest chlorophyll content in WL and the lowest in RL. A higher chlorophyll content was shown to increase light absorption and, therefore, increase net photosynthesis [19]. The total chlorophyll content decreased under continuous monochromatic BL, RL and GL under CL, indicating that monochromatic light causes damage to the photosynthetic pigments. However, compared to other lights, WL treatment resulted in significantly higher leaf Chl content, which is inconsistent with the results of studies on lettuce and Anoectochilus roxburghii [44,45]. This is steady with how light quality affects the amount of chlorophyll in lettuce leaves [46]. Several studies suggested that RL inhibited the chlorophyll formation as a result of the reduction in 5-aminolevulinic acid, a biosynthetic precursor of chlorophyll [47]. According to reports, blue light is essential for the production and accumulation of chlorophyll [48]. As a result, the increased chlorophyll content under WL in this study might have been due to the influence of blue light on chlorophyll production. The higher chlorophyll content indicated adjustment of the antenna complex in the photosynthetic apparatus to absorb more light, demonstrating adaptation to high light and a stronger ability for light–energy conversion [49].
The JIP-test method is an add-on to the quality assessment process that allows for detection of most biological deregulations and is commonly used in experiments where only one or a limited number of stress factors are dominant [50,51]. According to the OJIP curve, the O–J normalized phase is related to the electron donation from the oxygen-evolving complex (OEC) to the oxidized PSII reaction center chlorophyll (P680+) [52]. The J–I and I–P normalized phase provide information about an imbalance between the oxidation and reduction of QA and the plastoquinone (PQ) pool, respectively [53]. Monochromatic BL, GL and RL induced a decrease in all the OJIP steps during the experimental period compared with other treatments; this indicates that light quality altered both the donor and acceptor sides of PSII and affected electron transport [54]. This result was consistent with the previous study in Cyclocarya paliurus [55]. Under different light conditions, the balance between the scavenging system and ROS formation can be disturbed, leading to oxidative damage to the PSII operating system and its components [56]. Moreover, in such circumstances, the excess energy absorbed by the PSII complex is not coupled with electron transport, which results in a full reduction in the PQ pool and blockage of the electron [57]. Conclusively, light quality and CL damaged the photochemical and non-photochemical redox reactions, reducing the ability of electron transport and slowing ATP synthesis and RuBP regeneration [58]. Therefore, CO2 assimilation was decreased by the imbalance in excitation energy distribution between PSI and PSII [59].
Reduction in FM of M. pudica plants in BL, GL and RL indicates a reduction in the amount of PS II centers which can reduce QA. The reduction in fluorescence occurs either by decreased absorption cross-section area of PS II-associated light harvesting antenna or by retarded electron flow from the donor side of PS II to the PQ pool that needs to be reduced before QA- can accumulate [60]. However, in the experiment, it was due to retarded electron flow rather than a decrease in the absorption cross-section area. At first glance, we can easily deduce that the more electrons from QA-~ are transferred into the electron transport chain, the longer the fluorescence signals remain lower than FM and the area becomes bigger. A decline in PSII quantum yield represented by Fv/FM was observed during all the light treatments at successive day intervals. The Fv/FM value of most dark-adapted plant species is 0.83 and is frequently used as a sign of plant photosynthetic function [61]. When plants grow in a favorable environment, Fv/FM is kept in a stable range, but it decreases in an adverse environment [62]. The decreased values of FV/FM in leaves of M. pudica plantlets grown under RL, GL and BL suggested that plants underwent photoinhibition which reduced photochemical efficiency and PS II activity. In a similar study, Phalaenopsis had lower Fv/FM values in monochromatic light conditions than in treatments containing more white light [63].
The leaf model of phenomenological energy fluxes (per CS), based on the obtained parameters from the chlorophyll a fluorescence induction curve, was used to demonstrate the changes in the electron transport mechanism under different lighting conditions. The decrease in ABS/CSM reflects an increased density of inactive reaction centers in response to light quality treatment [64]. Additionally, TR/CSM and ET/CSM denote the trapped energy flux and electron transport flux per reaction centre, respectively. The elevated values under the RL were presumably caused by the transit of photons absorbed by inactive reaction centres to active reaction centres [65]. The increase in closed reaction centers due to a lower rate of photosynthesis inhibits the PSII repair cycle and processes that protect the plant from photoinhibition [66]. Furthermore, the enhanced value of heat dissipation per reaction centre (DI/CSM) and the quantum yield of energy dissipation (ΦDo) were used to support findings. Higher values of non-photochemical quenching were observed as a result of the inability of active centres to absorb photons effectively. [67]. The above results indicated that M. pudica plantlets grown under monochromatic light conditions underwent photoinhibition and had increased inactivated reaction centers and improved energy consumption in the activated reaction centers [25].
ΦPo, often used to indicate the quantum yield of electron transfer during plant photosynthesis, reflecting the actual light energy capture rate when the reaction centers are partially closed. The energy flux ratios ΦDo (DI/ABS); and ΦEO (ET/ABS) all link experimental fluorescence signals to the quantum yield of primary photochemistry ΦPo [20]. The lower PSII photochemical performance (lower PIABS and ΦEo) in monochromatic RL and BL grown plants was due to the higher light energy absorption (ABS/CSM), trapping (TR/CSM) and dissipated energy flux (DI/CSM), which consequently resulted in a decreased quantum yield of electron transport (ΦEo) and maximum quantum yield of primary photochemistry (ΦPo). The decrease in the ΦE0 under RL indicated that the acceptor side of PS II in the electron transport of PS II was inhibited [39]. Therefore, we propose that BL increased the rate of photosynthesis in M. pudica plants but reduced the heat dissipation ability of PSII. Thus, BL is beneficial to M. pudica because it improves the efficiency of light energy conversion and allows increased energy accumulation for carbon assimilation in the dark reactions. Similar results were also found in Carpesium triste [68].
The three factor processes of photosynthesis—ABS, TR and ET—are taken into account by the multiparametric expression known as PIabs. The PIabs under WL were appreciably reduced, indicating that the PSII activity was reduced and the rate of final electron transfer to PSI through PQ was reduced [69]. The much lower PIABS showed that RL was inhibiting the activity of the photosynthetic apparatus as well as the ability of the PS II antenna to conserve energy from photons absorbed by it to the reduction of QB [70]. Similarly, it was discovered that Calendula officinalis exhibited photoinhibition under monochromatic RL, as evidenced by a decrease in excitation efficiency and an increase in energy dissipation [71]. A study in rose plants found that monochromatic red or blue LED showed a more sensitive electron transport system under high light-intensity treatment as compared to those grown under combined red and blue or white LED. Plants grown under red light exhibit characteristics of shade plants [72]. Chlorophyll a fluorescence characteristics were systematically analysed to reveal light energy transformation, electron transport, and activity of the photosynthetic apparatus under various light conditions. WL and BL lead to rise in values of PIABS, which showed positive effects in the electron transport process from QA to QB and a higher activity of the photosynthetic apparatus.
One of the defenses against oxidative stress and a response of antioxidant enzymes to light quality is thought to be the increased generation of ROS [73]. CAT and SOD protect the plant cells from harmful free radicals by removing the O2- [19]. The highest antioxidant potential was observed in BL, which was confirmed by the highest activity of CAT, POD and SOD. The findings confirmed that blue wavelengths benefit the growth and quality of M. pudica plants. Our results showed that the SOD, POD and CAT activities of M. pudica grown under RL, GL and BL enhanced significantly as compared to plants grown under WL. A recent study showed that compared with WL, the antioxidant enzyme activity in rice plant leaves under monochromatic RL or BL, increased significantly [74]. Moreover, Dong et al., found that as compared to WL, the GL and RL enhanced the SOD activity of wheat plant leaves during flowering stage [75]. Therefore, increased activities of SOD, POD and CAT may efficiently scavenge the ROS and lessen the damage of ROS to the cell. In our experiments, the induction of different antioxidants by light in a time-specific pattern demonstrates an activation of the cellular antioxidative system. Likewise, the transient elevation of GPOD enzyme activity levels in BL, GL and RL found in our experiments is similar to the induction pattern of GPOD levels in Stevia exposed to different light quality [76]. Various plant species were found to have higher ROS levels as they senescence, and this change may have been driven on by a decline in the activity of some antioxidant enzymes [77].
Though insignificant, comparatively more lipid peroxidation activity was found in RL grown plants. There was poor development of plants under red LED because of high lipid peroxidation activity, which generated ROS. It is assumed from our results that the lipid peroxidation activity associated with MDA production might have caused the impairments in the activity of photosynthesis. When Faszal et al. and Yu et al. examined Prunella vulgaris and Camptotheca acuminata seedlings under various LEDs, they discovered similar results [78,79].
As proline can ameliorate the effects of stress, the capacity of plants to accumulate proline is considered a main factor in tolerating stress [19]. In our study, RL increases the proline level, whereas GL has little effect on it, which suggests that RL has a tolerance capacity to stress. In an experiment, BL and RL showed a significantly higher content of proline and the minimum contents were observed in the GL-grown plants compared with the plants grown under white light [80]. Similarly, in a recent observation, higher proline levels were found under BL compared to the other light qualities [81].
The production of carbohydrates in the leaves of plants is induced by the light environment [82]. Light is an key factor for the synthesis of carbohydrates and exposure to different light qualities triggers the production of carbohydrates [83]. In this study, we found that light quality affected the starch content. In the present investigation, the starch content of M. pudica grown under GL and RL was significantly lower than in leaves grown under WL and BL. Previous studies also reported that CL and monochromatic lights provoked the synthesis of starch [84,85,86,87]. At the end of the experiment, the reduction in starch content evidenced the inhibition effect of feedback control on photosynthesis cannot be ruled out under RL, BL and WL [88].
The decline in fluorescence parameters such as ΦPo, ΦEo and enhancement in ΦDo at different light conditions indicates that an excess amount of energy absorbed by the pigments was not used during CO2 fixation, thus decreasing the efficiency of PSII and photochemical quenching. The lower growth rate under red light can be attributed to the poor overlap of the emission spectra of the red LED with the absorption spectrum of M. pudica, whether of the cells or of the photosynthetic pigments. The increased ROS content and antioxidant capacity reveal that the plant was under stress and adversely affected by different light wavelengths.

5. Conclusions

According to the results, the morphology and physiology of M. pudica was significantly affected by the light spectra and continuous light period. On the basis of these findings, it can be concluded that WL promoted plant growth and development by increasing chlorophyll content, reducing ROS accumulation and enhancing starch content. On the other hand, BL, GL and RL reduced plant growth and enhanced senescence by increasing the contents of MDA which means BL, GL and RL induced oxidative damage in the leaves of M. pudica. The decrease of photosynthesis under BL was associated with the inactivation of the photosystem, and by the reduction in chlorophyll and starch content. Accumulation of a high content of proline and high enzymatic activities of SOD and POD in leaves of M. pudica grown under WL reduced the light stress. This study helped us investigate the morphological and physiological response of M. pudica to various light spectra under greenhouse environment. It had been concluded that monochromatic RL and BL may have their own effects on plant metabolism and growth, but they were rather small in comparison to broad-spectrum white light.

Author Contributions

D.K. and V.S. conceived the idea and designed the experiment; D.K., H.S. and U.B. performed the experimental work and data analysis; V.S. supervised the experimental work; D.K. wrote the initial manuscript and prepared figures; D.K., H.S., U.B., J.S., S.S. and V.S. contributed to discussing, reviewing, and approving the final version of the manuscript for publication. All authors have read and agreed to the published version of the manuscript.

Funding

This research received no external funding.

Institutional Review Board Statement

Not applicable.

Informed Consent Statement

Not applicable.

Data Availability Statement

The data and materials that support the findings of this study are available from the corresponding author upon request.

Acknowledgments

The authors are thankful to Mohanlal Sukhadia University, Udaipur for providing the necessary facilities during the course of study.

Conflicts of Interest

The authors declare that they have no known competing financial interests or personal relationships that could have appeared to influence the work reported in this paper.

Abbreviations

BLBlue light
GLGreen light
RLRed light
WLWhite light
CLContinuous light
ROSReactive oxygen species
ChlChlorophyll
SODSuperoxide dismutase
CATCatalase
GPOXGuaiacol peroxidases
PSPhotosystem
RCReaction center
FmMaximal fluorescence intensity
ABS/CSMAbsorbed photon flux per excited cross-section
ET0/CSMElectron transport flux from QA−to PQ per cross-section
DI0/CSMDissipated energy flux per cross-section of PSII
RC/CSM Density of active PSII RCs
ΦPoMaximum quantum yield of primary PSII photochemistry (TR0/ABSM or Fv/FM)
ΦEoQuantum yield of electron transport from QA to PQ (ET0/ABS)
ΦDoQuantum yield of energy dissipation in PSII antenna (DI/ABS)
PIABSPerformance index on absorbance basis
PQplastoquinone

References

  1. Bian, Z.H.; Yang, Q.C.; Liu, W.K. Effects of Light Quality on the Accumulation of Phytochemicals in Vegetables Produced in Controlled Environments: A Review. J. Sci. Food Agric. 2015, 95, 869–877. [Google Scholar] [CrossRef]
  2. Paik, I.; Huq, E. Plant Photoreceptors: Multi-Functional Sensory Proteins and Their Signaling Networks. In Seminars in Cell & Developmental Biology; Academic Press: Cambridge, MA, USA, 2019; Volume 92, pp. 114–121. [Google Scholar]
  3. Paradiso, R.; Proietti, S. Light-Quality Manipulation to Control Plant Growth and Photomorphogenesis in Greenhouse Horticulture: The State of the Art and the Opportunities of Modern LED Systems. J. Plant Growth Regul. 2021, 1–39. [Google Scholar] [CrossRef]
  4. Zheng, J.; Hu, M.-J.; Guo, Y.-P. Regulation of Photosynthesis by Light Quality and Its Mechanism in Plants. Ying Yong Sheng Tai Xue Bao J. Appl. Ecol. 2008, 19, 1619–1624. [Google Scholar]
  5. Smith, H. Light Quality, Photoperception, and Plant Strategy. Annu. Rev. Plant Physiol. 1982, 33, 481–518. [Google Scholar] [CrossRef]
  6. Xu, D.Q.; Gao, W.; Ruan, J. Effects of Light Quality on Plant Growth and Development. Plant Physiol. J. 2015, 51, 1217–1234. [Google Scholar]
  7. Wang, X.Y.; Xu, X.M.; Cui, J. The Importance of Blue Light for Leaf Area Expansion, Development of Photosynthetic Apparatus, and Chloroplast Ultrastructure of Cucumis sativus Grown under Weak Light. Photosynthetica 2015, 53, 213–222. [Google Scholar] [CrossRef]
  8. Weston, E.; Thorogood, K.; Vinti, G.; López-Juez, E. Light Quantity Controls Leaf-Cell and Chloroplast Development in Arabidopsis thaliana Wild Type and Blue-Light-Perception Mutants. Planta 2000, 211, 807–815. [Google Scholar] [CrossRef]
  9. Trouwborst, G.; Hogewoning, S.W.; Van Kooten, O.; Harbinson, J.; Van Ieperen, W. Plasticity of Photosynthesis after the ‘Red Light Syndrome’in Cucumber. Environ. Exp. Bot. 2016, 121, 75–82. [Google Scholar] [CrossRef]
  10. Takemiya, A.; Inoue, S.; Doi, M.; Kinoshita, T.; Shimazaki, K. Phototropins Promote Plant Growth in Response to Blue Light in Low Light Environments. Plant Cell 2005, 17, 1120–1127. [Google Scholar] [CrossRef] [Green Version]
  11. Terashima, I.; Fujita, T.; Inoue, T.; Chow, W.S.; Oguchi, R. Green Light Drives Leaf Photosynthesis More Efficiently than Red Light in Strong White Light: Revisiting the Enigmatic Question of Why Leaves Are Green. Plant Cell Physiol. 2009, 50, 684–697. [Google Scholar] [CrossRef] [Green Version]
  12. O’Carrigan, A.; Babla, M.; Wang, F.; Liu, X.; Mak, M.; Thomas, R.; Bellotti, B.; Chen, Z.-H. Analysis of Gas Exchange, Stomatal Behaviour and Micronutrients Uncovers Dynamic Response and Adaptation of Tomato Plants to Monochromatic Light Treatments. Plant Physiol. Biochem. 2014, 82, 105–115. [Google Scholar] [CrossRef]
  13. Arena, C.; Tsonev, T.; Doneva, D.; De Micco, V.; Michelozzi, M.; Brunetti, C.; Centritto, M.; Fineschi, S.; Velikova, V.; Loreto, F. The Effect of Light Quality on Growth, Photosynthesis, Leaf Anatomy and Volatile Isoprenoids of a Monoterpene-Emitting Herbaceous Species (Solanum Lycopersicum L.) and an Isoprene-Emitting Tree (Platanus Orientalis L.). Environ. Exp. Bot. 2016, 130, 122–132. [Google Scholar] [CrossRef]
  14. Kim, Y.M.; Sung, J.K.; Lee, Y.J.; Lee, D.B.; Yoo, C.H.; Lee, S.B. Varying Effects of Artificial Light on Plant Functional Metabolites. Korean J. Environ. Agric. 2019, 38, 61–67. [Google Scholar] [CrossRef] [Green Version]
  15. Ali, M.B.; Khandaker, L.; Oba, S. Comparative Study on Functional Components, Antioxidant Activity and Color Parameters of Selected Colored Leafy Vegetables as Affected by Photoperiods. J. Food Agric. Environ. 2009, 7, 392–398. [Google Scholar]
  16. Torres, A.P.; Lopez, R.G. Photosynthetic Daily Light Integral during Propagation of Tecoma Stans Influences Seedling Rooting and Growth. HortScience 2011, 46, 282–286. [Google Scholar] [CrossRef] [Green Version]
  17. Weaver, G.; Van Iersel, M.W. Longer Photoperiods with Adaptive Lighting Control Can Improve Growth of Greenhouse-Grown ‘Little Gem’Lettuce (Lactuca Sativa). HortScience 2020, 55, 573–580. [Google Scholar] [CrossRef] [Green Version]
  18. Zha, L.; Zhang, Y.; Liu, W. Dynamic Responses of Ascorbate Pool and Metabolism in Lettuce to Long-Term Continuous Light Provided by Red and Blue LEDs. Environ. Exp. Bot. 2019, 163, 15–23. [Google Scholar] [CrossRef]
  19. Singh, H.; Kumar, D.; Soni, V. Copper and Mercury Induced Oxidative Stresses and Antioxidant Responses of Spirodela Polyrhiza (L.) Schleid. Biochem. Biophys. Rep. 2020, 23, 100781. [Google Scholar] [CrossRef]
  20. Bhatt, U.; Singh, H.; Kumar, D.; Strasser, R.J.; Soni, V. Severe Leaf-Vein Infestation Upregulates Antioxidant and Photosynthetic Activities in the Lamina of Ficus religiosa. Acta Physiol. Plant. 2022, 44, 15. [Google Scholar] [CrossRef]
  21. Wakeel, A.; Xu, M.; Gan, Y. Chromium-Induced Reactive Oxygen Species Accumulation by Altering the Enzymatic Antioxidant System and Associated Cytotoxic, Genotoxic, Ultrastructural, and Photosynthetic Changes in Plants. Int. J. Mol. Sci. 2020, 21, 728. [Google Scholar] [CrossRef] [PubMed] [Green Version]
  22. Pandhair, V.; Sekhon, B.S. Reactive Oxygen Species and Antioxidants in Plants: An Overview. J. Plant Biochem. Biotechnol. 2006, 15, 71–78. [Google Scholar] [CrossRef]
  23. Frąkaszczak, B.; Kula-Maximenko, M. The Preferences of Different Cultivars of Lettuce Seedlings (Lactuca Sativa L.) for the Spectral Composition of Light. Agronomy 2021, 11, 1211. [Google Scholar] [CrossRef]
  24. Singh, H.; Kumar, D.; Soni, V. Performance of Chlorophyll a Fluorescence Parameters in Lemna minor under Heavy Metal Stress Induced by Various Concentration of Copper. Sci. Rep. 2022, 12, 10620. [Google Scholar]
  25. Wang, H.; Gu, M.; Cui, J.; Shi, K.; Zhou, Y.; Yu, J. Effects of Light Quality on CO2 Assimilation, Chlorophyll-Fluorescence Quenching, Expression of Calvin Cycle Genes and Carbohydrate Accumulation in Cucumis Sativus. J. Photochem. Photobiol. B Biol. 2009, 96, 30–37. [Google Scholar] [CrossRef]
  26. Fu, W.; Li, P.; Wu, Y. Effects of Different Light Intensities on Chlorophyll Fluorescence Characteristics and Yield in Lettuce. Sci. Hortic. 2012, 135, 45–51. [Google Scholar] [CrossRef]
  27. Kumar, D.; Singh, H.; Bhatt, U.; Soni, V.; Allakhverdiev, S. Effect of Continuous Light on Antioxidant Activity, Lipid Peroxidation, Proline and Chlorophyll Content in Vigna Radiata L. Funct. Plant Biol. 2021, 49, 145–154. [Google Scholar] [CrossRef]
  28. Tamilarasi, T.; Ananthi, T. Phytochemical Analysis and Anti Microbial Activity of Mimosa pudica Linn. Res. J. Chem. Sci. 2012, 2231, 606X. [Google Scholar]
  29. Zhang, J.; Yuan, K.; Zhou, W.; Zhou, J.; Yang, P. Studies on the Active Components and Antioxidant Activities of the Extracts of Mimosa pudica Linn. from Southern China. Pharmacogn. Mag. 2011, 7, 35. [Google Scholar]
  30. Baghel, A.; Rathore, D.S.; Gupta, V. Evaluation of Diuretic Activity of Different Extracts of Mimosa pudica Linn. Pak. J. Biol. Sci. PJBS 2013, 16, 1223–1225. [Google Scholar] [CrossRef]
  31. Beauchamp, C.; Fridovich, I. Superoxide Dismutase: Improved Assays and an Assay Applicable to Acrylamide Gels. Anal. Biochem. 1971, 44, 276–287. [Google Scholar] [CrossRef]
  32. Aebi, H. Catalase in Vitro Assay Methods. Methods Enzymol. 1984, 105, 121–126. [Google Scholar] [CrossRef]
  33. Racusen, D.; Foote, M. Protein Synthesis in Dark-Grown Bean Leaves. Can. J. Bot. 1965, 43, 817–824. [Google Scholar] [CrossRef]
  34. Bates, L.S.; Waldren, R.P.; Teare, I.D. Rapid Determination of Free Proline for Water-Stress Studies. Plant Soil 1973, 39, 205–207. [Google Scholar] [CrossRef]
  35. Heath, R.L.; Packer, L. Photoperoxidation in Isolated Chloroplasts. I. Kinetics and Stoichiometry of Fatty Acid Peroxidation. Arch. Biochem. Biophys. 1968, 125, 189–198. [Google Scholar] [CrossRef]
  36. McCready, R.M.; Guggolz, J.; Silviera, V.; Owens, H.S. Determination of Starch and Amylose in Vegetables. Anal. Chem. 1950, 22, 1156–1158. [Google Scholar] [CrossRef]
  37. Porra, R.J.; Thompson, W.A.A.; Kriedemann, P.E. Determination of Accurate Extinction Coefficients and Simultaneous Equations for Assaying Chlorophylls a and b Extracted with Four Different Solvents: Verification of the Concentration of Chlorophyll Standards by Atomic Absorption Spectroscopy. Biochim. Biophys. Acta (BBA) Bioenerg. 1989, 975, 384–394. [Google Scholar] [CrossRef]
  38. Strasser, R.J. Govindjee The Fo and the OJIP Fluorescence Rise in Higher Plants and Algae. In Regulation of Chloroplast Biogenesis; Springer: Boston, MA, USA, 1992; pp. 423–426. [Google Scholar]
  39. Strasser, R.J.; Srivastava, A.; Tsimilli-Michael, M. The Fluorescence Transient as a Tool to Characterize and Screen Photosynthetic Samples. Probing Photosynth. Mech. Regul. Adapt. 2000, 1, 445–483. [Google Scholar]
  40. Causin, H.F.; Barneix, A.J. The Role of Oxidative Metabolism in the Regulation of Leaf Senescence by the Light Environment. Int. J. Plant Dev. Biol. 2007, 1, 239–244. [Google Scholar]
  41. Wang, H.; Jiang, Y.; Shi, K.; Zhou, Y.; Yu, J. Effects of Light Quality on Leaf Senescence and Activities of Antioxidant Enzymes in Cucumber Plants. Sci. Agric. Sin. 2010, 43, 529–534. [Google Scholar]
  42. Wang, H.B.; Wang, S.; Wang, X.D.; Shi, X.B.; Wang, B.L.; Zheng, X.C.; Wang, Z.Q.; Liu, F.Z. [Effects of Light Quality on Leaf Senescence and Endogenous Hormones Content in Grapevine under Protected Cultivation]. Ying Yong Sheng Tai Xue Bao J. Appl. Ecol. 2017, 28, 3535–3543. [Google Scholar] [CrossRef]
  43. Gao, S.; Liu, X.; Liu, Y.; Cao, B.; Chen, Z.; Xu, K. Photosynthetic Characteristics and Chloroplast Ultrastructure of Welsh Onion (Allium Fistulosum L.) Grown under Different LED Wavelengths. BMC Plant Biol. 2020, 20, 1–12. [Google Scholar] [CrossRef] [PubMed] [Green Version]
  44. Ye, S.; Shao, Q.; Xu, M.; Li, S.; Wu, M.; Tan, X.; Su, L. Effects of Light Quality on Morphology, Enzyme Activities, and Bioactive Compound Contents in Anoectochilus roxburghii. Front. Plant Sci. 2017, 8, 857. [Google Scholar] [CrossRef] [PubMed] [Green Version]
  45. Kobayashi, K.; Amore, T.; Lazaro, M. Light-Emitting Diodes (LEDs) for Miniature Hydroponic Lettuce. Opt. Photonics J. 2013, 3, 29024. [Google Scholar] [CrossRef] [Green Version]
  46. Son, K.-H.; Oh, M.-M. Growth, Photosynthetic and Antioxidant Parameters of Two Lettuce Cultivars as Affected by Red, Green, and Blue Light-Emitting Diodes. Hortic. Environ. Biotechnol. 2015, 56, 639–653. [Google Scholar] [CrossRef]
  47. Sood, S.; Gupta, V.; Tripathy, B.C. Photoregulation of the Greening Process of Wheat Seedlings Grown in Red Light. Plant Mol. Biol. 2005, 59, 269–287. [Google Scholar] [CrossRef]
  48. Moradi, S.; Kafi, M.; Aliniaeifard, S.; Salami, S.A.; Shokrpour, M.; Pedersen, C.; Moosavi-Nezhad, M.; Wróbel, J.; Kalaji, H.M. Blue Light Improves Photosynthetic Performance and Biomass Partitioning toward Harvestable Organs in Saffron (Crocus Sativus L.). Cells 2021, 10, 1994. [Google Scholar] [CrossRef] [PubMed]
  49. Dall’Osto, L.; Lico, C.; Alric, J.; Giuliano, G.; Havaux, M.; Bassi, R. Lutein Is Needed for Efficient Chlorophyll Triplet Quenching in the Major LHCII Antenna Complex of Higher Plants and Effective Photoprotection in Vivounder Strong Light. BMC Plant Biol. 2006, 6, 1–20. [Google Scholar] [CrossRef] [Green Version]
  50. Tsimilli-Michael, M.; Strasser, R.J. In Vivo Assessment of Stress Impact on Plant’s Vitality: Applications in Detecting and Evaluating the Beneficial Role of Mycorrhization on Host Plants. In Mycorrhiza; Springer: Berlin/Heidelberg, Germany, 2008; pp. 679–703. [Google Scholar]
  51. Clark, A.J.; Landolt, W.; Bucher, J.B.; Strasser, R.J. Beech (Fagus sylvatica) Response to Ozone Exposure Assessed with a Chlorophyll a Fluorescence Performance Index. Environ. Pollut. 2000, 109, 501–507. [Google Scholar] [CrossRef]
  52. Strasser, B.J. Donor Side Capacity of Photosystem II Probed by Chlorophyll a Fluorescence Transients. Photosynth. Res. 1997, 52, 147–155. [Google Scholar] [CrossRef]
  53. Tsimilli-Michael, M.; Strasser, R.J. The Energy Flux Theory 35 Years Later: Formulations and Applications. Photosynth. Res. 2013, 117, 289–320. [Google Scholar] [CrossRef]
  54. Hamed, S.B.; Lefi, E.; Chaieb, M. Effect of Phosphorus Concentration on the Photochemical Stability of PSII and CO2 Assimilation in Pistacia Vera L. and Pistacia Atlantica Desf. Plant Physiol. Biochem. 2019, 142, 283–291. [Google Scholar] [CrossRef] [PubMed]
  55. Liu, Y.; Wang, T.; Fang, S.; Zhou, M.; Qin, J. Responses of Morphology, Gas Exchange, Photochemical Activity of Photosystem II, and Antioxidant Balance in Cyclocarya paliurus to Light Spectra. Front. Plant Sci. 2018, 9, 1704. [Google Scholar] [CrossRef] [PubMed] [Green Version]
  56. Aro, E.-M.; Virgin, I.; Andersson, B. Photoinhibition of Photosystem II. Inactivation, Protein Damage and Turnover. Biochim. Biophys. Acta (BBA) Bioenerg. 1993, 1143, 113–134. [Google Scholar] [CrossRef]
  57. Pospíšil, P. Production of Reactive Oxygen Species by Photosystem II as a Response to Light and Temperature Stress. Front. Plant Sci. 2016, 7, 1950. [Google Scholar] [CrossRef] [PubMed] [Green Version]
  58. Lin, Z.; Zhong, Q.; Chen, C.; Ruan, Q.; Chen, Z.; You, X. Carbon Dioxide Assimilation and Photosynthetic Electron Transport of Tea Leaves under Nitrogen Deficiency. Bot. Stud. 2016, 57, 1–12. [Google Scholar] [CrossRef] [PubMed] [Green Version]
  59. Kumar, D.; Singh, H.; Raj, S.; Soni, V. Chlorophyll a Fluorescence Kinetics of Mung Bean (Vigna radiata L.) Grown under Artificial Continuous Light. Biochem. Biophys. Rep. 2020, 24, 100813. [Google Scholar] [CrossRef] [PubMed]
  60. Tóth, S.Z.; Schansker, G.; Strasser, R.J. A Non-Invasive Assay of the Plastoquinone Pool Redox State Based on the OJIP-Transient. Photosynth. Res. 2007, 93, 193–203. [Google Scholar] [CrossRef] [Green Version]
  61. Song, X.; Zhou, G.; Xu, Z.; Lv, X.; Wang, Y. Detection of Photosynthetic Performance of Stipa Bungeana Seedlings under Climatic Change Using Chlorophyll Fluorescence Imaging. Front. Plant Sci. 2016, 6, 1254. [Google Scholar] [CrossRef] [Green Version]
  62. Na, Y.-W.; Jeong, H.J.; Lee, S.-Y.; Choi, H.G.; Kim, S.-H.; Rho, I.R. Chlorophyll Fluorescence as a Diagnostic Tool for Abiotic Stress Tolerance in Wild and Cultivated Strawberry Species. Hortic. Environ. Biotechnol. 2014, 55, 280–286. [Google Scholar] [CrossRef]
  63. Ouzounis, T.; Fretté, X.; Ottosen, C.-O.; Rosenqvist, E. Spectral Effects of LEDs on Chlorophyll Fluorescence and Pigmentation in Phalaenopsis ‘Vivien’ and ‘Purple Star’. Physiol. Plant. 2015, 154, 314–327. [Google Scholar] [CrossRef]
  64. Janeeshma, E.; Johnson, R.; Amritha, M.S.; Noble, L.; Aswathi, K.P.R.; Telesiński, A.; Kalaji, H.M.; Auriga, A.; Puthur, J.T. Modulations in Chlorophyll a Fluorescence Based on Intensity and Spectral Variations of Light. Int. J. Mol. Sci. 2022, 23, 5599. [Google Scholar] [CrossRef]
  65. Vass, I.; Kirilovsky, D.; Etienne, A.-L. UV-B Radiation-Induced Donor-and Acceptor-Side Modifications of Photosystem II in the Cyanobacterium Synechocystis Sp. PCC 6803. Biochemistry 1999, 38, 12786–12794. [Google Scholar] [CrossRef]
  66. Oguchi, R.; Douwstra, P.; Fujita, T.; Chow, W.S.; Terashima, I. Intra-Leaf Gradients of Photoinhibition Induced by Different Color Lights: Implications for the Dual Mechanisms of Photoinhibition and for the Application of Conventional Chlorophyll Fluorometers. New Phytol. 2011, 191, 146–159. [Google Scholar] [CrossRef] [Green Version]
  67. Muller, P.; Li, X.-P.; Niyogi, K.K. Non-Photochemical Quenching. A Response to Excess Light Energy. Plant Physiol. 2001, 125, 1558–1566. [Google Scholar] [CrossRef] [Green Version]
  68. Zhao, J.; Park, Y.G.; Jeong, B.R. Light Quality Affects Growth and Physiology of Carpesium triste Maxim Cultured in Vitro. Agriculture 2020, 10, 258. [Google Scholar] [CrossRef]
  69. Miyake, C. Molecular Mechanism of Oxidation of P700 and Suppression of ROS Production in Photosystem I in Response to Electron-Sink Limitations in C3 Plants. Antioxidants 2020, 9, 230. [Google Scholar] [CrossRef] [Green Version]
  70. Yusuf, M.A.; Kumar, D.; Rajwanshi, R.; Strasser, R.J.; Tsimilli-Michael, M.; Sarin, N.B. Overexpression of $γ$-Tocopherol Methyl Transferase Gene in Transgenic Brassica juncea Plants Alleviates Abiotic Stress: Physiological and Chlorophyll a Fluorescence Measurements. Biochim. Biophys. Acta (BBA) Bioenerg. 2010, 1797, 1428–1438. [Google Scholar] [CrossRef] [Green Version]
  71. Aliniaeifard, S.; Seif, M.; Arab, M.; Zare Mehrjerdi, M.; Li, T.; Lastochkina, O. Growth and Photosynthetic Performance of Calendula officinalis under Monochromatic Red Light. Int. J. Hortic. Sci. Technol. 2018, 5, 123–132. [Google Scholar]
  72. Bayat, L.; Arab, M.; Aliniaeifard, S.; Seif, M.; Lastochkina, O.; Li, T. Effects of Growth under Different Light Spectra on the Subsequent High Light Tolerance in Rose Plants. AoB Plants 2018, 10, ply052. [Google Scholar] [CrossRef]
  73. Shafiq, I.; Hussain, S.; Raza, M.A.; Iqbal, N.; ASGHAR, M.A.; Ali, R.; FAN, Y.; Mumtaz, M.; Shoaib, M.; Ansar, M.; et al. Crop Photosynthetic Response to Light Quality and Light Intensity. J. Integr. Agric. 2021, 20, 4–23. [Google Scholar] [CrossRef]
  74. Manivannan, A.; Soundararajan, P.; Halimah, N.; Ko, C.H.; Jeong, B.R. Blue LED Light Enhances Growth, Phytochemical Contents, and Antioxidant Enzyme Activities of Rehmannia glutinosa Cultured in Vitro. Hortic. Environ. Biotechnol. 2015, 56, 105–113. [Google Scholar] [CrossRef]
  75. Dong, C.; Fu, Y.; Liu, G.; Liu, H. Growth, Photosynthetic Characteristics, Antioxidant Capacity and Biomass Yield and Quality of Wheat (Triticum Aestivum L.) Exposed to LED Light Sources with Different Spectra Combinations. J. Agron. Crop Sci. 2014, 200, 219–230. [Google Scholar] [CrossRef]
  76. Simlat, M.; Ślękzak, P.; Moś, M.; Warchoł, M.; Skrzypek, E.; Ptak, A. The Effect of Light Quality on Seed Germination, Seedling Growth and Selected Biochemical Properties of Stevia rebaudiana Bertoni. Sci. Hortic. 2016, 211, 295–304. [Google Scholar] [CrossRef]
  77. Prochazkova, D.; Wilhelmova, N. Leaf Senescence and Activities of the Antioxidant Enzymes. Biol. Plant. 2007, 51, 401–406. [Google Scholar] [CrossRef]
  78. Fazal, H.; Abbasi, B.H.; Ahmad, N.; Ali, S.S.; Akbar, F.; Kanwal, F. Correlation of Different Spectral Lights with Biomass Accumulation and Production of Antioxidant Secondary Metabolites in Callus Cultures of Medicinally Important Prunella Vulgaris L. J. Photochem. Photobiol. B Biol. 2016, 159, 1–7. [Google Scholar] [CrossRef] [PubMed]
  79. Yu, W.; Liu, Y.; Song, L.; Jacobs, D.F.; Du, X.; Ying, Y.; Shao, Q.; Wu, J. Effect of Differential Light Quality on Morphology, Photosynthesis, and Antioxidant Enzyme Activity in Camptotheca Acuminata Seedlings. J. Plant Growth Regul. 2017, 36, 148–160. [Google Scholar] [CrossRef]
  80. Saleem, M.H.; Rehman, M.; Zahid, M.; Imran, M.; Xiang, W.; Liu, L. Morphological Changes and Antioxidative Capacity of Jute (Corchorus Capsularis, Malvaceae) under Different Color Light-Emitting Diodes. Braz. J. Bot. 2019, 42, 581–590. [Google Scholar] [CrossRef]
  81. Zheng, L.; Van Labeke, M.-C. Chrysanthemum Morphology, Photosynthetic Efficiency and Antioxidant Capacity Are Differentially Modified by Light Quality. J. Plant Physiol. 2017, 213, 66–74. [Google Scholar] [CrossRef]
  82. Juwei, H.U.; Xin, D.A.I.; Guangyu, S.U.N. Morphological and Physiological Responses of Morus Alba Seedlings under Different Light Qualities. Not. Bot. Horti Agrobot. 2016, 44, 382–392. [Google Scholar]
  83. Vitale, E.; Izzo, L.G.; Amitrano, C.; Velikova, V.; Tsonev, T.; Simoniello, P.; De Micco, V.; Arena, C. Light Quality Modulates Photosynthesis and Antioxidant Properties of B. Vulgaris L. Plants from Seeds Irradiated with High-Energy Heavy Ions: Implications for Cultivation in Space. Plants 2022, 11, 1816. [Google Scholar] [CrossRef]
  84. Velez-Ramirez, A.I.; Van Ieperen, W.; Vreugdenhil, D.; Millenaar, F.F. Plants under Continuous Light. Trends Plant Sci. 2011, 16, 310–318. [Google Scholar] [CrossRef]
  85. Haque, M.S.; Kjaer, K.H.; Rosenqvist, E.; Ottosen, C.O. Continuous Light Increases Growth, Daily Carbon Gain, Antioxidants, and Alters Carbohydrate Metabolism in a Cultivated and a Wild Tomato Species. Front. Plant Sci. 2015. [Google Scholar] [CrossRef] [Green Version]
  86. Xiao-jing, W.; Xiao-li, C.; Wen-zhong, G.U.O.; Hai-ping, L.I.; Ling-zhi, L.I. Effects of LED Green Light on Growth and Quality of Lettuce. Chin. J. Agrometeorol. 2019, 40, 25. [Google Scholar]
  87. Ajdanian, L.; Babaei, M.; Aroiee, H. Investigation of Photosynthetic Effects, Carbohydrate and Starch Content in Cress (Lepidium Sativum) under the Influence of Blue and Red Spectrum. Heliyon 2020, 6, e05628. [Google Scholar] [CrossRef]
  88. Azcón-Bieto, J. Inhibition of Photosynthesis by Carbohydrates in Wheat Leaves. Plant Physiol. 1983, 73, 681–686. [Google Scholar] [CrossRef]
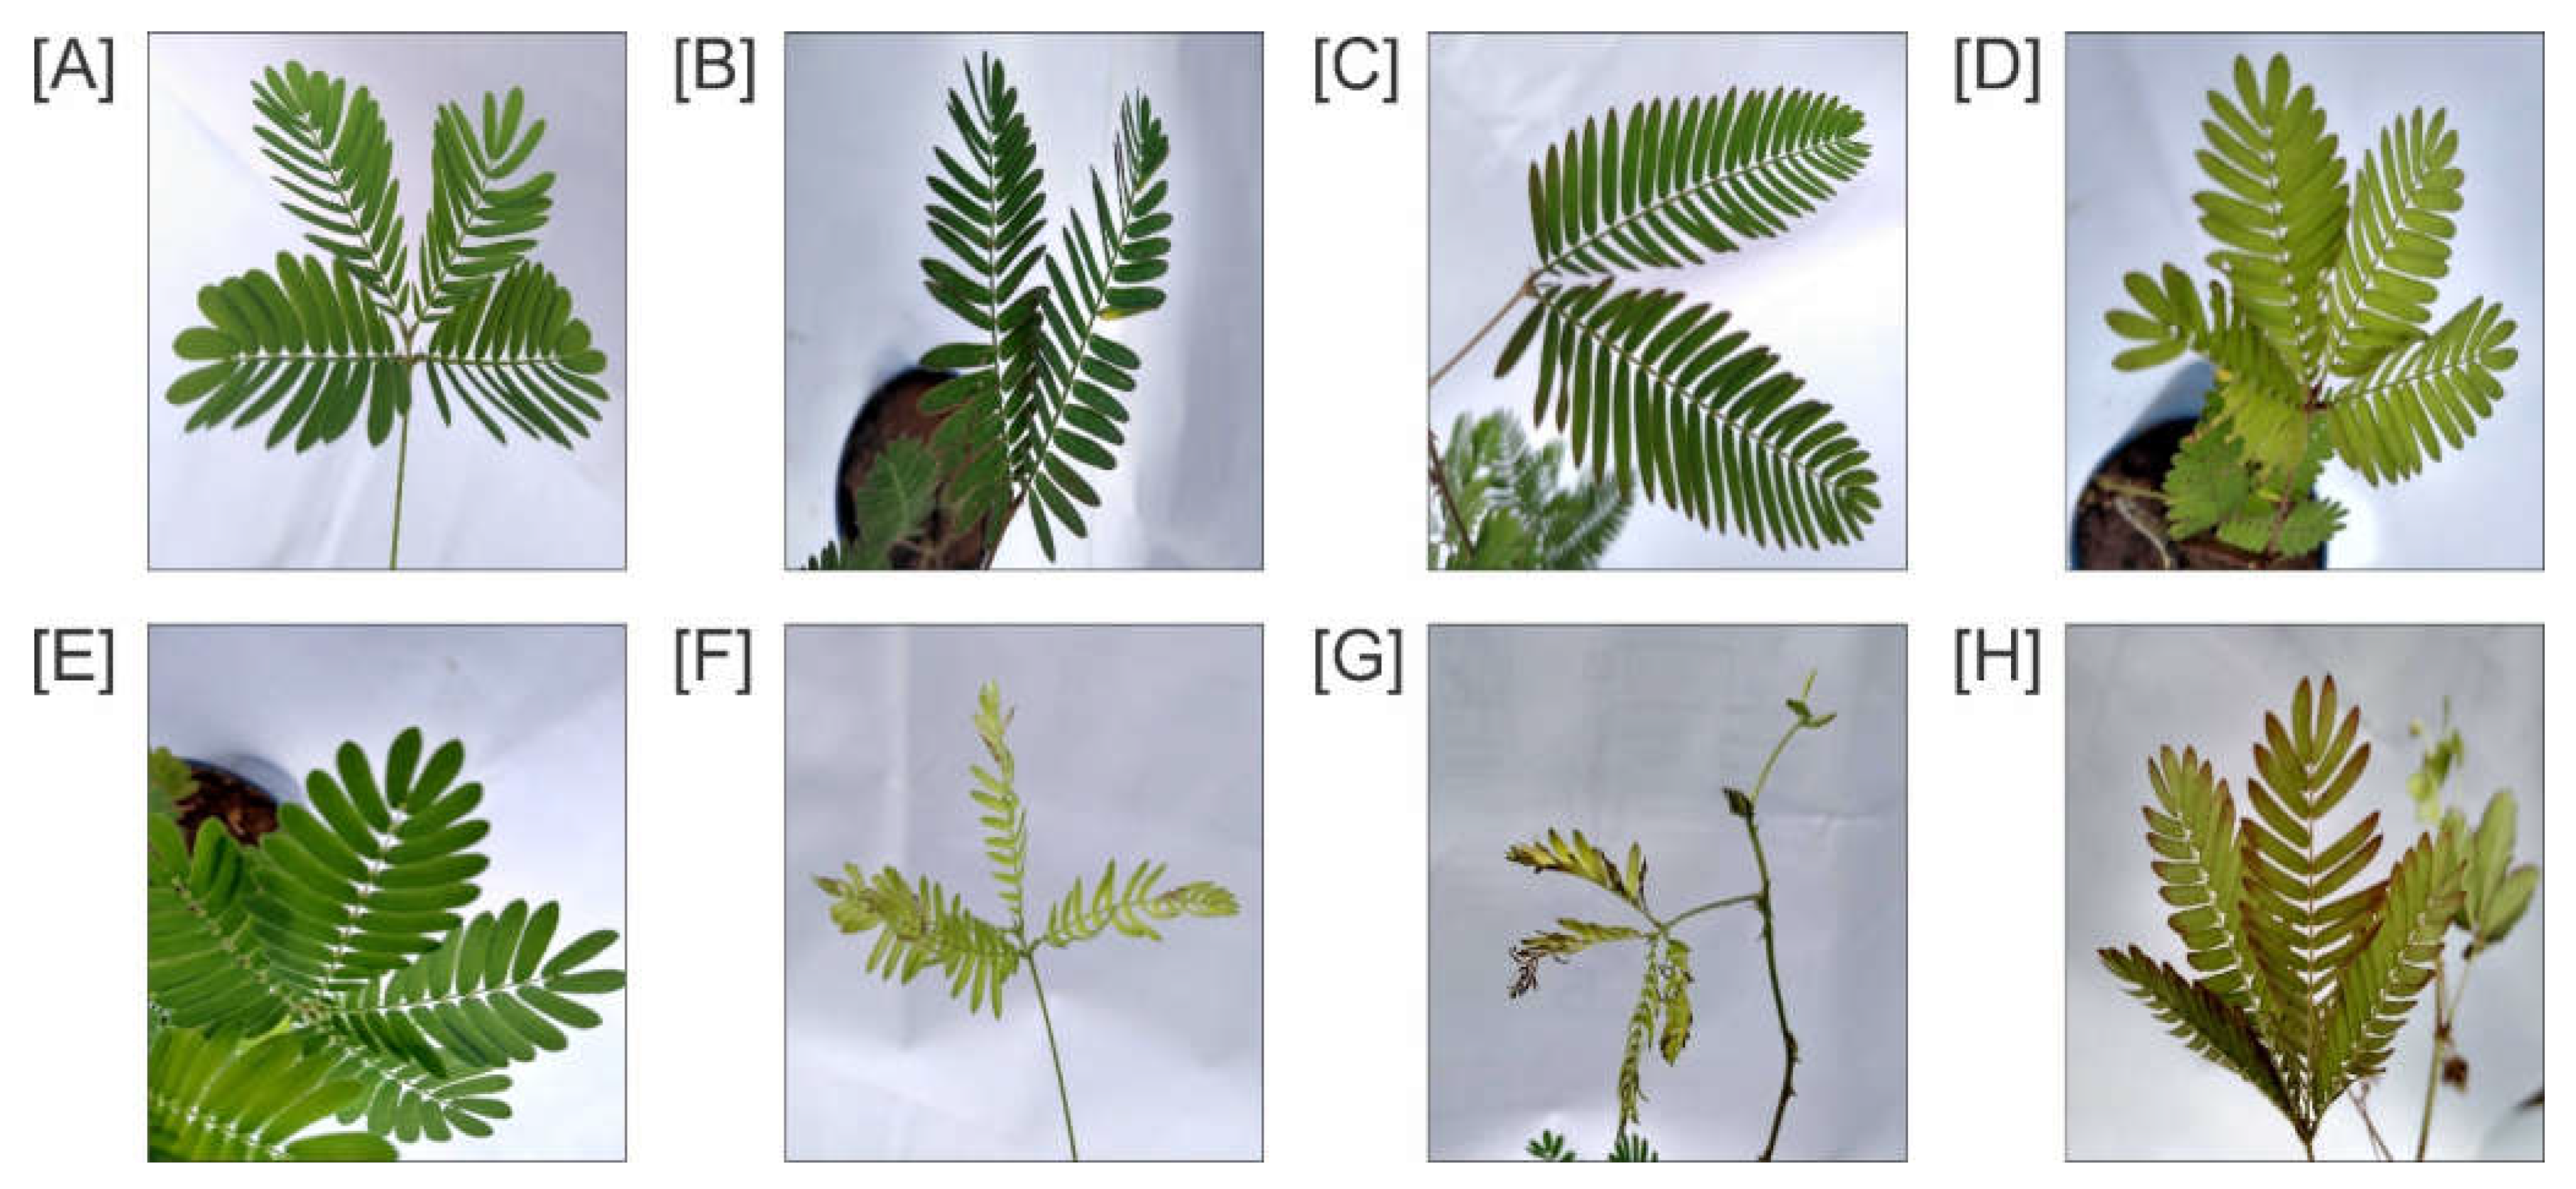
Figure 1. Leaves of M. pudica on initial day (0th day) (AD) and under white (E), blue (F), green (G) and red (H) light for the 12th day in the 12/12 h photoperiod.
Physiologia 02 00012 g001
Figure 2. Leaves of M. pudica on initial day (0th day) (AD) and under white (E), blue (F), green (G) and red (H) light for the 12th day in the 24/0 h photoperiod.
Physiologia 02 00012 g002
Figure 3. SOD activity in M. pudica grown under (A) white, (B) blue, (C) green and (D) red light. Values are presented in the average of triplicates ± SD. Black and blue color bar shows the 12/12 h light period, while, blue bar shows the 24/0 h photoperiod. Different characters show significant differences among the results (p  ≤  0.05).
Physiologia 02 00012 g003
Figure 4. Catalase activity in M. pudica grown under (A) white, (B) blue, (C) green and (D) red light. Values are presented in the average of triplicates ± SD. Black and blue color bar shows the 12/12 h light period, while, blue bar shows the 24/0 h photoperiod. Different characters show significant differences among the results (p  ≤  0.05).
Physiologia 02 00012 g004
Figure 5. GPOD activity in M. pudica grown under (A) white, (B) blue, (C) green and (D) red light. Values are presented in the average of triplicates ± SD. Black and blue color bar shows the 12/12 h light period, while, blue bar shows the 24/0 h photoperiod. Different characters show significant differences among the results (p  ≤  0.05).
Physiologia 02 00012 g005
Figure 6. MDA content in M. pudica grown under (A) white, (B) blue, (C) green and (D) red light. Values are presented in the average of triplicates ± SD. Black and blue color bar shows the 12/12 h light period, while, blue bar shows the 24/0 h photoperiod. Different characters show significant differences among the results (p  ≤  0.05).
Physiologia 02 00012 g006
Figure 7. Proline content in M. pudica grown under (A) white, (B) blue, (C) green and (D) red light. Values are presented in the average of triplicates ± SD. Black and blue color bar shows the 12/12 h light period, while, blue bar shows the 24/0 h photoperiod. Different characters show significant differences among the results (p  ≤  0.05).
Physiologia 02 00012 g007
Figure 8. Starch content in M. pudica grown under (A) white, (B) blue (C) green and (D) red light. Values are presented in the average of triplicates ± SD. Black and blue color bar shows the 12/12 h light period, while, blue bar shows the 24/0 h photoperiod. Different characters show significant differences among the results (p  ≤  0.05).
Physiologia 02 00012 g008
Figure 9. Chlorophyll content in M. pudica grown under (A) white, (B) blue (C) green and (D) red light. Values are presented in the average of triplicates ± SD. Black and blue color bar shows the 12/12h light period, while, blue bar shows the 24/0 h photoperiod. Different characters show significant differences among the results (p  ≤  0.05).
Physiologia 02 00012 g009
Figure 10. OJIP curve of M. pudica grown under (A) white, (B) blue, (C) green and (D) red light. Values represent mean of ten independent measurements.
Physiologia 02 00012 g010
Figure 11. Leaf model of M. pudica on initial day (0th day) (AD) and under white (E), blue (F), green (G) and red (H) for the 12th day in the 12/12 h photoperiod. Leaf model of M. pudica on initial day (0th day) (IL) and under white (E), blue (F), green (G) and red (H) light for the 12th day in the 24/0 h photoperiod. (MP) represents 12th 341 day readings in W, B, G and R light for 24 h.
Physiologia 02 00012 g011
Table 1. Changes in different photosynthetic parameters in different light conditions. Where W12 (white light for 12 h), B12 (blue light for 12 h), G12 (green light for 12 h), R12 (red light for 12 h), W24 (white light for 24 h), B24 (blue light for 24 h), G24 (green light for 24 h), R24 (red light for 24 h). Values are presented in the average of triplicates ± SD. Different characters show significant differences among the results (p ≤ 0.05).
Light ConditionObservation Time (Days)FMΦPoΦEoΦDoPIabs
W1201317 ± 175.53 ns0.8033 ± 0.05 ns0.6112 ± 0.01 ns0.1967 ± 0.01 ns124.5912 ± 7.56 ns
W12121321 ± 196.23 ns0.8055 ± 0.03 ns0.62 ± 0.03 ns0.1945 ± 0.03 ns121.9445 ± 10.23 ns
W2401365 ± 151.36 a0.8029 ± 0.02 ns0.6029 ± 0.09 ns0.1971 ± 0.04 a108.5457 ± 11.98 a
W2412475 ± 85.23 b0.4505 ± 0.05 ns0.1937 ± 0.07 ns0.5495 ± 0.05 b1.8076 ± 13.78 b
B1201232 ± 168.96 a0.7792 ± 0.10 ns0.4074 ± 0.05 a0.2208 ± 0.06 ns31.6599 ± 5.87 a
B1212430 ± 74.25 b0.7256 ± 0.04 ns0.5116 ± 0.04 b0.2744 ± 0.02 ns40.5881 ± 8.23 b
B240834 ± 156.36 ns0.7014 ± 0.05 ns0.3897 ± 0.02 a0.2986 ± 0.02 a17.3892 ± 12.47 a
B2412291 ± 48.65 ns0.4983 ± 0.03 ns0.2955 ± 0.06 b0.5017 ± 0.04 b6.2586 ± 13.48 b
G1201346 ± 198.23 a0.7964± 0.06 ns0.5683 ± 0.08 ns0.2036 ± 0.03 a78.3994 ± 9.72 a
G1212523 ± 79.56 b0.5373 ± 0.08 ns0.2658 ± 0.03 ns0.4627 ± 0.05 b5.559 ± 13.56 b
G2401372 ± 145.84 a0.7934 ± 0.05 ns0.5591 ± 0.05 a0.207 ± 0.06 a74.6763 ± 10.89 a
G2412231 ± 56.87 b0.3939 ± 0.07 ns0.2121 ± 0.04 b0.6061 ± 0.08 b2.6136 ± 11.43 b
R1201465 ± 199.23 a0.8096 ± 0.08 ns0.6089 ± 0.02 a0.1904 ± 0.03 a121.8065 ± 15.98 a
R1212535 ± 98.57.25 b0.5869 ± 0.09 ns0.2953 ± 0.10 b0.4131 ± 0.02 b4.9906 ± 18.25 b
R2401434 ± 174.84 a0.7964 ± 0.06 a0.5886 ± 0.09 a0.2036 ± 0.01 a93.8863 ± 11.78 a
R2412117 ± 23.38 b0.1795 ± 0.10 b0.0684 ± 0.10 b0.8205 ± 0.02 b0.1964 ± 9.58 b
Publisher’s Note: MDPI stays neutral with regard to jurisdictional claims in published maps and institutional affiliations.