Article

Antimicrobial Activity of Diffusible Substances Produced by Lactococcus lactis Against Bacillus cereus in a Non-Contact Co-Culture Model

School of Chemical Engineering, University of Birmingham, Birmingham B15 2TT, UK
*
Author to whom correspondence should be addressed.
Hygiene 2024, 4(4), 469-482; https://doi.org/10.3390/hygiene4040035
Submission received: 28 August 2024 / Revised: 6 October 2024 / Accepted: 30 October 2024 / Published: 5 November 2024
(This article belongs to the Special Issue Food Hygiene and Human Health)

Abstract

:
The symptoms of foodborne illness caused by Bacillus cereus often go unreported, complicating the effectiveness of conventional chemical and physical methods used to inhibit its growth in food production. This challenge, combined with the increasing use of lactic acid bacteria (LAB) in the food industry and consumer preference for minimally processed products, prompted this study. The antibacterial activity of diffusible substances produced by Lactococcus lactis ATCC 11454 against Bacillus cereus NC11143 and Escherichia coli K-12 MG1655 was investigated using a non-contact co-culture model utilising deMann Rogosa and Sharpe broth, with glucose as a carbon source. This study employed plate counting and flow cytometry to assess the impact of these substances on bacterial growth and to analyse their composition and antimicrobial efficacy. The co-culture of Lactococcus lactis ATCC 11454 resulted in the production of a stable antimicrobial peptide, which was heat resistant and acid tolerant. Purification was achieved via ammonium sulphate precipitation and preparative HPLC, yielding a peptide with a molecular mass of 3.3 kDa, with daughter ion fractions similar to nisin A. Antimicrobial activity studies demonstrated that the diffusible substances effectively inhibited B. cereus growth over a period of eight days and exhibited bactericidal activity, killing 99% of the B. cereus cells. Additionally, these substances also inhibited Escherichia coli K-12 MG1655 grown under similar conditions. Comparative analysis revealed that in the co-culture assay, L. lactis produced a 50% higher yield of the antimicrobial peptides compared to pure cultures. Similarly, the specific growth rate of L. lactis was four times higher. With respect to protein purification and concentration, ammonium sulphate precipitation coupled with solid phase extraction was most effective in the purification and concentration of the diffusible substances. The findings provide a basis for utilising bacteriocin-producing strains as a preservation method, offering an alternative to traditional chemical and physical control approaches especially for the food industry.

1. Introduction

Foodborne diseases are infectious diseases caused by the consumption of food contaminated with pathogens or their toxins, among them bacteria and bacteria metabolites [1]. In fact, foodborne diseases are one of the most widespread health problems in the world today and have a considerable impact on health care, trade, productivity, tourism, and the economy [2]. Bacillus cereus, a Gram-positive, spore-forming, rod-shaped, and foodborne pathogenic bacteria is associated with diarrheal syndrome and emetic syndrome through the production of distinct toxins [3,4]. In addition, it can also cause non-gastrointestinal illnesses, including endocarditis, pneumonia, meningitis, etc. In particular, newborns and those with low immunity are more likely to contract these diseases [5]. Between 1.4% and 12% of foodborne outbreaks worldwide are believed to be caused by B. cereus [6]. Although it accounts for only a small proportion of the total number of foodborne illness outbreaks, severe infections and fatalities are on the rise [7,8]. Since most food poisoning outbreaks caused by B. cereus are usually mild and do not require medical attention and have symptoms similar to those of viral illnesses, the majority of cases go unreported to the health authorities and this percentage is underestimated [9,10]. B. cereus can produce spores that are resistant to heat and desiccation, allowing them to survive for long periods of time in harsh environments, which can lead to recurrent infections including nosocomial infections [9,11]. Further, it is resistant to some antibiotics such as penicillin, cephalosporins, and ampicillin as well as heat and radiation [10,11]. Identifying effective mechanisms for the control of Bacillus cereus has become increasingly important, and several methods have been proposed. Within the food and allied industries, several techniques such as heat treatments, cold plasma treatments, and UV irradiation are commonly used to inhibit the growth of B. cereus [10]. However, these methods are generally effective at reducing vegetative cells but not spores [11]. The bacteria’s ability to form heat-resistant spores poses a significant challenge for these techniques, leading to decreased food quality and potential health risks [5]. Consequently, the limitations of traditional chemical and physical methods highlight the need for the development of more effective and convenient approaches to inhibit or eliminate B. cereus in foods.
Lactic acid bacteria (LAB) is a distinct group of bacteria that can ferment diverse sugars with the production of lactic acid and other metabolites which can have antagonistic activities against other microbial species [12,13,14]. The lactic acid bacteria are used in fermentations and as protective cultures in foods in which they compete against food spoilage organisms and inhibit their proliferation through the antagonistic activities of their metabolites [15,16]. Metabolites of LAB include compounds with antibacterial or bactericidal activity, such as lactic acid, which act against the outer membrane of bacteria, causing lysis, bacteriocins (kills or inhibits bacteria through specific immune proteins), diacetyl (antibacterial at low pH), and hydrogen peroxide (a strong oxidising agent that disrupts bacterial activity) [17,18,19,20]. Among the metabolites of LAB, bacteriocins are unique and of particular interest as they are very stable, resistant to temperature and enzymatic inactivation, non-resistant, and have little impact on the organoleptic quality and nutritional value of food products [21]. These make them a potent option for use in food fortification, especially because of their spectrum of activity against specific food spoilers including B. cereus [22].
Bacteriocins are antimicrobial peptides or proteins synthesised by bacterial ribosomes, including nisin, lacticin, pediocin, etc. [23]. They are important food preservatives and are valued for their probiotic, para-probiotic, and postbiotic effects. Among them, nisin is the most widely used bacteriocin in more than 50 countries and is approved by the Food and Agriculture Organization (FAO) and the European Union (EU) Commission and is generally regarded as safe (GRAS) [24]. It kills or inhibits the growth of other related (narrow-spectrum) or unrelated (broad-spectrum) microorganisms, and its bactericidal activity is primarily directed against Gram-positive organisms, and usually fails to affect the growth of Gram-negative organisms [25,26,27]. However, some Gram-negative bacteria (e.g., Salmonella, E. coli) can also be inhibited by nisin under certain conditions (e.g., lowered pH) [28]. In addition, nisin can inhibit spores by inhibiting pre-emergence swelling [29]. However, its direct use as a food additive is challenged by production difficulties, instability and high prices [30,31,32]. There are three main ways to use bacteriocins as preservatives to extend the shelf life of food products: adding purified or semi-purified bacteriocins directly to food as food additives, inoculating food with bacteriocin-producing strains, and using fermented products of bacteriocin-producing strains as ingredients [32]. Among them, the inoculation of bacteriocin-producing strains into food products is gaining momentum as many bacteriocin-producing bacteria are probiotic in nature and are further utilised as starter cultures in many foods. Thus, they can be conveniently employed for these purposes while secreting metabolites such as bacteriocins into the food which has a protective role of microbial inhibition. The ability of LAB, including Lactococcus sp. which produces nisin to serve as protective cultures in foods, is currently receiving increased attention [16,24]. Therefore, L. lactis was selected as the lactic acid bacteria for bacteriocin production in this co-culture study to simulate a food environment contaminated with Bacillus cereus. This investigation was achieved using a non-contact co-culture model as previously explored by studies on the effect of diffusible substances on Listeria monocytogenes (L. monocytogenes) and Salmonella [15].
The overarching purpose of this study was to assess the effect of diffusible substances produced by L. lactis on the growth of B. cereus. It was also to determine the composition and content of the diffusible substance produced by Lactococcus lactis and to assess its antimicrobial effect to provide a basis for the use of the organism as a protective culture in food and feeds.

2. Materials and Methods

2.1. The Co-Culture Model and Data Collection

The Corning Transwell polycarbonate permeable membrane scaffold (Costar, 3450, Saint Louis, MO, USA) (24 mm diameter insert with 0.4 µm pore size, 6-well plate) was chosen as the plate for the co-culture model. Each well plate has an upper and lower chamber to separate the two bacteria cultures, and a permeable membrane between the two chambers that allows the diffusible material produced in the upper layer to permeate to the lower layer via gravity. Escherichia coli K-12 MG1655 (a representative of Gram-negative bacteria) was used as a control group for the growth of B. cereus NC11143 (Gram-positive bacteria). There are two types of co-cultures: (1) the L. lactis ATCC 11454 and B. cereus co-culture (L + B), achieved by inoculating an inoculum of 0.5 mL L. lactis into upper chambers containing 2 mL of de Mann Rogosa and Sharpe (MRS) broth (Sigma-Aldrich, 69966, Dorset, UK) and 0.2 mL of B. cereus into the lower chamber containing 3 mL of nutrient broth (Oxoid, CM0001, Basingstoke, UK) and (2) control experiments containing inoculum of L. lactis in MRS broth in the upper chamber and E. coli in the lower chamber as previously described. This was designated as L + E. All the experiments were performed in triplicates for statistical purposes and to calculate the mean and standard deviations. Each bacterium was also inoculated into flasks and cultured alone as controls (Bacillus (B) alone, E. coli (E) alone, and Lactococcus (L) alone) for the co-culture model. To obtain a standard inoculum of these organisms, the linear relationship between OD and CFU of the cells were determined by culture and spectrophotometric measurements at 600 nm using a Jenway 6300 spectrophotometer (Bibby Scientific Ltd., Stone, UK). This was used to develop a standard curve. When it is necessary to determine the cell concentration of the bacterial solution used, the corresponding CFU can be obtained by measuring the OD value and fitting it into the OD-CFU curve. The bacteria load utilised for co-culture experiments are 6.32 × 10⁹ CFU/mL B. cereus, 1.41 × 10⁸ CFU/mL E. coli, and 1.12 × 10⁸ CFU/mL L. lactis.
L. lactis was inoculated for 24 h in advance in a co-culture plate, followed by B. cereus or E. coli depending on experimental design. After both species had been inoculated, they were incubated using a Benchtop orbital shaker (Thermo Scientific, MaxQ 4000, Waltham, MA, USA) at 37 °C, 50 rpm for 18 h to encourage bacteria growth, metabolite production, and diffusion. Following this, the plates were placed in the refrigerator at 4 °C and stored for a period of 8 days. At regular intervals, aliquots from both chambers were collected to measure the microbial load and antimicrobial activities of the supernatants against the test organisms over the storage period at refrigeration temperature. Each culture was sampled and tested separately each day. The number of bacteria was tested by the plate counts method and calculated as log colony-forming units (CFU)/mL.

2.2. Flow Cytometry Analysis

Flow cytometry (FCM) was employed to highlight the status of the bacteria in the co-culture model and to obtain the number and proportion of live, viable but non-culturable (VBNC) and dead cells. For flow cytometric analysis, an initial sample of 0.5 mL of each cultured species was taken and diluted with 0.5 mL of phosphate-buffered saline (PBS) (Oxoid, BR0014G, Basingstoke, UK) to obtain 1 mL of sample, which was then washed twice via centrifugation (SciSpin Micro, Rotherham, UK) at 5000 rpm to obtain a relatively pure sample of the cells to be tested. A propidium iodide (PI) stock solution (Sigma-Aldrich, P4170, Saint Louis, MO, USA) was then prepared following the manufacturer’s instructions at a concentration of 500 µg/mL and the working solution was prepared from the stock solution [33]. 10 µL of the cell was introduced into a test tube containing 1 mL of PBS. To this, 20 µL of PI was added and the mixture was incubated at 37 °C for 5 min. Stained samples were detected using a BD Accuri™ C6 plus flow cytometer (BD Biosciences, Ann Arbor, MI, USA). For each sample, 25,000 events were collected at an event rate of 1000–4000 events/s and detected at an excitation wavelength of 488 nm and an emission wavelength of 525 nm [34]. The batch analysis of forward and side scatter as well as the plotting of living vs. dead bacteria were performed using gates previously collected from live and dead B. cereus, E. coli, and L. lactis, respectively, using the BD Accuri C6 Software.

2.3. Preparation of Diffusible Substances

L. lactis was grown aerobically in a flask containing MRS media supplemented with glucose. After a 48 h incubation period, the growth medium was centrifuged (Eppendorf, 5810, Darmstadt, Germany) at 3900 rpm for 20 min. The supernatant was collected and filtered through Whatman filter paper No. 2 to remove all the producer organisms. Furthermore, the supernatant was plated on MRS agar and nutrient agar to confirm the absence of life microbial cells and was observed after 24 h of incubation at 37 °C [35]. The proteins in the diffusible substances were purified using ammonium sulphate solid and liquid precipitation methods, respectively [36,37]. The diffusible substances (S) precipitated by the ammonium sulphate solution and the diffusible substances (P) precipitated by the ammonium sulphate powder were obtained and stored in a refrigerator (Panasonic, Ultra-Low Temperature Freezer MDF-U55V, Osaka, Japan) at −80 °C.

2.4. The Total Protein Content of Diffusible Substances

This experiment used the bicinchoninic acid (BCA) protein assay (Thermo Scientific, 23235, USA) to determine the total protein content of the diffusible substances S and P. The control group was 1000 (International units) IU of nisin. Nisin activity, expressed in International Units (IU), refers to the amount of nisin required to inhibit the growth of 1 bacterial cell in 1 millilitre of broth. 1 IU of nisin is equivalent to 0.025 µg. To make 1000 IU nisin, 25 µg of nisin (Sigma-Aldrich, USA) was dissolved in 1 mL of water with 0.02 N HCl (Sigma-Aldrich, USA), and then filtered through a 0.2 µm filter to sterilize it [38]. The albumin standard used in this experiment was Bovine serum albumin (BSA). The samples were prepared using the BCA Protein Assay Kit (Thermo scientific, 23235, Rockford, IL USA) and measured using the spectrophotometer (Jenway, 6300, Bibby Scientific Ltd., Stone, UK) at an optical density (OD) of 562 nm to produce a standard colour response curve for BSA protein as has been previously reported [39]. Using this standard curve protein quantification of the unknown samples (S and P) was achieved via measuring their OD and fitting them into the standard curves.

2.5. The Purification and Identification of Bacteriocin Fractions

The purification and identification of bacteriocin fractions was carried out in a Shimadzu Prominence High-Performance Liquid Chromatograph (HPLC) equipped with a UV–Photodiode Array Detector (Shimadzu, Milton Keynes, UK). A C18 column (microsob 100-5 Si 250 × 4.6 mm) was used for sample separation [40]. Prior to HPLC analysis, bacteriocin fractions were filtered through Millex PTFE filters (4 mm, 0.20 μm pore size) purchased from Merck Millipore (Darmstadt, Germany). The chromatographic separation of the sample was undertaken at 40 °C with a flow rate of 100 µL min−1 and an injection volume of 20 µL. The mobile phase consisted of A-water with 0.05% Trifluoroacetic acid (TFA) and B-methanol with 0.05% TFA. The chromatographic method had a total run time of 38 min. After an initial hold time of 3 min (A), a gradient run of 0% A–100% B was undertaken for 30 min. This was followed by 5% column re-equilibration in A. Retention times of 27.5 min and 28.9 min were obtained. UV detection was undertaken at a wavelength of 215 nm. The experimental control and analysis of the results were undertaken using Chromeleon V6.80 [41].

2.6. Evaluation of the Antimicrobial Activity of Diffusible Substances

The disc diffusion assay was used to investigate the antimicrobial activity of the diffusible material produced in the direct and co-culture assays by inoculating standardised cultures of the test B. cereus on a nutrient agar (Oxoid, CM0003, UK) plate. 9 mm wells were punched in the agar plate using a sterile cork borer and, to this, 0.1 mL of the diffusible substances (S or P) was added and incubated upright for 24 h at 37 °C for the determination of the inhibition zone [42,43].
The minimal inhibitory concentration (MIC) of the diffusible substances (S and P) was determined by using the tube dilution assay [44]. The samples were made by adding reducing concentrations of the diffusible material (S or P) (500, 333, 250, 200, 167, 143 and 0 mg/mL) to tubes of Müller Hinton broth (MHB) and nutrient broth containing inoculated B. cereus. The MIC of the diffusible substances (S or P) was obtained by comparing the inhibition effect of the different concentrations via spectrophotometric measurements.

2.7. Data Processing and Statistical Analysis

All the experiments were repeated in duplicates. CFU assays and FCM analyses were performed in parallel for control cultures and co-cultures. Statistical analysis was performed using Microsoft Excel Version 2402 to generate graphs and calculate means and standard deviations (indicated as error bars in the graphs). The t-test was performed using GraphPad Prism v. 9 to determine if significant differences existed between the co-culture and control CFUs. A significant difference was deemed to exist if the p value ≤ 0.05.

3. Results and Discussion

3.1. The CFU Data of Co-Culture Model from Plate Cultures

The t-test for the co-culture (L + B) and controls (B alone) resulted in p = 0.0013; the t-test for the co-culture (L + E) and controls (E alone) resulted in p = 0.0009. The p values for both were ≤0.05, so they are significantly different. The data for B. cereus and E. coli were analysed further below, respectively.

3.1.1. Counts of B. cereus Following Co-Culture

Figure 1 shows the plate counting results for B. cereus from day one (D1) to day eight (D8), using log CFU/mL as the unit. The blue dashed line is the trend line for the change in log CFU/mL over the days of B alone, and the orange dashed line is the trend line for L + B. The CFU of the control group (B alone) generally increased with the number of days, while the co-culture (L + B) showed a slight downward trend in CFU. This resulted in an increasing difference between them. The difference between the first and second day was the smallest and almost identical at 1.65 and 1.63 log CFU/mL, respectively. The last day showed the largest difference with a log reduction of 4.03 log CFU/mL. On the seventh day, the data for co-culture (L + B) did not follow the same trend as the other days, but increased and reached 6.53 log CFU/mL. Overall, the co-culture model showed a lower CFU of B. cereus than the individual cultures, with an average reduction of approximately 31%. The CFU of co-culture (L + B) was significantly lower than the CFU of control cultures during these 8 days, and this difference remained constant throughout the experiment. This indicated an inhibitory effect in the co-culture with results in agreement with a previous research utilising a co-culture asssay containing L. lactis and L. monocytogenes or Salmonella enterica serovar enteritidis (S. enteritidis) [15]. It also showed a significant reduction in bacterial concentration in the co-cultures compared to the control cultures, which is similar to the conclusion reached in this experiment [15].

3.1.2. Counts of E. coli Following Co-Culture

Figure 2 shows the plate counting results for E. coli from day one (D1) to day eight (D8). The blue dashed line is the trend line for the change in log CFU/mL over the days of E alone, and the orange dashed line is the trend line for L + E. There was an overall slight downward trend in the number of E. coli cultured alone and a significant decreasing trend in the concentration of bacteria in the co-cultures. This resulted in an increasing difference between the co-cultured and E. coli alone concentrations, with the smallest difference being 1.63 log CFU/mL on the first day. The overall data showed that the co-culture model had smaller concentrations of E. coli than the individual cultures, averaging 41% smaller from day one to day six, and even 100% smaller on the last two days. This indicated an inhibitory effect in the co-culture. The bacteriocins produced by the L. lactis strains had an inhibitory effect on E. coli ATCC 25922, which is similar to the results of this experiment [45]. However, the nisin produced by L. lactis had almost no inhibitory effect on E. coli [26]. This means that the diffusible substances produced by L. lactis may also contain other compounds that may inhibit the growth of E. coli, which requires further experiments.

3.2. The FCM Results of Co-Culture Model

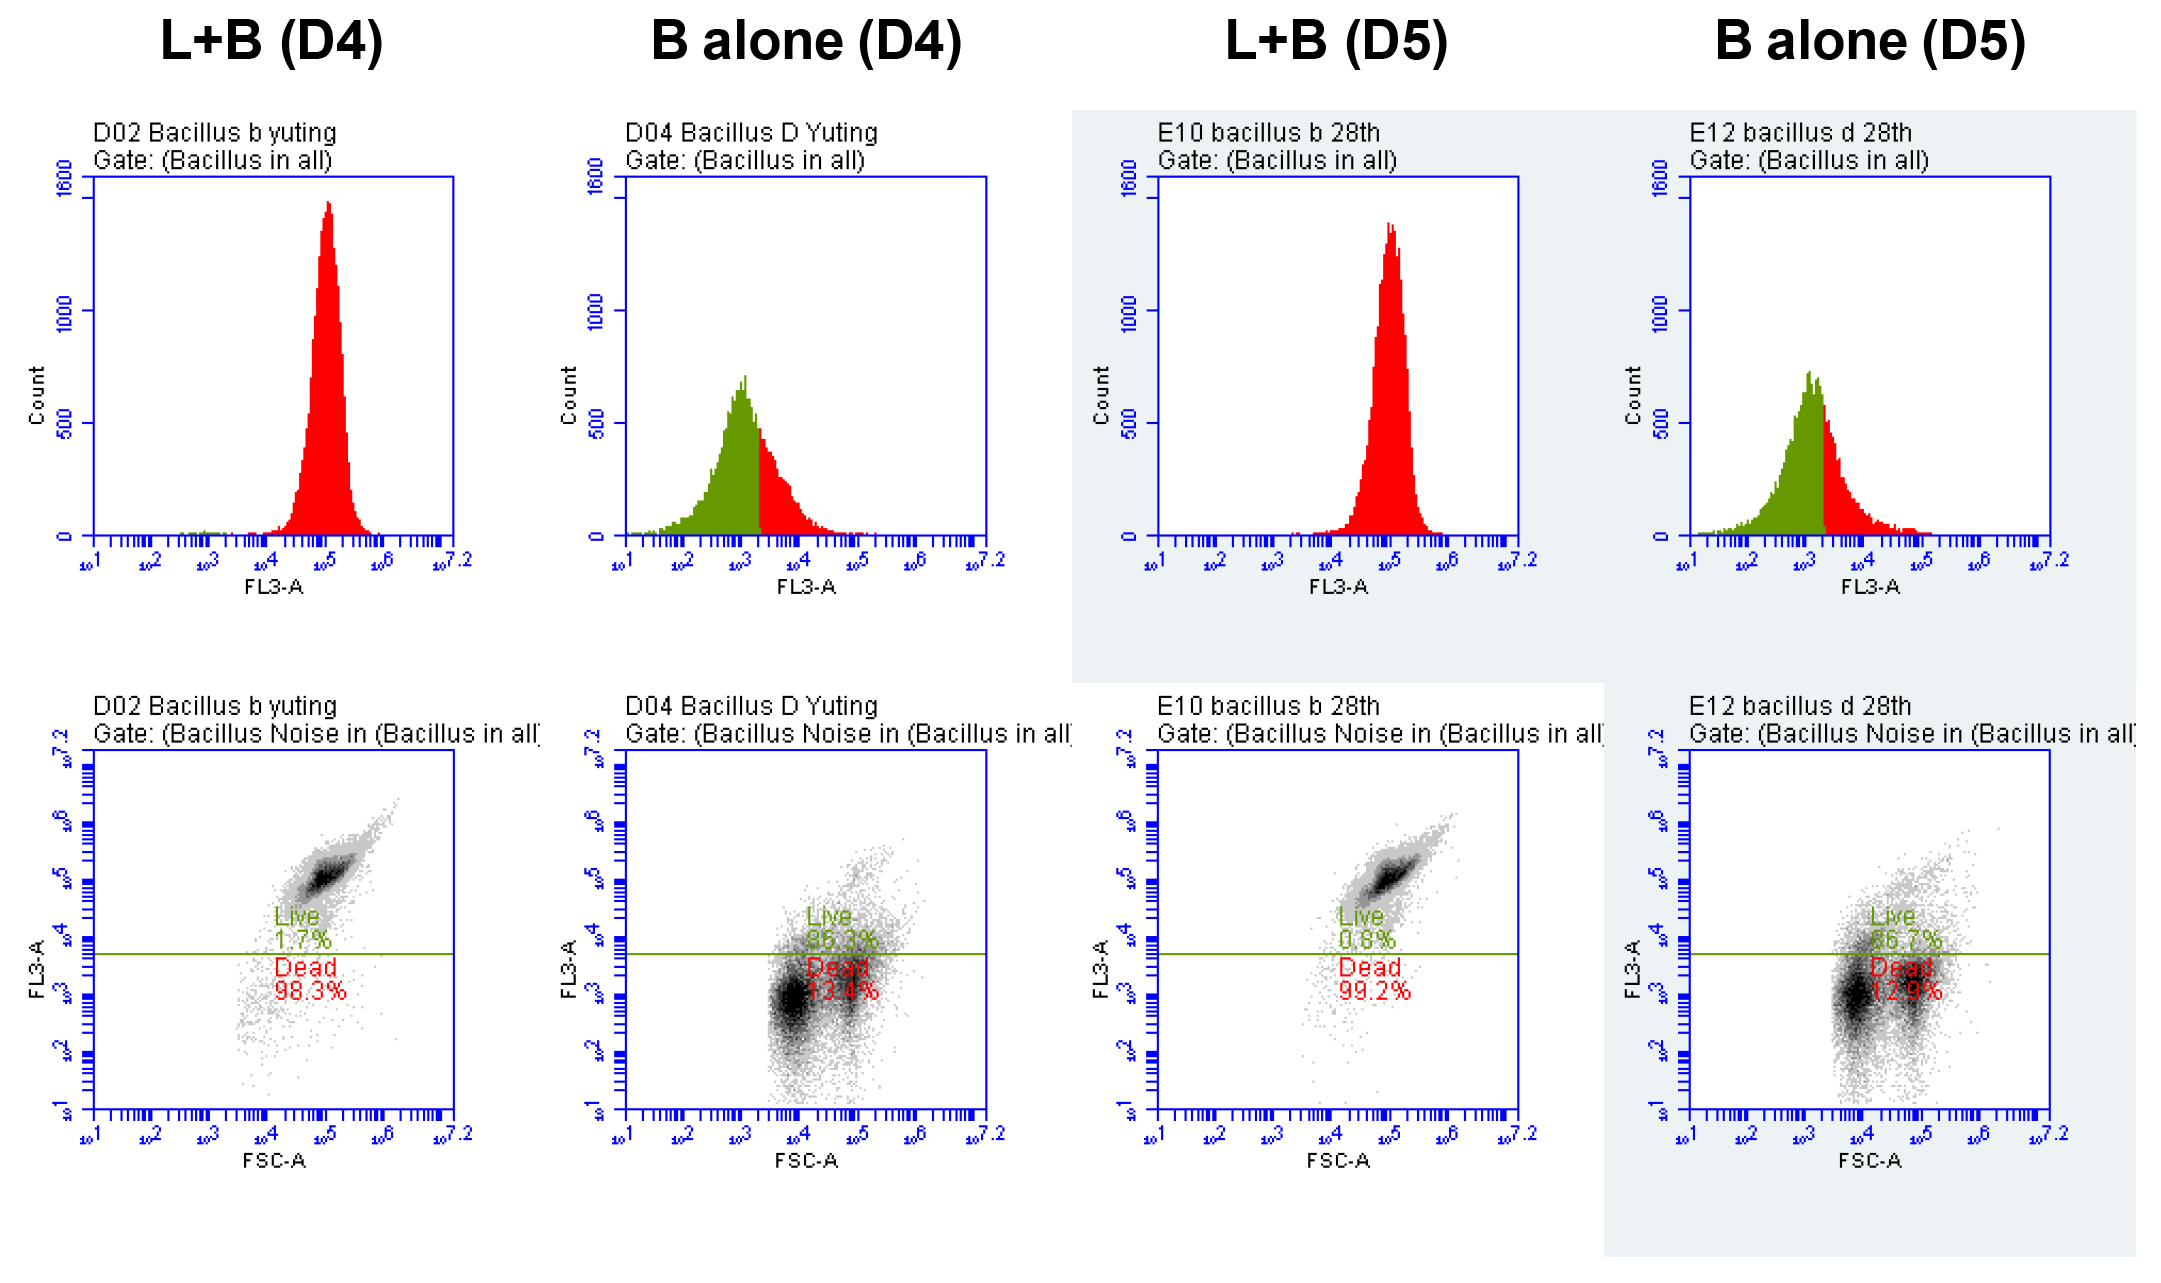
Due to the limitations of the equipment and materials used, the FCM results were only collected for days four and five. Data with around 25,000 events in the plot were selected for analysis, and a set of similar data from the repeated experiments were chosen for analysis. The proportion of live, dead, and injured cells are presented in Figure 3 and Figure 4, Table 1 and Table 2.

3.2.1. Flow Cytometry Measurements of B. cereus

The proportion and number of PI-stained dead cells (red) and non-PI-stained live cells (green) of B. cereus in the samples are shown in Figure 3 and Table 1. It can be seen that the results were similar on both days. By comparing the co-cultures and controls, it can be determined that diffusible substances can kill B. cereus cells and nearly 99% of them.
The results of the plate counts showed that the control group (B. cereus cultured alone) had concentrations of 7.23 log CFU/mL (day 4) and 7.48 log CFU/mL (day 5), respectively (Appendix A). This means that if the percentage of the live cells in the control group was calculated according to the FCM, the concentration of B. cereus in the co-culture should have only been 7.23/85.3% × 1.7% = 0.14 log CFU/mL (Day 4) and 7.48/86.7% × 0.8% = 0.07 log CFU/mL (Day 5). However, the results of the plate counts showed concentrations of B. cereus in the co-culture of 4.6 log CFU/mL (day 4) and 4.75 log CFU/mL (day 5), respectively. The number of live cells counted on the plate was much higher than that obtained via flow cytometry analysis. The possible reason for this is as follows: B. cereus can produce spores, whereas diffusible substances can only inhibit sporulation by suppressing pre-emergence swelling, and cannot induce the formation of spore membrane pores [29,46,47]. In other words, it was unable to kill the spores that had already been produced. Thus, B. cereus may have been producing spores in the co-culture model, but had been inhibited by diffusible substances, and the dilution of diffusible substances using the plate counting method prevented it from inhibiting spore growth and provided suitable growth conditions to allow the spores to resume growth and form colonies. In contrast, flow cytometry measurements recorded the spores as dead cells using only PI-stained samples. This is only speculation and further research is needed to prove this, possibly through microscopic measurements. For example, in previous studies, co-cultured colonies were observed using microscopy and the number of spores contained was counted, and then the relationship between the spore count and plate count was verified via calculation.

3.2.2. Flow Cytometry Measurements of E. coli

Figure 4 and Table 2 show the proportion and number of PI-stained dead cells (red) and non-PI-stained live cells (green) of E. coli in the sample, respectively. It can be seen that the results are similar on both days. When cultured alone, about 98% of the E. coli cells had intact cell membranes and remained alive, compared to 91.3% and 83.4%, respectively, in the co-culture. Most E. coli are still living cells, so the diffusible substances only slightly kill E. coli.
However, the plate counts showed no growth of E. coli in the co-culture on days 4 and 5, but the control (E. coli cultured alone) had concentrations of 7.92 log CFU/mL and 7.12 log CFU/mL on days 4 and 5, respectively. The cells changed to a VBNC state due to diffusible substances, which occurred when LAB (containing L. lactis) and S. enteritidis (Gram-negative) were cultured using the same co-culture model [15]. It can be assumed that most of the cells in the co-culture become VBNC. Therefore, combining the results of the FCM analysis with the plate count results, it can be concluded that diffusible substances were basically unable to kill E. coli but could inhibit its growth. This result contradicts the previously mentioned inability of nisin to affect the growth of Gram-negative bacteria, so the inhibition principle of diffusible substances is not yet known and further studies are needed. The use of Bis-(1,3-Dibutylbarbituric acid) trimethaine oxanol [DiBAC4(3)] (BOX) stain in FCM can detect membrane potentials and distinguish live cells from VBNC cells via changes in the membrane potentials [48]. A further FCM analysis using both BOX and PI stains is also required to verify the previous speculations. In addition, E. coli in its VBNC state is still pathogenic, so it is still a risk to people’s health [49].

3.3. Protein Concentration Analysis of Extracted Diffusible Substances

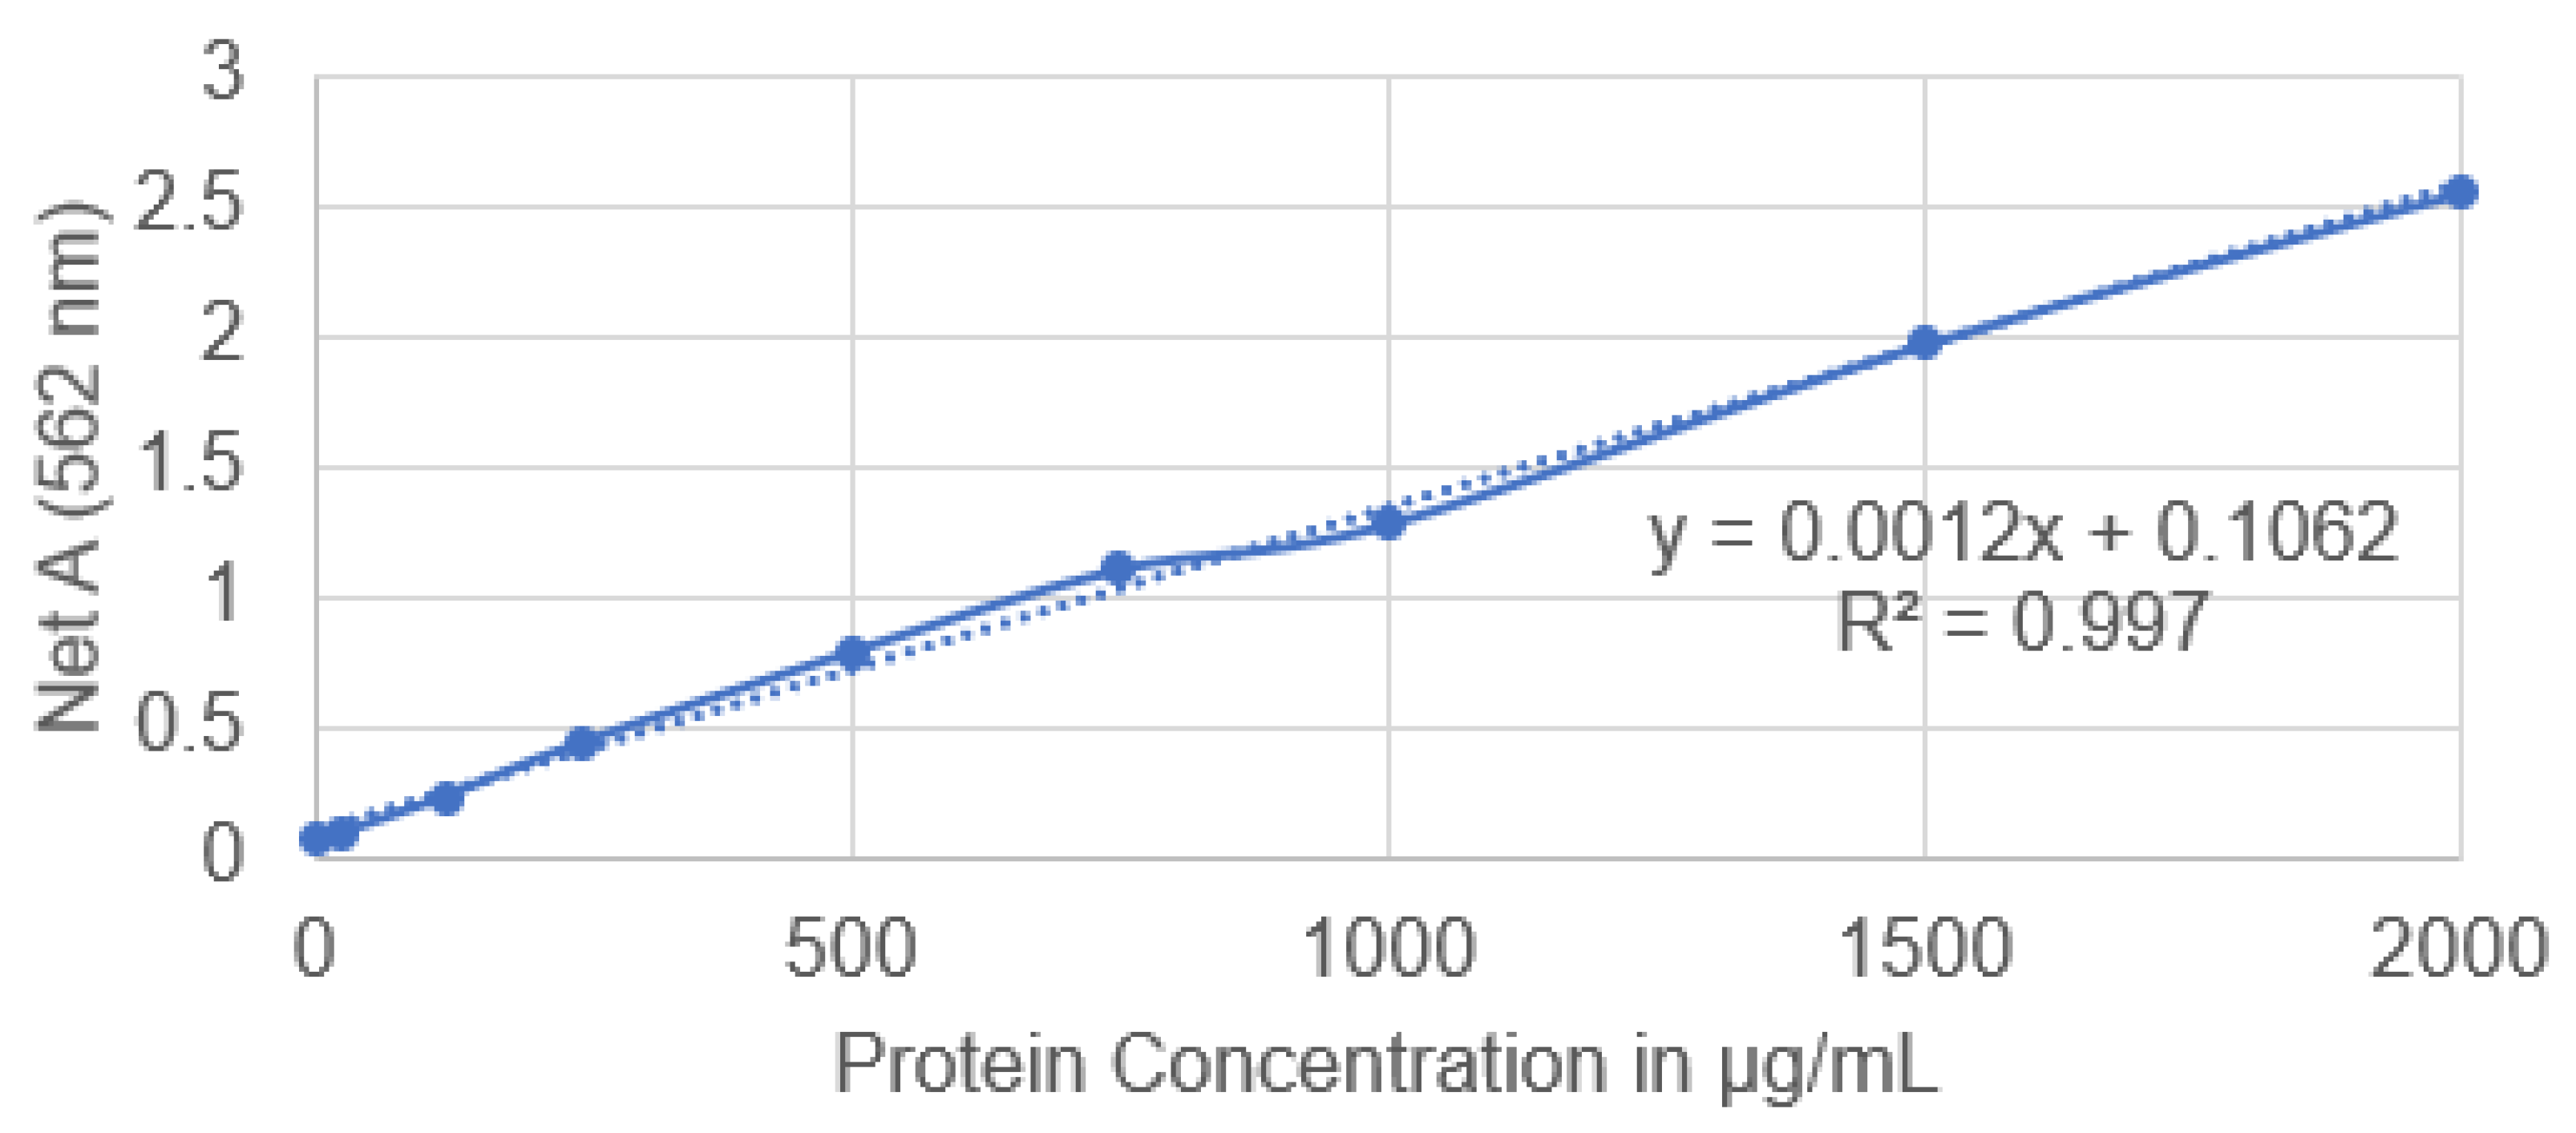
Figure 5 is a standard curve derived using the BSA protein assay method, resulting in the formula y = 0.0012x + 0.1062. R2 was close to 1, indicating the high accuracy of this formula. The protein concentrations of the diffusible substances calculated using this standard curve are shown in Table 3.
This table shows the total protein concentration of the diffusible substances extracted via different extraction methods with 1000 IU nisin used as a control (Table 3). The data for the unprecipitated diffusible substances (supernatant) and the completed precipitated diffusible substances (S and P) show a huge protein concentration loss during the precipitation process. The protein concentration precipitated with the ammonium sulphate powder was approximately 3.5 times greater than that precipitated with the solution. Since the solid ammonium sulphate reached a final concentration of 70% saturation while the liquid ammonium sulphate reached a final concentration of 50% saturation during precipitation, the liquid ammonium sulphate was inherently less than the solid. Therefore, the ammonium sulphate powder is more effective in precipitation.

3.4. The Compound Contained in the Diffusible Substance

Figure 6 shows information about the peaks appearing at different times, each representing a compound contained in the diffusible substance. Three chromatograms were obtained following separation and elution at 27–29 min. The largest number of compounds appeared at 27.6 min, accounting for 49.89%. This was followed by the compounds appearing at 28.9 min, accounting for 21.99%. Then came the compounds that appeared at 26.58 min, accounting for 13.37%. The comparison of retention time, peak shape, and size showed that the three main chromatographic peaks were consistent with the retention time and the characteristics of the bacteriocin peaks derived by Batdorj et al. [40], using a similar experimental approach. This indicates that there is a high probability that the extracted diffusible substance contained bacteriocins. Comparisons with known bacteriocins, such as nisin standards, under identical conditions are also needed to provide a more definitive identification.

3.5. The Antimicrobial Activity of Diffusible Substances

The Results of Disc Diffusion Assay

Table 4 shows that diffusible substances have an inhibitory effect. Among them, the zone of inhibition of nisin standard and diffusible substances (S) were similar in size, and the zone of inhibition of diffusible substances (P) was larger than both of them. Combined with the protein concentration data, the high protein concentration of sample S may be related to its strong antimicrobial activity, indicating that it contains more active antimicrobial components. The weaker antimicrobial activity of the diffusible substances (S) may be due to its lower protein content and less active antimicrobial components.
Furthermore, through the tube dilution assay, the MIC of the diffusible substances (P) was determined to be 167 mg/mL and that of the diffusible substances (S) was 500 mg/mL. The MIC of the diffusible substances (S) was about three times higher than that of the diffusible substances (P), similar to the protein concentration that differs between them. This result is in agreement with the results obtained from a co-culture assay of Lactococcus lactis with Yarrowia lipolytica in molasses-based medium, with pure cultures yielding 176 mg/L, while the co-culture assay yielded 270 mg/L, doubling that produced by the pure cultures [50].

3.6. Limitation

The limitations of this article include the fact that only PI stains were used in the FCM analysis experiments; thus, the proportion of the injured cells was not determined. Furthermore, although the diffusible substances were identified as nisin through HPLC assay, further characterisation of the compound such as through gel electrophoresis was not undertaken. Subsequent experiments including further purification and identification of the diffusable substances can be undertaken for holistic characterisation.

4. Conclusions

In conclusion, this paper investigated the effect of the diffusible substances produced by L. lactis in a co-culture model on the growth of B. cereus. The diffusible substances were found to inhibit the growth of B. cereus at refrigerated temperatures for eight days and to have bactericidal activity on B. cereus cells, killing 99% of B. cereus cells. In addition, it also inhibited the growth of E. coli at refrigerated temperatures for eight days. This paper compared the protein concentrations of diffusible substances after purification and concluded that solid ammonium sulphate was more effective in purifying the proteins of diffusible substances. This paper also investigated the inhibition ability of diffusible substances produced by L. lactis after protein purification. The MIC of diffusible substances (P) was 167 mg/mL and the MIC of diffusible substances (S) was 500 mg/mL. In addition, it was concluded that three analogous compounds may be present in diffusible substances. This paper has highlighted the potential of co-cultures of Lactococcus lactis to be effective in improving the yield and activity of antimicrobial peptides via the organism and the possibility of these peptides to be employed in the inhibition of possible food spoilage organisms. Further experiments are needed to determine the exact compounds contained in the diffusible substances and to verify whether diffusible substances cause E. coli to show the VBNC state.

Author Contributions

Y.H.: conceptualization, writing—original draft preparation, reviewing and editing supervision and validation. A.A.A.: methodology, writing, reviewing, and editing. C.K.A.: writing, reviewing, and editing. T.M.: writing, reviewing, and editing. H.O.: writing, review, editing, and supervision. All authors have read and agreed to the published version of the manuscript.

Funding

This research received no external funding.

Institutional Review Board Statement

Not Applicable.

Informed Consent Statement

Informed consent was obtained from all the subjects involved in this study.

Data Availability Statement

Data are available upon request to the authors.

Conflicts of Interest

The authors declare no conflicts of interest. The funders had no role in the design of this study; in the collection, analyses, or interpretation of data; in the writing of the manuscript; or in the decision to publish the results.

Appendix A

Table A1. The log CFU/mL of B. cereus, E. coli and L. lactis in co-culture model and in separate cultures.
Samples Day 1Day 2Day 3Day 4Day 5Day 6
L + B (1)L6.38 6.186.486.43
B5.28 4.625.144.32
L + B (2)L6.53 6.526.096.38
B5.34 4.604.754.53
L + B (3)L6.56 6.826.416.37
B5.00 4.725.345.08
L + E (1)L6.24 6.296.216.16
E4.52 NGNGNG
L + E (2)L6.46 6.606.396.37
E4.15 NGNGNG
L + E (3)L6.18 6.516.326.22
E3.90 NGNGNG
L aloneL6.36 6.456.376.31
B aloneB7.18 7.237.487.46
E aloneE7.19 7.927.128.11
NG = no growth.

References

  1. Lee, H.; Yoon, Y. Etiological agents implicated in foodborne illness world wide. Food Sci. Anim. Resour. 2021, 41, 1. [Google Scholar] [CrossRef] [PubMed]
  2. WHO (World Health Organization). Foodborne Diseases; WHO: Geneva, Switzerland, 2023; Available online: https://www.who.int/health-topics/foodborne-diseases#tab=tab_1 (accessed on 21 December 2023).
  3. Medeiros, L.; LeJeune, J. Bacillus cereus: A Foodborne Illness Confused with the 24-hour Flu. Ohio State University Extension. 2011. Available online: https://ohioline.osu.edu/factsheet/HYG-5576-11 (accessed on 21 December 2023).
  4. Ehling-Schulz, M.; Messelhäusser, U.; Granum, P.E. Bacillus cereus in milk and dairy production. In Rapid Detection, Characterization, and Enumeration of Foodborne Pathogens; Wiley: Hoboken, NJ, USA, 2011; pp. 275–289. [Google Scholar] [CrossRef]
  5. Dervyn, R.; Kavanaugh, D.W.; Cormontagne, D.; Glasset, B.; Ramarao, N. Identification of a new pathogenicity island within the large pAH187_270 plasmid involved in Bacillus cereus virulence. Front. Cell. Infect. Microbiol. 2022, 11, 788757. [Google Scholar] [CrossRef] [PubMed]
  6. Jovanovic, J.; Ornelis, V.F.; Madder, A.; Rajkovic, A. Bacillus cereus food intoxication and toxicoinfection. Compr. Rev. Food Sci. Food Saf. 2021, 20, 3719–3761. [Google Scholar] [CrossRef] [PubMed]
  7. Schoeni, J.L.; Wong, A.C. Bacillus cereus food poisoning and its toxins. J. Food Prot. 2005, 68, 636–648. [Google Scholar] [CrossRef] [PubMed]
  8. Jessberger, N.; Dietrich, R.; Granum, P.E.; Märtlbauer, E. The Bacillus cereus food infection as multifactorial process. Toxins 2020, 12, 701. [Google Scholar] [CrossRef]
  9. Glasset, B.; Sperry, M.; Dervyn, R.; Herbin, S.; Brisabois, A.; Ramarao, N. The cytotoxic potential of Bacillus cereus strains of various origins. Food Microbiol. 2021, 98, 103759. [Google Scholar] [CrossRef]
  10. Adamski, P.; Byczkowska-Rostkowska, Z.; Gajewska, J.; Zakrzewski, A.J.; Kłębukowska, L. Prevalence and Antibiotic Resistance of Bacillus sp. Isolated from Raw Milk. Microorganisms 2023, 11, 1065. [Google Scholar] [CrossRef]
  11. Setlow, P. Spores of Bacillus subtilis: Their resistance to and killing by radiation, heat and chemicals. J. Appl. Microbiol. 2006, 101, 514–525. [Google Scholar] [CrossRef]
  12. Anumudu, C.; Hart, A.; Miri, T.; Onyeaka, H. Recent advances in the application of the antimicrobial peptide nisin in the inactivation of spore-forming bacteria in foods. Molecules 2021, 26, 5552. [Google Scholar] [CrossRef]
  13. Li, Y.; Wang, M.; Li, Y.; Hong, B.; Kang, D.; Ma, Y.; Wang, J. Two novel antimicrobial peptides against vegetative cells, spores and biofilm of Bacillus cereus. Food Control 2023, 149, 109688. [Google Scholar] [CrossRef]
  14. Anumudu, C.K.; Omoregbe, O.; Hart, A.; Miri, T.; Eze, U.A.; Onyeaka, H. Applications of bacteriocins of lactic acid bacteria in biotechnology and food preservation: A bibliometric review. Open Microbiol. J. 2022, 16. [Google Scholar] [CrossRef]
  15. Mariam, S.H.; Zegeye, N.; Aseffa, A.; Howe, R. Diffusible substances from lactic acid bacterial cultures exert strong inhibitory effects on Listeria monocytogenes and Salmonella enterica serovar enteritidis in a co-culture model. BMC Microbiol. 2017, 17, 35. [Google Scholar] [CrossRef] [PubMed]
  16. Lindgren, S.E.; Dobrogosz, W.J. Antagonistic activities of lactic acid bacteria in food and feed fermentations. FEMS Microbiol. Rev. 1990, 7, 149–163. [Google Scholar] [CrossRef] [PubMed]
  17. Putra, T.F.; Suprapto, H.; Tjahjaningsih, W.; Pramono, H. The antagonistic activity of lactic acid bacteria isolated from peda, an Indonesian traditional fermented fish. IOP Conf. Ser. Earth Environ. Sci. 2018, 137, 012060. [Google Scholar] [CrossRef]
  18. Yang, S.C.; Lin, C.H.; Sung, C.T.; Fang, J.Y. Antibacterial activities of bacteriocins: Application in foods and pharmaceuticals. Front. Microbiol. 2014, 5, 241. [Google Scholar] [CrossRef]
  19. Garneau, S.; Martin, N.I.; Vederas, J.C. Two-peptide bacteriocins produced by lactic acid bacteria. Biochimie 2002, 84, 577–592. [Google Scholar] [CrossRef]
  20. Wang, S.; Chen, P.; Dang, H. Lactic acid bacteria and γ-aminobutyric acid and diacetyl. In Lactic Acid Bacteria; Springer: Singapore, 2019; pp. 1–19. [Google Scholar] [CrossRef]
  21. Barbosa, A.A.T.; de Melo, M.R.; da Silva, C.M.R.; Jain, S.; Dolabella, S.S. Nisin resistance in Gram-positive bacteria and approaches to circumvent resistance for successful therapeutic use. Crit. Rev. Microbiol. 2021, 47, 376–385. [Google Scholar] [CrossRef]
  22. Parada, J.L.; Caron, C.R.; Medeiros, A.B.P.; Soccol, C.R. Bacteriocins from lactic acid bacteria: Purification, properties and use as biopreservatives. Braz. Arch. Biol. Technol. 2007, 50, 512–542. [Google Scholar] [CrossRef]
  23. Simons, A.; Alhanout, K.; Duval, R.E. Bacteriocins, antimicrobial peptides from bacterial origin: Overview of their biology and their impact against multidrug-resistant bacteria. Microorganisms 2020, 8, 639. [Google Scholar] [CrossRef]
  24. Shin, J.M.; Gwak, J.W.; Kamarajan, P.; Fenno, J.C.; Rickard, A.H.; Kapila, Y.L. Biomedical applications of nisin. J. Appl. Microbiol. 2016, 120, 1449–1465. [Google Scholar] [CrossRef]
  25. O’Reilly, C.; O’Connor, P.M.; O’Sullivan, Ó.; Rea, M.C.; Hill, C.; Ross, R.P. Impact of nisin on Clostridioides difficile and microbiota composition in a faecal fermentation model of the human colon. J. Appl. Microbiol. 2022, 132, 1397–1408. [Google Scholar] [CrossRef] [PubMed]
  26. Vukomanović, M.; Žunič, V.; Kunej, Š.; Jančar, B.; Jeverica, S.; Podlipec, R.; Suvorov, D. Nano-engineering the antimicrobial spectrum of lantibiotics: Activity of nisin against gram negative bacteria. Sci. Rep. 2017, 7, 4324. [Google Scholar] [CrossRef] [PubMed]
  27. Raccach, M. Pediococcus. In Encyclopedia of Food Microbiology, 2nd ed.; Academic Press: Cambridge, MA, USA, 2014; pp. 1–5. [Google Scholar]
  28. Singh, V.P. Recent approaches in food bio-preservation-a review. Open Vet. J. 2018, 8, 104–111. [Google Scholar] [CrossRef] [PubMed]
  29. Ray, B. Nisin of Lactococcus lactis ssp. lactis as a food biopreservative. In Food Biopreservatives of Microbial Origin; CRC Press: Boca Raton, FL, USA, 2019; pp. 207–264. [Google Scholar]
  30. Meade, E.; Slattery, M.A.; Garvey, M. Bacteriocins, potent antimicrobial peptides and the fight against multi drug resistant species: Resistance is futile? Antibiotics 2020, 9, 32. [Google Scholar] [CrossRef] [PubMed]
  31. Soltani, S.; Hammami, R.; Cotter, P.D.; Rebuffat, S.; Said, L.B.; Gaudreau, H.; Fliss, I. Bacteriocins as a new generation of antimicrobials: Toxicity aspects and regulations. FEMS Microbiol. Rev. 2021, 45, fuaa039. [Google Scholar] [CrossRef]
  32. Silva, C.C.; Silva, S.P.; Ribeiro, S.C. Application of bacteriocins and protective cultures in dairy food preservation. Front. Microbiol. 2018, 9, 594. [Google Scholar] [CrossRef]
  33. WISC. BD Accuri™ C6 Flow Cytometer Instrument Manual; WISC, 2017; Available online: https://bif.wisc.edu/wp-content/uploads/sites/389/2017/11/bd_accuri_c6_flow_cytometer_instrument_manual.pdf (accessed on 20 July 2022).
  34. BD. BD Accuri™ C6 Plus Flow Cytometer Optical Filter Guide; BD, 2016; Available online: https://www.bdbiosciences.com/content/dam/bdb/marketing-documents/BD-Accuri-C6-Plus-Filter-Guide.pdf (accessed on 20 July 2022).
  35. Serna-Cock, L.; Rojas-Dorado, M.; Ordoñez-Artunduaga, D.; García-Salazar, A.; García-González, E.; Aguilar, C.N. Crude extracts of metabolites from co-cultures of lactic acid bacteria are highly antagonists of Listeria monocytogenes. Heliyon 2019, 5, e02448. [Google Scholar] [CrossRef]
  36. Exalpha. Ammonium Sulfate Precipitation Protocol; Exalpha, 2022; Available online: http://www.exalpha.com/protocols/ammonium-sulfate-precipitation-protocol (accessed on 31 May 2022).
  37. Wingfield, P. Protein precipitation using ammonium sulfate. Curr. Protoc. Protein Sci. 2001, 13, A-3F. [Google Scholar] [CrossRef]
  38. Pongtharangkul, T.; Demirci, A. Evaluation of agar diffusion bioassay for nisin quantification. Appl. Microbiol. Biotechnol. 2004, 65, 268–272. [Google Scholar] [CrossRef]
  39. Thermo Scientific. Pierce™ BCA Protein Assay Kit; Thermo Scientific: Waltham, MA, USA, 2020; Available online: https://assets.thermofisher.com/TFS-Assets/LSG/manuals/MAN0011430_Pierce_BCA_Protein_Asy_UG.pdf (accessed on 7 June 2022).
  40. Batdorj, B.; Dalgalarrondo, M.; Choiset, Y.; Pedroche, J.; Métro, F.; Prevost, H.; Chobert, J.M.; Haertlé, T. Purification and characterization of two bacteriocins produced by lactic acid bacteria isolated from Mongolian airag. J. Appl. Microbiol. 2006, 101, 837–848. [Google Scholar] [CrossRef]
  41. Thermo Scientific. Chromeleon Chromatography Management System v6.80; Thermo Scientific: Waltham, MA, USA, 2006; Available online: https://tools.thermofisher.com/content/sfs/manuals/Man-Chromeleon-680-EN.pdf (accessed on 3 August 2022).
  42. Tendencia, E.A. Disk diffusion method. In Laboratory Manual of Standardized Methods for Antimicrobial Sensitivity Tests for Bacteria Isolated from Aquatic Animals and Environment; Aquaculture Department, Southeast Asian Fisheries Development Center: Iloilo, Philippines, 2004; pp. 13–29. [Google Scholar]
  43. Haindongo, N.; Anyogu, A.; Ekwebelem, O.; Anumudu, C.; Onyeaka, H. Antibacterial and antibiofilm effects of garlic (Allium sativum), ginger (Zingiber officinale) and mint (Mentha piperta) on Escherichia coli biofilms. Food Sci. Appl. Biotechnol. 2021, 4, 166–176. [Google Scholar] [CrossRef]
  44. Rollins, D.M.; Joseph, S.W. Minimal Inhibitory Concentration (MIC) (Broth Tube Dilution Method); University of Maryland: College Park, MD, USA, 2000; Available online: https://science.umd.edu/classroom/bsci424/LabMaterialsMethods/BrothTubeMIC.htm (accessed on 14 June 2022).
  45. Tenea, G.N.; Hurtado, P.; Ortega, C. Inhibitory effect of substances produced by native Lactococcus lactis strains of tropical fruits towards food pathogens. Prev. Nutr. Food Sci. 2018, 23, 260. [Google Scholar] [CrossRef] [PubMed]
  46. Modugno, C.; Kmiha, S.; Simonin, H.; Aouadhi, C.; Cañizares, E.D.; Lang, E.; André, S.; Mejri, S.; Maaroufi, A.; Perrier-Cornet, J.M. High pressure sensitization of heat-resistant and pathogenic foodborne spores to nisin. Food Microbiol. 2019, 84, 103244. [Google Scholar] [CrossRef] [PubMed]
  47. Egan, K.; Field, D.; Rea, M.C.; Ross, R.P.; Hill, C.; Cotter, P.D. Bacteriocins: Novel solutions to age old spore-related problems? Front. Microbiol. 2016, 7, 461. [Google Scholar] [CrossRef] [PubMed]
  48. Hewitt, C.J.; Nebe-Von-Caron, G. An industrial application of multiparameter flow cytometry: Assessment of cell physiological state and its application to the study of microbial fermentations. Cytom. J. Int. Soc. Anal. Cytol. 2001, 44, 179–187. [Google Scholar] [CrossRef]
  49. Pienaar, J.A.; Singh, A.; Barnard, T.G. The viable but non-culturable state in pathogenic Escherichia coli: A general review. Afr. J. Lab. Med. 2016, 5, 1–9. [Google Scholar] [CrossRef]
  50. Ariana, M.; Hamedi, J. Enhanced production of nisin by co-culture of Lactococcus lactis sub sp. lactis and Yarrowia lipolytica in molasses based medium. J. Biotechnol. 2017, 256, 21–26. [Google Scholar] [CrossRef]
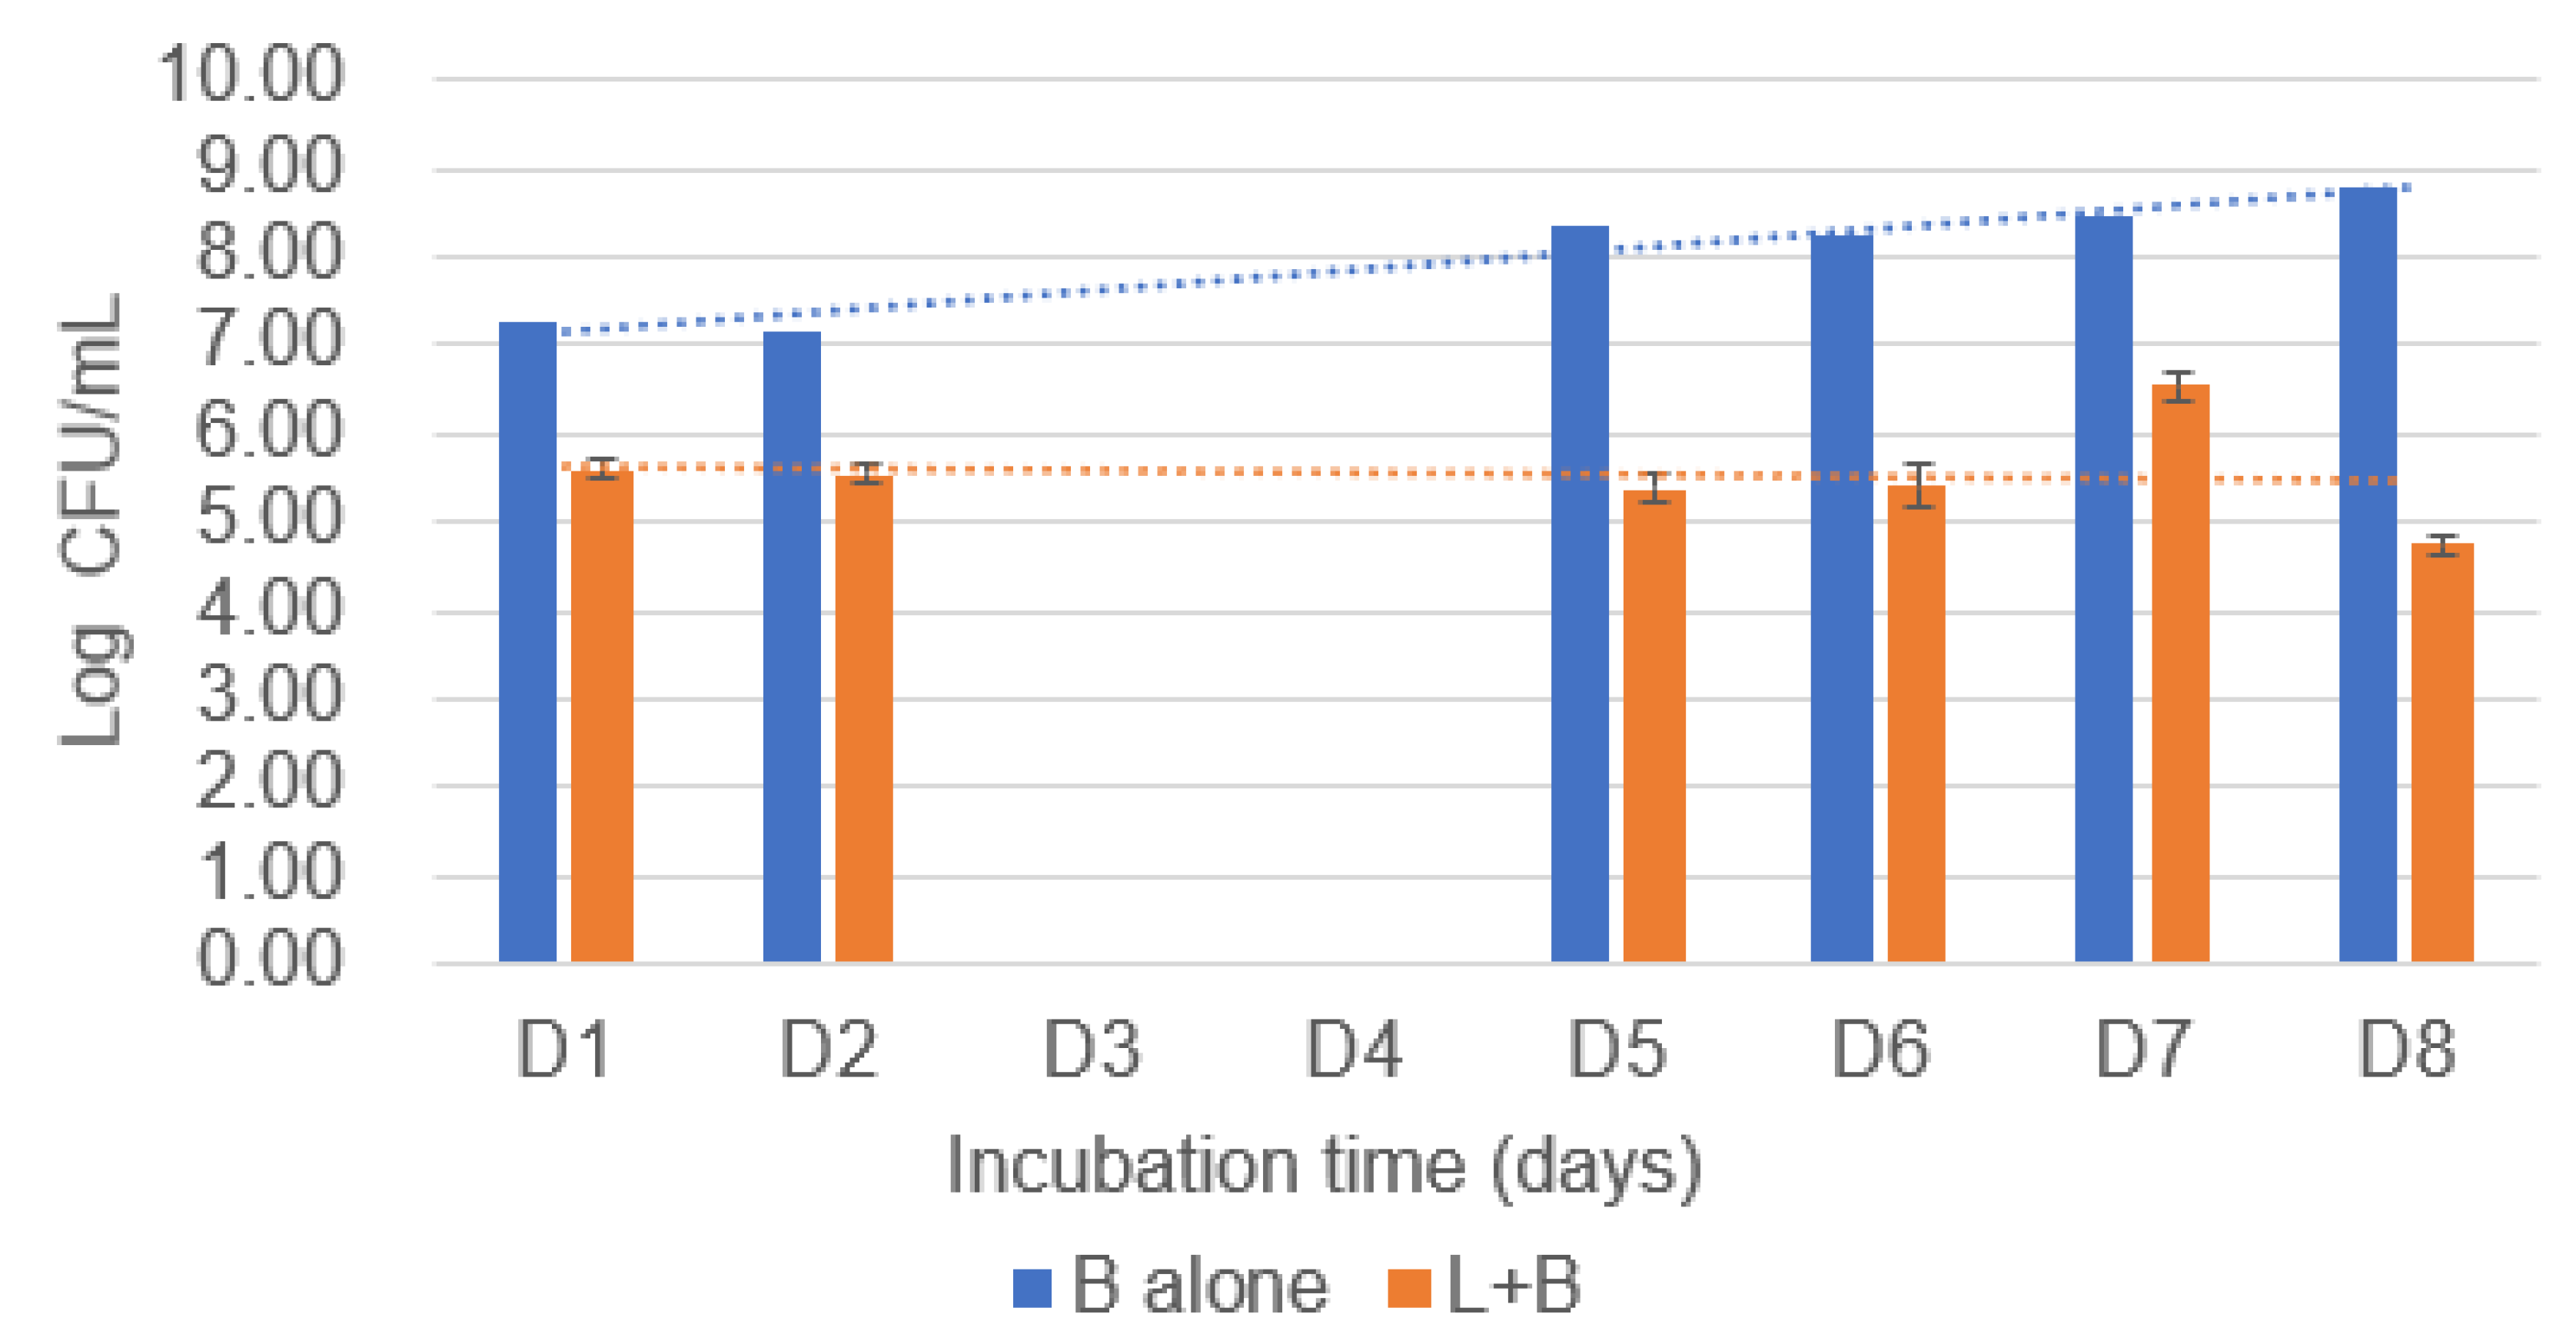
Figure 1. The log CFU/mL of B. cereus (B alone) and B. cereus in the co-culture assay (L + B). The blue trend line indicates the microbial load of B. cereus across the days of incubation while the orange indicates the microbial load of co-culture or B. cereus and Lactococcus lactis.
Hygiene 04 00035 g001
Figure 2. The log CFU/mL of E. coli (E alone) and E. coli in the co-culture assay (L + E). The blue trend line indicates the microbial load of E. coli across the days of incubation while the orange indicates the microbial load of co-culture or E. coli and Lactococcus lactis.
Hygiene 04 00035 g002
Figure 3. The FCM anaysis of B.cereus.
Hygiene 04 00035 g003
Figure 4. The FCM results of E. coli cells.
Hygiene 04 00035 g004
Figure 5. Typical colour response curves for BSA protein. The dashed and solid blue line is the trendline indicating colour response to increasing BSA standard concentration which was utilised in the determination of the protein concentration of the diffusible substance.
Hygiene 04 00035 g005
Figure 6. The HPLC results for diffusible substances.
Hygiene 04 00035 g006
Table 1. The FCM results of B. cereus cells.
L + B (D4)B Alone (D4)L + B (D5)B Alone (D5)
This plot24,85221,25324,97221,224
Dead cells24,422284624,7772732
% Dead cells98.3%13.4%99.2%12.9%
Live cells42518,33719118,403
% Live cells1.7%86.3%0.8%86.7%
Table 2. The FCM results of E. coli cells.
L + E (D4)E Alone (D4)L + E (D5)E Alone (D5)
This plot20,10817,96515,59018,290
Dead cells17102142555313
% Dead cells8.5%1.2%16.4%1.7%
Live cells18,36617,74613,00417,966
% Live cells91.3%98.8%83.4%98.2%
Table 3. The protein concentration of samples.
SamplesOD (562 nm)Protein Concentration (μg/mL)
Diffusible substances (supernatant)10.178386.50
Diffusible substances (P)4.7253849
Diffusible substances (S)1.4251099
Control (1000 IU nisin pH 7.0)0.824598.17
Table 4. The sterile zone of disc diffusion assay using nutrient agar.
SamplesDiameter
Control (1000 IU Nisin) 12 ± 1 mm
Diffusible substances (P) 16.5 ± 0.5 mm
Diffusible substances (S) 11.5 ± 0.5 mm
Disclaimer/Publisher’s Note: The statements, opinions and data contained in all publications are solely those of the individual author(s) and contributor(s) and not of MDPI and/or the editor(s). MDPI and/or the editor(s) disclaim responsibility for any injury to people or property resulting from any ideas, methods, instructions or products referred to in the content.