Article

Diatom-Based Photobiological Treatment of Reverse Osmosis Concentrate: Optimization of Light and Temperature and Biomass Analysis

1
Ingram School of Engineering, Texas State University, San Marcos, TX 78666, USA
2
Department of Chemistry and Biochemistry, Texas State University, San Marcos, TX 78666, USA
3
City of Wichita Falls, Wichita Falls, TX 76310, USA
4
School of Civil and Environmental Engineering, Indian Institute of Technology Mandi, Kamand 175005, India
5
Department of Earth and Planetary Sciences, University of Texas at San Antonio, San Antonio, TX 78249, USA
6
Department of Marine Science and Technology, Fukui Prefectural University, Obama 917-0003, Japan
*
Author to whom correspondence should be addressed.
Phycology 2025, 5(1), 3; https://doi.org/10.3390/phycology5010003
Submission received: 4 December 2024 / Revised: 6 January 2025 / Accepted: 13 January 2025 / Published: 15 January 2025

Abstract

:
As global water scarcity intensifies, the desalination of brackish groundwater and surface water plays a critical role in augmenting water supplies. However, managing reverse osmosis concentrate (ROC) from brackish water desalination remains challenging due to silica and calcium accumulation and precipitation, which cause membrane scaling and reduce freshwater recovery. This study employed the brackish diatom Gedaniella flavovirens Psetr3 in a photobiological treatment to remove dissolved silica and calcium, offering a natural, sustainable solution to improve freshwater recovery. Optimal treatment conditions were identified, with a light intensity of 200 µmol m−2 s−1 and incubation temperatures between 23 °C and 30 °C maximizing silica uptake (up to 46 ± 3 mg/L/day) while minimizing diatom mortality. This study reports, for the first time, the silica, organic, and calcite content in diatom biomass and their production rates during the photobiological treatment of ROC using G. flavovirens Psetr3. The photobiological treatment of one million gallons (3785 m3) per day of ROC would produce 174 kg of silica, 163 kg of organics, and 314 kg of calcite daily. These findings provide valuable insights into the potential for utilizing these bioresources to offset the costs of photobiological treatment and subsequent desalination processes.

1. Introduction

As freshwater sources become increasingly stressed, the demand for alternative water supplies continues to grow [1,2]. Brackish water desalination has emerged as a critical solution, particularly in regions where traditional freshwater resources are limited [3,4]. In Texas, where frequent droughts and rapid population growth intensify the pressure on water supplies, brackish water desalination has become a key component of the state’s water management strategy [5]. Texas is one of the leading states in the United States (US) in the number of brackish water desalination facilities, with a total of 53 municipal brackish water desalination facilities (BWDFs) that have a total desalination capacity of 157 million gallons per day (MGD) or 594,000 m3/day [6]. These include several large-scale inland desalination plants, including the Kay Bailey Hutchison Desalination Plant in El Paso (27 MGD) and H2Oaks Center in San Antonio (12 MGD) [7]. These BWDFs not only provide an alternative water source but also offer a reliable way to augment the state’s water portfolio, addressing both municipal and industrial needs.
At the national level, brackish water desalination plays a growing role in augmenting water supplies in arid and semi-arid regions, such as the southwestern US, where surface and groundwater sources are diminishing [8]. Desalination technologies, including reverse osmosis (RO), are becoming increasingly necessary to meet the country’s water demands [5]. Brackish water desalination offers a more energy-efficient alternative to seawater desalination due to the lower salinity of brackish water, making it a more economically viable option for inland regions [9]. This trend is mirrored globally, where the need for sustainable, alternative water sources has led to a steady rise in brackish water desalination projects in regions like the Middle East, North Africa, and parts of Asia [5,9].
However, one of the persistent challenges in brackish water desalination is the management of reverse osmosis concentrate (ROC), a byproduct of the desalination process. For inland communities, the disposal of ROC is particularly difficult, as options like deep well injection, evaporation ponds, and surface water discharge come with significant environmental and regulatory challenges [8,10,11,12]. Coastal facilities can often dispose of ROC into large water bodies, such as the Pacific or Atlantic Ocean and the Gulf of Mexico, but such options are unavailable to most inland facilities [8]. As the scale of BWDFs increases, these disposal methods become less sustainable, especially given the potential environmental risks of deep well injection and the inefficiencies of evaporation ponds.
The recovery of freshwater through brackish water RO, particularly from groundwater sources, is often hindered by the presence of dissolved silica and calcium [13,14,15,16,17]. These constituents can lead to membrane scaling and permeate reduction, making it challenging to extract maximum freshwater yield. To address this issue, a diatom-based photobiological process has been developed to effectively remove silica and calcium from BWDF ROCs [18,19], as well as ROCs from advanced water purification facilities (AWPFs) [20,21]. This treatment allows for a subsequent secondary RO process, enabling the extraction of additional freshwater while simultaneously minimizing the volume of ROC that needs to be disposed of [20]. By leveraging the natural silica uptake capabilities of brackish diatoms, this innovative approach has the potential to reduce the silica concentration in ROC to enable additional freshwater recovery at RO facilities. The brackish diatom G. flavovirens has been found to be one of the most promising strains for its ability to remove silica, calcium carbonate, nutrients, and other constituents from ROC [22], offering a sustainable solution for managing concentrate and improving the overall efficiency of RO facilities including BWDFs [18,19]. However, the influence of photobiological treatment conditions, including light characteristics (e.g., color and intensity) and temperature, have not been explored in BWDF ROC, whereas our previous report highlighted their importance in AWPF ROC treatment [21]. Furthermore, a preliminary characterization of diatom biomass was conducted to quantify key components, namely, silica frustules, organics, and calcium carbonate. While the precipitation of calcium carbonate and the generation of organic materials during photobiological treatment have been suggested in earlier studies [18], these components have not yet been quantified. Understanding these elements is crucial for subsequent pilot-scale experiments and lifecycle cost analysis, as the recovered biomaterials can potentially be processed and sold to offset treatment costs. Focusing on ROC from a BWDF in Texas, this study provides insights into the potential applicability of this process in other regions facing similar challenges.

2. Materials and Methods

2.1. ROC Samples

The ROC samples obtained from SAWS H2Oaks Center in Elmendorf, TX, USA were used as a model for BWDF ROC. Three batches of ROC samples were collected at the end of the third stage of the RO process and transported to Texas State University (San Marcos, TX, USA). These samples are referred to as H2Oaks ROC hereafter. The sample collection dates were 22 August 2019, 23 March 2020, and 15 October 2020, with an RO permeate recovery of 89%. The samples were kept refrigerated at 4 °C in the laboratory until use. Table 1 shows the average water quality of the H2Oaks ROC samples. Prior to use and analysis, the ROC samples were filtered through 0.8/0.2 μm syringe filters [Acrodisc® PF with Supor® membrane (hydrophilic polyethersulfone), sterile, 32 mm diameter, Pall Corporation, Port Washington, NY, USA].

2.2. Diatom

A unialgal culture of brackish diatom G. flavovirens Psetr3 isolated from the bottom sands of Obuchi-numa Lake in Aomori Prefecture, Japan [23], was used for the experiments in this study. The methodology for maintaining primary cultures of G. flavovirens followed the procedures described in our previous work [21] with minor adjustments. Primary cultures were maintained in approximately 10 mL of filtered H2Oaks ROC in 15 mL clear polypropylene centrifuge tubes (SuperClearTM, VWR International, Radnor, PA, USA) under continuous light at room temperature (22 ± 1 °C). The filtered H2Oaks ROC was replenished once a week. Subcultures were created from the primary culture and were grown in approximately 40 mL of filtered H2Oaks ROC in VWR SuperClearTM 50 mL clear polypropylene centrifuge tubes, alongside the primary cultures. The ROC was replaced weekly in subcultures. These subcultures, typically after four weeks of continuous growth, were used as seed cultures for the photobiological treatment experiments.

2.3. Analytical Methods

Analytical methods for ROC characterization and reactive silica uptake experiments are outlined in Table 1. A Hach DR-1900 spectrophotometer (Loveland, CO, USA) was used for colorimetric analysis, while titrations were performed with Hach Digital Titrators. Conductivity and pH were measured using a Pocket Pro High Range Conductivity Tester and a Pocket Pro pH Tester, respectively.

2.4. Photobiological Treatment

A series of semi-batch photobiological treatment experiments were conducted to examine the effects of light and temperature in a controlled environment, following the methods outlined in our previous study [21]. Clear 100 mL polystyrene coliform bottles (Grainger, Lake Forest, IL, USA) were used as reaction vessels (Figure 1). Filtered H2Oaks ROC was added to the vessels, along with a seed culture of G. flavovirens Psetr3. The initial amount of diatom biomass to be added was determined based on our previous studies [21,22], ensuring consistent silica uptake rates during the semi-batch photobiological treatment experiments. The ROC was supplemented with a concentrated nutrient solution (Fritz F/2 Algal Food Part B, Fritz Aquatics, Mesquite, TX, USA), resulting in final concentrations of nitrate-N and orthophosphate of approximately 15 and 5 mg/L, respectively. Aliquots of seed culture were collected in 1.5 mL microcentrifuge tubes to determine initial dry biomass weight.
The vessels were tightly sealed and placed in a five-gallon plastic bucket lined with silver reflective bubble wrap (S-11476, ULINE, Pleasant Prairie, WI, USA). The samples were incubated statically and illuminated using LED clip lamps (Table S1) for the photobiological treatment. The bucket was kept in a refrigerated incubator (Fisherbrand IsotempTM BOD Refrigerated Incubator, Thermo Scientific, Waltham, MA, USA) to maintain a stable incubation temperature. LED positions were adjusted daily to ensure consistent photosynthetically active radiation (PAR), which was measured using an Apogee Full Spectrum Quantum Meter (MQ-500, Logan, UT, USA). Temperature was monitored with a USB Temp Data Logger (EL-USB-1, Lascar Electronics, Erie, PA, USA). All experiments were conducted in duplicate. Means and standard deviations were calculated and reported.
In this study, eight different LED light bulbs, including four bulbs with different color temperatures and four colored bulbs, were investigated (Table S1), similar to our previous study [21]. Color temperature, widely used in the lighting industry to describe the warmth or coolness of a light source, was assessed across four levels (Figure S1). An Apogee SS-110 Visible Spectroradiometer was used to measure visible light spectra between 340 and 820 nm. Figures S2 and S3 show the light spectra of the LED bulbs.
Supernatant samples were periodically collected from the vessels to measure selected parameters, with aseptic techniques employed to prevent contamination. Diatom biomass was also sampled periodically for visual and microscopic observations to detect any abnormalities, such as changes in cell or colony morphology or the appearance of chloroplasts. Photomicroscopy was performed using an AmScope T490B-DKO trinocular compound microscope equipped with an AF205 1080p HDMI C-mount microscope camera (Irvine, CA, USA). After each semi-batch cycle, the supernatant was collected by decanting, leaving the diatom biomass in the vessels. This biomass, including any growth from the previous cycle, was reused for the next cycle. New ROC and nutrient solution were then added to initiate the subsequent semi-batch cycle. The silica uptake rate was determined from the slope of the linear portion of the uptake curve, as described previously [22]. At the end of the photobiological treatment experiment, biomass was collected from the coliform bottle and transferred to a 1.7 mL microcentrifuge tube. The biomass was thoroughly rinsed at least ten times with ultrapure water to remove dissolved solids, and then dried in an oven at 40 °C until a stable mass was achieved. The dried biomass was stored at room temperature for subsequent use and characterization.

2.5. Biomass Characterization and Quantification

The biomass underwent a two-step treatment process to quantify and isolate diatom frustules (silica), organics, and calcium carbonate. First, bleach treatment was performed to digest and remove organic materials. Biomass from 1.7 mL microcentrifuge tubes was transferred to sterile 15 mL centrifuge tubes, rinsed with ultrapure water to ensure complete transfer, and treated with a bleach solution (Clorox Company, Oakland, CA, USA, 48.2 g/L as Cl2) at a 2:1 ratio. Upon bleach addition, the biomass quickly changed color from green to gray. The tubes were shaken on a vortex mixer for two hours, with the caps loosened every 15 min to release gas. An additional 1 mL of bleach was added after one hour. Following centrifugation, the supernatant was removed, and the samples were rinsed eight times with ultrapure water to eliminate residual chlorine and dissolved solids. The samples were dried in an oven at 40 °C, with mass recorded daily until stable, and then transferred to a desiccator for further drying. Next, citric acid treatment was conducted to remove calcium carbonate. After confirming no significant mass change post-bleach treatment, a 2.34 M citric acid solution prepared with citric acid monohydrate (VWR Chemicals, Solon, OH, USA) was added dropwise (approximately 0.2 mL) to the digested, dried biomass. Bubbling at the bottom of the tube indicated the reaction between citric acid and calcium carbonate, producing carbon dioxide. This confirmed the presence of calcium carbonate in the biomass. The mixture was vortexed for ten minutes to complete the reaction, followed by centrifugation. The supernatant was saved for calcium hardness titration, and the remaining samples were rinsed four times with ultrapure water, dried in an oven, and stored in a desiccator. These steps effectively removed organics and calcite, leaving behind purified diatom frustules, which were analyzed for mass balance, byproduct quantification, and production rates.
A JEOL JSM-6010 PLUS/LA Scanning Electron Microscope (SEM; Tokyo, Japan), as well as a light microscope, was used for imaging and energy-dispersive X-ray spectroscopy (EDS). This system was used to examine the surface morphology and elemental composition of dried and digested diatom biomass samples.

2.6. Statistical Analysis

Statistical analyses were conducted using RStudio (Version 2024.09.1 Build 394). One-way analysis of variance (ANOVA) was used to evaluate differences in silica uptake rates across treatment groups. Tukey’s Honestly Significant Difference (HSD) test was performed for pairwise comparisons to identify statistically significant differences between specific groups (padj < 0.05).

3. Results

3.1. Impact of Light Temperature on Reactive Silica Removal

The first part of this study investigated how treatment conditions for brackish groundwater ROC influence reactive silica uptake by the brackish diatom G. flavovirens Psetr3. Figure 2a shows the silica uptake during the photobiological treatment of H2Oaks ROC under LED light bulbs with varying light temperatures. Following a brief lag period at the start of the first cycle, silica uptake rates stabilized and remained comparable across all light temperatures. The average uptake rate was approximately 36 mg/L, with no statistically significant differences (p > 0.05) among the four bulb groups (2700, 3000, 4000, and 5000 K; Figure 2b), as determined by one-way ANOVA.
The four levels of light temperatures (also called color temperature) have slightly different colors: 2700 and 3000 K are soft white, 4000 K is cool white, and 5000 K is daylight (Figure S1). Figure S2 shows the light spectra of these four levels of light color temperatures. From this figure, 2700 and 3000 K are similar in shape and light intensity. They have higher emissions of warm colors (red, orange, and yellow; wavelength: 600–700 nm) while colder color (blue; wavelength: 400–500 nm) emissions are weaker. For higher light temperature bulbs like 4000 and 5000 K, there are higher emissions within the blue light range than the other two. However, according to the results of silica uptake rates for the ROC, there was no marked impact of light temperatures. The subsequent experiment investigated more in depth whether specific colors will impact the silica uptake rates.

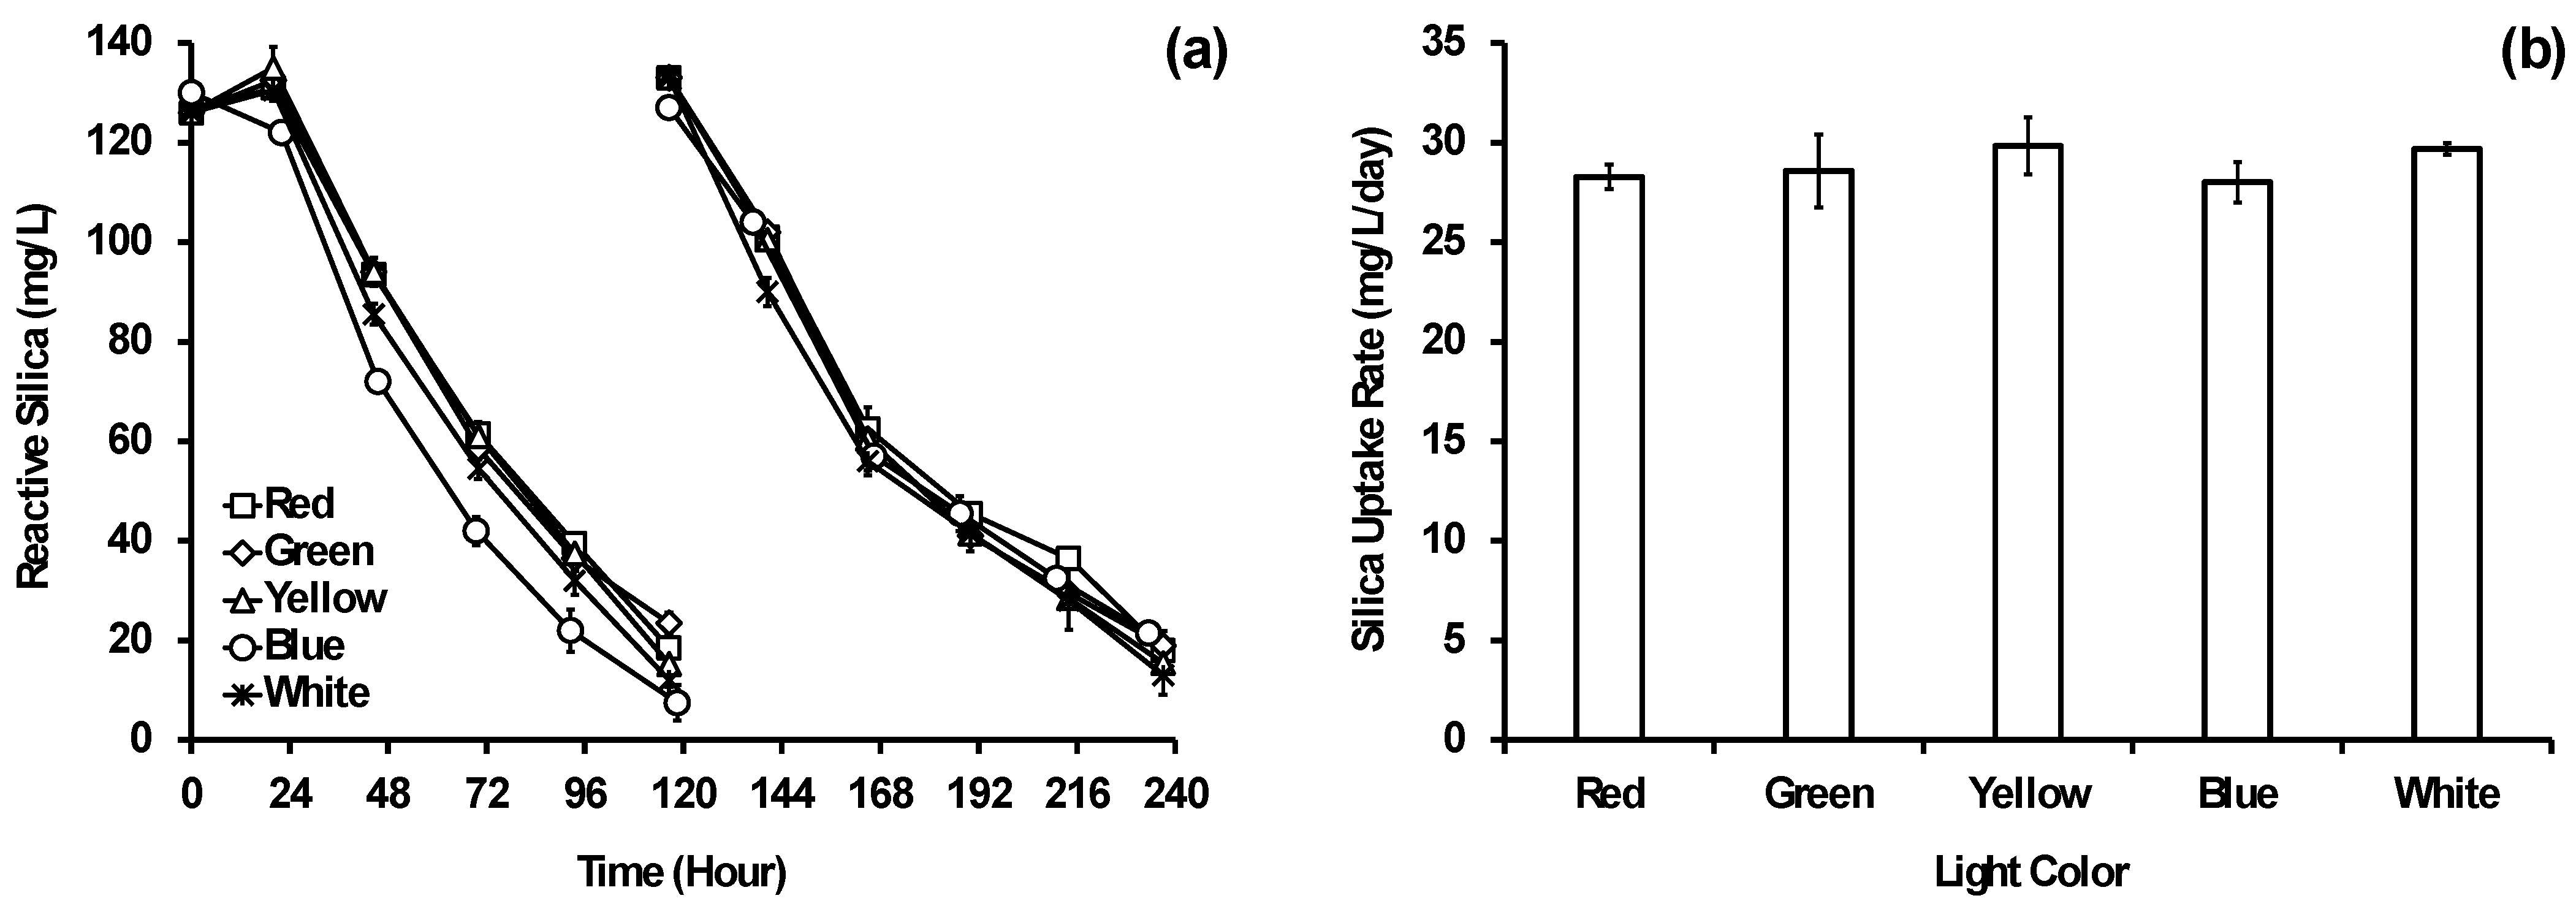
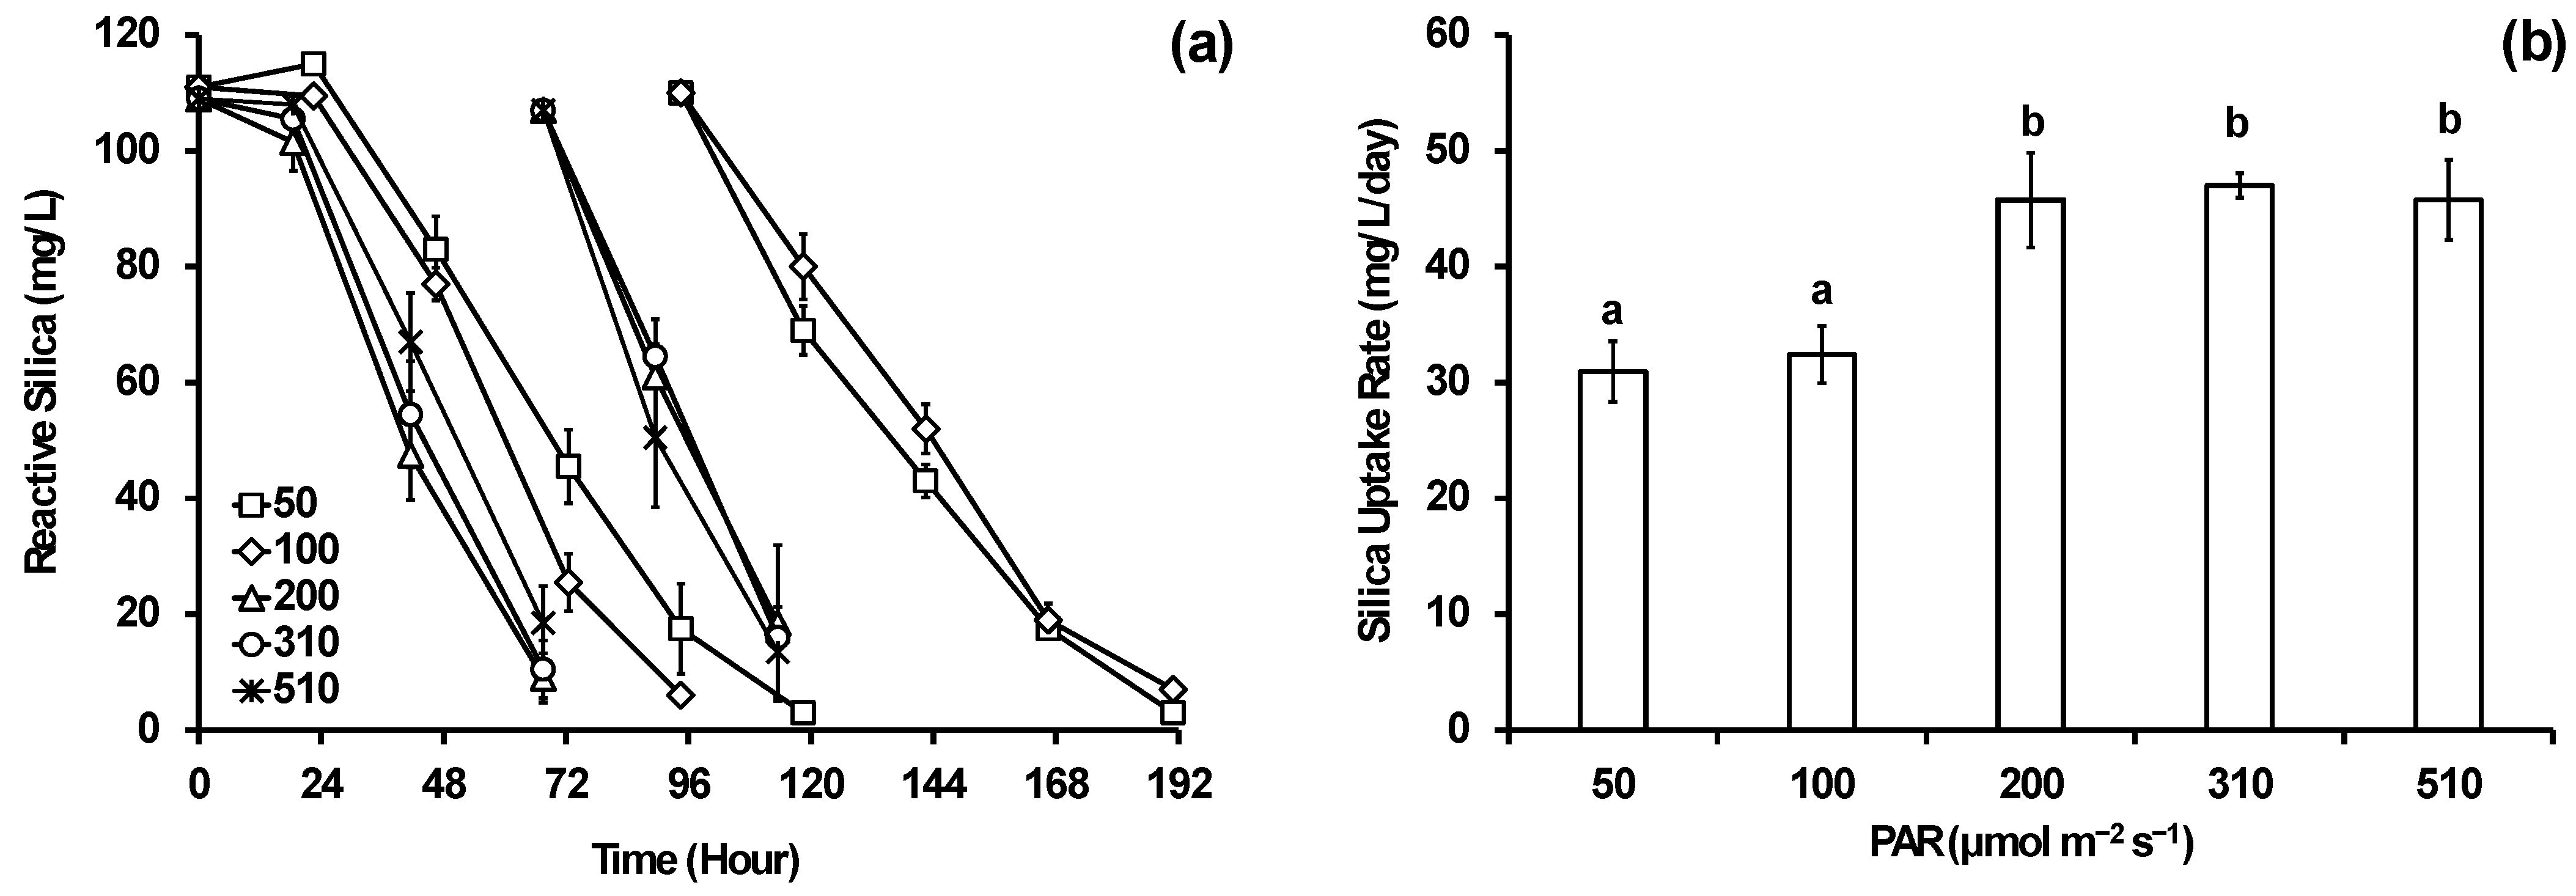
3.2. Impact of Light Color and Intensity on Reactive Silica Removal

Figure 3a shows the reactive silica uptake during the photobiological treatment of H2Oaks ROC by G. flavovirens Psetr3 under various colored LED bulbs. In this experiment, the applied PAR (40–50 μmol m−2 s−1) was lower than in the previous experiment (200 μmol m−2 s−1) due to the lower light output of the colored LED bulbs. Specifically, six bulbs were required to obtain a PAR of 50 μmol m−2 s−1 with the blue bulbs as the majority of visible light emissions filtered by the color filter (Figure S3). As shown, the light color had no marked impact on the silica uptake by G. flavovirens from this ROC. One-way ANOVA indicated no statistically significant difference (p > 0.05) in the means among the five light-colored LED bulbs. The average silica uptake rates in this experiment were found to be around 29 mg/L/day (Figure 3b), which is lower than the values observed during the photobiological treatment experiment using bulbs with various light temperatures (Figure 2b). This is likely due to the lower PAR applied in this experiment. In the following experiment, the impact of light intensity on the silica uptake was evaluated.
Figure 4a shows the impacts of light intensity on the silica uptake by G. flavovirens Psetr3 during the photobiological treatment of H2Oaks ROC. Silica uptake was notably slower at lower PARs (50 and 100 μmol m−2 s−1) and increased significantly at higher PARs (200–510 μmol m−2 s−1). One-way ANOVA revealed statistically significant differences in silica uptake rates among the groups (p < 0.05; Figure 4b). Tukey HSD analysis showed no significant difference between 50 and 100 μmol m−2 s−1. However, significant differences were observed between 50 and 200, 310, and 510 μmol m−2 s−1, as well as between 100 μmol m−2 s−1 and these higher PARs (padj < 0.05). No significant differences were detected between 200 and 310, 200 and 510, or between 310 and 510 μmol m−2 s−1. The average silica uptake rate was 46 ± 3 mg/L/day at the higher PARs.
In this experiment, multiple 10 W LED bulbs were required to achieve PARs of 310 and 510 μmol m−2 s−1. Based on these results, a white LED bulb with a PAR of 200 μmol m−2 s−1 is sufficient and recommended for further research and development of this photobiological treatment process.

3.3. Impact of Temperature on Reactive Silica Removal

Figure 5 shows the impact of incubation temperature on the silica uptake by G. flavovirens Psetr3 during the photobiological treatment of H2Oaks ROC. The silica uptake was significantly slower at 10 °C, requiring 288 h (12 days) to achieve >85% removal of reactive silica. In contrast, silica uptake did not occur at 40 °C, and the reactive silica concentration slightly increased by 25 mg/L, possibly due to the release of soluble silica from intracellular pools at high temperatures [20]. At 23 and 30 °C, the silica uptake was much faster, with slightly higher rates observed at 30 °C (40.9 ± 0.2 mg/L/day) compared to 23 °C (35.1 ± 0.2 mg/L/day). However, these rates were lower than the uptake rate observed in the other experiments conducted at 23 °C (46 mg/L/day), suggesting that the diatom biomass had not reached its optimal growth state in this single-cycle experiment.
In our previous study, silica uptake was shown to slow and even slightly reverse during periods when water temperatures reached around 40 °C [20]. Temperature is a critical factor influencing the growth of algae such as diatoms, as it strongly affects cellular metabolism, including nutrient and carbon dioxide uptake and overall growth rates [24]. While this study did not directly investigate the relationship between temperature and growth rate, the results demonstrate that temperature also impacts silica uptake by diatoms. Figure 6 presents photomicrographs of diatom cells incubated at 30 and 40 °C. The cells incubated at 30 °C (Figure 6a) retained their green pigments, indicating healthy growth, while those incubated at 40 °C (Figure 6b) appeared bleached, with no green pigments remaining. This color change from green to white during the experiment confirms that diatom cells died at the higher incubation temperature.

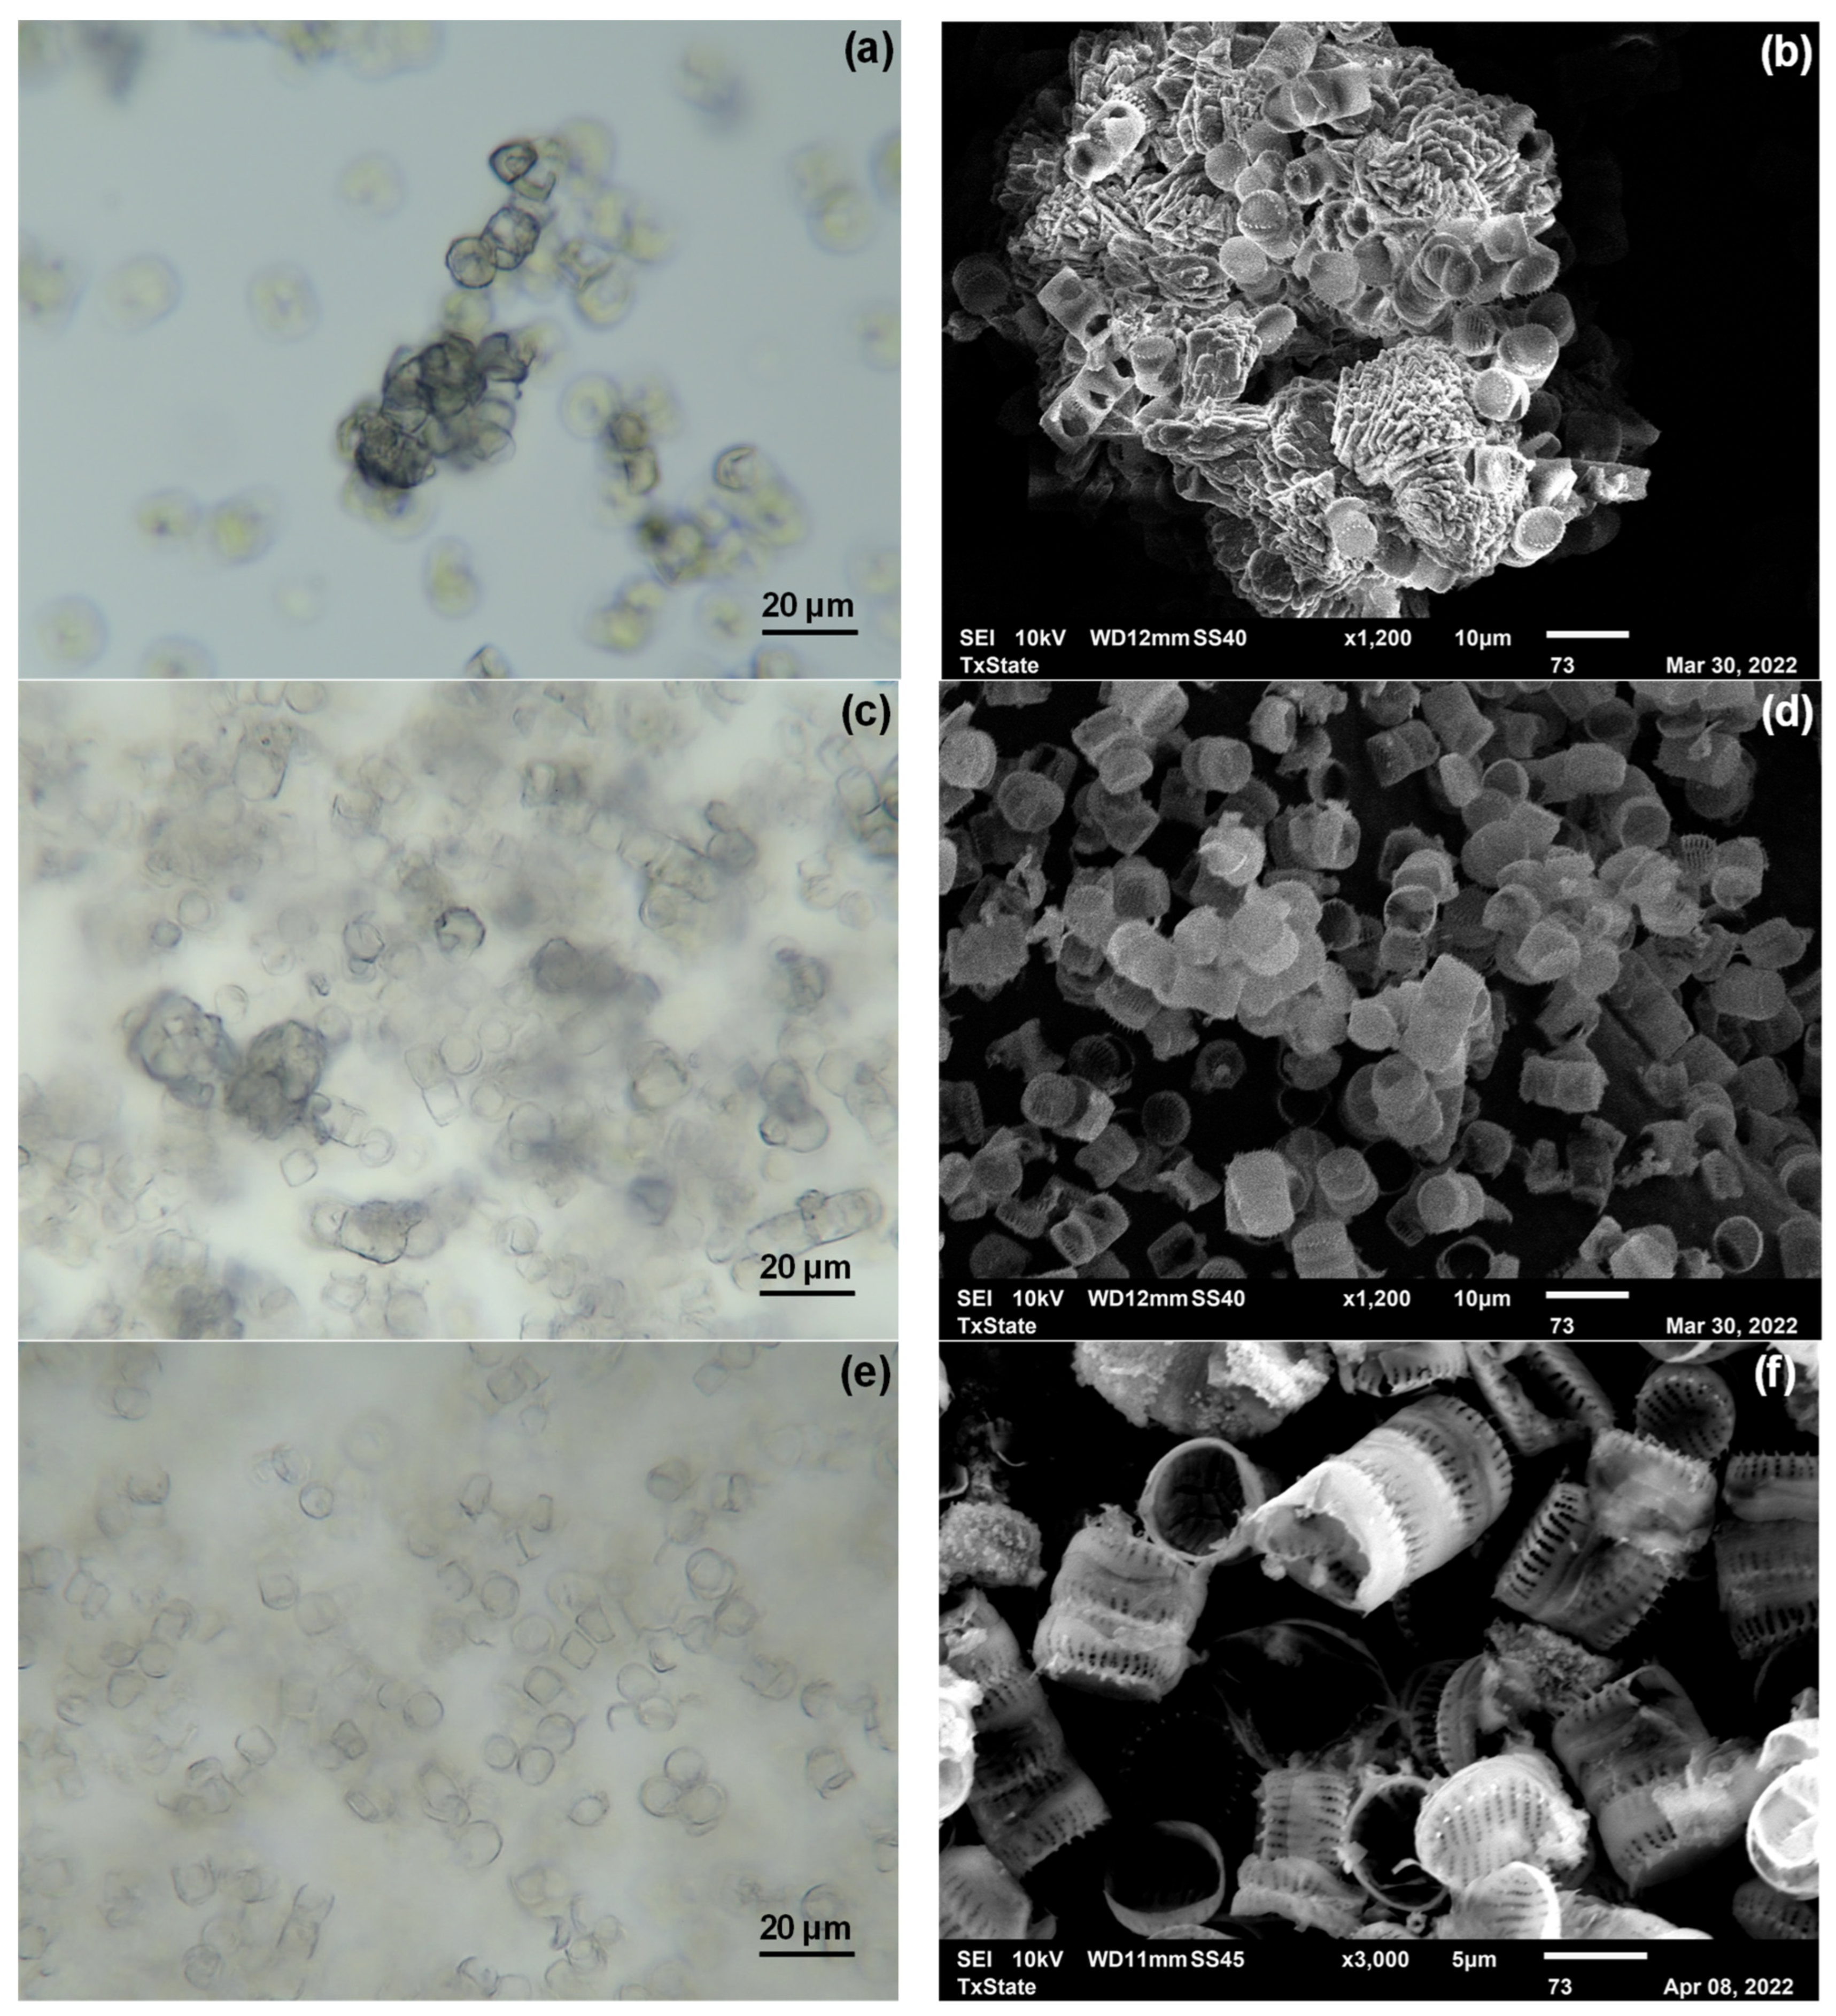
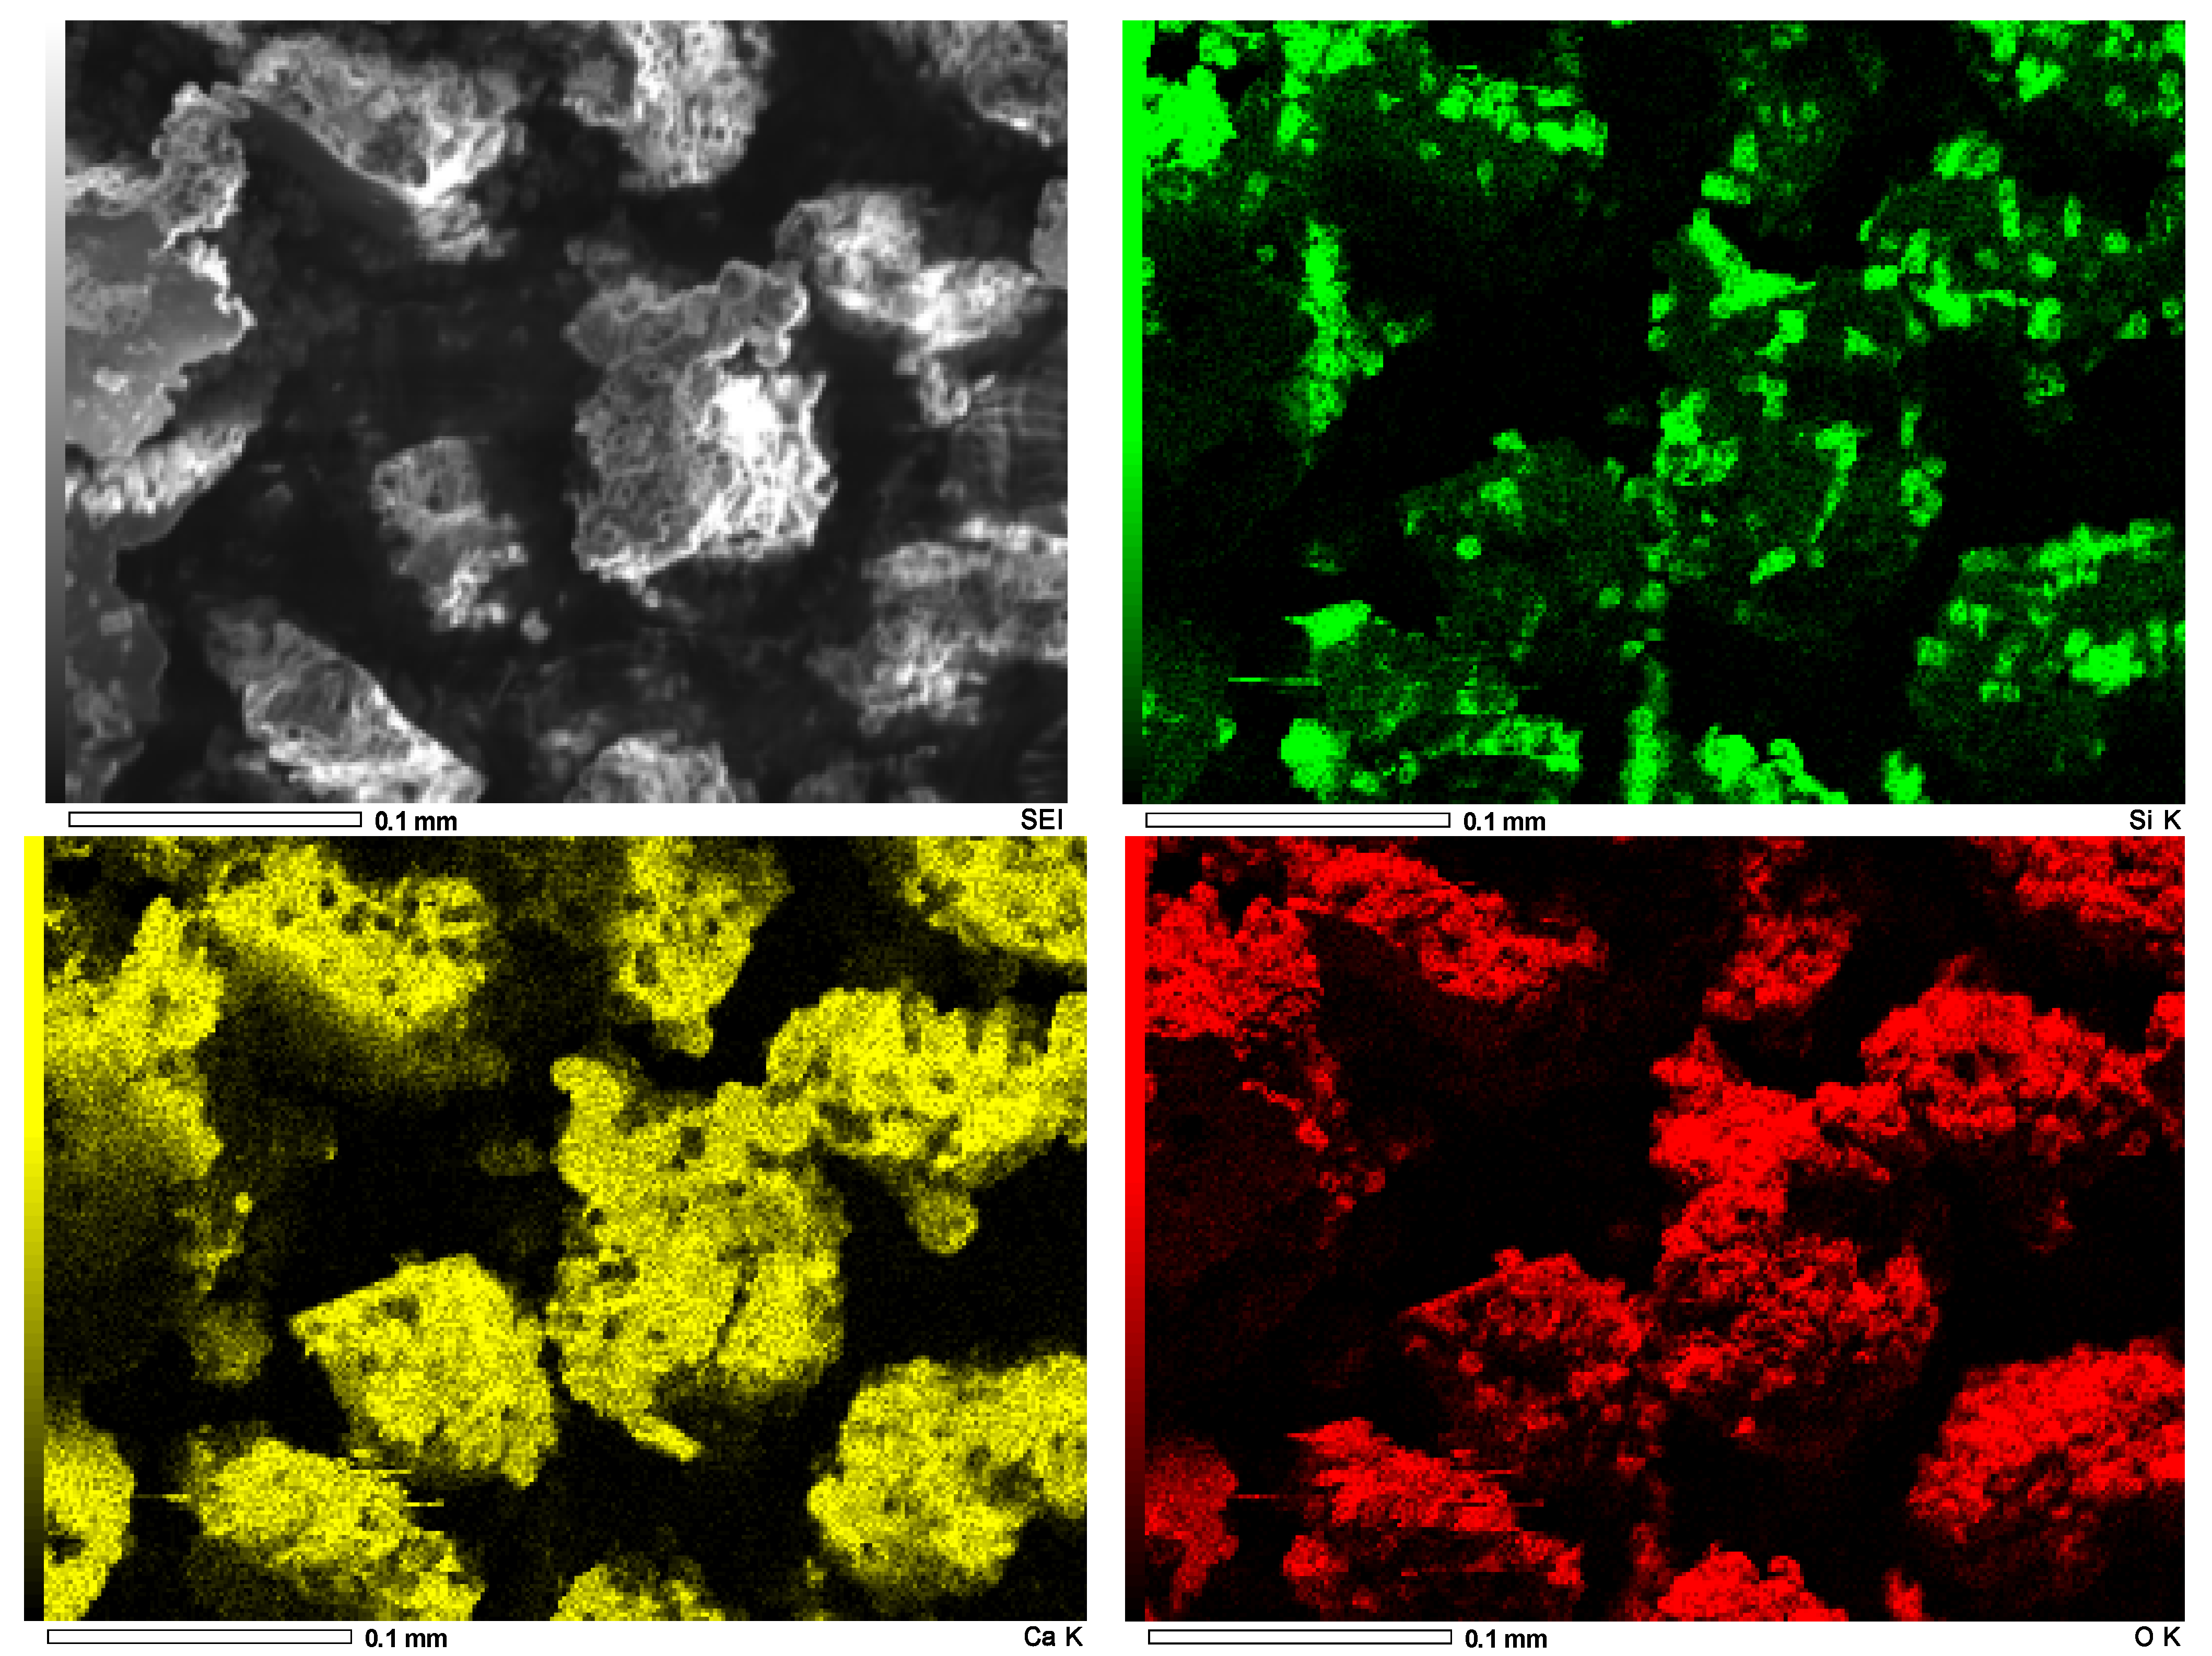
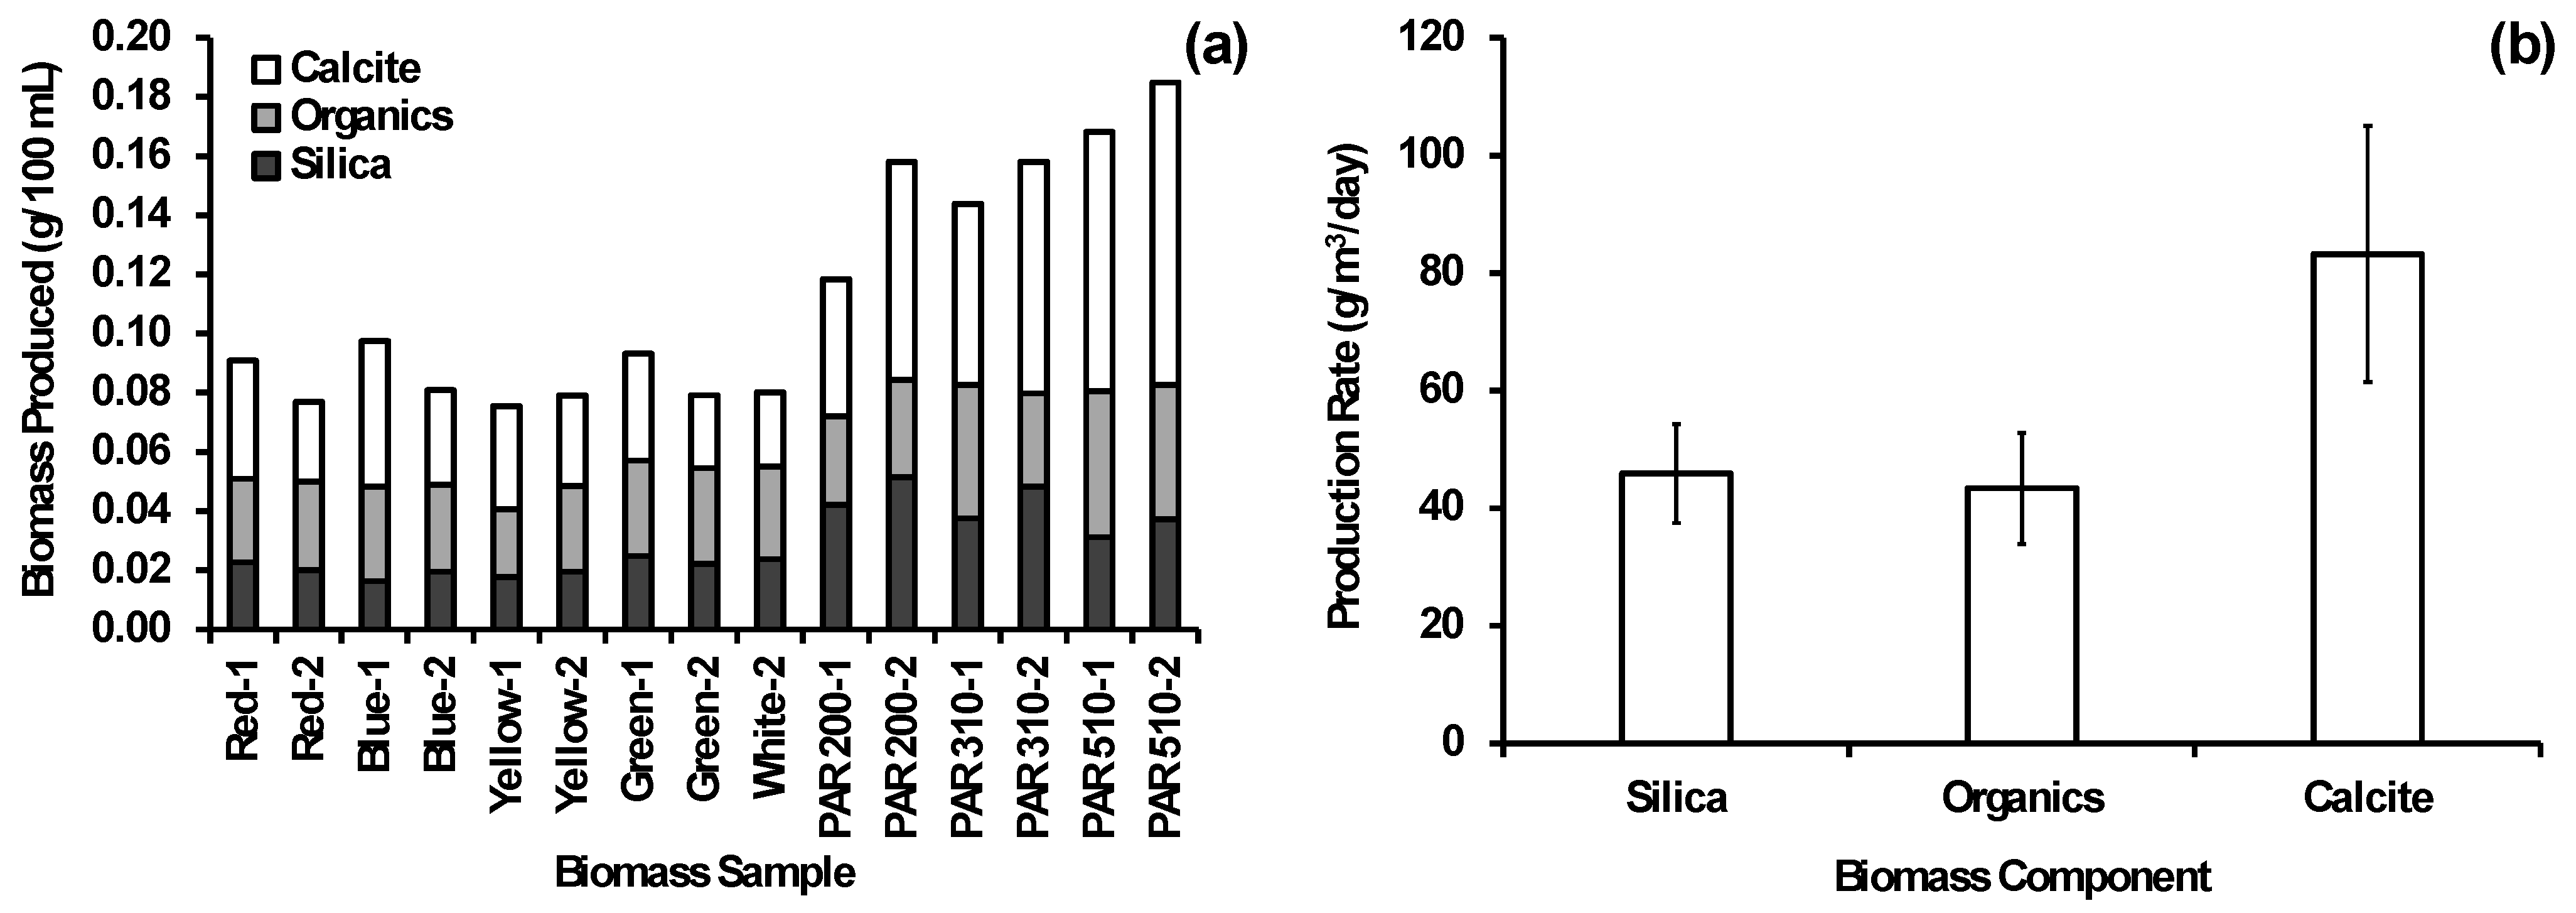
3.4. Biomass Characterization and Quantification

The biomass obtained during the photobiological treatment experiments of the H2Oaks ROC was characterized to quantify frustules (silica, SiO2), calcium carbonate (calcite, CaCO3), and organic components for potential beneficial uses. Calcium precipitation during photobiological treatment, which is presumably resulting from a pH increase (to approximately 9) induced by photosynthesis, has been recognized in previous studies [18]. Figure 7a (light photomicrograph) and Figure 7b (SEM) display dried and reconstituted G. flavovirens Psetr3 biomass grown in H2Oaks ROC before undergoing bleach–citric acid treatment. The frustules appear green, indicating the presence of organic materials (e.g., chloroplasts). Additionally, transparent, irregularly shaped crystals were observed, which acid treatment identified as calcite. The SEM-EDS analysis of dried biomass further confirmed the presence of calcium in these precipitates (Figure 8). In the SEM-EDS images, silicon (Si, green) and calcium (Ca, yellow) did not overlap, while oxygen (O, red) was associated with both silicon and calcium, clearly indicating the presence of silica and calcite in the dried biomass. Following bleach treatment, the frustules lost their green color but retained their shape, while the calcite crystals remained visible (Figure 7c). SEM also confirmed that the frustules’ structure remained intact after bleach treatment (Figure 7d). Finally, citric acid treatment effectively removed the calcite crystals, leaving the biomass primarily composed of silica-based frustules (Figure 7e,f).
Subsequently, the relative abundances of silica frustules, organics, and calcite in the diatom biomass were determined using the digestion and citric acid treatment results. Biomass composition varied across experiments due to the treatment efficiency and length. For instance, the average total biomass produced during the colored bulb experiment (Figure 3) was 0.0835 ± 0.0008 g after two cycles, compared to 0.1552 ± 0.0022 mg/L in the various PAR experiment (Figure 4) conducted at PAR levels of 200, 310, and 510 μmol m−2 s−1 after three cycles. As shown in Figure 9a, silica, organics, and calcite accounted for 26 ± 5%, 31 ± 7%, and 43 ± 7% of the biomass, respectively. The silica content obtained through digestion and citric acid treatment closely aligned with estimates from wet chemistry mass balance analysis. Using the most efficient biomass production data (from the various PAR experiment), the production rates of silica, organics, and calcite were estimated at 46 ± 8, 43 ± 9, and 83 ± 22 g/m3/day, respectively (Figure 9b).

4. Discussion

Light spectral selection is widely employed in photobiological processes to optimize microalgal growth and enhance metabolic activities such as lipid production in photobioreactors (PBRs) [24,25,26,27]. Warmer colors (e.g., red and yellow) correspond to wavelengths within 550–700 nm, while cooler colors (e.g., blue and green) are below 500 nm (Figure S1). Previous studies have demonstrated that blue (425–450 nm) and red (600–700 nm) light ranges are particularly effective for promoting algal photosynthesis. However, in this study on H2Oaks ROC, no significant impact of light color was observed on the silica uptake rates by G. flavovirens Psetr3, despite the tested colors spanning a range of wavelengths. This finding aligns with prior research on ROC from an AWPF using the same diatom [21]. Silica uptake rates remained comparable across the tested conditions, suggesting that light spectral selection is unlikely to provide practical advantages in this photobiological process. Given these findings, the use of readily available, cost-effective soft white LED light sources with a color temperature of 2700 K is recommended for future applications of G. flavovirens PBRs for treating both reclaimed water and brackish water ROCs, minimizing operational expenses without compromising performance.
This study found optimal silica uptake rates for G. flavovirens Psetr3 in H2Oaks ROC at PAR levels of 200 µmol m−2 s−1, much lower than full sunlight intensity (up to 1800 µmol m−2 s−1) [19,21]. This optimum is slightly lower than the 310 µmol m−2 s−1 observed for AWPF ROC treatment, possibly due to the lower background color in H2Oaks ROC (7 PtCo Unit) compared to the AWPF ROC (145 PtCo Unit). These findings suggest that using natural sunlight as the primary light source of the photobiological treatment of BWDF ROC could be a viable approach.
Temperature is a critical factor influencing the growth of diatoms and silica uptake, with most species thriving within moderate temperature ranges [28,29,30]. Previous research has shown that marine microalgae optimize carbon and hydrogen uptake between 17 and 27 °C [30], while freshwater diatoms like Cyclotella meneghiniana exhibit reduced growth at temperatures below 10 °C or above 30 °C [31]. Consistent with these findings, this study confirms that G. flavovirens Psetr3 exhibits optimal silica uptake within a similar range, with temperatures exceeding 40 °C proving detrimental to its performance. These results highlight the importance of maintaining controlled temperature conditions in the PBR systems for the effective treatment of brackish groundwater ROC, as well as reclaimed water ROC [21].
Diatom biomass is primarily composed of silica, which accounts for 30–50% of the dry mass, with the remainder consisting mainly of organic matter, typically 20–40% of the dry weight [32,33]. Silica is a key component of diatom frustules, intricate cell walls made of hydrated amorphous silica, a defining characteristic that distinguishes diatoms from other microalgae. In this study, G. flavovirens Psetr3 biomass exhibited a typical silica composition (26%, including calcite; 52%, excluding calcite), consistent with general patterns observed in diatom species. Algal organics, such as carbohydrates and lipids, have potential for energy production through anaerobic digestion and bio-crude generation [34,35]. Alongside the production of silica and organics through photosynthesis and algal growth, a significant precipitation of calcium carbonate was observed (Figure 7 and Figure 8), predominantly in the form of calcite. This calcite contributed notably to the overall dried mass (43%). It is important to note that the calcite is primarily extracellular and does not strictly constitute part of the “biomass”. However, this calcite can be readily separated by acid dissolution and potentially utilized for beneficial applications.
Microbial calcification, the process by which microorganisms precipitate calcium carbonate, is well documented in both bacteria and algae [36,37,38]. This phenomenon is typically driven by biological processes that alter the local environment, such as changes in pH, carbon dioxide absorption, or microbial metabolism. In cyanobacteria and certain algae, this process is closely associated with photosynthetic activity. Carbon dioxide uptake during photosynthesis can lead to a local increase in pH, promoting calcium carbonate precipitation [38], as confirmed in previous research [19]. Several bacteria, such as Sporosarcina pasteurii and Bacillus subtilis, are particularly well known for their ability to induce calcification through urea hydrolysis, a process commonly applied in bio-cementation technologies [37,39]. In addition, algae, including certain species of green algae, diatoms, and cyanobacteria, can also exhibit microbial calcification. These algae often form biofilms and mats in association with bacteria and fungi, which contribute to the formation of calcite structures [40]. In this study, G. flavovirens Psetr3 likely underwent similar calcification processes, driven by metabolic activities and the elevated calcium concentrations typical of BWDF ROC.
In this study, silica, organics, and calcite content in the “biomass” and their production rates during the photobiological treatment of BWDF ROC using G. flavovirens Psetr3 were determined for the first time. These results provide valuable data for understanding the potential of these byproducts for beneficial use and for offsetting treatment cost. For instance, at a BWDF processing 11.2 MGD (42,500 m3/day) of brackish groundwater and producing 10 MGD (37,800 m3/day) of freshwater (assuming 89% recovery), 1 MGD (3780 m3/day) of ROC is generated. The photobiological treatment of this ROC can yield 174 kg of silica, 163 kg of organics, and 314 kg of calcite per day. These biomaterials, along with additional freshwater recovered by the secondary RO (0.5–0.7 MGD, 1890–2650 m3/day) [20], would provide significant revenues for the proposed photobiological process. Ongoing research aims to develop value-added products, such as tetraalkoxysilanes from purified diatom frustules using a novel synthesis method [41], and to isolate and quantify bioactive nutraceuticals like carotenoids and omega-3 fatty acids [42]. Additionally, continuous-flow pilot-scale experiments and full-scale lifecycle cost analysis of the photobiological treatment system are in progress, based on the optimum treatment conditions and performance data obtained in this work. This study not only advances the understanding of sustainable water resource management by highlighting the dual benefits of treating BWDF ROC through the photobiological process but also significantly contributes to phycological research by elucidating the potential of brackish diatom G. flavovirens Psetr3 in biomaterial production and microbial calcification. By exploring both water resource recovery and the utilization of valuable bioresources, this work paves the way for future innovations that can drive environmental sustainability and open new avenues in algal biotechnology.

Supplementary Materials

The following supporting information can be downloaded at: https://www.mdpi.com/article/10.3390/phycology5010003/s1, Figure S1: Light temperature scale; Figure S2: Light spectra emitted by LED bulbs with different light temperatures; Figure S3: Light emission spectra for five different lighted LED bulbs (PAR: 40–50 μmol m−2 s−1); Table S1: LED bulbs used in this study.

Author Contributions

Conceptualization, K.I.; methodology, H.G., E.R., M.S.U. and K.I.; software, M.S.U. and K.I.; validation, H.A., H.V.K., S.D. and S.S.; formal analysis, H.G., E.R., M.S.U. and K.I.; investigation, H.G., E.R. and K.I.; resources, H.A., S.S. and K.I.; data curation, H.G., E.R. and M.S.U.; writing—original draft preparation, H.G., E.R. and K.I.; writing—review and editing, H.G., E.R., M.S.U., H.A., H.V.K., S.D., S.S. and K.I.; visualization, H.G., E.R., M.S.U. and K.I.; supervision, K.I.; project administration, K.I.; funding acquisition, K.I. All authors have read and agreed to the published version of the manuscript.

Funding

This research was funded by the United States Bureau of Reclamation Desalination and Water Purification Research Program (Award #: R21AC10106, Awarded to K.I.).

Institutional Review Board Statement

Not applicable.

Informed Consent Statement

Not applicable.

Data Availability Statement

Supplementary data for this article can be found at (data provided as Supplementary Materials).

Acknowledgments

The authors would like to thank Jacob A. Palmer, Lokendra Acharya, Dennis Davilla, Saul Gozalez, and Dustin M. Walker at Texas State University, San Marcos, TX, USA, for their technical assistance. The authors gratefully acknowledge the technical assistance of Joyce Andreson with the SEM-EDS analysis at the Analytical Research Service Center, Texas State University. Special thanks are extended to Saqib H. Shirazi and Heather M. Ginsburg of San Antonio Water System, San Antonio, TX, USA, for their support in coordinating with the H2Oaks Center for ROC sample collection and providing technical consultation.

Conflicts of Interest

The authors declare no conflicts of interest.

References

  1. Shemer, H.; Wald, S.; Semiat, R. Challenges and Solutions for Global Water Scarcity. Membranes 2023, 13, 612. [Google Scholar] [CrossRef] [PubMed]
  2. Gerrity, D.; Pecson, B.; Trussell, R.S.; Trussell, R.R. Potable reuse treatment trains throughout the world. J. Water Supply Res. Technol. Aqua 2013, 62, 321–338. [Google Scholar] [CrossRef]
  3. Bremere, I.; Kennedy, M.; Stikker, A.; Schippers, J.C. How water scarcity will effect the growth in the desalination market in the coming 25 years. Desalination 2001, 138, 7–15. [Google Scholar] [CrossRef]
  4. Tzanakakis, V.A.; Paranychianakis, N.V.; Angelakis, A.N. Water Supply and Water Scarcity. Water 2020, 12, 2347. [Google Scholar] [CrossRef]
  5. USGS. Brackish Groundwater in the United States, Professional Paper 1833; U.S. Geological Survey, U.S. Department of Interior: Reston, VA, USA, 2017. [Google Scholar]
  6. Texas Water Development Board. The Future of Desalination in Texas—2022 Biennial Report on Seawater and Brackish Groundwater Desalination in Texas. In Proceedings of the 88th Texas Legislative Session, Austin, TX, USA, 1 December 2022. [Google Scholar]
  7. Shirazi, S.H.; Hernandez, A.J.; Morrison, K. Commissioning a high-recovery brackish groundwater desalination plant in San Antonio. J. Am. Water Works Assoc. 2019, 111, 60–69. [Google Scholar] [CrossRef]
  8. Xu, P.; Cath, T.Y.; Robertson, A.P.; Reinhard, M.; Leckie, J.O.; Drewes, J.E. Critical Review of Desalination Concentrate Management, Treatment and Beneficial Use. Environ. Eng. Sci. 2013, 30, 502–514. [Google Scholar] [CrossRef]
  9. Mohsen, M.S.; Al-Jayyousi, O.R. Brackish water desalination: An alternative for water supply enhancement in Jordan. Desalination 1999, 124, 163–174. [Google Scholar] [CrossRef]
  10. Matin, A.; Rahman, F.; Shafi, H.Z.; Zubair, S.M. Scaling of reverse osmosis membranes used in water desalination: Phenomena, impact, and control; future directions. Desalination 2019, 455, 135–157. [Google Scholar] [CrossRef]
  11. Ruiz-Garcia, A.; Melian-Martel, N.; Mena, V. Fouling characterization of RO membranes after 11 years of operation in a brackish water desalination plant. Desalination 2018, 430, 180–185. [Google Scholar] [CrossRef]
  12. Subramani, A.; DeCarolis, J.; Pearce, W.; Jacangelo, J.G. Vibratory shear enhanced process (VSEP) for treating brackish water reverse osmosis concentrate with high silica content. Desalination 2012, 291, 15–22. [Google Scholar] [CrossRef]
  13. Lisitsin, D.; Hasson, D.; Semiat, R. Critical flux detection in a silica scaling RO system. Desalination 2005, 186, 311–318. [Google Scholar] [CrossRef]
  14. Semiat, R.; Sutzkover, I.; Hasson, D. Technique for evaluating silica scaling and its inhibition in RO desalting. Desalination 2001, 140, 181–193. [Google Scholar] [CrossRef]
  15. Tong, T.Z.; Wallace, A.F.; Zhao, S.; Wang, Z. Mineral scaling in membrane desalination: Mechanisms, mitigation strategies, and feasibility of scaling-resistant membranes. J. Membr. Sci. 2019, 579, 52–69. [Google Scholar] [CrossRef]
  16. Pérez-González, A.; Urtiaga, A.M.; Ibáñez, R.; Ortiz, I. State of the art and review on the treatment technologies of water reverse osmosis concentrates. Water Res. 2012, 46, 267–283. [Google Scholar] [CrossRef] [PubMed]
  17. Pramanik, B.K.; Shu, L.; Jegatheesan, V. A review of the management and treatment of brine solutions. Environ. Sci.-Wat. Res. Technol. 2017, 3, 625–658. [Google Scholar] [CrossRef]
  18. Ikehata, K.; Zhao, Y.; Ma, J.; Komor, A.T.; Maleky, N.; Anderson, M.A. A novel photobiological process for reverse osmosis concentrate treatment using brackish water diatoms. Water Sci. Technol. Water Suppl. 2018, 18, 594–602. [Google Scholar] [CrossRef]
  19. Kulkarni, H.V.; Zhao, Y.; Ikehata, K. Factors influencing photobiological treatment process to remove reactive silica from brackish groundwater reverse osmosis concentrate. Desalination 2019, 452, 114–122. [Google Scholar] [CrossRef]
  20. Ikehata, K.; Zhao, Y.; Kulkarni, H.V.; Li, Y.; Snyder, S.A.; Ishida, K.P.; Anderson, M.A. Water recovery from advanced water purification facility reverse osmosis concentrate by photobiological treatment followed by secondary reverse osmosis. Environ. Sci. Technol. 2018, 52, 8588–8595. [Google Scholar] [CrossRef] [PubMed]
  21. Gao, H.; Sato, S.; Kodamatani, H.; Fujioka, T.; Ishida, K.P.; Ikehata, K. Optimization of Dissolved Silica Removal from Reverse Osmosis Concentrate by Gedaniella flavovirens for Enhanced Water Recovery. Sustainability 2024, 16, 4052. [Google Scholar] [CrossRef]
  22. Ikehata, K.; Nakamura, N.; Kulkarni, H.V.; Zhao, Y.; Maleky, N.; Sato, S.; Gao, H. Isolation and evaluation of brackish diatoms for the photobiological treatment of reverse osmosis concentrate. J. Water Supply Res. Technol. Aqua 2022, 71, 1083–1094. [Google Scholar] [CrossRef]
  23. Sato, S.; Beakes, G.; Idei, M.; Nagumo, T.; Mann, D.G. Novel sex cells and evidence for sex peromones in diatoms. PLoS ONE 2011, 6, e26923. [Google Scholar] [CrossRef] [PubMed]
  24. Singh, S.P.; Singh, P. Effect of temperature and light on the growth of algae species: A review. Renew. Sust. Energ. Rev. 2015, 50, 431–444. [Google Scholar] [CrossRef]
  25. Nwoba, E.G.; Parleyhet, D.A.; Laird, D.W.; Alameh, K.; Moheimani, N.R. Light management technologies for increasing algal photobioreactor efficiency. Algal Res. 2019, 39, 101433. [Google Scholar] [CrossRef]
  26. Harvenda, V.; Hamzah, Y.; Arfianti; Linda, T.M.; Umar, L. Influence of Artificial Light Color on Cellular Respiration of Green Algae Photosynthesis Activity. In Proceedings of the 8th National Physics Seminar, Jakarta, Indonesia, 29–30 June 2019; Volume 2169. [Google Scholar] [CrossRef]
  27. Yang, Y. Effects of Temperature, Light Intensity and Quality, Carbon Dioxide, and Culture Medium Nutrients on Growth and Lipid Production of Ettlia oleoabundans; Worcester Polytechnic Institute: Worcester, MA, USA, 2013. [Google Scholar]
  28. Ras, M.; Steyer, J.P.; Bernard, O. Temperature effect on microalgae: A crucial factor for outdoor production. Rev. Environ. Sci. Bio. 2013, 12, 153–164. [Google Scholar] [CrossRef]
  29. Sathinathan, P.; Parab, H.M.; Yusoff, R.; Ibrahim, S.; Vello, V.; Ngoh, G.C. Photobioreactor design and parameters essential for algal cultivation using industrial wastewater: A review. Renew. Sust. Energ. Rev. 2023, 173, 113096. [Google Scholar] [CrossRef]
  30. Li, W.K.W.; Dickie, P.M. Temperature Characteristics of Photosynthetic and Heterotrophic Activities—Seasonal-Variations in Temperate Microbial Plankton. Appl. Environ. Microbiol. 1987, 53, 2282–2295. [Google Scholar] [CrossRef]
  31. Mitrovic, S.M.; Hitchcock, J.N.; Davie, A.W.; Ryan, D.A. Growth responses of Cyclotella meneghiniana (Bacillariophyceae) to various temperatures. J. Prankton Res. 2010, 32, 1217–1221. [Google Scholar] [CrossRef]
  32. Round, F.E.; Crawford, R.M.; Mann, D.G. The Diatoms—Biology & Morphology of the Genera; Cambridge University Press: Cambridge, UK, 1990; p. 747. [Google Scholar]
  33. Martin-Jézéquel, V.; Hildebrand, M.; Brzezinski, M.A. Silicon metabolism in diatoms: Implications for growth. J. Phycol. 2000, 36, 821–840. [Google Scholar] [CrossRef]
  34. Marella, T.K.; Lopez-Pacheco, I.Y.; Parra-Saldivar, R.; Dixit, S.; Tiwari, A. Wealth from waste: Diatoms as tools for phycoremediation of wastewater and for obtaining value from the biomass. Sci. Total Environ. 2020, 724, 137960. [Google Scholar] [CrossRef]
  35. Wang, J.K.; Seibert, M. Prospects for commercial production of diatoms. Biotechnol. Biofuels 2017, 10, 16. [Google Scholar] [CrossRef] [PubMed]
  36. Hammes, F.; Verstraete, W. Key roles of pH and calcium metabolism in microbial carbonate precipitation. Rev. Environ. Sci. Biotechnol. 2002, 1, 3–7. [Google Scholar] [CrossRef]
  37. Dhami, N.K.; Reddy, M.S.; Mukherjee, A. Application of calcifying bacteria for remediation of stones and cultural heritages. Front. Microbiol. 2014, 5, 304. [Google Scholar] [CrossRef] [PubMed]
  38. Borowitzka, M.A.; Larkum, A.W.D. Calcification in algae: Mechanisms and the role of metabolism. Crit. Rev. Plant Sci. 2008, 6, 1–45. [Google Scholar] [CrossRef]
  39. Iqbal, D.M.; Wong, L.S.; Kong, S.Y. Bio-Cementation in Construction Materials: A Review. Materials 2021, 14, 2175. [Google Scholar] [CrossRef]
  40. Riding, R. Microbial carbonates: The geological record of calcified bacterial–algal mats and biofilms. Sedimentology 2002, 47, 179–214. [Google Scholar] [CrossRef]
  41. Fukaya, N.; Choi, S.J.; Horikoshi, T.; Kataoka, S.; Endo, A.; Kumai, H.; Hasegawa, M.; Sato, K.; Choi, J.-C. Direct synthesis of tetraalkoxysilanes from silica and alcohols. New J. Chem. 2017, 41, 2224–2226. [Google Scholar] [CrossRef]
  42. Mimouni, V.; Ulmann, L.; Pasquet, V.; Mathieu, M.; Picot, L.; Bougaran, G.; Cadoret, J.P.; Morant-Manceau, A.; Schoefs, B. The potential of microalgae for the production of bioactive molecules of pharmaceutical interest. Curr. Pharm. Biotechnol. 2012, 13, 2733–2750. [Google Scholar] [CrossRef] [PubMed]
Figure 1. A simplified scheme of semi-batch photobiological treatment experiments (modified from Gao et al. [21]). Abbreviations: ROC = reverse osmosis concentrate; LED = light-emitting diode; PAR = photosynthetically active radiation.
Phycology 05 00003 g001
Figure 2. Silica uptake by G. flavovirens Psetr3 in H2Oaks ROC with LED light bulbs of various light temperatures: (a) uptake curves and (b) uptake rates. (Temperature: 23 ± 1 °C; PAR: 200 ± 5 μmol m−2 s−1; 10 W LED: 2700, 3000, 4000, and 5000 K; initial biomass concentration: 0.106 g/L).
Phycology 05 00003 g002
Figure 3. Silica uptake by G. flavovirens Psetr3 in H2Oaks ROC under incubation of five different light colors: (a) uptake curves and (b) uptake rates. [Temperature: 21 ± 1 °C; PAR: 40–50 m−2 s−1; 8 W LED: red, green, yellow, blue, and white (10 W, 2700 K); initial biomass concentration: 0.335 g/L].
Phycology 05 00003 g003
Figure 4. Impact of light intensity on the silica uptake by G. flavovirens Psetr3 in H2Oaks ROC: (a) uptake curves as a function of PAR in μmol m−2 s−1 and (b) uptake rates. [Temperature: 23 ± 1 °C; PAR: 50, 100, 200, 310, and 510 μmol m−2 s−1; 10 W LED: 2700 K; initial biomass concentration: 0.164 g/L. Groups labeled with the same letter (e.g., ‘a’) are not significantly different, while groups with different letters (e.g., ‘a’ and ‘b’) are statistically different (padj < 0.05) based on Tukey HSD].
Phycology 05 00003 g004
Figure 5. Silica uptake by G. flavovirens Psetr3 at four different incubation temperatures in H2Oaks ROC (temperature: 10, 23, 30, and 40 °C; PAR: 200 ± 5 μmol m−2 s−1; 10 W LED: 2700 K; initial biomass concentration: 0.288 g/L).
Phycology 05 00003 g005
Figure 6. Photomicrography of G. flavovirens Psetr3 grown at (a) 30 and (b) 40 °C in H2Oaks ROC.
Phycology 05 00003 g006
Figure 7. Light micrographs (a,c,e) and SEM images (b,d,f) of G. flavovirens Psetr3 biomass grown in H2Oaks ROC [(a,b) untreated, (c,d) bleached, and (e,f) bleached and citric acid-treated].
Phycology 05 00003 g007
Figure 8. SEM-EDS images of dried G. flavovirens Psetr3 biomass showing the presence of silicon (Si, green), calcium (Ca, yellow), and oxygen (O, red), as well as SEM (gray). (Samples were prepared with gold coating and mounted using copper tape).
Phycology 05 00003 g008
Figure 9. Production of biomass components during the photobiological treatment of H2Oaks ROC using G. flavovirens Psetr3. (a) Biomass production in the colored blub and various PAR experiments, and (b) biomass production rate based on the various PAR experiments.
Phycology 05 00003 g009
Table 1. Average water quality of H2Oaks ROC samples and analytical methods used.
Water Quality ParameterValueUnitMethod
Calcium260mg/LTitration with EDTA (Hach 8204)
Magnesium400mg/LTitration with EDTA (Hach 8213)
Iron0.33mg/LUSEPA FerroVer® (Hach 8008)
Ammonia-N5mg/LSalicylate Method (Hach 10031)
Chloride2370mg/LSilver Nitrate Method (Hach 8207)
Sulfate4500mg/LUSEPA SulfaVer®4 (Hach 8051)
Bicarbonate605mg/LPhenolphthalein and Total Alkalinity (Hach 8203)
Nitrate-N<0.23mg/LDimethylphenol Method (Hach 10206)
Reactive silica133mg/LSilicomolybdate Method (Hach 8185)
Orthophosphate1.3mg/LUSEPA PhosVer®3 (Hach 8048)
Total dissolved solids10,070mg/LPocketPro Conductivity Tester
Conductivity15.03mS/cmPocketPro Conductivity Tester
Alkalinity993mg/L as CaCO3Phenolphthalein and Total Alkalinity (Hach 8203)
Chemical oxygen demand39mg/LUSEPA Reactor Digestion (Hach 8000)
pH7.7-PocketPro pH Tester
Apparent color at 455 nm7PtCo UnitPlatinum-Cobalt Standard (Hach 8025)
Abbreviations: EDTA = ethylenediaminetetraacetic acid; USEPA = United States Environmental Protection Agency. Note: Hach methods can be found at https://www.hach.com/resources/water-analysis-handbook (accessed on 4 December 2024).
Disclaimer/Publisher’s Note: The statements, opinions and data contained in all publications are solely those of the individual author(s) and contributor(s) and not of MDPI and/or the editor(s). MDPI and/or the editor(s) disclaim responsibility for any injury to people or property resulting from any ideas, methods, instructions or products referred to in the content.

