Article

Characteristics of Electromagnetic Radiation and the Acoustic Emission Response of Multi-Scale Rock-like Material Failure and Their Application

1
National Engineering Research Center for Coal Gas Control, China University of Mining and Technology, Xuzhou 221116, China
2
Key Laboratory of Coal Mine Gas and Fire Prevention and Control of the Ministry of Education, China University of Mining and Technology, Xuzhou 221116, China
3
School of Safety Engineering, China University of Mining and Technology, Xuzhou 221116, China
4
Civil Engineering Department, Sami Shamoon College of Engineering, Ashdod Campus, Ashdod 77662, Israel
*
Author to whom correspondence should be addressed.
Foundations 2022, 2(3), 763-780; https://doi.org/10.3390/foundations2030052
Submission received: 20 May 2022 / Revised: 25 August 2022 / Accepted: 1 September 2022 / Published: 13 September 2022

Abstract

:
In order to explore the evolution characteristics of multi-scale rock-like material failure, we studied the acoustic emission (AE) and electromagnetic radiation (EMR) characteristics of different scale rock-like materials by using the AE-EMR experimental system of coal and rock failure, and the AE and EMR response law of rockburst in mining sites was analyzed. The results show that under uniaxial loading, the stress–strain curve of the specimen has a compaction stage, linear elastic stage, elastic–plastic stage and failure stage. The cumulative AE count, AE energy and stress level of the specimen have an exponential relationship during loading and compression. The cumulative EMR counts of loading and unloading showed a trend of first decreasing and then increasing with the increase in stress level. Electromagnetic radiation and microseismic hypocentral distance show an abnormal change trend when rockburst occurs, and this abnormal phenomenon can be used as a precursor feature signal for rockburst monitoring and early warning.

1. Introduction

With the continuous extension of coal mining deeper underground, ground stress and gas pressure in coal seams gradually increase, and coal and gas outbursts, rockbursts and other coal rock dynamic disasters become more serious and complex. The coal and rock mass produce acoustic emissions and electromagnetic radiation responses in the process of deformation and failure, and the use of AE and EMR methods for the monitoring and providing of an early warning for coal and rock dynamic disasters is a promising development direction.
Scholars have studied the AE and EMR characteristics of coal and rock mass during uniaxial deformation. Ogawa et al. [1] analyzed the generation mechanism of electromagnetic radiation when rock fracturing occurs, and found that both sides of the fracture surface generated by rock fracturing had positive and negative charges, thus generating electromagnetic radiation signals. Gokhberg [2] argued that the charge generated at the crack tip of the loaded rock mass during the fracture process would oscillate, thus inducing electromagnetic emissions effects, such as a piezoelectric effect and friction electrification. V. Rudajev et al. [3] found that a sudden increase in the cumulative event rate of acoustic emission occurs on the eve of the complete instability of rock uniaxial failure, which can be used as a precursor of rock uniaxial compression failure. V.I. Frid et al. [4] pointed out that electromagnetic radiation will be produced when the rock mass is in the elastic plastic deformation stage, and the generation of an electromagnetic radiation signal is used as a means of monitoring and providing an early warning for coal and rock dynamic disasters. Wang et al. [5,6,7] studied the response characteristics of acoustic emission and electromagnetic radiation during the fracture process of loaded coal and rock. Electromagnetic radiation can be generated in the process of coal and rock damage, and the EMR signal is positively correlated with the load. EMR can reflect the gas information in coal, and the presence of gas in coal can enhance the EMR signal. Xu et al. [8] conducted uniaxial compression tests on different types of rocks and found that there was a synchronous phenomenon between the frequency of the electromagnetic pulse and acoustic emissions, and it was not transferred by the difference in stress level and medium structure. Dou Linming et al. [9,10] studied the response law of electromagnetic radiation and acoustic emissions during the fracture process of composite coal and rock based on the AE-EMR test system, and found that the EMR and AE signals were basically positively correlated with the load. Wang Gang et al. [11] proposed that the generation and variation of acoustic charge signals have good consistency with time, and that the frequency of acoustic charge signals gradually decreases and the amplitude of the main frequency gradually increases. Liu Yang et al. [12] analyzed the time–frequency characteristics of acoustic–electric signals in each stage of rock compression under load, and found that the acoustic–electric signals of rock showed similar trends in the process of loading and failure, and the acoustic–electric signals were highly correlated in the time domain.
With the deepening research on the electromagnetic radiation effect of loaded coal and rock by scholars, the electromagnetic radiation technology of coal and rock has experienced significant developments in the monitoring and early warning of coal and rock dynamic disasters in mines. In the early 1980s, Australia developed a dual-channel acoustic emission prediction system [13]. He and Wang et al. [14,15] proposed electromagnetic radiation monitoring and early warning technology, and realized the prediction of coal and rock dynamic disasters by using two indicators of electromagnetic radiation intensity and pulse number. G. V. Afanasenko et al. [16] found that electromagnetic radiation signals are generated during the production of a salt layer and can be used as a monitoring index for evaluating impact disasters. V.I. Frid et al. [17] considered that there was a certain correlation between the electromagnetic radiation intensity produced by rock stress and the outburst risk of rock, and proposed that the electromagnetic radiation pulse can be used as a monitoring index to quantitatively describe the outburst risk of the working face. The China University of Mining and Technology has developed electromagnetic radiation monitoring equipment and analysis software for coal and rock dynamic disasters, and established early warning criteria [18]. Polish scholar Mydlikowski R [19] analyzed the operation of innovative composite measurement instrumentation for spontaneous electromagnetic emission, and applied the system to an actual coal mine. The experimental results confirm the bandwidth characteristics of the electromagnetic field emission signal of the coal mine obtained from early research. Lichtenberger M [20] introduced a new type of linear measuring method along the long axis of the tunnel with an aerial pointed in the direction of maximum EMR emission. According to the measured EMR pulse, the direction and size of the stress field around the tunnel are determined. Zhang [21] constructed a simulation test system of the AE-EMR interference signal in a coal mine, put forward a method for trend early warning of the AE-EMR gas index and determined the critical value of related parameters of trend early warning of the AE-EMR gas index. Shi [22] independently designed an AE-EMR wave integrated test device, and proposed a coal and rock damage instability precursor warning model based on the BP neural network and multi-source information such as acoustic emission. American scholar Nitsan U [23] used standard RF coils and transient recorders to analyze the relationship between the fracturing of quartz-bearing rocks and other hard piezoelectric materials and RF electromagnetic emission, which provided a theoretical basis for studying electromagnetic effects related to earthquakes, hydraulic fracturing and mine damages.
At present, a large number of studies have been carried out on the variation characteristics of electromagnetic radiation and acoustic emission of coal rock fracture, and some achievements have been made in the study of rock size effect, but the influence of rock size effect on electromagnetic radiation and acoustic emission is rarely studied. Therefore, in this work, the rock-like material (concrete) samples with relatively homogeneous mechanical properties and small individual differences are firstly used for laboratory experiments to analyze the damage and failure law, energy dissipation characteristics, electromagnetic radiation and acoustic emission response law of cross-scale coal and rock mass, and the influence of electromagnetic radiation and acoustic emission response law, energy and frequency spectrum evolution law, and size effect on the mechanical properties of rock-like material under different scales in the failure process. According to the general laws obtained from laboratory tests, the variation laws of electromagnetic radiation and microseismic signals in the evolution process of rock burst dynamic disasters during coal mining were tested at the coal mine site, which were used to monitor the deformation and failure process of real coal and rock mass, reflect the loading failure state of coal and rock mass, and analyze the risk of coal and rock dynamic disasters.

2. Experimental System and Methods

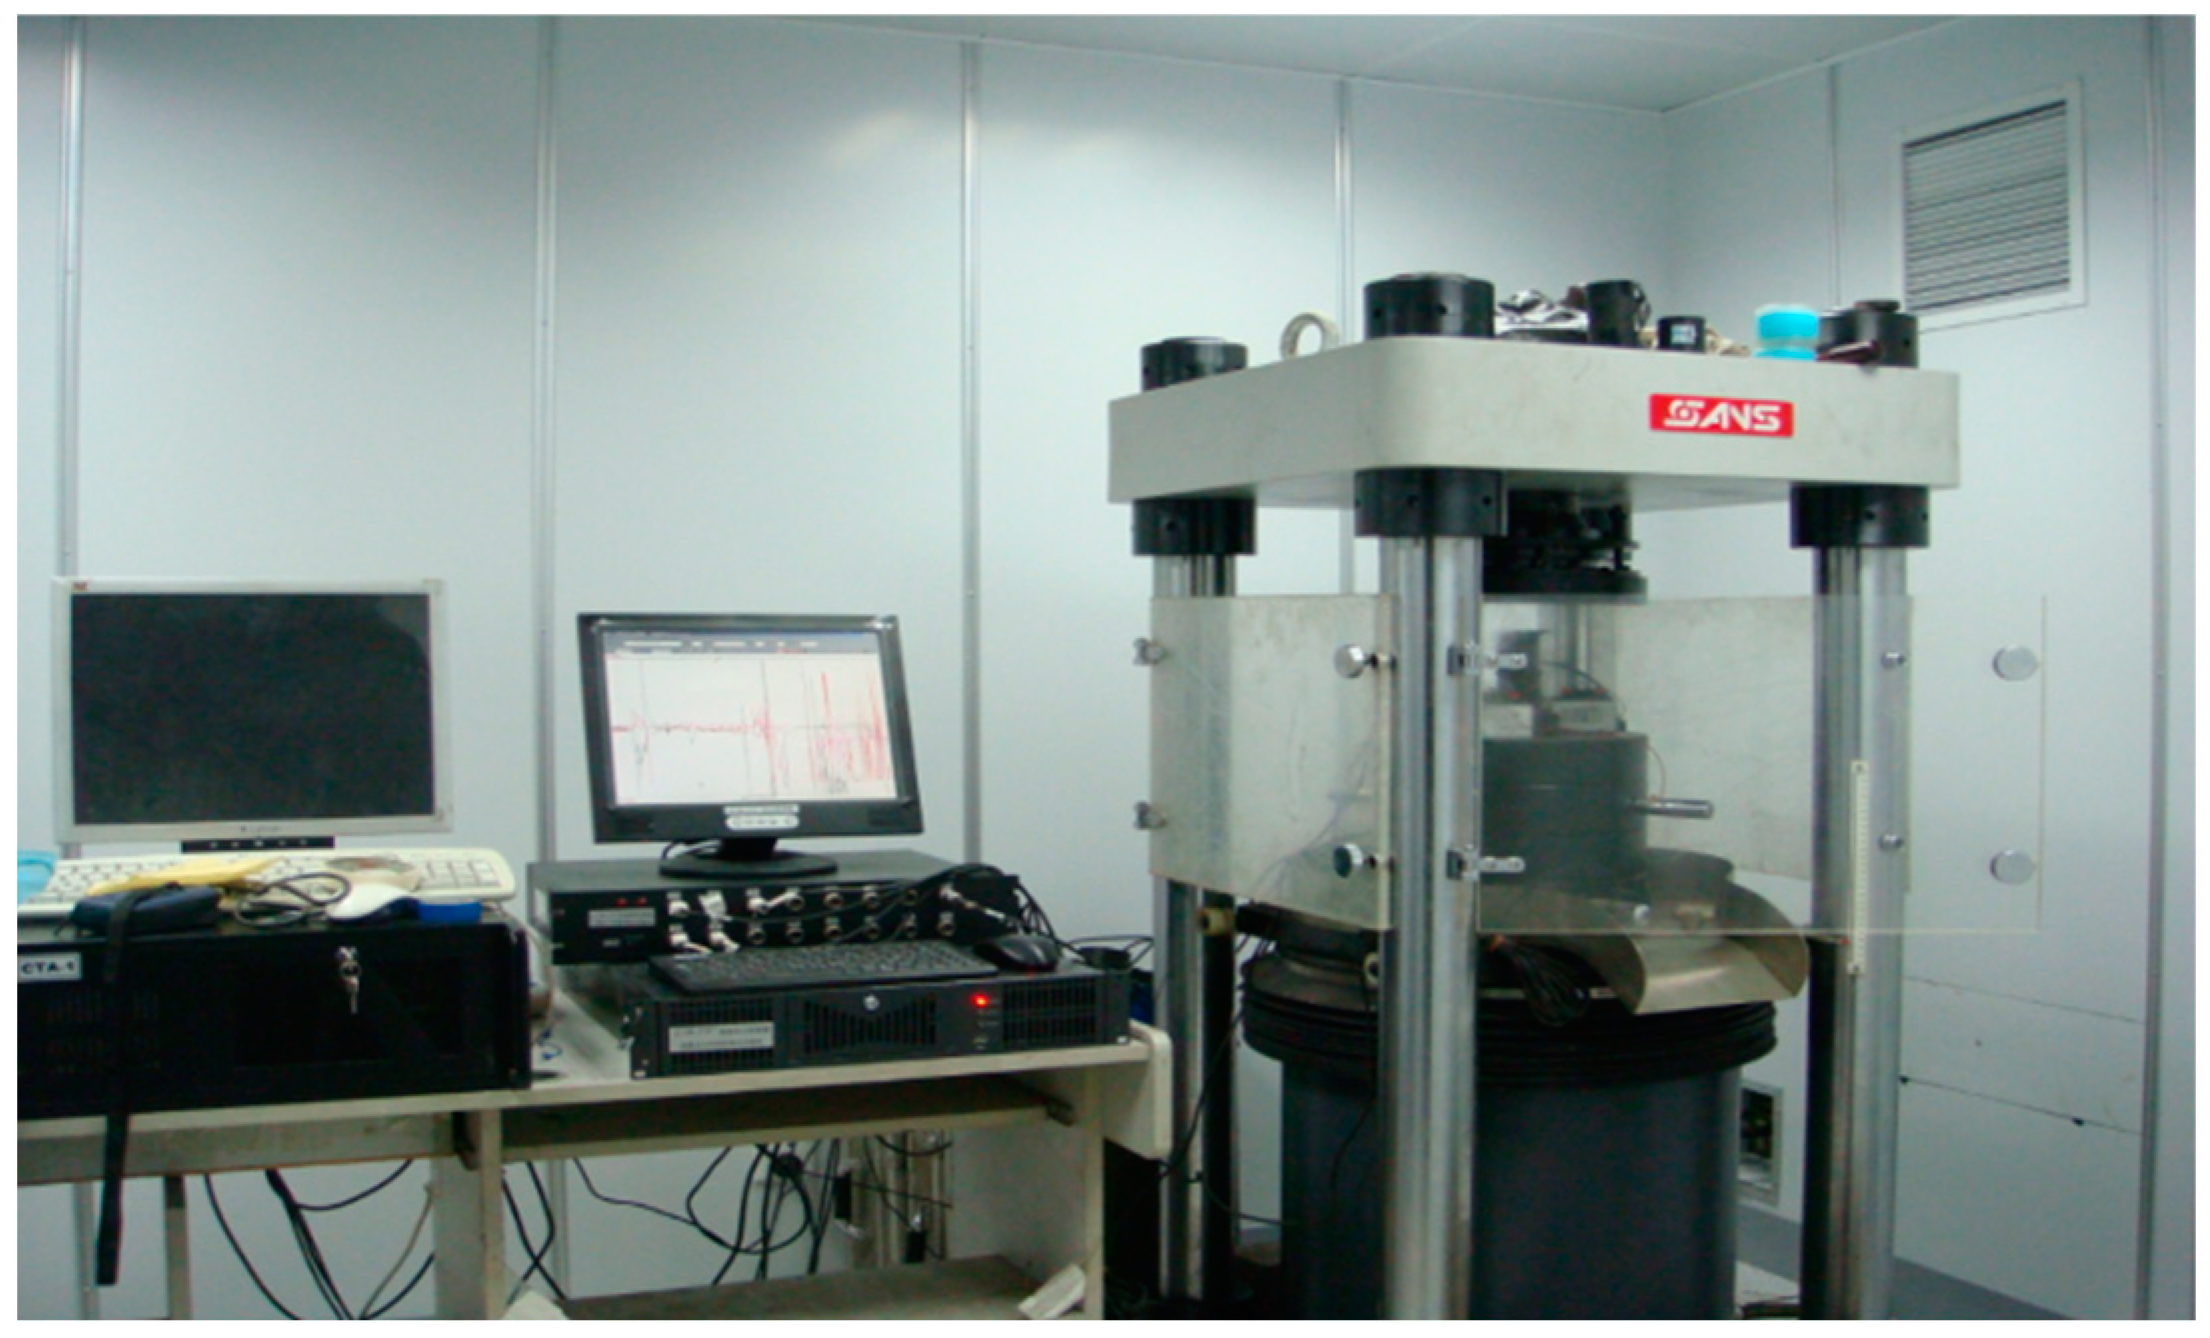
2.1. Experimental System

In this work, we studied the electromagnetic radiation and acoustic emission response characteristics in the stress failure process of rock-like material by using the AE-EMR acquisition system of coal and rock compression fractures. This system was composed of a loading system, an AE-EMR data acquisition system and a shielding system, as shown in Figure 1.
The loading system adopted a SANS microcomputer-controlled electro-hydraulic servo pressure testing machine with a maximum loading capacity of 300 kN. The system was able to record and automatically draw deformation–time curves, load–time curves, stress–displacement curves and stress–strain curves in real time, and provide high-speed sampling functions. The AE-EMR data acquisition system adopted the American CTA-1 type AE-EMR dynamic data acquisition instrument. The system was able to collect the AE-EMR signals of eight monitoring channels at the same time and analyze the AE-EMR data. The resonant frequency of the acoustic emission sensor used in the experiment was 42.3 kHz. The receiving frequencies of electromagnetic radiation antenna were 100 Hz, 800 Hz and 25 kHz.

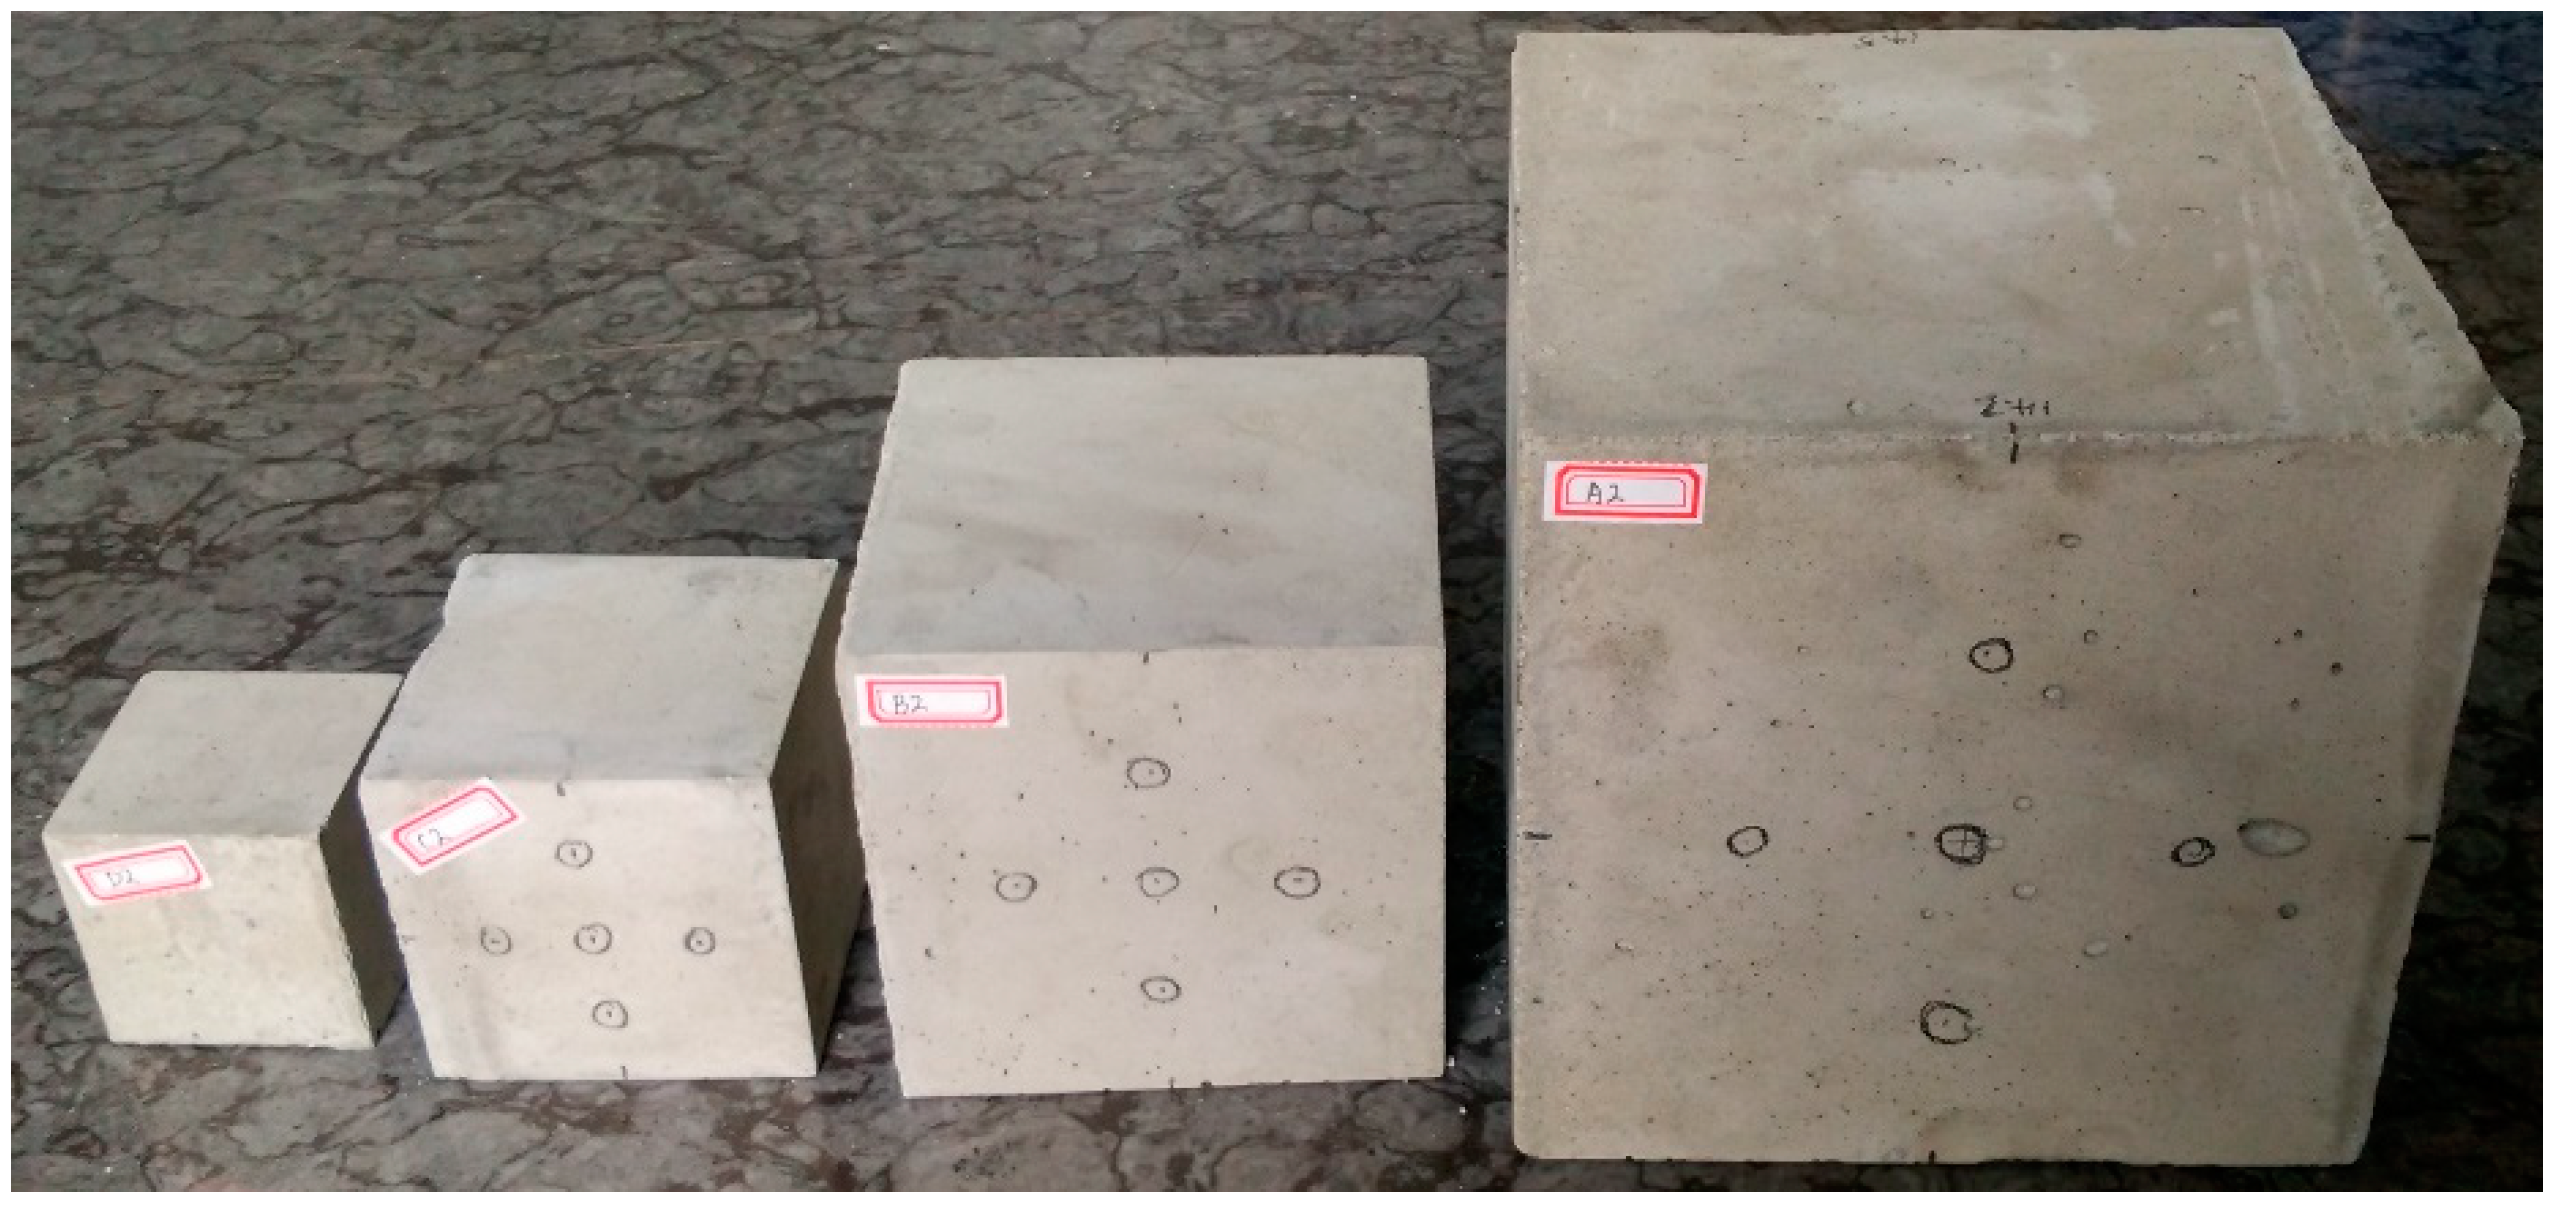
2.2. Sample Preparation

In order to eliminate the influence of the homogeneity dispersion of sample, special concrete (rock-like materials) samples were used to simulate coal and rock samples, and the characteristics of AE-EMR were studied under compression failure of different scaled samples.
The proportioning quality ratio of concrete samples in this experiment is shown in Table 1. After the raw materials were configured according to the given proportion, they were stirred evenly. In the pouring process, the vibration mold had to be appropriate to make the sample more homogeneous.
In order to compare the common characteristics of different sizes, four cube specimens with different sizes of 5 cm, 7 cm, 10 cm and 15 cm were used in the experiment, and three specimens were prepared for each size. Some specimens are shown in Figure 2.

2.3. Experimental Scheme

In the experiment, the strain rate of each specimen was consistent, and the loading rate was proportional to the sample size. The specific experimental scheme is shown in Table 2.

3. Experimental Results

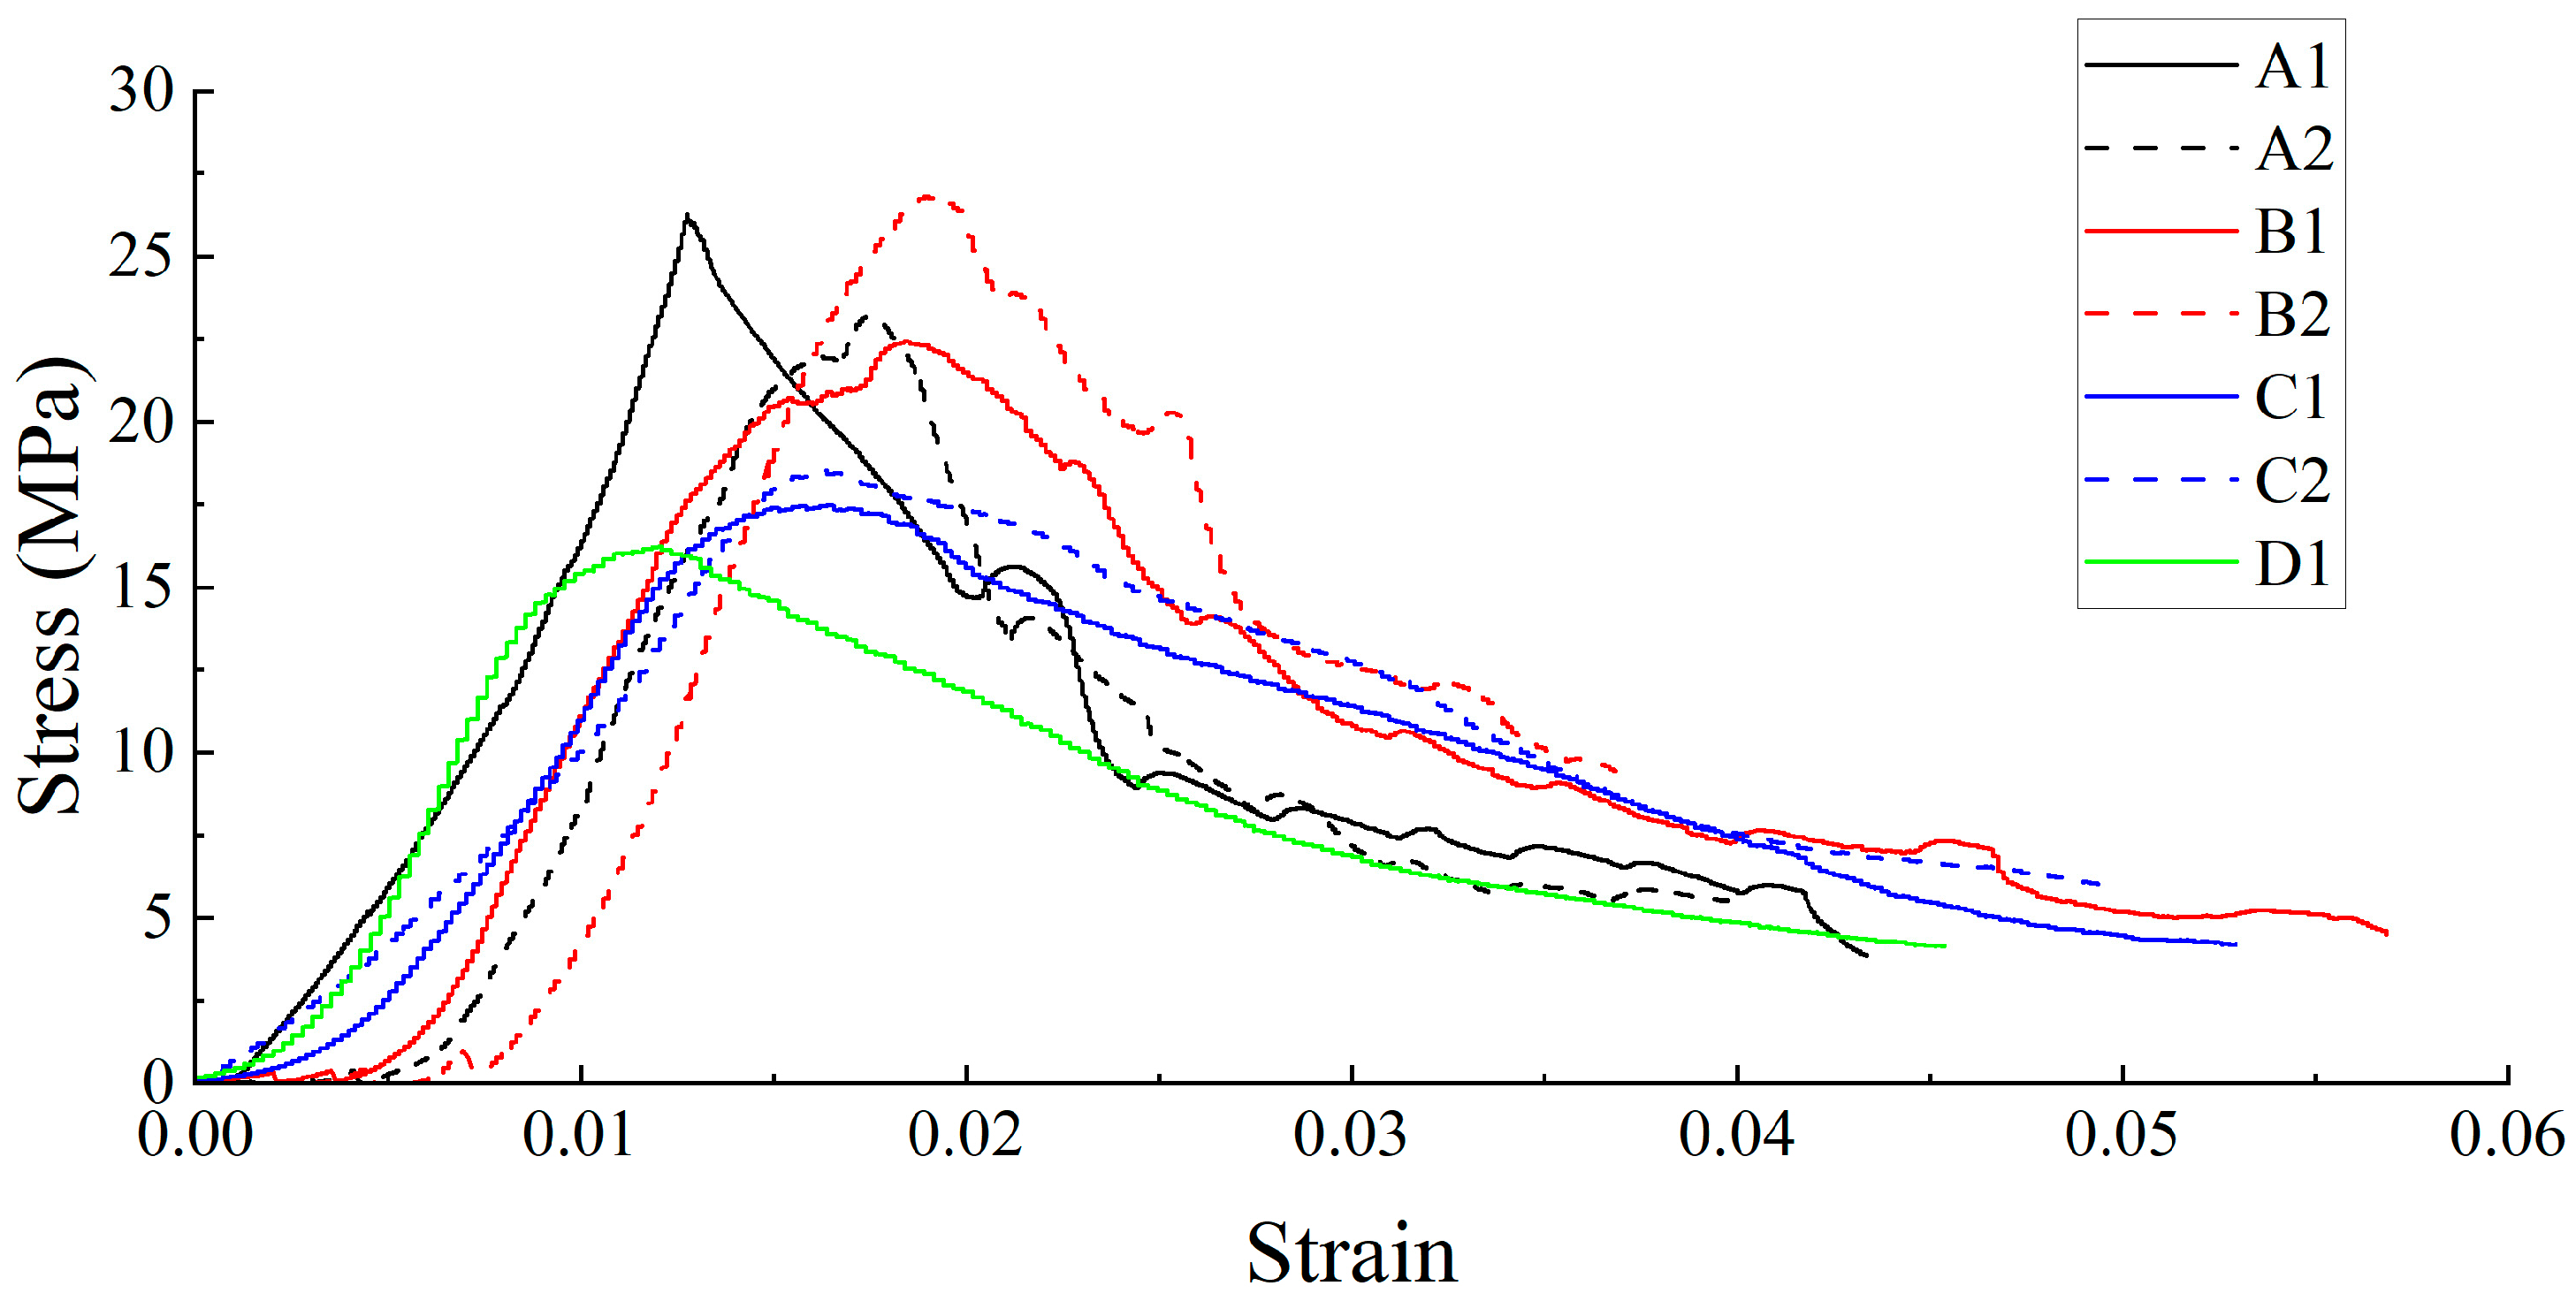
3.1. Mechanical Deformation and Failure Characteristics of Specimens

Figure 3 and Figure 4 show the stress–strain curves of specimens under uniaxial and cyclic loading. It can be seen from Figure 3 that under uniaxial loading, the stress–strain curve of the specimen has a compaction stage, linear elastic stage, elastic–plastic stage and failure stage.
The loading–unloading curves of specimens under the displacement-controlled compression are basically coincident in the cyclic loading condition, and the plastic deformation is small, indicating that the energy dissipation is less. The loading–unloading curves of the specimen controlled by force and the area surrounded by the transverse axis are large, and there is a large plastic deformation, indicating that the loading control method has a great influence on the damage deformation and energy dissipation of concrete.
The fitting curve between peak stress and size is shown in Figure 5. It can be seen that when the sample size is small, the peak stress shows an overall upward trend with the increase in size. When the sample size reaches 100 mm, the trend tends to converge.

3.2. Study on Failure Acoustic Emission Characteristics of Specimens

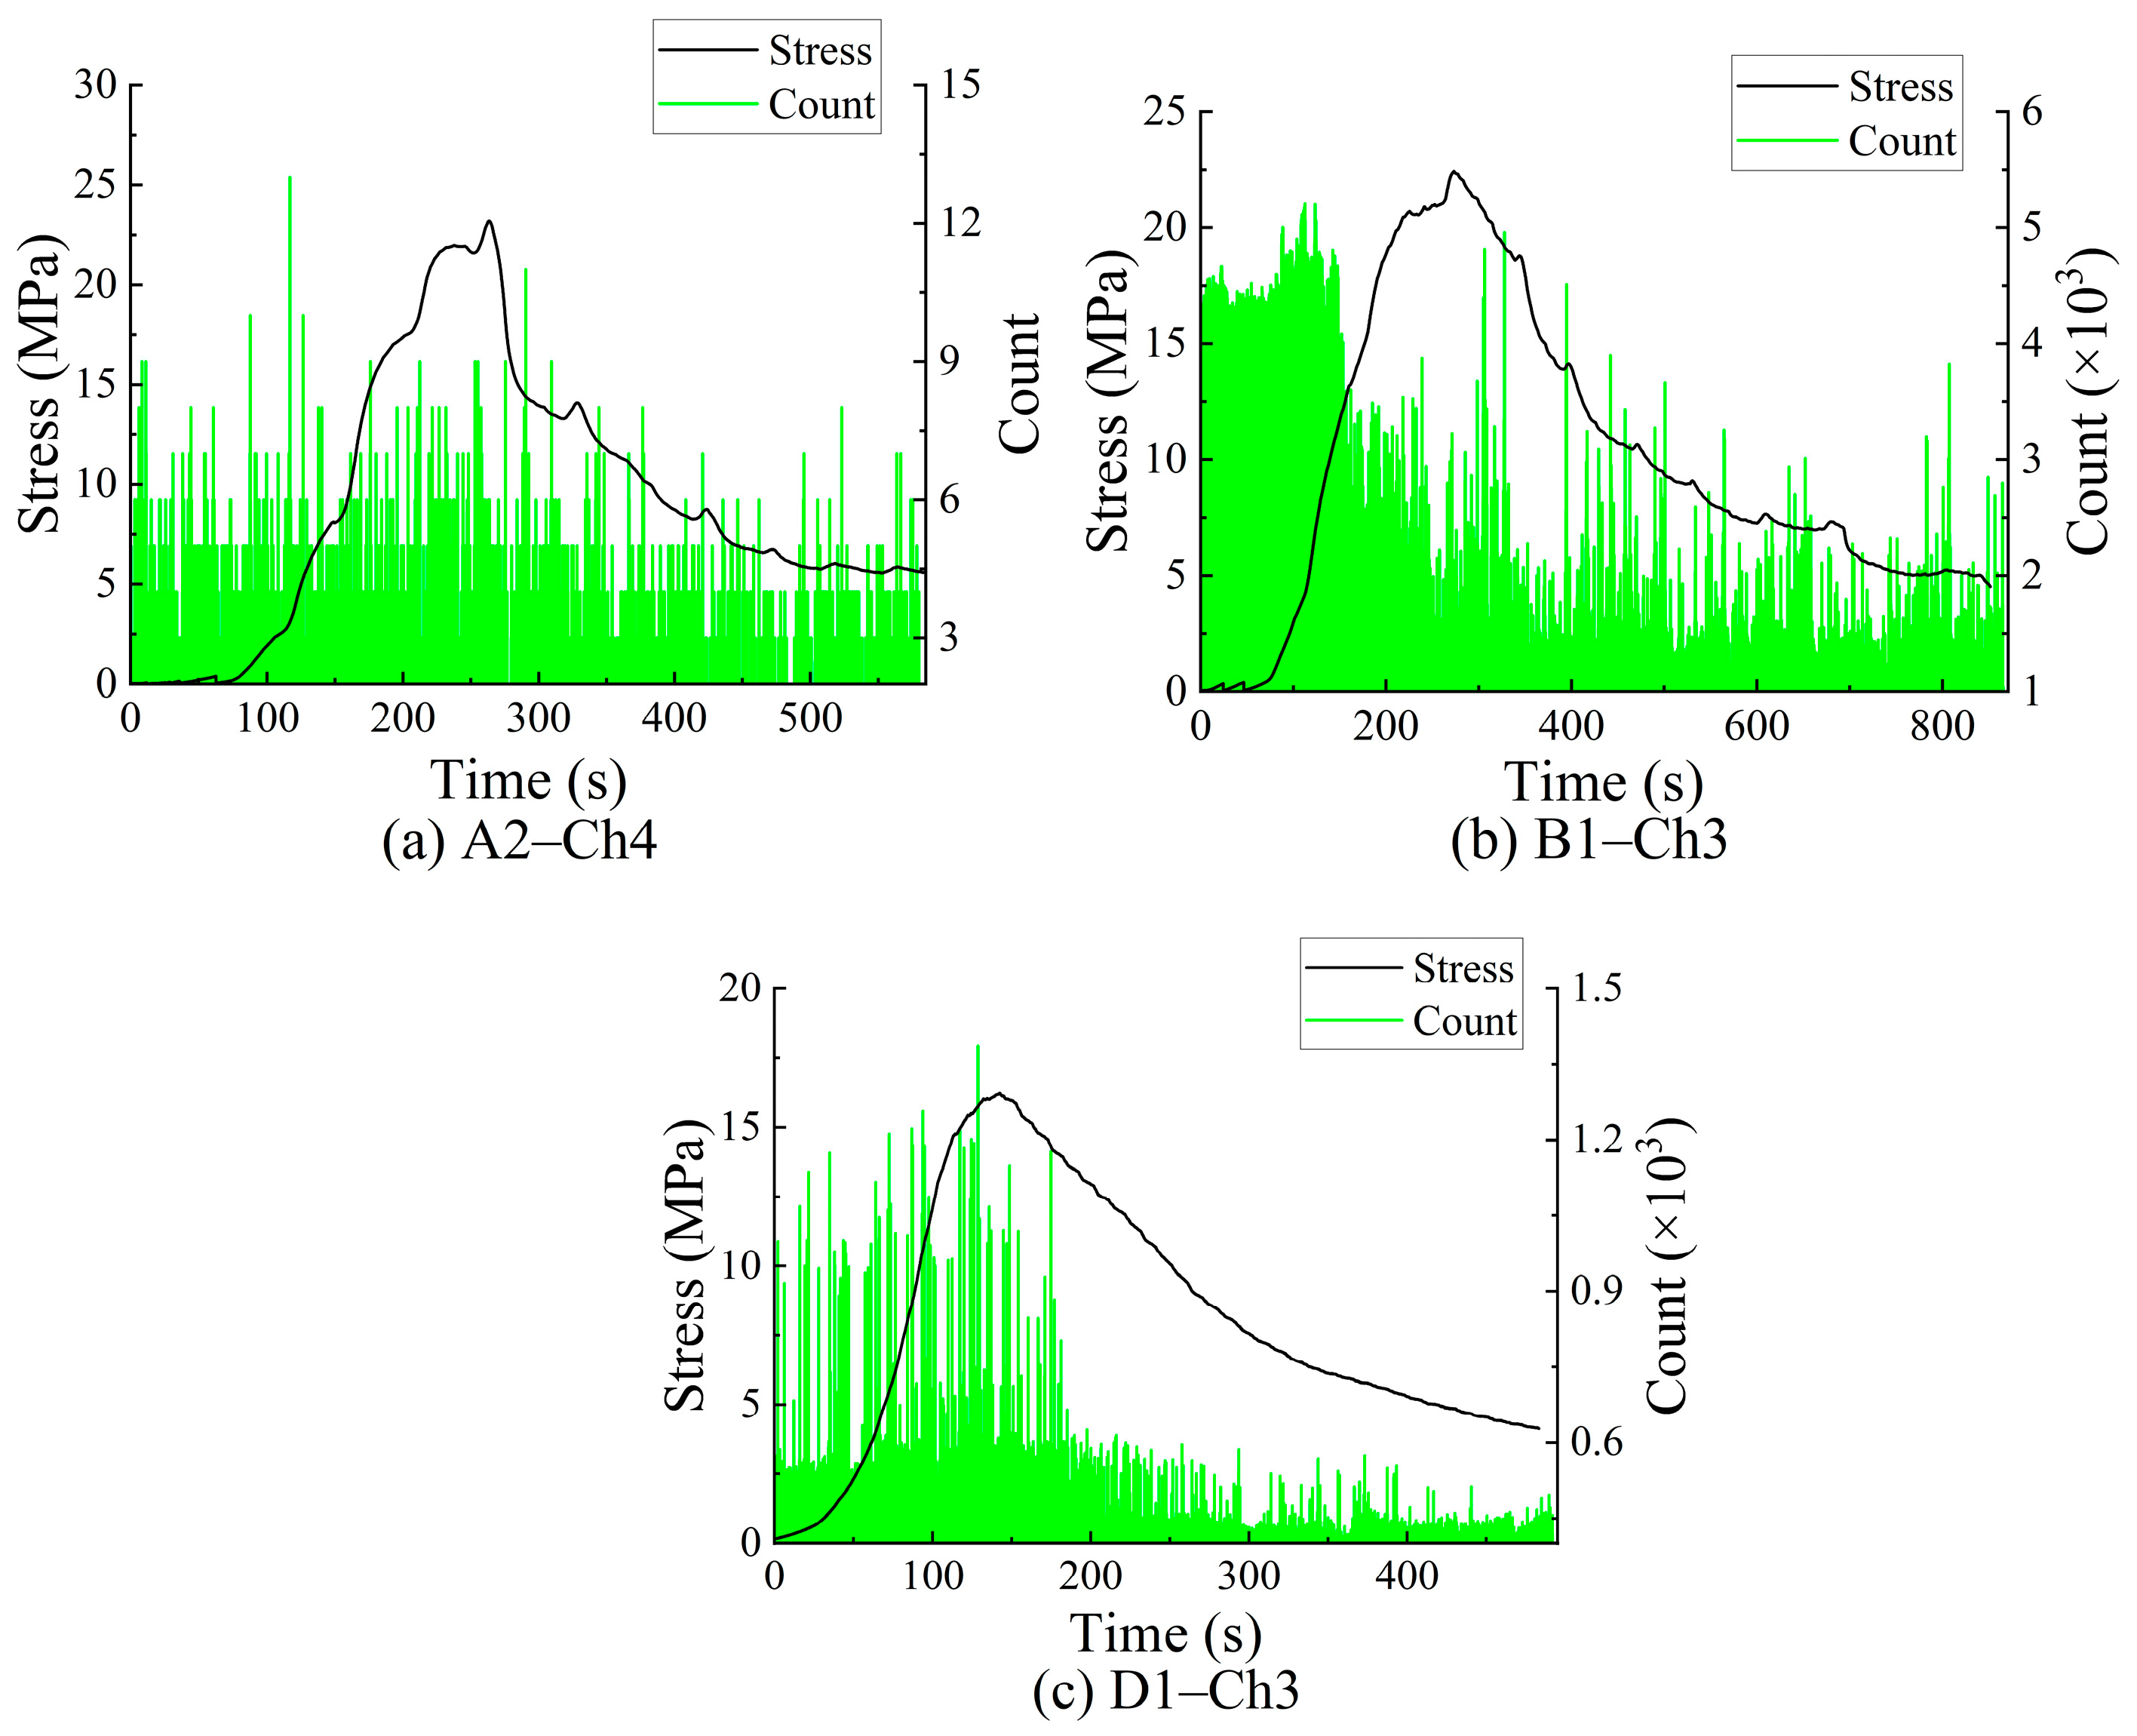
3.2.1. Acoustic Emission Characteristics of Specimen under Uniaxial Loading

An acoustic emission event is a single burst signal generated by local changes in the material. The acoustic emission count is the number of ringing pulses for which the acoustic emission signal exceeds the threshold in a test.
The acoustic emission of the specimen under uniaxial loading is shown in Figure 6. It can be seen from the figure that there is acoustic emission during the uniaxial compression of the specimen, and the acoustic emission shows different characteristics at different loading deformation stages. In this paper, the acoustic emission characteristics of the B2 specimen under uniaxial compression are described.
(1)
There was a certain acoustic emission signal in the initial loading stage of the specimen, which was due to the fact that as the load gradually increased, the tiny holes in the specimen were gradually compacted, resulting in a certain degree of micro-fracturing.
(2)
During the mid-loading period, the micro-fractures tend to be active, while the acoustic emission activity increases and quickly reaches the counting peak. With the progression of time, the acoustic emission activity is gradually weakened, which is due to the density of micro-cracks in the material reaching a certain level. At this time, the energy gathered inside the material is not enough for micro-fractures to penetrate through the material and form macro-cracks.
(3)
After a period of stable development, due to the energy gathered inside the material reaching the energy limit that it can accommodate, the micro-cracks quickly penetrate through the material and form macro-cracks, and the acoustic emission count increases rapidly to the maximum level.
(4)
After the main fracturing of the specimen, the acoustic emission activity gradually decreases after a brief increase, which is due to the strong friction between the material weakening fracture surfaces, which causes the acoustic emission signal to continue to grow.
AE is generated by the initiation, propagation and friction of microcracks in the deformation and failure process of specimens, and the crack propagation depends on whether the stress intensity factor at the crack tip reaches or even exceeds its fracture toughness—that is, to a large extent, it depends on the stress of the material and the damage state of the material under the action of this stress. AE activity is closely related to the stress level.
It can be seen from Figure 6 that with the increase in sample size, the fluctuation of acoustic emission count becomes more obvious. The acoustic emission counts of D1 samples are mainly concentrated in the critical rupture time. The C1 sample produces strong acoustic emission signals after rupture, but there are still a lot of acoustic emission signals after rupture. The acoustic emission count of the B2 sample shows strong volatility, and the stress curve of the sample still has a small rebound after fracturing, which is due to the large size of the sample and some parts being stress concentration areas. The AE count curve of the A1 sample also showed strong volatility, and there were more stress rebounds, and the AE count at corresponding time also showed an upward trend.
In order to compare the AE-EMR characteristics of each cycle interval for specimens with different sizes, the stress level is usually defined by the ratio of the actual stress to the failure strength of the specimen under cyclic loading. In the process of uniaxial loading, the failure strength refers to the stress borne by the specimen at a certain time. Figure 7 shows the fitting relationship between the stress level and the cumulative acoustic emission count. It can be seen from the figure that the curve fitting effect of the cumulative acoustic emission count–stress level relationship is better, indicating that there is a significant nonlinear relationship between acoustic emission and stress level. The stress level of specimens can be inverted according to the monitored acoustic emission level.
Figure 8 depicts the curve of cumulative acoustic emission count at the peak stress and its fitting relationship with size. It can be seen from the diagram that with the increase in size, from the beginning of loading to the peak stress, there is a nonlinear relationship between the cumulative acoustic emission value and the sample size. The cumulative acoustic emission count generated by the failure of the sample increases nonlinearly with the increase in size.

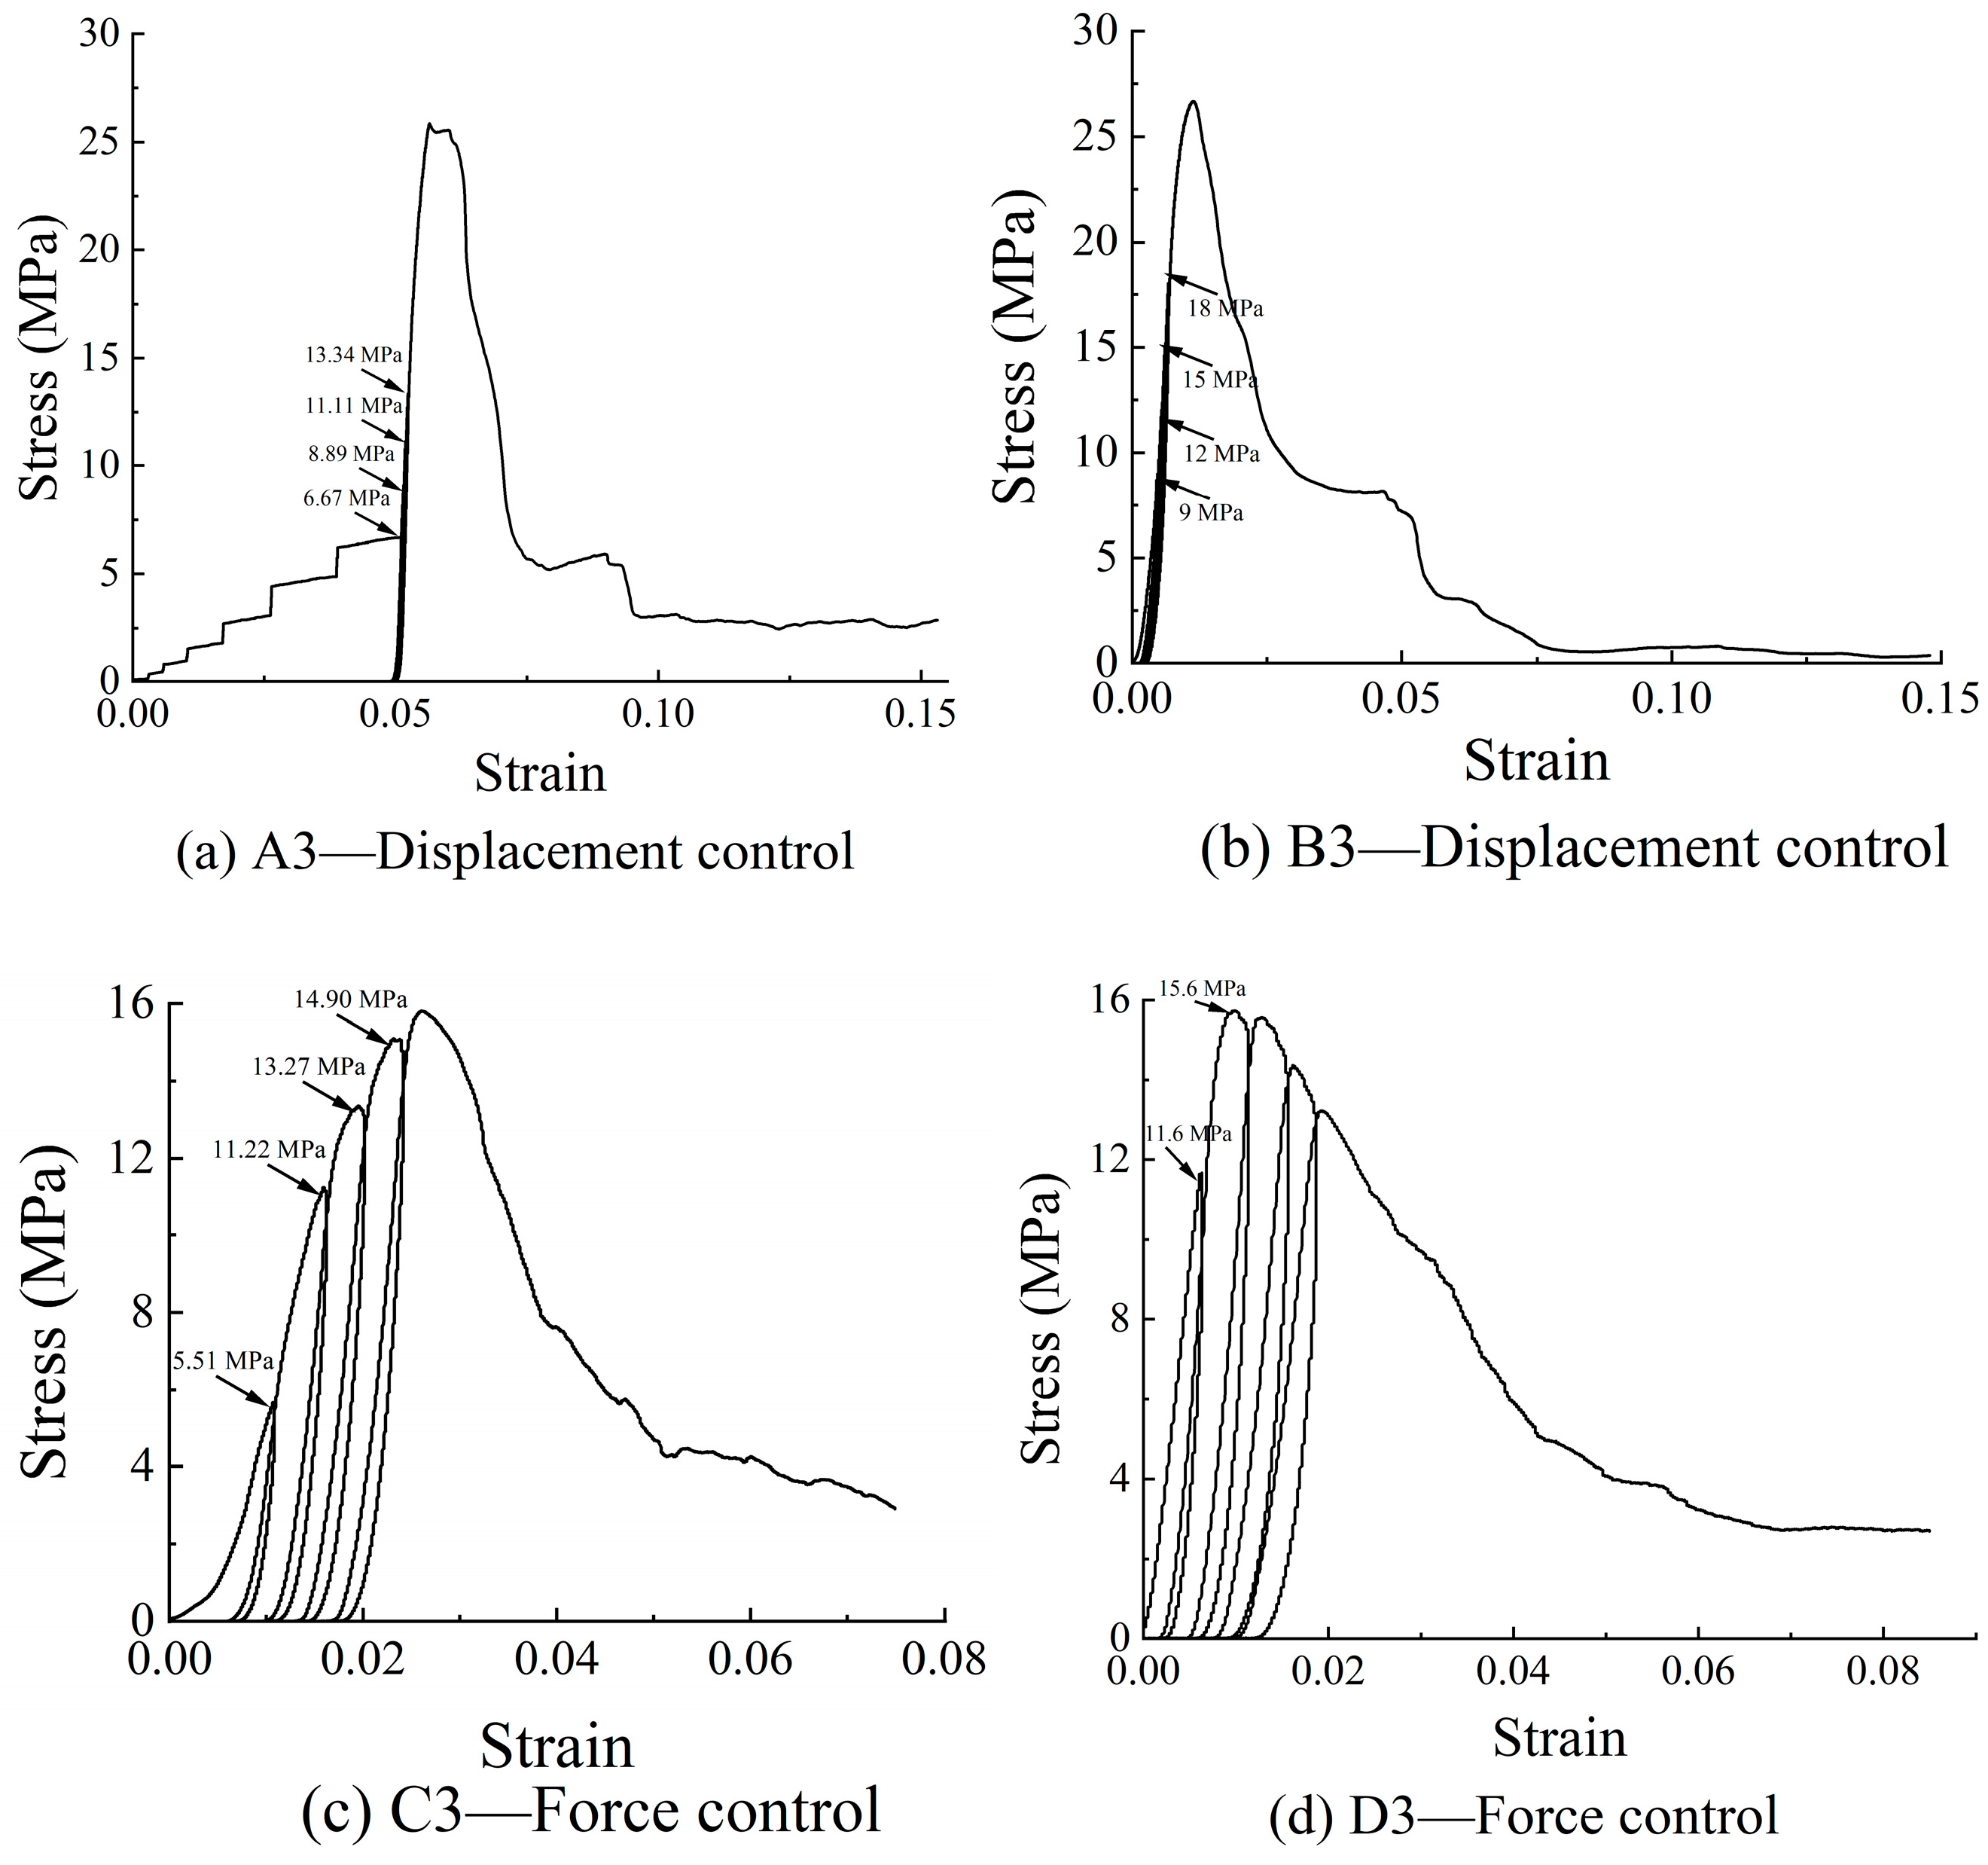
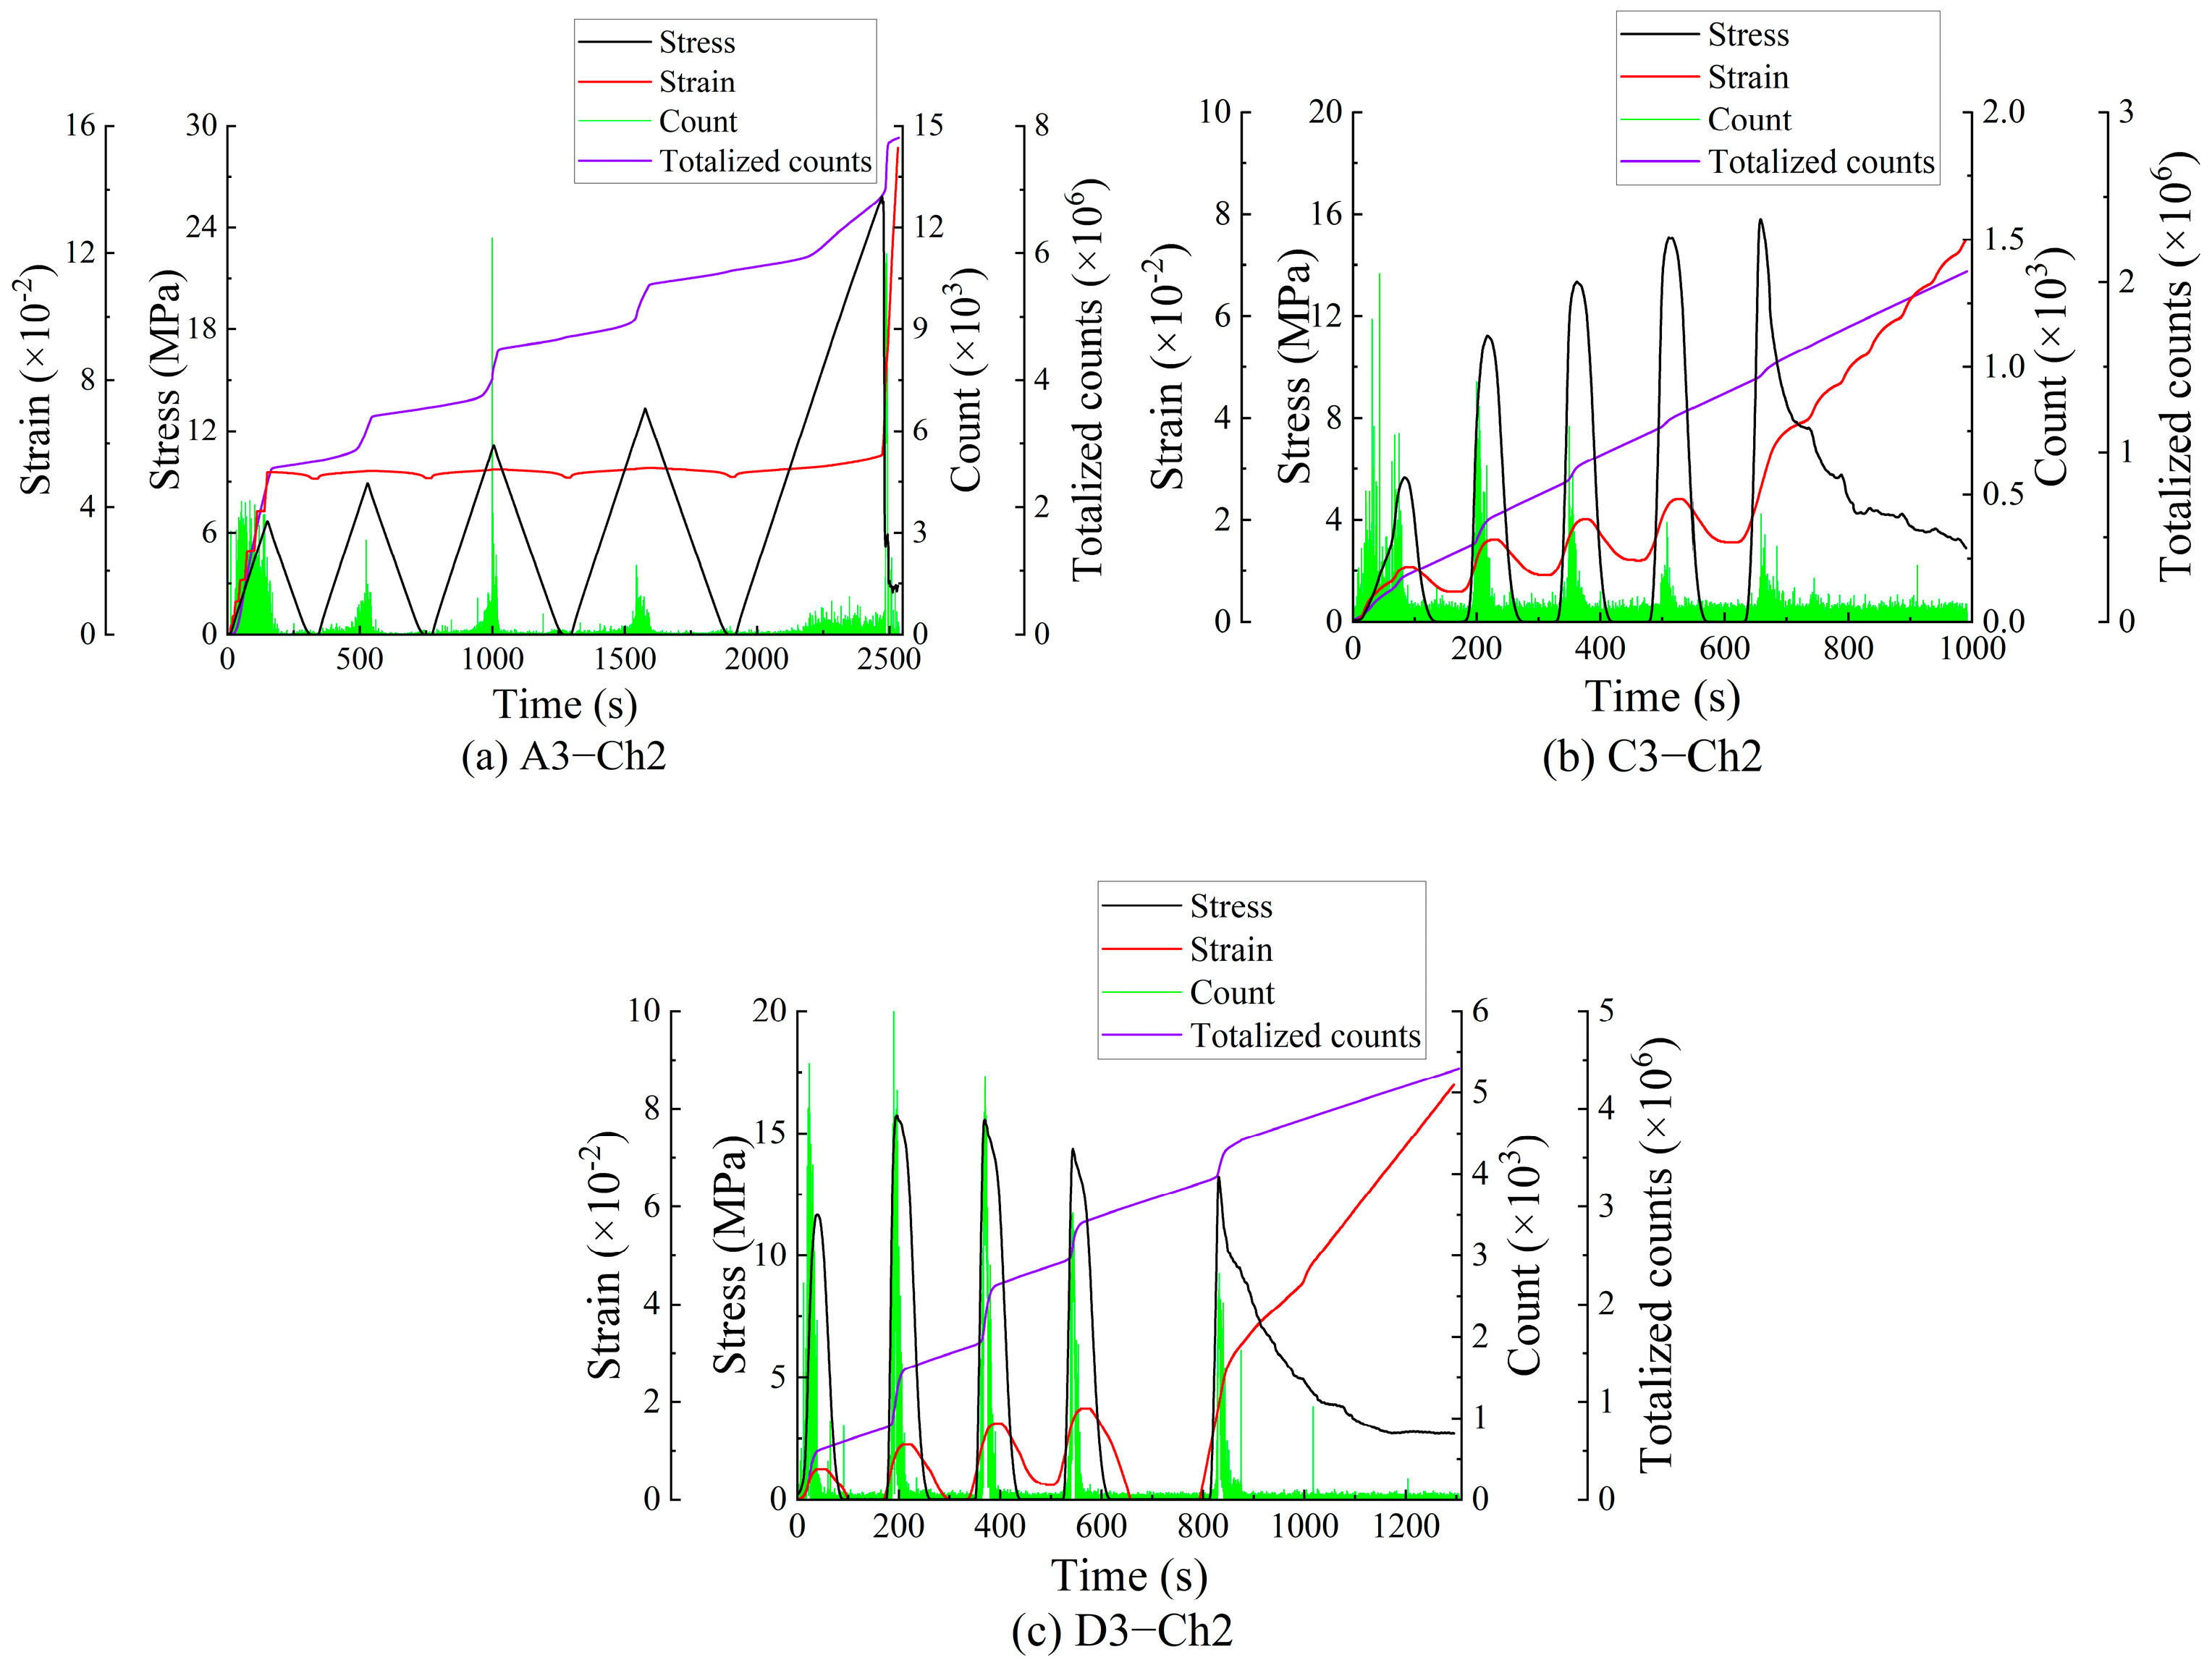
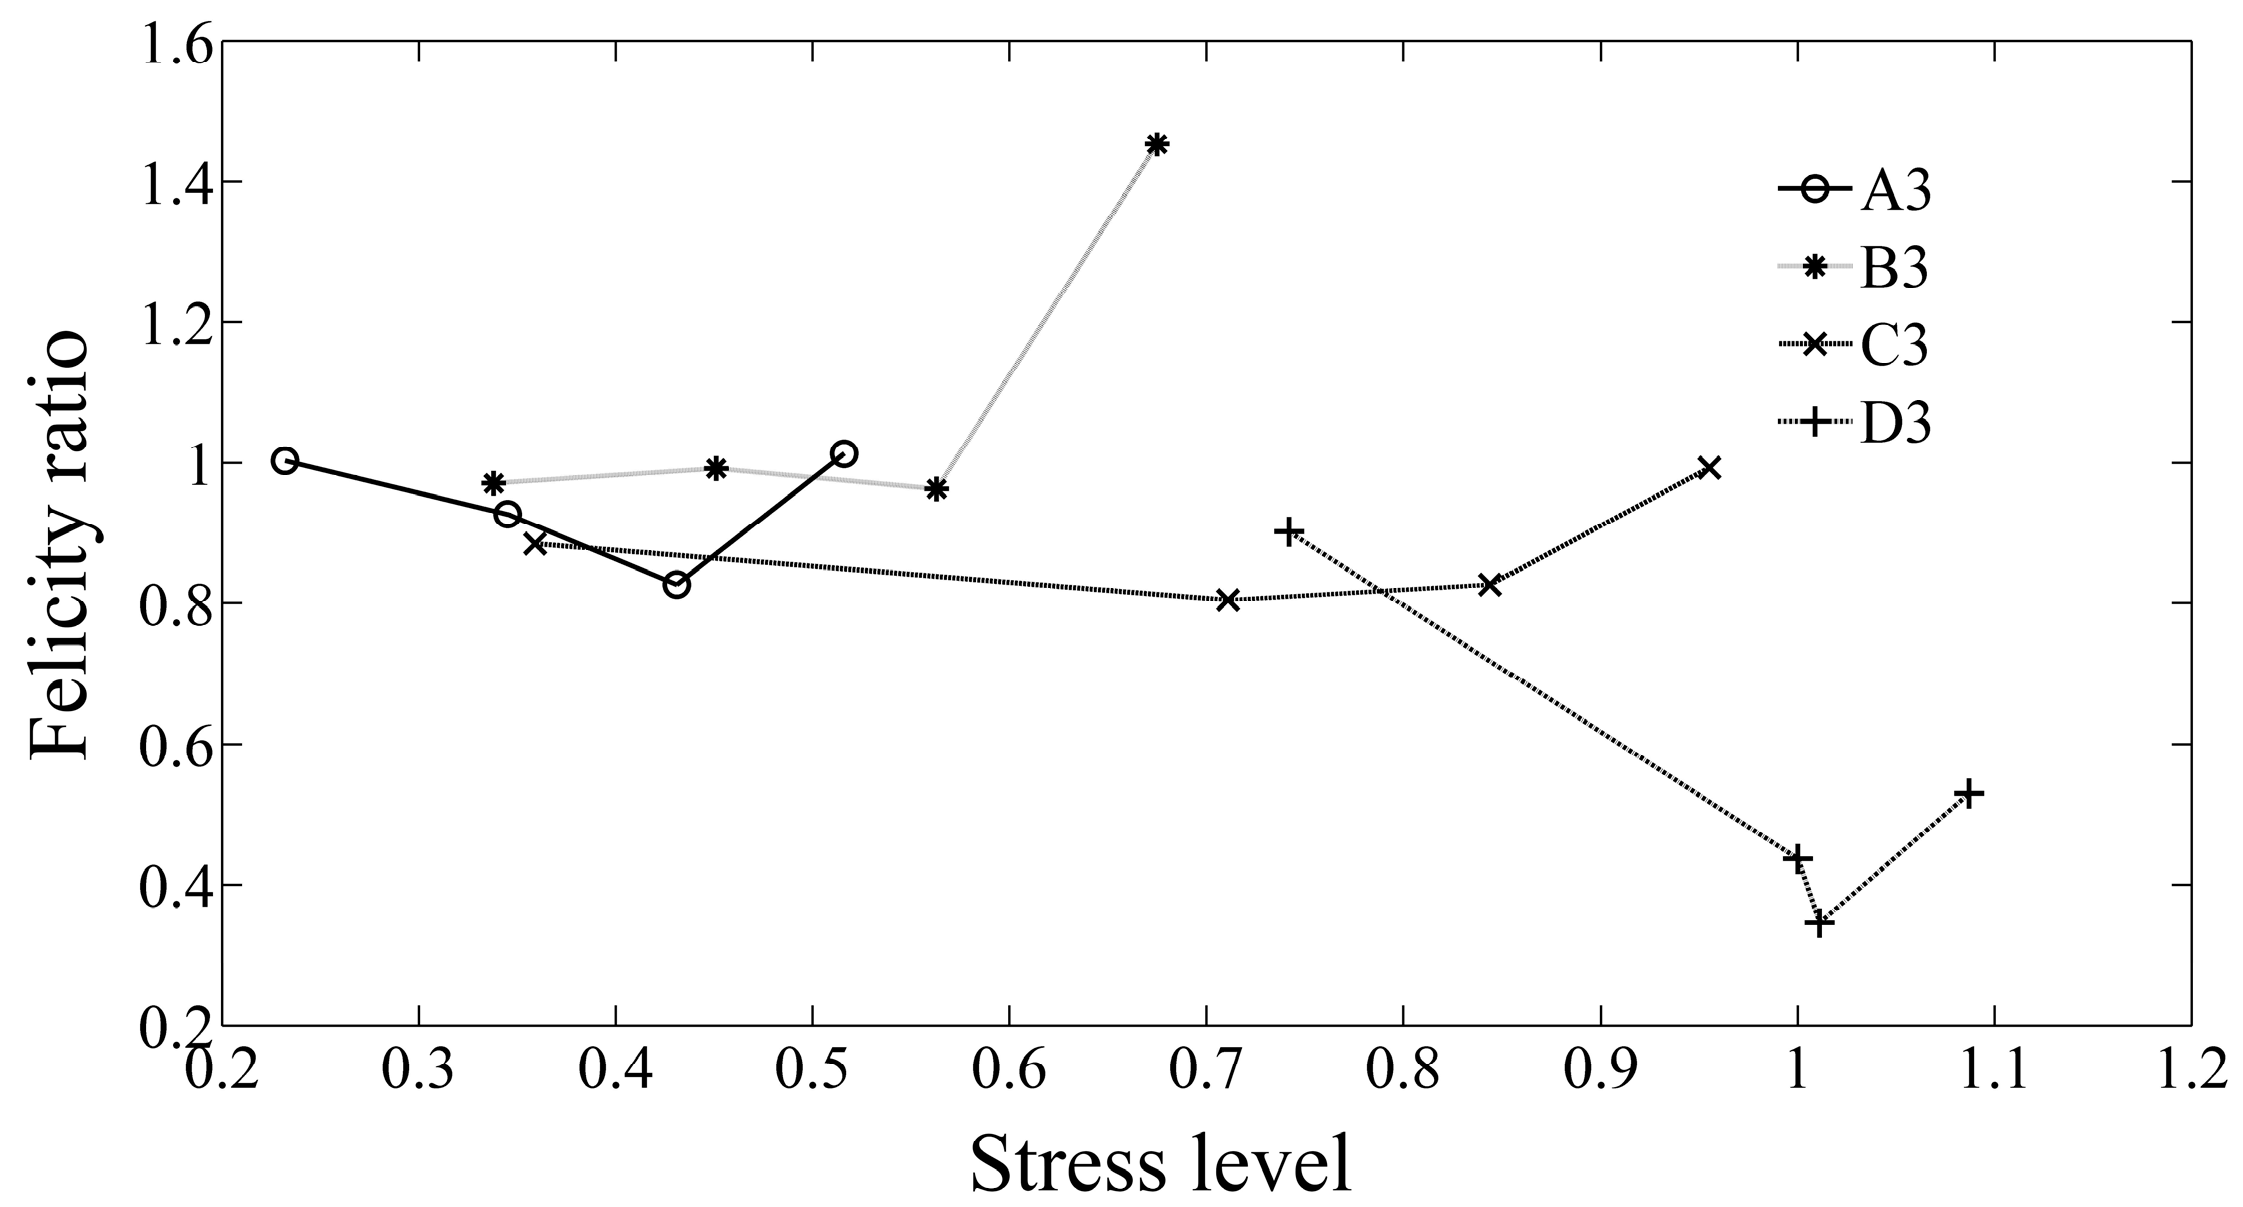
3.2.2. Acoustic Emission Characteristics of Specimen under Cyclic Loading

The acoustic emission characteristics of the samples under cyclic loading are shown in Figure 9. It can be seen from the diagram that the peak stress of A3 and C3 samples during the five cycles increases, the acoustic emission signal is strong in each cycle of loading stage, and the acoustic emission signal is weak in the unloading stage. The peak stress of D3 sample in the five cycle stages increases first, and then decreases gradually after reaching the compressive strength.
The Felicity ratio of acoustic emission refers to the ratio of the stress corresponding to the strong signal of acoustic emission to the maximum stress previously carried. The Felicity ratio can measure the Kaiser effect or Felicity effect of the acoustic emission signal. It is generally believed that the Kaiser effect is effective when the Felicity ratio is greater than or equal to 0.90 [24].
The theoretical peak stress in each loading cycle in the cyclic loading process was determined in the experimental scheme in Table 2. According to the experimental results, the numerical value of the peak stress in this experiment can be obtained. The failure strength at this time refers to the peak stress in each cyclic loading process. The ratio of this stress to the peak stress at the final failure of the specimen is the stress level under cyclic loading. A stress level greater than 1 indicates the post-peak stage—for instance, a stress level of 1.1 rep-resents the post-peak 0.9 times the stress peak. The general law of sample fracture characteristics is obtained, which provides a theoretical basis for the analysis of large-scale coal rock dynamic disasters.
From Figure 10, it can be seen that the Felicity ratio changes with the increase in stress level during the whole loading and unloading cycle, showing a trend of first decreasing and then increasing. Before reaching the 43.1% stress level, the Felicity ratio of A3 decreases with the increase in stress level, indicating that in the adjacent two cycles, the stress level of the latter obviously decreases and the occurrence time is relatively advanced. The Kaiser effect failed at a low value of 0.827 at about a 43.1% stress level, and then with the increase in stress level, the irreversible damage caused by plastic deformation increased, the stress level of obvious AE lagged slightly and the Felicity ratio increased.

3.3. Study on Failure Electromagnetic Radiation Characteristics of Samples

The electromagnetic radiation phenomenon in coal mine sites is the electromagnetic wave radiating outward in the process of coal and rock mining failure. A large number of experiments and theoretical studies have proven that the strength and pulse number of EMR generated by rock fracturing are mainly related to the stress and failure state of the rock [8,25]. Electromagnetic radiation intensity is the radiation energy of an electromagnetic wave passing through the unit vertical area in a unit time—that is, the electromagnetic amplitude generated when coal and rock materials are damaged. Electromagnetic radiation pulse number refers to the number of electromagnetic waves whose electromagnetic radiation signal strength exceeds the threshold value in the unit time. The electromagnetic radiation intensity and pulse number in the electromagnetic radiation monitoring information reflect the loading degree and micro-fracture frequency, respectively. The micro-fracture frequency is directly related to the stress level.
Figure 11 and Figure 12 show the response laws of damage–failure electromagnetic radiation under uniaxial loading and cyclic loading, respectively. It can be seen from Figure 11 that the electromagnetic radiation intensity in the pre-peak stage is generally stronger than that in the post-peak stage. With the increase in stress, the electromagnetic radiation count in the pre-peak stage showed an overall increasing trend, and reached the maximum value at a certain stress level before the stress peak. After that, the electromagnetic radiation of some samples showed a decreasing trend—that is, the phenomenon of a quiet period. After the stress peak, the electromagnetic radiation was at a low level and the change was relatively stable.
It can be seen from the figure that with the increase in specimen size, the difference between the electromagnetic radiation response before and after specimen rupture becomes smaller and smaller. After the fracture of the D1 sample, the electromagnetic radiation signal decreased rapidly and maintained a small value. The electromagnetic radiation signal of the B1 specimen after fracture fluctuates greatly, and also generates a strong electromagnetic radiation signal in the stress recovery section. The change degree of A2 sample before and after fracturing was smaller, and the electromagnetic radiation signals increased further.
It can be seen from Figure 12 that in the first cycle, the electromagnetic radiation activity is relatively strong, and the subsequent electromagnetic radiation activity is weakened. This may be because the initial damage to the concrete material is not obvious, which causes the damage and failure to appear more obvious in the first loading and unloading cycle stage, and then a strong electromagnetic signal is produced. The Kaiser effect of electromagnetic radiation is not obvious during the loading and fracture of the specimen. During the loading and unloading transition, there are also more electromagnetic radiation signals.
Figure 13 shows the curves of cumulative EMR count versus stress level during loading, unloading and loading–unloading cycles. During the loading, unloading and loading–unloading cycles, the changes in the cumulative EMR count show some similarities. When the stress level is low, the cumulative EMR counts of loading and unloading are higher. With the increase in stress level, the cumulative EMR count decreased slightly, and then increased with the increase in stress level.

4. Geophysical Response Law of Mine Rockburst

Coal and rock mass are easily affected by the disturbance effect in the mining process. Instability failure occurs under dynamic and static loads, which induces rockburst. Microseismic signals, electromagnetic radiation, stress, etc., can enable the monitoring and provision of early warnings for mine earthquakes or rockbursts. It is of great engineering significance to analyze and study the geophysical response law in the preparation process of rockbursts for the monitoring and prediction of coal and rock dynamic disasters.

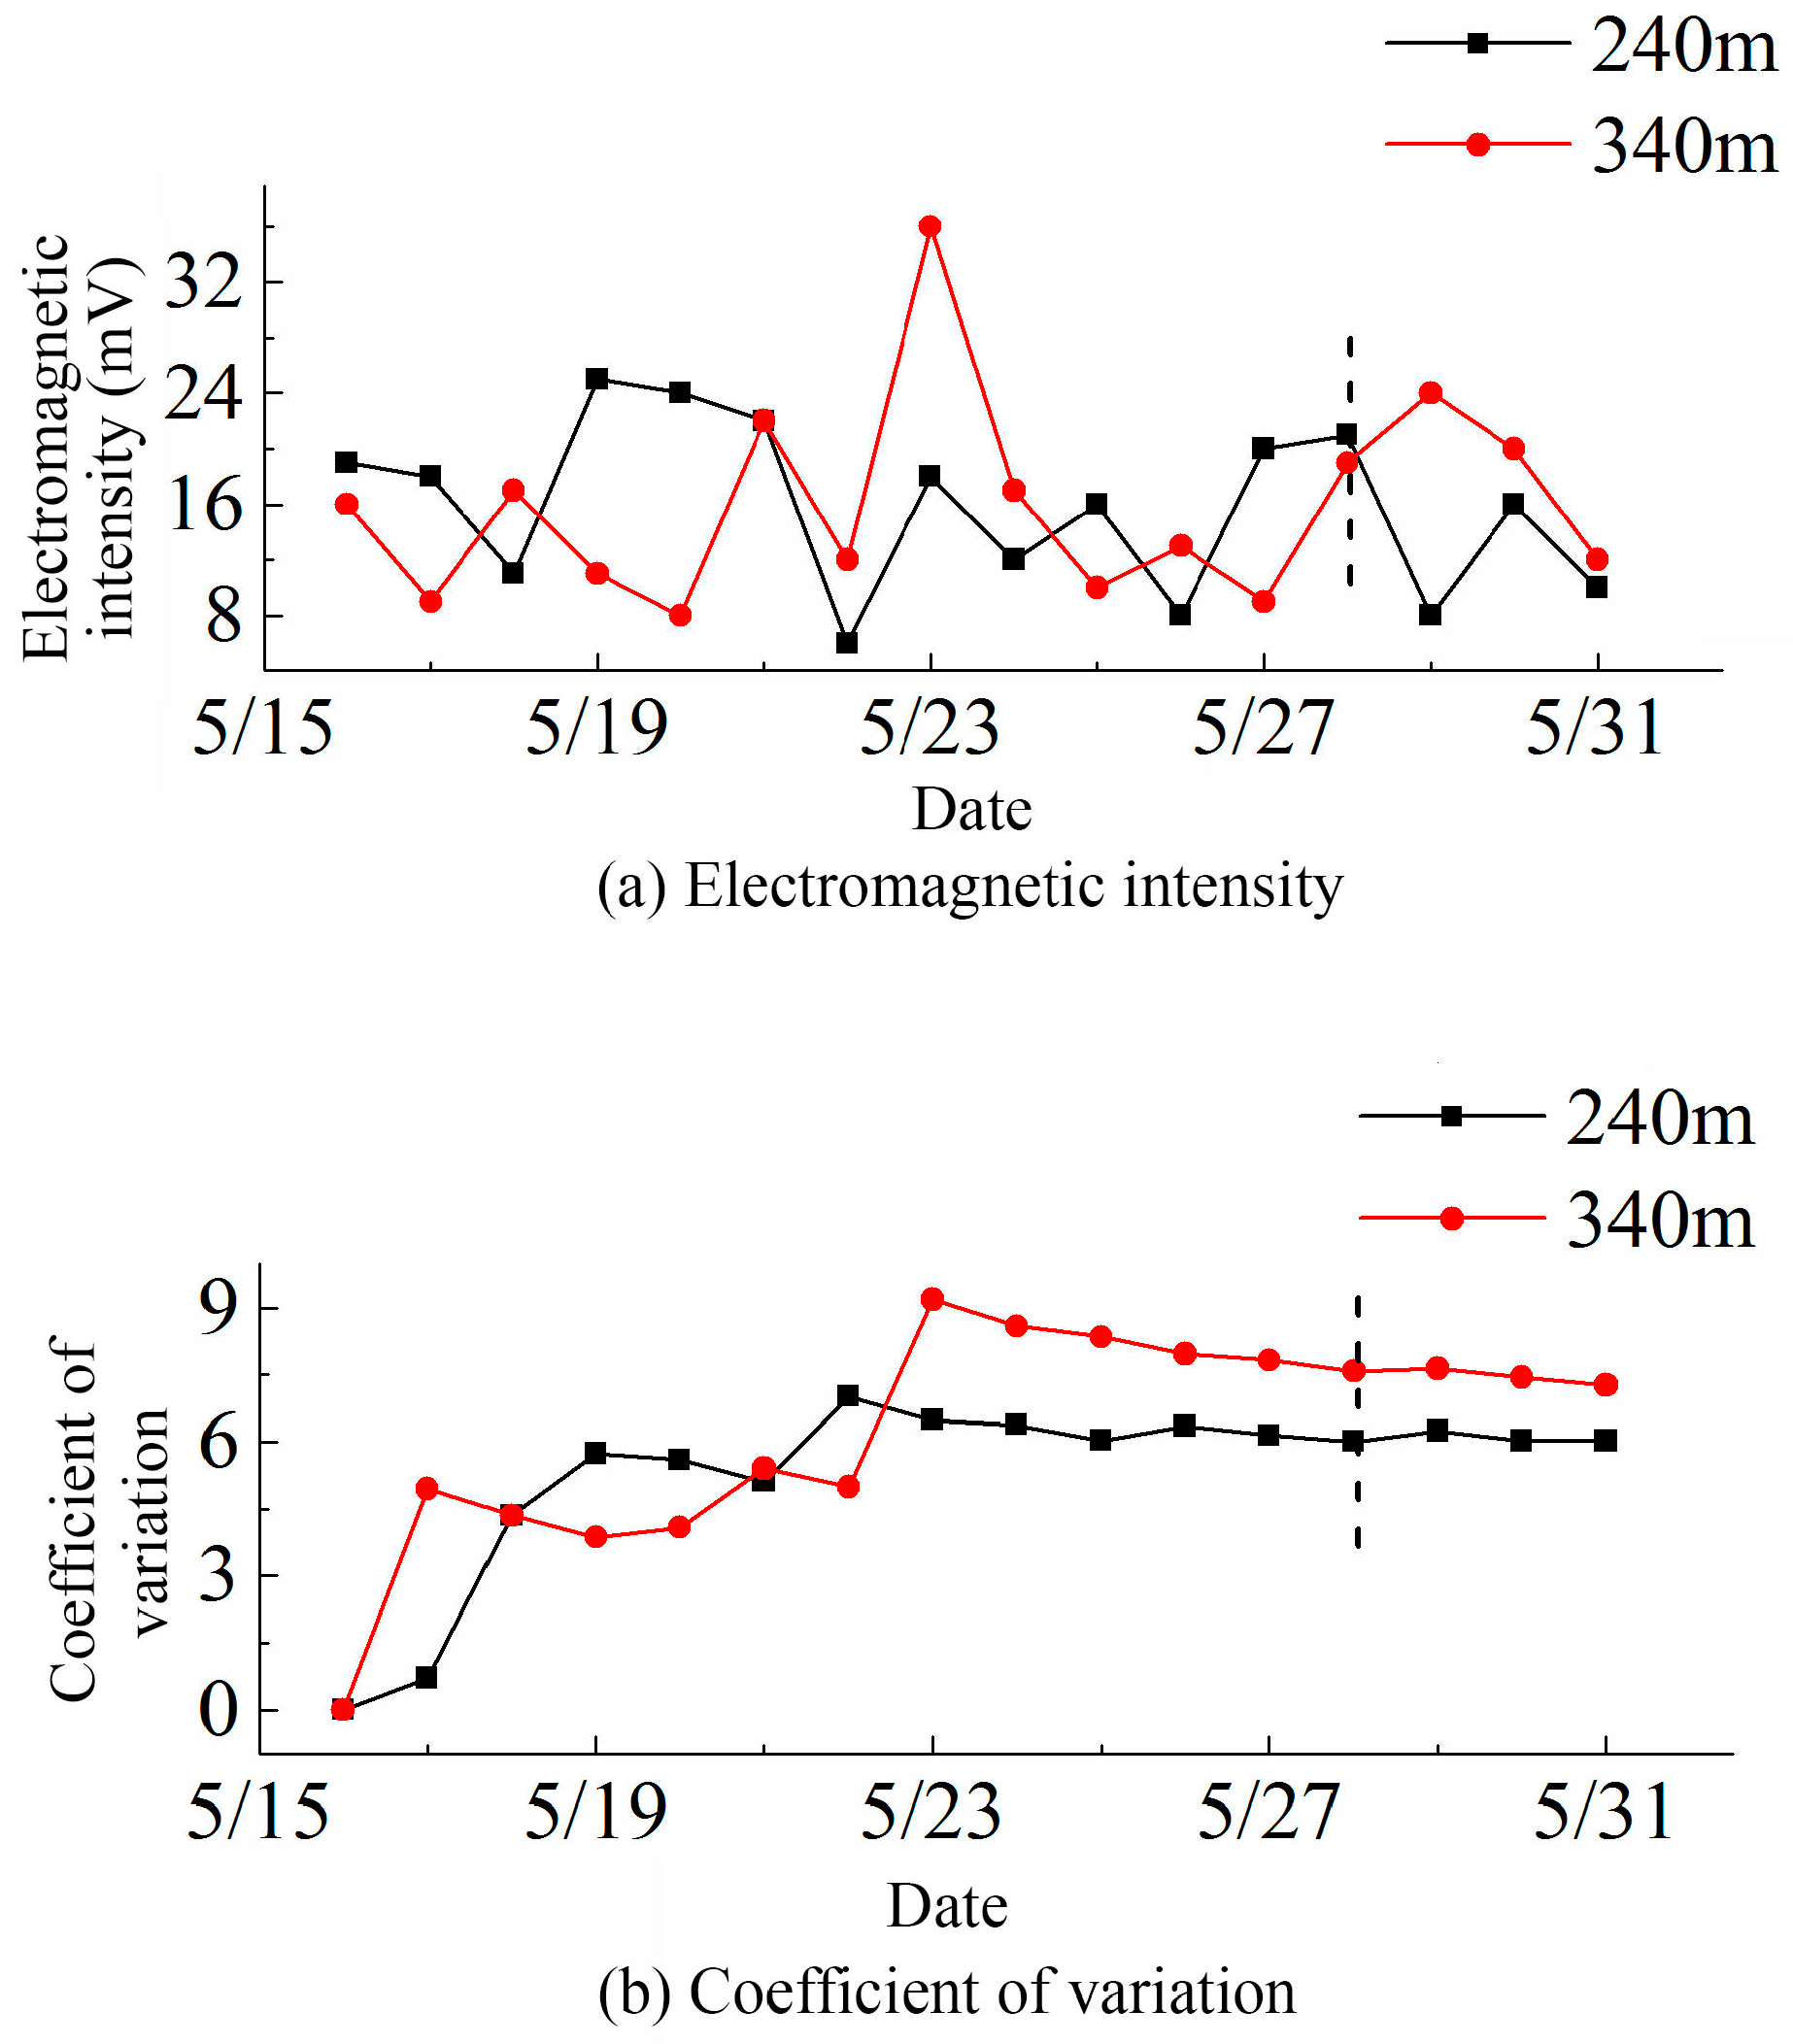
4.1. Electromagnetic Radiation Response Law of Rockburst

The research shows that the electromagnetic radiation intensity in the coal body in the front of the mining work is consistent with the distribution of the pressure relief zone, pressurization zone and pressure stabilizing zone. Therefore, it is feasible to predict rockburst and other disasters using electromagnetic radiation [26].
Figure 14 is the working face layout of Qianqiu Mine. The portable electromagnetic radiation monitor (KBD5) and online electromagnetic radiation monitoring system (KBD7) were used to monitor rockbursts. The electromagnetic radiation monitoring system is shown in Figure 15.
The 21,141 working face of Qianqiu Coal Mine experienced a rockburst. The KBD5 portable electromagnetic radiation response law is shown in Figure 16. In the figure, 240 m and 340 m represent the distance between the test site and the gateway, respectively. It can be seen from Figure 16 that the electromagnetic strength suddenly increases twice in the week before the shock, after which there is a minimum value, and then there is a relatively stable state until the day before the shock, when it suddenly increases. The coefficient of variation of electromagnetic intensity will increase significantly before impact, and then decrease continuously, and the change is relatively stable. (In statistics, the coefficient of variation is used to describe the dispersion of data distribution. The greater the coefficient of variation of intensity and pulse, the greater the dispersion of intensity and pulse number distribution, respectively.)
Similarly, the online electromagnetic radiation (KBD7) monitoring system was used to monitor the M1.8 rockburst event in the 21,141 lower roadway of Qianqiu Coal Mine. The acoustic emission response characteristics obtained from the test are shown in Figure 17.
As can be seen from Figure 17, before the occurrence of the rockburst, the electromagnetic radiation intensity and pulse mean value increased significantly, to several times the values for the normal state. The coefficient of variation of the electromagnetic radiation pulse also increased significantly before the shock, indicating the increase in shock risk.

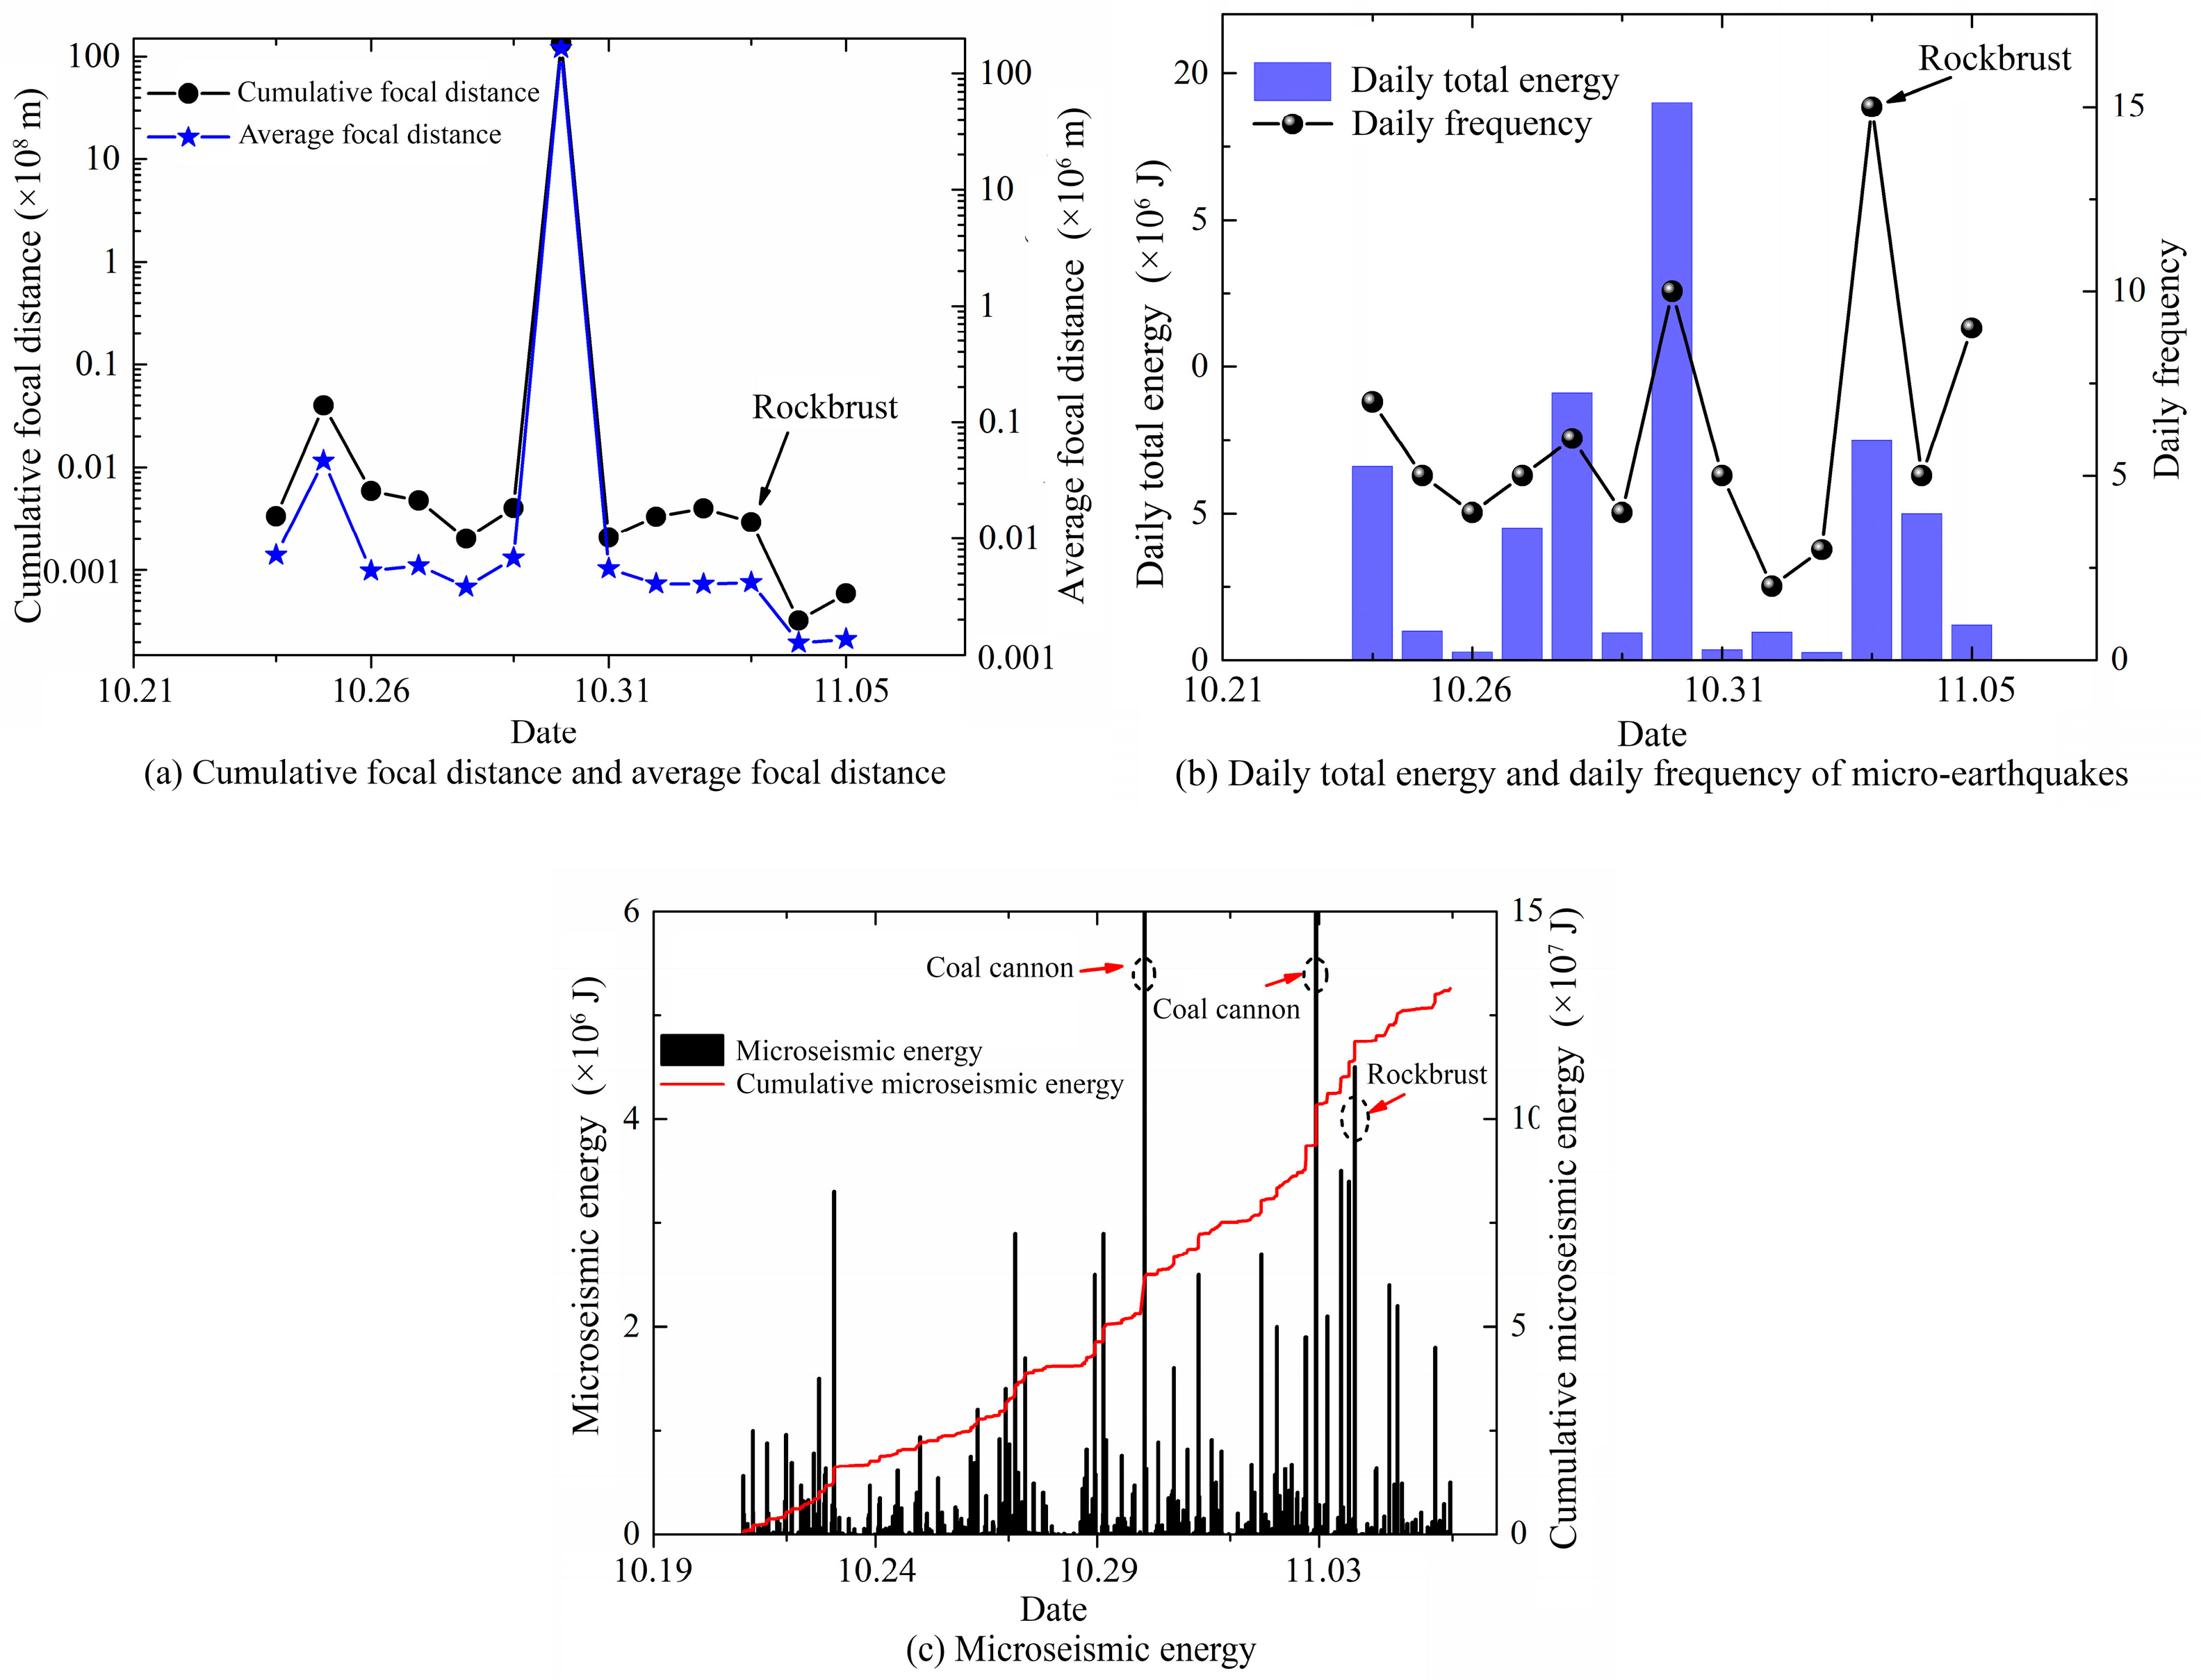
4.2. Microseismic Response Law of Rock Burst

Due to the inelastic deformation, the elastic energy stored in the deformation process of coal and rock mass propagates outward in the form of a low-frequency vibration wave, resulting in a microseismic signal. The ARAMIS microseismic monitoring system is arranged in the coal mine site to realize the real-time monitoring and analysis of the source space–time and energy evolution of mine rockburst.
The place where rock rupture causes vibration is called the source. It is a region with a certain size, also known as the source area or source body, where seismic energy accumulation and release occur. The “average hypocentral distance”, l, is defined as the average distance between any two microseismic hypocentral points in a certain period of time, which indicates the concentration of hypocentral points in a certain period of time—that is, the intensity of coal and rock fracture activity. The expression for this is shown in Equation (1). Wu Jianbo [27] et al. used the logistic regression method to establish an early warning model of rockburst including the average hypocentral distance, daily total energy and daily frequency of microseismic events, which can predict the risk of rockburst. The daily energy and average hypocentral distance of microseismic events are important indicators of rockburst.
l = L C n 2 = 2 i = 1 n j = i + 1 n ( x i x j ) 2 + ( y i y j ) 2 + ( z i z j ) 2 n ( n 1 )
In the formula, L denotes the cumulative hypocentral distance and n denotes the number of spatial positioning points.
The rockburst event occurred in the lower lane of the 21,221 work face; Figure 18 presents the corresponding microseismic hypocentral distance and microseismic daily energy frequency (microseismic events occur every day.). It can be seen from Figure 18 that the cumulative and average hypocentral distances have the maximum values before the occurrence of the rockburst, and then the cumulative hypocentral distance shows a slow upward trend, while the average hypocentral distance shows a downward trend. Statistical analysis shows that the proportion of abnormal hypocentral distance before rock burst occurrence is 53.8%, which can be used as a precursory characteristic signal of the hypocentral distance of rockbursts.
The total daily energy (cumulative value of microseismic energy monitored per day) and daily frequency (number of microseismic events per day) of microseismicity experienced a continuous upward trend before the rockburst, and then entered into a quiet period of microseismicity, which increased rapidly when the rockburst occurred. The microseismic energy (under the disturbance of underground coal and rock excavation, the rupture or development of stress redistribution will occur, along with the sudden release of strain energy in the form of an elastic wave) shows an increasing trend as a whole, and shows a periodic increasing trend in the local range, indicating that the internal damage deformation and abutment pressure of the surrounding rock show periodic changes in the compression process.

5. Conclusions

Based on laboratory tests and field data processing, we studied the acoustic emission and electromagnetic radiation response law of multi-scale concrete material instability and fracture, revealing the response law of microseismic and electromagnetic radiation before and after a rockburst on the basis of analyzing the characteristics of a rockburst disaster in Qianqiu Mine. The following research results were obtained.
(1)
Under uniaxial loading, the stress–deformation curves of the specimen have a compaction stage, linear elastic stage, elastic–plastic stage and failure stage.
(2)
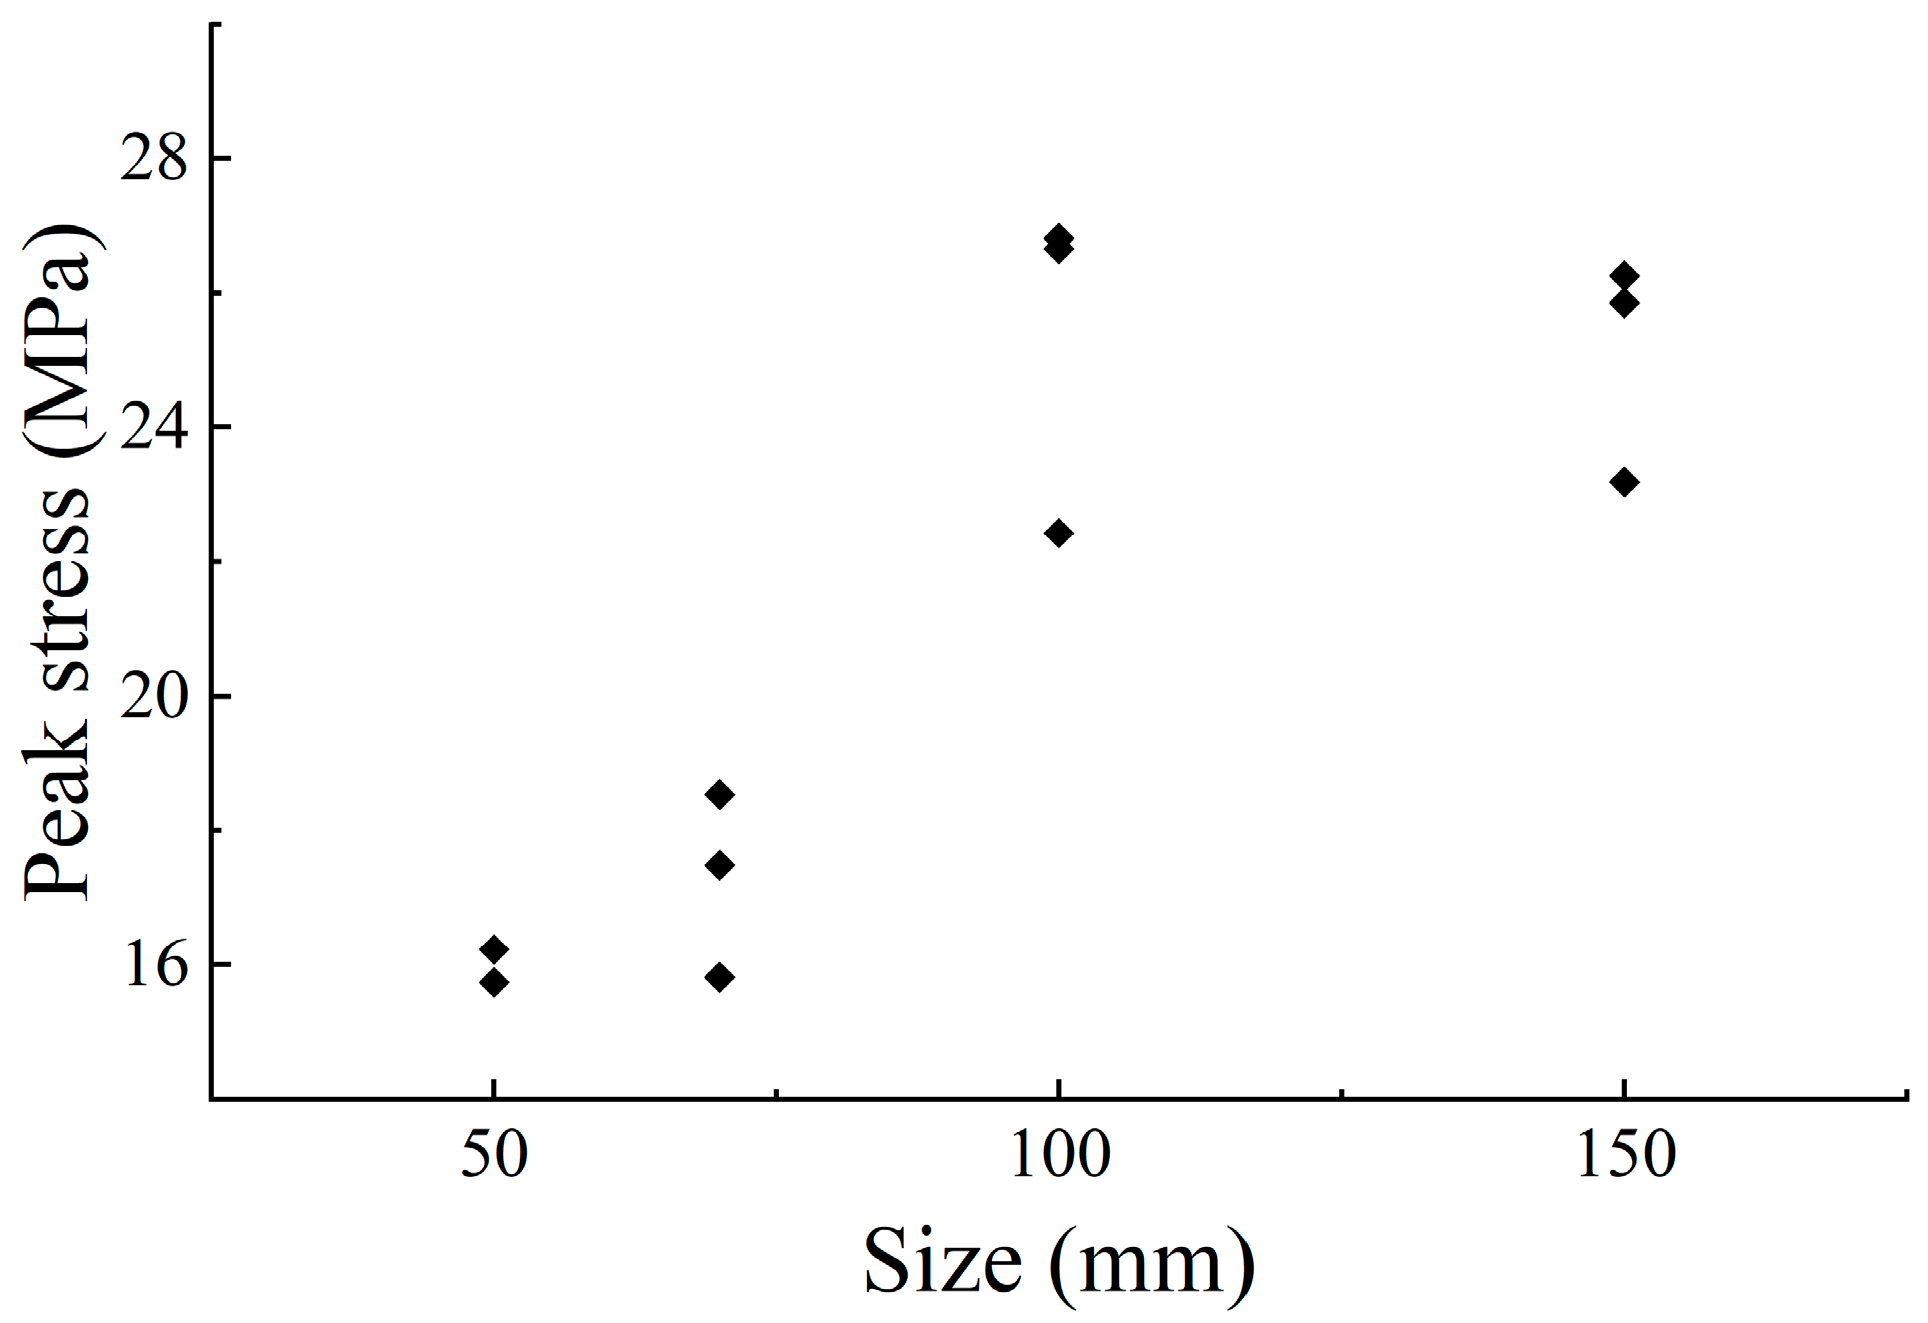
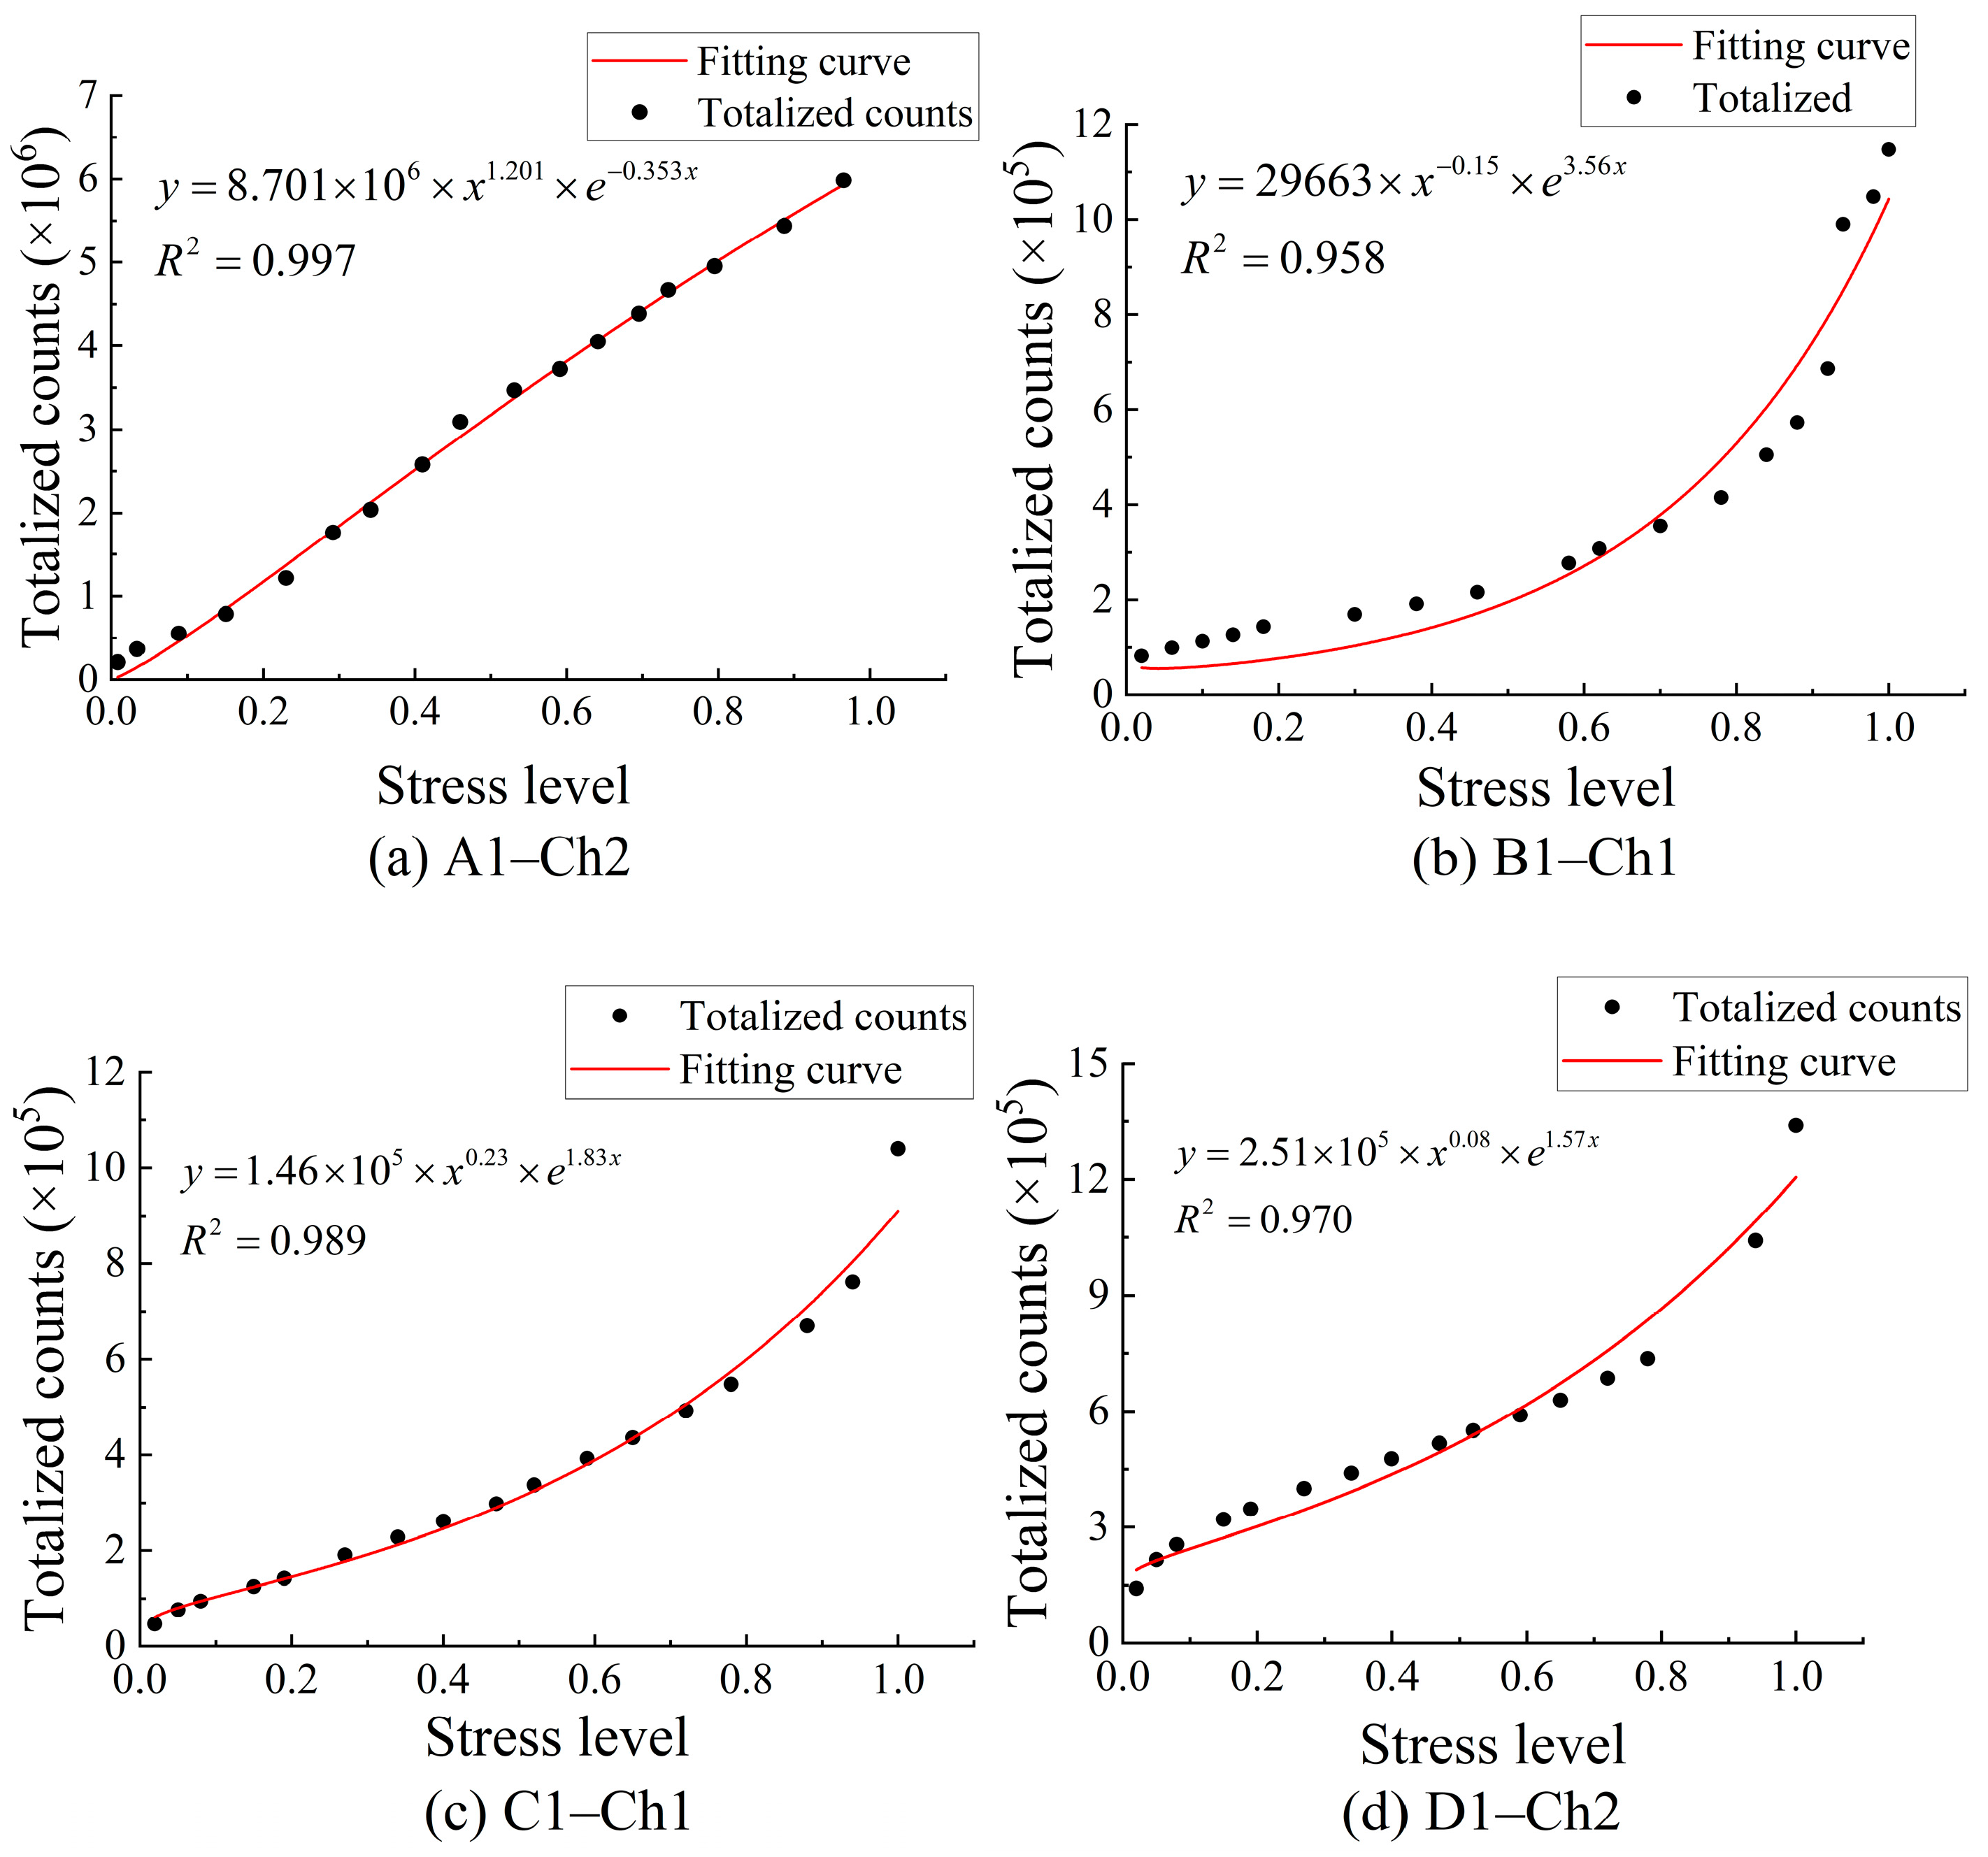
When the sample size is small, the peak stress increases with the increase in size. When the sample size reaches 100 mm, the trend tends to converge. The AE–EMR characteristics of samples with different sizes show different variation characteristics. There is a nonlinear relationship between the cumulative acoustic emission value and the sample size. The cumulative acoustic emission count generated by the failure of the sample increases nonlinearly with the increase in the size.
(3)
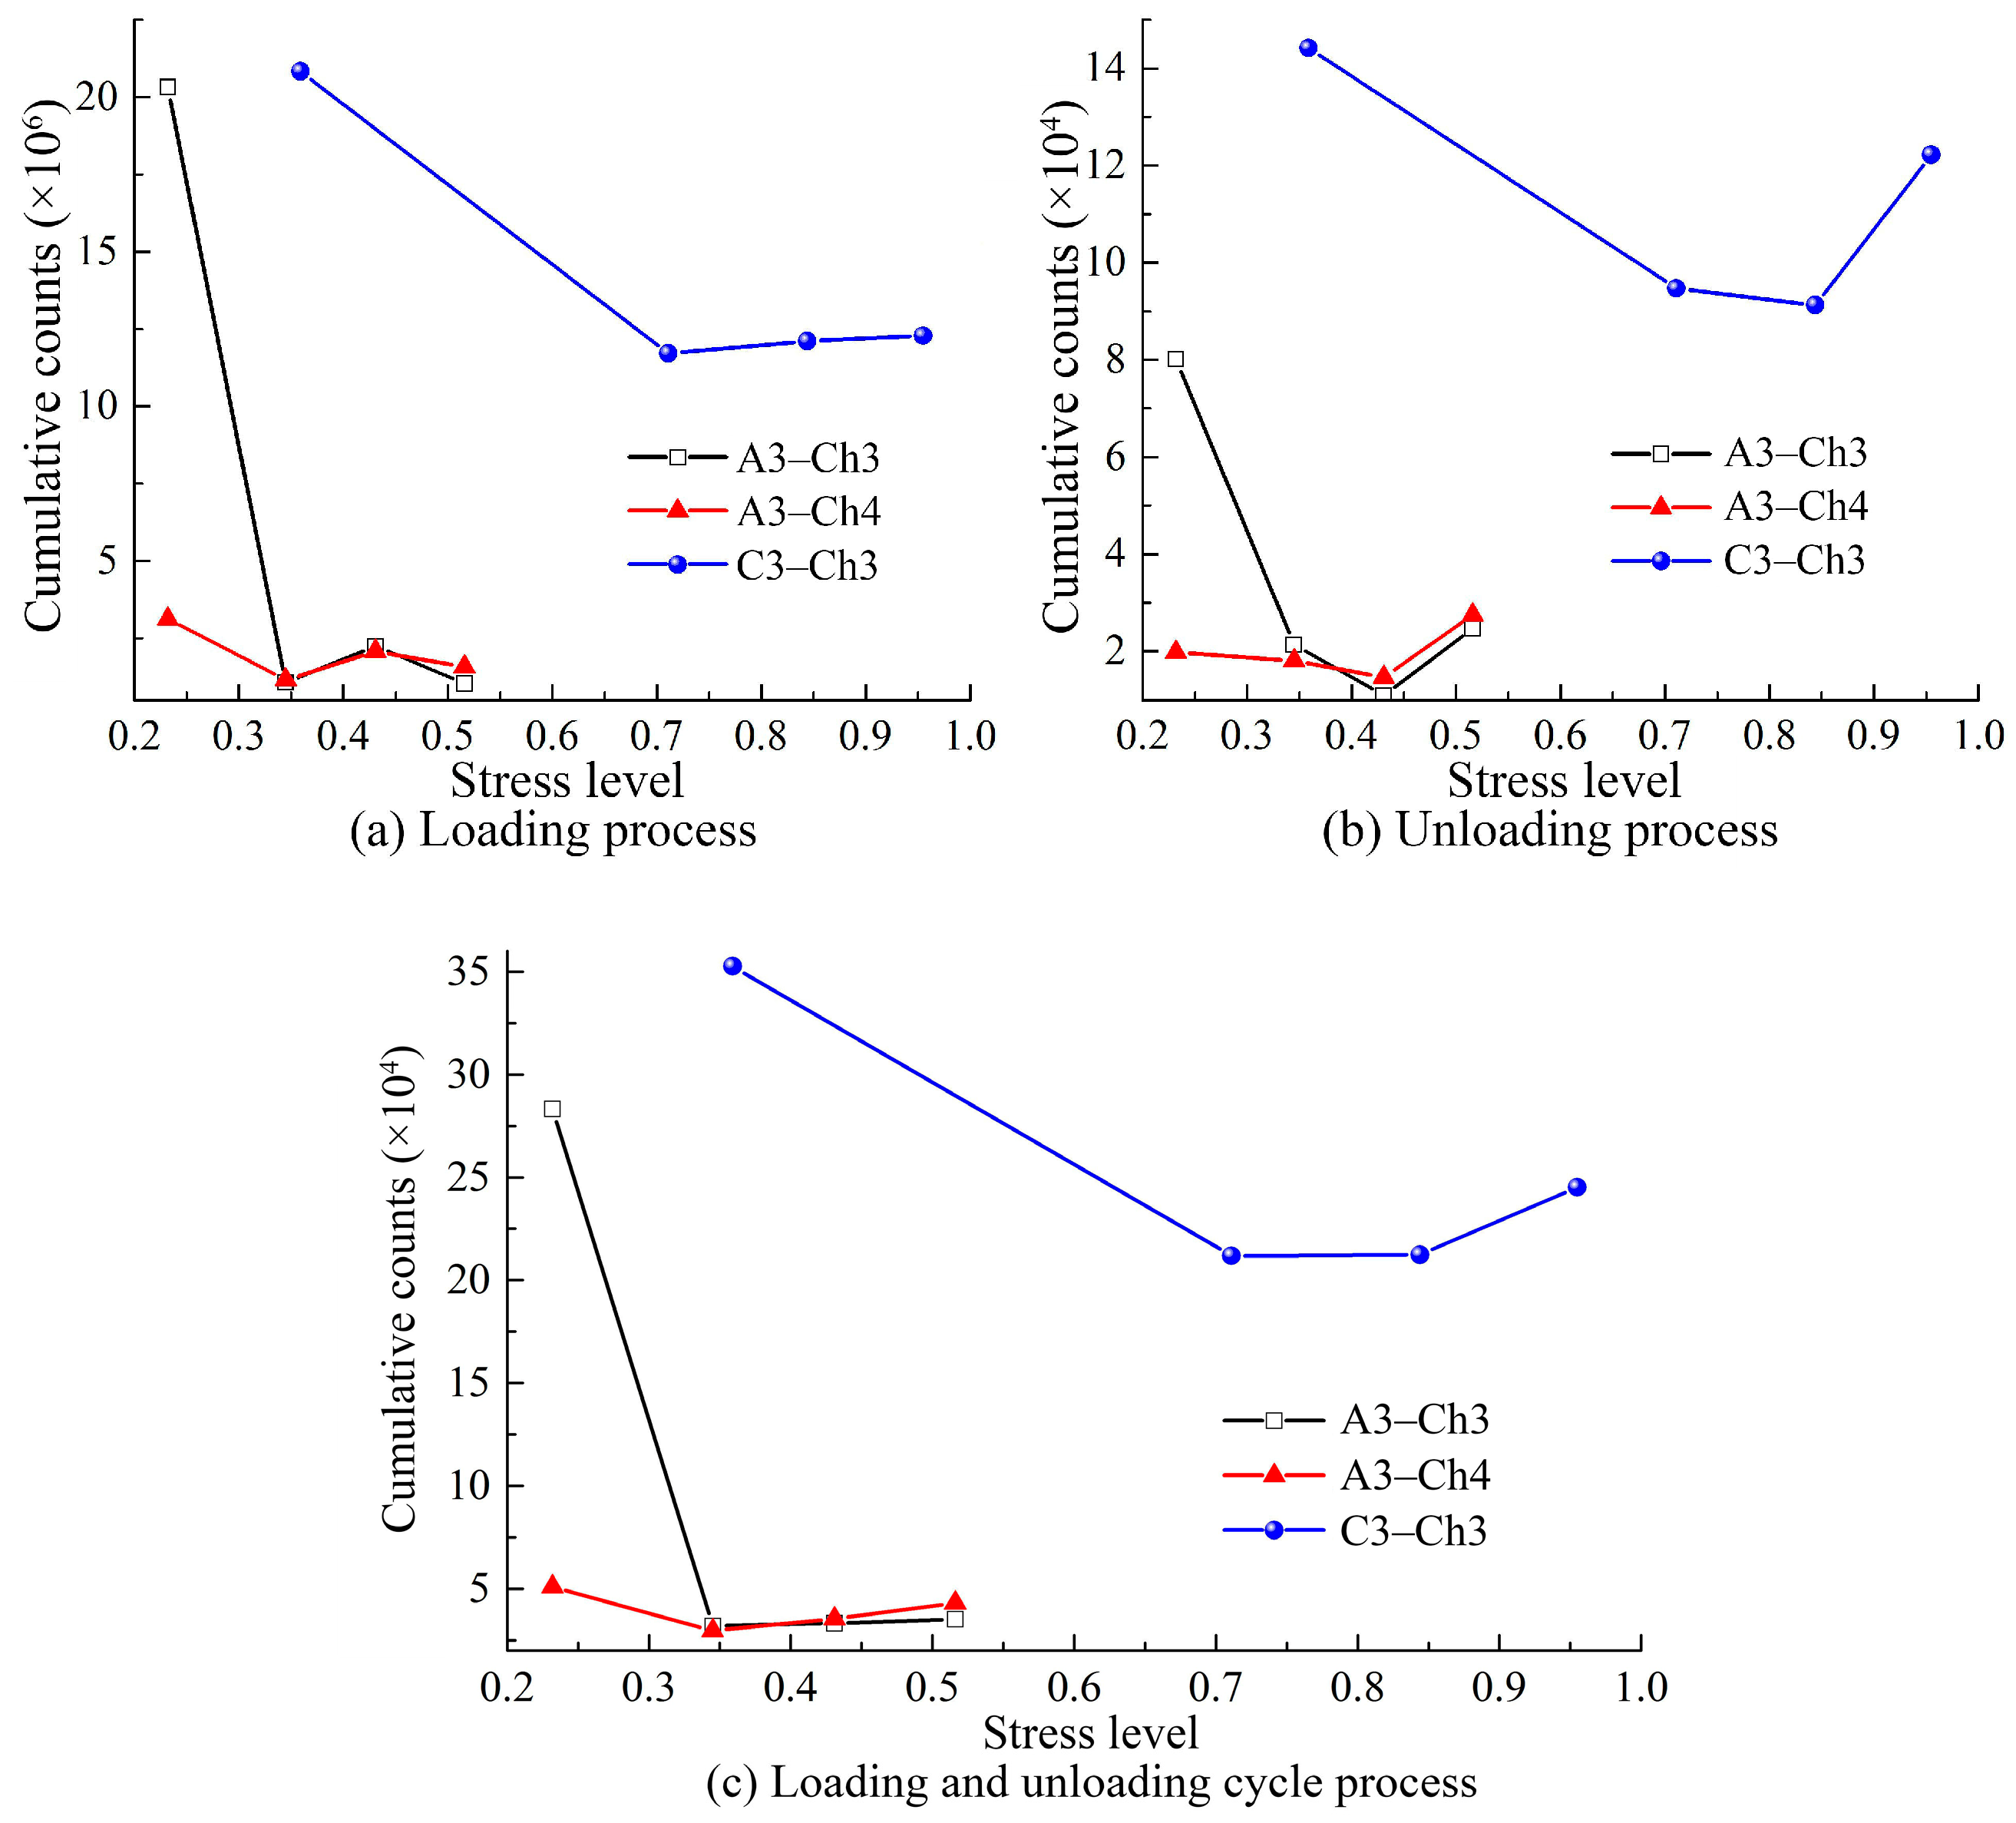
The cumulative AE counts, AE energy and stress level of the specimen during loading compression have an exponential relationship. Under cyclic loading, the Felicity ratio of acoustic emission decreases first and then increases with the increase in stress level. When the stress level is low, the cumulative EMR counts of loading and unloading are high. With the increase in stress level, the cumulative EMR counts decrease slightly, and then increase slowly.
(4)
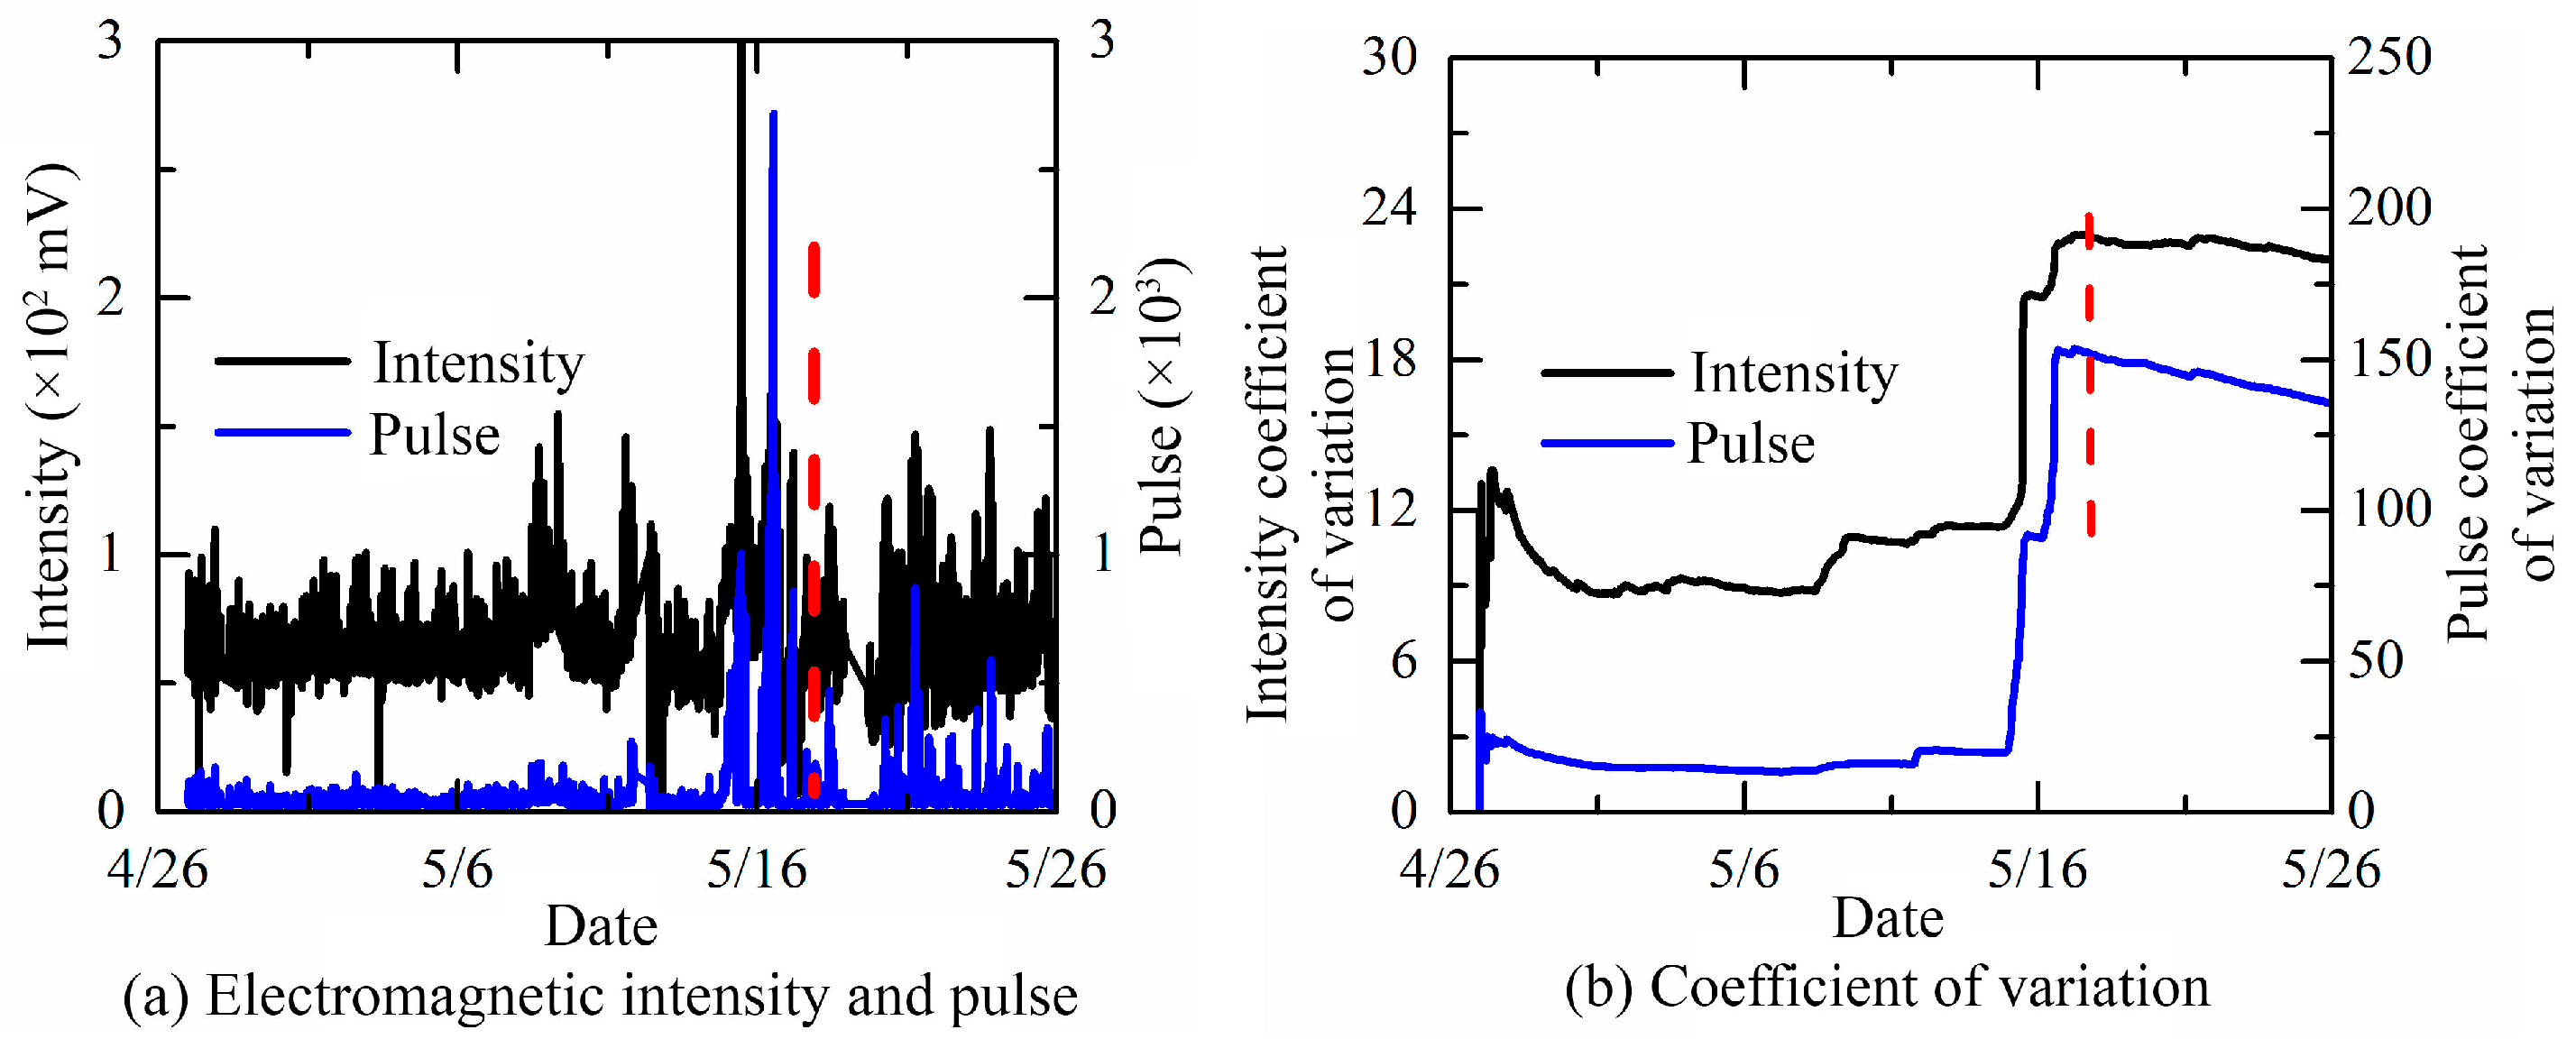
The electromagnetic radiation intensity shows a gentle trend in a period of time before the impact, and increases significantly when the impact occurs, indicating the increase in the impact risk. The microseismic hypocentral distance also shows an abnormal change trend when rock burst occurs. Therefore, this acoustic–electric anomaly can be used as a geodynamic precursor characteristic signal for rock burst monitoring and providing early warnings.

Author Contributions

Z.L.: Conceptualization, funding acquisition, writing—original draft. Y.L.: Writing—original draft, data curation. E.W.: Conceptualization, funding acquisition, writing—review and editing. V.F.: Formal analysis, writing—review and editing. D.L.: Investigation. X.L.: Investigation. X.R.: Data curation. All authors have read and agreed to the published version of the manuscript.

Funding

This work was supported by the National Natural Science Foundation of China (52074280), Key Projects of National Natural Science Foundation of China (51934007), Major Scientific and Technological Innovation Projects in Shandong Province (2019JZZY020505) and Development of Jiangsu Higher Education Institutions (PAPD).

Institutional Review Board Statement

Not applicable.

Informed Consent Statement

Not applicable.

Data Availability Statement

Not applicable.

Acknowledgments

The authors would like to thank the reviewers and editors who presented critical and constructive comments for the improvement of this paper.

Conflicts of Interest

The authors declare no conflict of interest.

References

  1. Ogawa, T.; Oike, K.; Miura, T. Electromagnetic radiations from rocks. J. Geophys. Res. Atmos. 1985, 90, 6245–6249. [Google Scholar] [CrossRef]
  2. Gokhberg, M.B.; Morgunov, V.A.; Pokhotelov, O.A.; Khabazin, Y.G. Statistical model of distributed emitters. Trans. (Dokl.) USSR Acad. Sci. Earth Sci. Sect. 1988, 302, 1–3. [Google Scholar]
  3. Rudajev, V.; Vilhelm, J.; Lokajíček, T. Laboratory studies of acoustic emission prior to uniaxial compressive rock failure. Int. J. Rock Mech. Min. Sci. 2000, 37, 699–704. [Google Scholar] [CrossRef]
  4. Frid, V.I.; Shabarov, A.N.; Proskuryakov, V.M.; Baranov, V.A. Formation of electromagnetic radiation in coal stratum. J. Min. Sci. 1992, 28, 139–145. [Google Scholar] [CrossRef]
  5. Wang, E.; He, X.; Liu, Z.; Li, Z. Study on frequency spectrum characteristics of acoustic emission in coal or rock deformation and fracture. J. China Coal Soc. 2004, 29, 4. [Google Scholar]
  6. Wang, E. The Effect of EMR&AE during the Fracture of Coal Containing Gas and Its Applications; China University of Mining and Technology: Xuzhou, China, 1997. [Google Scholar]
  7. Wang, E.; He, X.; Nie, B.; Liu, Z. Principle of predicting coal and gas outburst using electromagnetic emission. J. China Univ. Min. Technol. 2000, 29, 225–229. [Google Scholar]
  8. Xu, W.; Tong, W.; Wu, P. Experimental study of electromagnetic emission during rock fracture. Chin. J. Geophys. 1985, 28, 181–190. [Google Scholar]
  9. Dou, L.; Tian, J.; Lu, C.; Wu, X.; Mou, Z.; Zhang, X.; Li, Z. Research on electromagnetic radiation rules of composed coal-rock burst failure. Chin. J. Rock Mech. Eng. 2005, 24, 143–146. [Google Scholar]
  10. Lu, C.; Dou, L.; Wu, X. Experimental research on rules of rock burst tendency evolution and acoustic-electromagnetic effects of compound coal-rock samples. Chin. J. Rock Mech. Eng. 2007, 26, 2549–2555. [Google Scholar]
  11. Wang, G.; Pan, Y.; Li, Z.; Li, G.; Wu, D. Study on time-frequency characteristics of acoustic-charge signals in fractrure and crack evolution process of coal and rock. Coal Sci. Technol. 2018, 46, 90–98. [Google Scholar]
  12. Liu, Y.; Qiu, L.; Lou, Q.; Wei, M.; Yin, S.; Li, P.; Cheng, X. Research on time-frequency characteristics of acoustic-electric signals in process of rock failure under load. Ind. Mine Autom. 2020, 46, 87–91. [Google Scholar]
  13. Wang, E.; He, X.; Liu, Z.; Dou, L.; Nie, B.; Zhang, L.; Ma, S. Study on electromagnetic emission characteristics of loaded rock and its applications. Chin. J. Rock Mech. Eng. 2002, 21, 1473–1477. [Google Scholar]
  14. Carson, G.H.; Gravina, J.; Arnold, L.N. A Dual-Microseismic Monitor for Use in Gdssy Coal Mines. In Report NO.51 Commonwealth Scientific and Industrial Reserch Organization; Institute of Energy and Earth Resources, Division of Geomechanics: Mount Waverley, Australia, 1983. [Google Scholar]
  15. Wang, E.; He, X.; Liu, Z.; Nie, B.; Ma, S. The regularity electromagnetic radiation of coal or rock under load and its application. China Saf. Sci. J. 2000, 10, 35–39. [Google Scholar]
  16. Afanasenko, G.V.; Shvedov, I.M. Study of natural and industrial electromagnetic fields for predicting ejection hazards during mining of carnallite. Sov. Min. Sci. 1991, 27, 70–74. [Google Scholar] [CrossRef]
  17. Frid, V. Electromagnetic radiation method for rock and gas outburst forecast. J. Appl. Geophys. 1997, 38, 97–104. [Google Scholar] [CrossRef]
  18. He, X.; Nie, B.; Chen, W.; Wang, E. Research progress on electromagnetic radiation in gas-containing coal and rock fracture and its applications. Saf. Sci. 2012, 50, 728–735. [Google Scholar] [CrossRef]
  19. Mydlikowski, R.; Maniak, K. Dynamics of autonomous rock electromagnetic radiation measurement instrumentation. Bull. Pol. Acad. Sci. Tech. Sci. 2021, 69, e138567. [Google Scholar]
  20. Lichtenberger, M. Underground Measurements of Electromagnetic Radiation Related to Stress-induced Fractures in the Odenwald Mountains (Germany). Pure Appl. Geophys. 2006, 163, 1661–1677. [Google Scholar] [CrossRef]
  21. Zhang, Y. Optimization and Application of the Early-Warning Index for Heading-Face Coal and Gas Outburst Based on Combined AE-EMR-Gas Parameters; China University of Mining and Technology: Xuzhou, China, 2019. [Google Scholar]
  22. Shi, X. Experimental Study on Roof Collapse Caused by Rockburst in Deep Driving Coal Roadway Based on Multi-source Information; China University of Mining and Technology: Xuzhou, China, 2021. [Google Scholar]
  23. Nitsan, U. Electromagnetic emission accompanying fracture of quartz-bearing rocks. Geophys. Res. Lett. 1977, 4, 333–336. [Google Scholar] [CrossRef]
  24. Wu, S.; Zhang, S.; Shen, D. An experimental study on Kaiser effect of acoustic emission in concrete under uniaxial tension loading. China Civ. Eng. J. 2008, 41, 31–39. [Google Scholar]
  25. Liu, Y.; Liu, Y.; Wang, Y.; Jin, A.; Fu, J.; Cao, J. Influencing factors and mechanism of electromagnetic radiation in rock fracture. J. Seismol. 1997, 19, 83–90. [Google Scholar] [CrossRef]
  26. Wang, E.; He, X.; Dou, L.; Zhou, S.; Nie, B.; Liu, Z. Electromagnetic radiation characteristics of coal and rocks during excavation in coal mine and their application. Chin. J. Geophys. 2002, 48, 216–221. [Google Scholar]
  27. Wu, J.; Wang, E.; Ren, X.; Wang, X. Rock burst early-warning for thick coal seam in deep mining based on Logistic regression. J. Mine Autom. 2017, 43, 42–46. [Google Scholar]
Figure 1. Diagram of experimental system.
Foundations 02 00052 g001
Figure 2. Some of the concrete specimens.
Foundations 02 00052 g002
Figure 3. Stress–strain curve of samples under uniaxial loading.
Foundations 02 00052 g003
Figure 4. Stress–strain curves of samples under cyclic loading.
Foundations 02 00052 g004
Figure 5. Fitting curve between peak stress and size of samples.
Foundations 02 00052 g005
Figure 6. The AE response of the specimens under uniaxial loading.
Foundations 02 00052 g006
Figure 7. The fitting curves of cumulative AE count and stress level.
Foundations 02 00052 g007
Figure 8. The fitting curve of cumulative AE count and size at peak stress.
Foundations 02 00052 g008
Figure 9. The AE response of samples under cyclic loading.
Foundations 02 00052 g009
Figure 10. Felicity ratio change with the stress level.
Foundations 02 00052 g010
Figure 11. Response of electromagnetic radiation to samples under monotonic loading.
Foundations 02 00052 g011
Figure 12. Response of electromagnetic radiation to samples under cyclic loading.
Foundations 02 00052 g012aFoundations 02 00052 g012b
Figure 13. Cumulative EMR count change with stress level in cyclic loading and unloading process.
Foundations 02 00052 g013
Figure 14. Sketch map of working face in Qianqiu Mine.
Foundations 02 00052 g014
Figure 15. Electromagnetic radiation monitoring system.
Foundations 02 00052 g015
Figure 16. The response characteristic of KBD5 to rockburst.
Foundations 02 00052 g016
Figure 17. The response characteristics of KBD7 to rockburst.
Foundations 02 00052 g017
Figure 18. Rockburst microseismic hypocentral distance and microseismic energy and frequency (microseismic energy: elastic wave energy radiated by microseismic source).
Foundations 02 00052 g018
Table 1. Mix ratio of concrete samples.
IngredientCementSandWater
Weight ratio11.60.58
Table 2. Experimental scheme.
Sample Size (mm)Serial NumberLoading MethodLoading Rate
150 × 150 × 150A1Uniaxial displacement control0.6 mm/min
A2
A3Cyclic loadingLoaded at 1 kN/min to 150 kN (6.67 MPa); unloaded at the same speed to 0; loaded in the same way to 200, 250 and 300 kN (8.89, 11.11, 13.33 MPa), a total of four cycles; and then loaded to failure.
100 × 100 × 100B1Uniaxial displacement control0.4 mm/min
B2
B3Cyclic loadingLoaded at 90, 120, 150 and 180 kN (9, 12, 15, 18 MPa) at the same rate as A3, and then loaded to failure.
70 × 70 × 70C1Uniaxial displacement control0.28 mm/min
C2
C3Cyclic loadingInflexion points of four cyclic loads are 27 kN (5.51 MPa), 55 kN (11.22 MPa), 65 kN (13.27 MPa) and 73 kN (14.90 MPa), respectively.
50 × 50 × 50D1Uniaxial displacement control0.2 mm/min
D2
D3Cyclic loadingInflexion points of four cyclic loads are 29 kN (11.6 MPa), 39 kN (15.6 MPa), 44 kN (17.6 MPa) and 49 kN (19.6 MPa), respectively.
Publisher’s Note: MDPI stays neutral with regard to jurisdictional claims in published maps and institutional affiliations.

