Abstract
The current paper uses comparable data to present an overview of home-based long-term care (LTC) for persons over 65 years of age in Europe. It aims to provide new insights to aid discussions on LTC policy convergence in three areas: the need for services, the extent to which these needs are met and the means employed to do so. It uses data from wave 6 (2015) of the Survey of Health, Ageing and Retirement in Europe (SHARE). Four summary indicators are charted: (i) the care need: how many people need care; (ii) the care gap: the extent to which stated needs remain unmet; (iii) the care mix: how overall provision is divided into formal, informal or a mix of both; and (iv) care satisfaction based on stated preferences by recipients. Heterogeneity at individual level is explained by probit analyses, examining how individual factors (age, severity of need, gender, social networks, prosperity and others) combine with country group and country effects. Scatter plots are used to relate differences among countries to systemic variables, such as public expenditures. The key conclusions are that: (i) Once needs are defined in comparable terms, there remains a surprisingly large number of people across Europe whose needs are not addressed at all, what we call the care gap, especially among the younger group aged 65–80; this is evident everywhere and is not limited to any one type of system or group of countries; (ii) formal and informal care are both significant for the stability of an LTC provision system and for the well-being of care recipients; and (iii) recipients of care are especially sceptical about formal care, as they reward principally informal carers with whom they have personal relationships. The overwhelming finding is that the heterogeneity defies easy generalisations, whether these relate to individual characteristics or systemic effects. This (unexplained) heterogeneity is a challenge for researchers to explain, but it could also represent an untapped resource for policymakers to exploit.
1. Introduction
As the world population is ageing, policies for efficient, equitable and sustainable long-term care (LTC) are being reassessed. The salience of this search is driven by the expected rise in longevity and its implications for gender balance, while the search for institutional innovations was given added urgency when the pandemic exposed previously unsuspected vulnerabilities in LTC systems.
Policy discussion is particularly lively in the European Union (EU). Mapping experiences across Europe using comparable information—benchmarking—is a necessary first step for systematic discussion, as Atkinson et al. argue in their influential report [1]. This should build up from individual-level data to allow for comparisons of the different need levels and responses to them in countries following different systems of LTC provision; ideally it should be possible to disentangle differences due to individuals’ circumstances with those due to systemic effects. Both the need for care and the responses to it should start from intuitive concepts captured through simple indicators which can be compared across member states but also with each other. The current paper approaches this task by using internationally comparable data to benchmark needs for LTC reported by individuals and the kinds of responses they elicit. The analysis uses three indicators to approach three broad questions: (i) What proportion of persons over age 65 need care (the care need indicator)? (ii) Of those in need of care, what proportion receives no care at all (the care gap indicator)?, and (iii) Of those able to access care, what is the type they receive (the care mix indicator)? A fourth exercise, tracking the stated satisfaction of recipients of care gives a first subjective indication of performance. Each indicator is followed by (a) an attempt to explain observed differences using a combination of individual- and country-level effects and (b) a scatter plot relating how far country differences are linked to common system-level factors such as public expenditure on LTC. The widespread publicity given to the toll the pandemic exacted among the population receiving care [2,3] motivated an examination of a potential correlation of COVID-19 mortality at a country level with formal home-based care.
Therefore, the aim of the paper is to look at the ‘big LTC picture’ comprehensively, to spot differences among the 18 countries that participated in the sixth wave (2015) of the Survey of Health, Ageing and Retirement in Europe (SHARE) and to begin the search for explanations. This encourages policy insights and could lead to new research questions. Moreover, the concise snapshot derived can serve as a reference point for future policy discussions.
2. Policy Relevance of Benchmarking and the Concepts Used
Since the turn of century, the EU had been trying to define a role for itself in social policy. The chief obstacle was legal: social policy under the European Treaties lies within the realm of ‘subsidiarity’, i.e., within the exclusive purview of member states [4]. The EU overcame this by experimenting with ‘soft law’, in the form of the Open Method of Coordination (OMC) [5]. This relies on a structured discussion between member states in which political agreement on the desirability of objectives translates into commitment to (quantifiable) targets, the progress towards which is followed by the European Commission, acting in concert with the member states [6,7].
The OMC approach was first applied to pensions and health care [8]. Towards the end of the 2010s, the EU was ready to apply the OMC to long-term care as the area most vulnerable to longevity. Similar policy quests were also taking place elsewhere, from Australia [9] to China [10]. The key obstacle in Europe was how to frame the discussion in the presence of pervasive heterogeneity regarding the needs for LTC and the institutional framework in place but also in what constituted a desirable system [9,11]. The EU needs to coordinate 27 separate national debates. These, as things stand, are currently conducted on parochial terms, which limits the potential for mutual learning or pooling of experiences [12].
The coronavirus pandemic of 2019 (COVID-19) and the toll it exacted among the older population [13] gave the search for a European stance on LTC renewed impetus. The pandemic brought unprecedented challenges to nursing homes [14] but also to home-based LTC. More importantly, the pandemic scorecard seemed to cast doubt on prevailing notions about the ranking of modes of provision, the balance of formal to informal care and the role of the family as a stakeholder.
Discussions of LTC in Europe remain overwhelmingly national. While it is everywhere appreciated that the major challenges—such as longevity—are common [15], administrative data cannot even compare numbers of persons in need of care. As noted in the 2021 LTC EU joint report: “There is no single internationally accepted and standardized definition of what constitutes long-term care needs. As a result, it is currently not possible to unambiguously identify the number of people in need of long-term care” [11] (p. 27). Systems follow different approaches to characterizing a person as vulnerable and hence entitled to public care [16]. Official publications (by, e.g., Organisation for Economic Co-operation and Development (OECD); EU; United Nations) and some individual researchers attempt to overcome institutional differences [8,11,16,17,18]. However, due to problems of data comparability, many conclusions remain tentative. Thus, while there can be a surfeit of national information, the overall picture remains hazy.
If an EU-wide re-examination is to lead to a fruitful dialogue, it must build up from a solid micro-foundation of comparative information. The objective is to see through the veil of institutional differences to compare individuals’ experience. This would allow policymakers to approach the European heterogeneity of experience and the diversity of approaches as twin sources of policy insights. Being able to compare across borders would facilitate the spread of good practice and prevent bad.
Once differences in individuals’ experience in states are charted, the next step is to see how far these are linked to individuals’ features—age, morbidity, social networks—or to systemic differences, e.g., LTC regimes, fiscal priorities. A further question of policy interest is the extent to which national differences conform to the different social policy models characterising groups of countries. The most influential such clustering originates with Gösta Esping-Andersen’s The Three Worlds of Welfare Capitalism [19], as supplemented by Maurizio Ferrera [20,21,22], an approach which would divide the EU into four country groups—Nordic, continental, southern and eastern.
To fill the gap in the policy discussion, we need comparable individual-level data with which to compute simple intuitive indicators. What follows catalogues previous attempts to approach the three metrics used in this paper.
First, the need for care is the first step in projecting future public expenditures on LTC, such as in the triennial reports of the Ageing Working Group (AWG) [23]. Unlike administrative data, individual-level population information must rely on self-assessment. Survey respondents are either asked an overall question of the need for care (such as the Global Activity Limitation Index) (GALI metric) or prompted to reply whether they are in need of help for a specific activity of daily life (ADL) or instrumental activity of daily life (IADLs). Different definitions give rise to widely different estimates, and hence, divergent projections of future needs, implying the need for standardisation and calibration [24]. To construct an indicator to compare the need for care in EU countries, using ADLs as starting point would be the preferred course of action—allowing in principle a more granular analysis [24].
Second, the care gap measures whether there is a response to expressed needs: the probability that someone who states they need care, is, in fact, not accessing care of any type, either formal or informal. In other words, we put (expressed) demand and (effective) supply together to identify shortfalls in supply. Problems of access could be explained by the extent of public involvement in LTC and the social context and could be sensitive to the type of care of offer. Needs left unaddressed should be the most basic index of ‘the reach’ of overall societal arrangements, of whatever nature. The fact that this rather obvious statistic is seldom found in official publications probably signals, beyond definitional problems, unease about how LTC systems are organized and how they relate to informal family care. Independent researchers, on the other hand, do discuss unmet needs; Carrino et al. [25] used wave 1 and 2 SHARE data, while Lyberaki et al. [26] used definitions very similar to those employed here to compare data from 2015 with 2007, asking whether the financial crisis in three southern European SHARE countries led to a widening of care gaps.
Third, how care is provided is the object of what we call the care mix. The most basic classification, in the case of home-based care, is that between formal care provided by professionals and informal care provided without payment by family or friends. The involvement of professionals, whether employed by public social services or accessed from the market through payment, is the key distinction and is used in surveys such as SHARE and the Health and Retirement Study (HRS) in the United States (US) [27,28]. Thus formal care includes both publicly funded and individually financed care and would include ‘grey areas’ such as services financed through vouchers (as is common in Belgium and France [29]).
The EU has approached the need for comparable indicators with which to benchmark policy by making use of whatever transnational surveys were available; the precise choice of indicators was often dictated by the availability of information. The EU body entrusted with long-term ageing projections, the Ageing Working Group, has defined need at different times using either ADL or GALI. The most recent AWG reports use GALI as a proxy for LTC need, while earlier versions opted for ADLs, in common with most researchers (e.g., [16,30]). When Tinios and Valvis compared and calibrated the two notions, they concluded that projections based on GALI considerably overestimate need and argued for a unified scale including a notion of severity [24]. To make matters worse, in the same year, the 2021 EU LTC report [11] used a third, looser definition of need with data from the new Health Interview Survey (EHIS). Even when ADL is used as a measure, some use 1 ADL as a threshold for characterizing a person in need of care (e.g., [30]), while others use 2 ADLs (e.g., [31]).
However, it remains the case that something approximating the three indicators is a feature of official publications. For example, Dyer et al. [32] use the OECD database, and the European Commission found country differences using EU SILC; the EU LTC Report (2021) went a step further and estimated the volume of informal care in hours using the European Quality of Life Survey (EQLS, 2016) and EHIS. Other studies, such as Assessing Needs of Care in European Nations (ANCIEN) [33], benchmark using SHARE data. However, the picture they paint has gaps. The AWG report focuses on public spending only and does not discuss informal care at all. The European Social Policy Network Report (2018) [17], and the European Commission [23] and EU long-term care reports (2021) [11] talk about formal and informal care but do not put the two together to identify cases of no care being provided of any kind.
The fourth metric we present is satisfaction with care received, based on responses from people receiving care. The issue of satisfaction has been studied repeatedly. The ANCIEN project used SHARE 2007 data (w2) [33]; Fernández-Carro and Vlachantoni use SHARE; and Bettio and Veraschagina conducted a meta-analysis making use of both survey and national data [11,29,34]. However, overall satisfaction with the LTC system should extend to the well-being of carers, an issue examined in [35].
3. Materials and Methods
3.1. Data
This paper uses data from the sixth wave of the Survey of Health, Ageing and Retirement (SHARE), conducted in 2015. It supplements that survey’s data with macro, country-level data. SHARE is a multidisciplinary cross-national panel survey of micro data on the health, long-term care, socio-economic status and social and family networks of individuals over 50 years of age [36]. The sixth wave was conducted in 2015 in 16 EU countries, Switzerland (CH) and Israel (IS): namely, Sweden (SE), Denmark (DK), Germany (DE), Belgium (BE), Luxembourg (LU), France (FR), Austria (AT), Italy (IT), Spain (ES), Greece (GR), Portugal (PT), Czech Republic (CZ), Poland (PL), Slovenia (Sl), Estonia (EE) and Croatia (HR). We focus on individuals over 65. The reason for this decision is that age 65 is a frequent administrative cut-off for public LTC systems, while LTC at younger ages raises different issues, such as relationship with work or disability insurance. The original sample frame of SHARE was individuals living in households. However, individuals are followed in old-age homes in subsequent waves; this creates an uneven representation of the care home population depending on the number of waves each country has participated in [37]. It is for this reason that most of our analysis focuses on home care.
Scatter plots use estimates of two national-level variables. Public LTC expenditures per country as a percent of the gross domestic product (GDP) are taken from the 2021 Ageing Report [23] and from OECD [38]. The impact of the pandemic is approached by data from the COVerAge database [39]. To abstract from vaccinations, cumulative data up to 31 October 2020 are used, corresponding to the first two pandemic waves.
3.2. Measurements and Methods
The strategy proceeds in three steps for each of the three key indices. First, we use individual SHARE data to define and calculate each indicator: care need, care gap and care mix. Second, we run a probit analysis on the individual data to examine the extent to which national differences can be attributed to the ‘obvious’ explanatory factors behind individual heterogeneity: For care needs, these are health and physiological factors; for the care gap, social network and family variables; and for the probability of receiving formal care, social, economic and geographic factors. The third step returns to the macro level, using scatter plots to see whether the national pattern can be explained by systemic or fiscal features.
The starting point is demand, that is, the need for care. That is determined by the responses to questions on individuals’ abilities to perform standard self-assessed activities of daily living (ADLs) such as: (i) dressing, including putting on shoes and socks; (ii) walking across a room; (iii) bathing or showering; (iv) eating, such as cutting up your food; (v) getting in and out of bed; and (vi) using the toilet, including getting up or down. We consider a person as being in need of care when he faces difficulties with at least 1 ADL [24].
The care mix is defined as the type of care received by those in need. This can be formal, informal or a mix of both. SHARE distinguishes three types of care and help: (i) informal help provided by persons living outside the household, which includes personal care, practical household help and help with paperwork; (ii) informal personal care provided by someone living in the same household; and (iii) formal help, which includes professional services of personal care, practical household help, meals on wheels and help with other activities. Thus ‘formal care’ can include public care or private for-profit care, as long as it is provided by professionals. For the purposes of the current paper we opt for a wide definition, which includes all types of care received and help/practical assistance provided as long as it is provided on a regular basis (daily/weekly).
The care gap is defined as the proportion of persons in need of care who do not receive any kind of care, either informal or formal. If care need is an indication of the demand for LTC services, the care gap is linked to the supply. It is important for policymakers to gauge problems of access to services, a kind of performance test for social policy. The characteristics of those in the care gap could also be thought of as a social policy dashboard.
In addition to the indices, an indication of care satisfaction is also studied; those expressing a need who received help were asked to rate it as to the extent to which needs were met: ‘all the times’, ‘usually’, ‘sometimes’ and ‘hardly ever’.
SHARE data are used for all indicators. However, due to the different focus of each indicator, the sample size differs for each. For care needs, the full sample is used. This includes those who transferred to nursing homes; otherwise, needs would be underestimated in countries where living in nursing homes is more common. The other indicators shift to home, community-based care and exclude nursing homes. Thus, the care gap and care mix are defined for all those living in households who signal they have at least one ADL deficiency. Finally, care satisfaction is derived from answers posed only to respondents receiving care regularly. Consequently, the question was not posed to approximately 7.8% of the sample who, despite receiving care in the sense used here, did not think of themselves as care recipients. Table 1 outlines the sample size for the total sample and by country group (Nordics: Sweden, Denmark; Continental: Austria, Belgium, Germany, France, Switzerland, Luxemburg; Southern: Spain, Italy, Greece, Portugal; Eastern: Czech Republic, Poland, Slovenia, Estonia, Croatia). Detailed information on sample size is provided in Appendix A.

Table 1.
The sample sizes of the four metrics.
We use histograms and simple descriptive statistics to illustrate the cross-country big picture. These are measures of central tendency (means, medians) and dispersion (coefficient of variation, values of quartiles ranges). The probabilities of individuals being classified in particular ways are analysed by means of probit equations, which allow for the investigation of the dependence of the categorical dependent variables on the cofactors and independent variables [40]. Using multivariate functions such as probits allows us to gauge the separate effects of individual factors and of fixed effects corresponding to countries or country groups.
We use probit models for the probability of being in need of care, the probability of receiving care and the probability of using formal care. Each probit is estimated using individual cofactors, country group effects, roughly corresponding to the groups originally suggested in [19], and separate country effects. More specifically: (i) for explaining the probability of needing care, we use cofactors standing for individual circumstances: age, gender, chronic illnesses, depression and obesity, as well as country groups and country; (ii) for explaining the probability of facing a care gap, we use cofactors related to the efficiency of systemic response: ADLs (depth of need), age, gender, household make-up, variables linked to finances, area of living, size of social network, country groups and country; (iii) for explaining the probability of accessing formal care (alone and/or in conjunction with informal), we use the following cofactors: ADLs (depth of need), age, gender, household synthesis, variables linked to finances, country groups and country, in a manner analogous to Lyberaki et al. [26]; and (iv) for explaining the probability of care provision always meeting needs (care satisfaction), we use the following cofactors: type of care received, ADLs (depth of need), age, gender, household synthesis, variables linked to finances, area of living, size of social network, country groups and country.
As a final exploratory device, we use scatter plots to investigate a number of potential correlations: (a) of the care gap with LTC public expenditures, (b) of the relative COVID-19 mortality of older people (the odds ratio of deaths for the over-65 population compared with the under-65 group) with the care mix and (c) of informal care with public per capita LTC expenditure.
In the conclusion, we use a scatter plot to summarise findings. We thus put the three indicators and care satisfaction together into a scatter plot, where formality is classified in three groups according to the reach of formal systems; this would include cases where provision is exclusively formal as well as others where many people combine formal services with some informal.
3.3. Limitations
People who reside in care homes are not representative of the population. SHARE is primarily a household panel survey; however, original respondents who moved to care homes were followed into their new abodes. Moreover, attrition from the panel is higher for those moving to nursing homes. Thus, though care homes are not excluded, they are underrepresented. The results for countries which have been in the SHARE panel longest or which rely on nursing homes contain the largest concentrations of individuals in nursing homes. Even so, SHARE would not be unrepresentative of community-based LTC, which is, arguably, of greater importance in planning for future LTC needs whether public or private. Care satisfaction in the present paper refers to the satisfaction of direct beneficiaries and does not examine the views of carers.
We know that much care is concentrated in the last six months of life [41]. These are the subject of a separate SHARE ‘exit interview’ completed by relatives after the death of a member of the panel. However, these were not included in our analysis; similar to the previous point, this is unlikely to be a major concern for community-based LTC.
Sampling the very old and frail, who are also most heavily in need of LTC, is fraught with difficulties. As a result, this group is often underrepresented in surveys of the general population. SHARE guards against that through surveying all individuals resident in a household, using proxy respondents and keeping track of non-response biases [32].
A concern with international surveys is the fidelity and consistency of translations. The SHARE questionnaire [27] is translated into 18 languages. Special attention is placed on consistency in translations; moreover, the repetition of the survey and its panel nature guard against major issues. A more important point is the impact of different institutional structures for the provision of services. In countries relying on formal systems, which invariably involve judgments of severity, bureaucratic classifications will most likely influence individuals’ own perception of severity and possibly affect expressed needs. In more familial systems, such as those in the south and east of Europe, this would be more limited. Subjective evaluations are filtered by answering styles, attitudes (e.g., being stoic and showing a ‘stiff upper lip’) or health conditions which ‘justify’ needing care; these might vary from country to country or by gender. These are partly allowed through the presence of cofactors and country dummies in multivariate analyses, such as probits. The presence of other cofactors or non-linearities cannot, however, be ruled out.
LTC public expenditures are not recorded in a unified way across Europe; the provision of services is fragmented, and statistical data are insufficient. LTC has also historically been a relatively low policy priority and, consequently, in terms of the development of statistical data definitions and collections [11]. However, the estimates made in the EU Ageing Reports are commonly used as reference points [23]. They are based on a combination of administrative data, European survey data, European System of Integrated Socia PROtection Statistics (ESPROSS) data and proxy variables which calibrate different approaches among countries.
4. Results
In this section, we present findings for 18 countries for persons aged 65 or more. The section is divided into four subsections: (i) the care need indicator, (ii) the care gap indicator, (iii) the care mix indicator and (iv) satisfaction with care received.
4.1. The Care Need Indicator
Figure 1 shows the proportions of persons in need for care per country and by number of ADLs. Taking all countries in the sample together, 18.9% of people of age 65 or more need care, of whom almost half (8.5%) face difficulties with just 1 ADL, 3.7% with 2 ADLs and 6.7% with 3 or more ADLs.
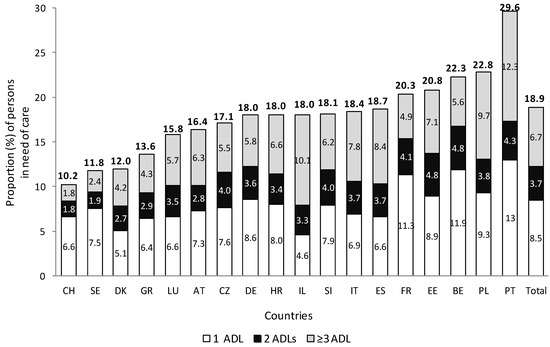
Figure 1.
The care need indicator; proportion (%) of persons in need of care (n = 39,707), per country, age 65+; Source: authors’ own calculations, SHARE wave 6. ADL: activities of daily living, SE: Sweden, DK: Denmark, DE: Germany, BE: Belgium, LU: Luxembourg, FR: France, CH: Switzerland, AT: Austria, IT: Italy, ES: Spain, GR: Greece, PT: Portugal, CZ: Czech Republic, PL: Poland, Sl: Slovenia, EE: Estonia, HR: Croatia, IL: Israel, n: number of observations.
Many countries cluster around the middle. However, variations are wide, especially for persons facing limitations with three or more ADLs. Nordic countries and Switzerland appear to have the lowest proportion with three or more ADLs. In the southern group, we find the country with the highest needs (Portugal) and the fewest (Greece); similarly, Belgium is a long way from Switzerland or Luxembourg.
The bulk of the explanation in the probit analysis is provided by individual characteristics, whose impacts are remarkably robust as country effects are introduced (Table 2). Being in need increases significantly with age in a non-linear fashion; the probability roughly doubles for each 5-year age group after 70 years of age. More specifically, persons aged 85+ have a 38-percentage-point (pp.) greater probability of needing care than persons between 65–69. The existence of more than two chronic diseases, of obesity and of depression also exercise considerable influence. Adding country groups has a smaller effect than adding separate country effects. A distinct ‘country group’ identity can be discerned only within the Nordic group, which is the only group to reach statistical significance at 99%. Divergences are marked in the southern and continental groups, defying easy generalisations.
Table 2.
The probit model for the probability of needing care.
4.2. The Care Gap
This section examines whether persons who need care can access services, of whatever kind (formal or informal. In Figure 2, we see the home-care gap for persons living in the community when facing difficulties with at least 1, 2+ and 3+ ADLs. One in three experience unaddressed needs, with elderly persons in Sweden, Portugal and Switzerland facing the highest care gaps. A total of 15% of persons with 3+ ADLs do not receive any care. Whereas Austria and Belgium have care gaps of less than 5% for persons with 3 or more ADLs, this rises to 24% in Sweden. When including the nursing home population as by definition receiving care, the total (home together with nursing homes) care gap proportion falls by some 5 pp in Sweden and by 2 pp in Switzerland and Portugal; the picture therefore is not materially affected. The dispersion appears to rise with the number of ADLs (see Table 3).
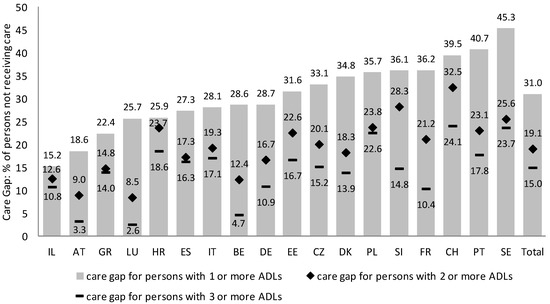
Figure 2.
The care gap indicator; proportion (%) of persons living in the community not receiving care by number of ADL limitations, per country, age 65+; Source: authors’ own calculations, SHARE wave 6. Abbreviations as in Figure 1.
Table 3.
The probit model for the probability of not receiving care.
Table 3 explains unaddressed needs (the care gap) with a probit model using two types of cofactors, relating to the intensity of need and to the ability to access LTC services. The sample is limited to those living in the community who have expressed an inability to perform at least one ADL. Depth of need, in the form of more ADLs, and older age are the two strongest factors. Poverty is important in the form of ‘facing great difficulties making ends meet’; its significance diminishes when country effects are allowed. Accessing care through social networks is less important. Other social or geographic characteristics exercise weak effect on care gaps. Country group effects have a smaller impact than country effects. A distinct group identity can be discerned only for Nordic countries, which show increased probabilities of facing home-care gaps. The large differences within the continental group are noteworthy, spanning a range of 17.3 pp, where Austria (AT) is 7.5 pp better than Germany and Switzerland (CH) 9.8 pp worse.
Does spending more on public care close care gaps? The scatter plot (Figure 3) relates the care gap to LTC public expenditures per person aged 65+ (in thousands of purchasing power parity (PPP) euros) in 2016. The impression derived is indicative, given that estimates of LTC public expenditures include institutional care. Nevertheless, the scatter diagram shows practically no correlation between the care gap and public expenditures (R2 0.05). In a separate scatter plot relating the gap to LTC expenditure as a percentage of GDP, the relationship was not only very weak but also of a ‘perverse’ sign: the gaps rose with expenditures.
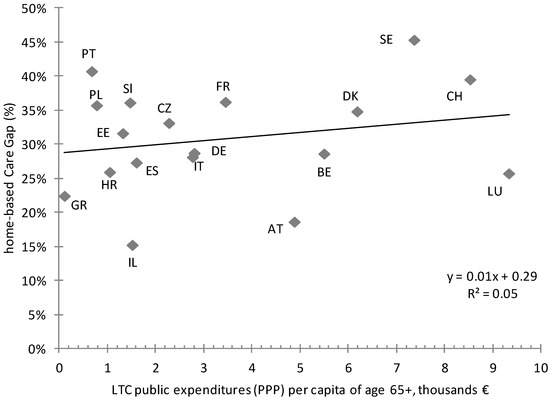
Figure 3.
Home-based care gaps per country, age 65+: LTC public expenditures scatter diagram; Source: authors’ own calculations; supplementing SHARE (w6) data with data from the 2018 EU Aging Report [23] and OECD 2020 [38]. PPP: purchasing power parity.
4.3. The Care Mix Indicator
Figure 4 examines how home care is divided between formal and informal. Of those of age 65+ in need of care who receive care, 40.7% receive only informal care, 41.7% receive both formal and informal care and 17.6% receive only formal care. There are marked differences between countries following a distinct geographical pattern. Eastern Europe relies heavily on informal care; those receiving exclusively informal care range from 63.6% (CZ) to 81.1% (HR). South Europe ranges from 47.1% to 59.9%, while Central European countries rely roughly equally on formal and informal care: 50% to 60% receive both. Finally, in Nordic countries and Switzerland, we find the highest proportions of exclusively formal care. A key finding is that informal care is always present, even where formality dominates.
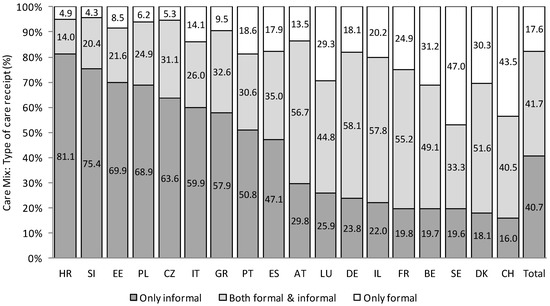
Figure 4.
The care mix indicator; proportion (%) living in the community with at least 1 ADL receiving care, per type of care, per country, age 65+ (n = 4113). Source: authors’ own calculations, SHARE wave 6. Abbreviations as in Figure 1.
In the probit in Table 4, we see that country and group effects have a far more important influence, at least in the sense of explaining the observed variability: R2 almost triples from 0.06 to 0.17. Similarly, the sign and magnitudes of individual country effects are minor compared with the between-group effects. Formal access responds chiefly to depth of need (ADL) and less so for age, where sizeable impacts appear after age 75. Formal care is also much more common for persons living alone. Another factor which seems to have an impact is facing great difficulties making ends meet; its significance, however, disappears when the country effect is brought in.
Table 4.
The probit model for the probability of receiving some formal care.
The scatter plot in Figure 5 examines whether there is an association between a rough measure of the virulence of the pandemic effect on the older adults—the odds ratio of deaths for the over-65s compared with the under-65s until November 2020—with the prevalence of formal care. Though the correlation is not overwhelming (R2 = 0.16), some relationship appear surprising at this level of aggregation.
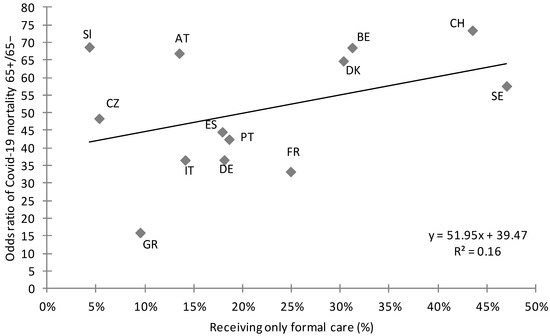
Figure 5.
Scatter diagram of the receipt of only formal home-based care and the COVID-19 odds ratio mortality correlation. Source: authors’ own calculations; supplementing SHARE (w6) data with data from COVerAGE-DB [39].
As a further investigation of systemic effects, the link of existence of some informal care and public expenditure is probed by a scatter plot of informal care with LTC public expenditures per capita of people over 65 (Figure 6). The relationship is close (R2 0.67) and strongly negative; the association of informal care with public LTC expenditures is high.
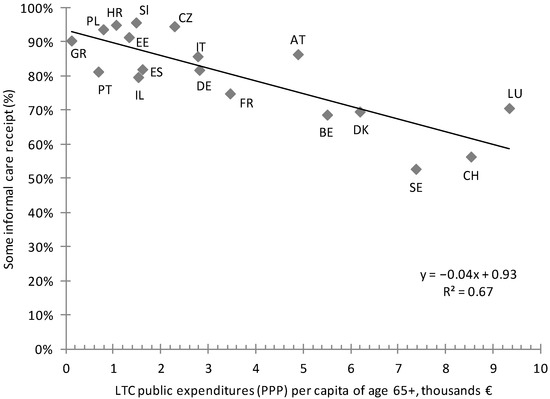
Figure 6.
Informal care, age 65+—LTC public expenditures scatter plot. Source: authors’ own calculations; supplementing SHARE (w6) data with data from 2018 EU Aging Report [23] and OECD 2020 [38].
4.4. Satisfaction with the Care Supplied
An important question regarding LTC provision is how well the needs of those receiving home care are served. Interviewees receiving care were asked if the care they received had met their needs. Figure 7 charts their responses from ‘all the time’ to ‘hardly ever’; 70% replied ‘all the time’; the range is from 48.6% (DK) to 83.3% (PT). Only 7.2% answered that the care they receive met their needs ‘hardly ever’ or ‘sometimes’ (range 2.4–20.6%). Denmark and Sweden vie for the lowest satisfaction scores, with Portugal, Poland and Italy at the other extreme.
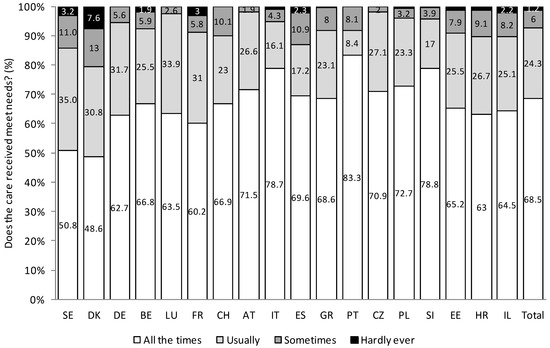
Figure 7.
Care provision satisfaction; persons in the community with 1 ADL+, receiving care, per country, age 65+ (n = 3790); Source: authors’ own calculations, SHARE wave 6. Abbreviations as in Figure 1.
Figure 8 reports satisfaction for all the countries in total by type of care. It is higher when the care received is informal, as compared with formal care. Of those receiving exclusively formal care, only 49.8% declare that the care provided meets needs ‘all the time’, climbing to 67.5% for those receiving both and to 76.7% for those receiving only informal care.
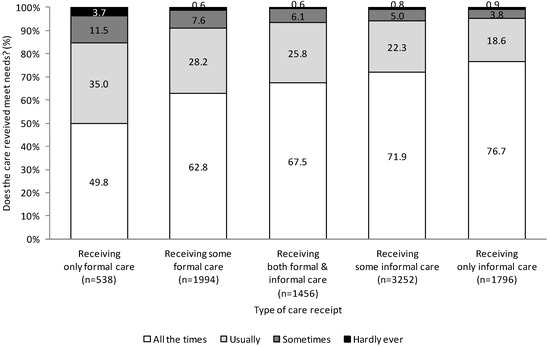
Figure 8.
Satisfaction per type of care received; persons 65+; n: number of observations; Source: authors’ own calculations, SHARE wave 6.
Table 5 shows the probability of always being satisfied with the care provided. The overall extent of explanation achieved is low; this rises only marginally when country effects are introduced. The strongest influence by far is the simple presence of informal care; another significant influence is not living alone. The number of ADLs begins to matter only after 3. In countries where formal care dominates (Nordic), the country effect pushes results down; the opposite holds and informal is the norm (Southern Europe). Allowing cofactors in the probit goes some way towards rebutting a comment that the apparent relationship in Figure 8 simply reflects the greater severity of need in formal provision.
Table 5.
The probabilities that care provision always met needs.
4.5. An Overview: Summarising Results
The empirical exercise of benchmarking LTC in Europe examined three indicators and one impact measure. Descriptive statistics and a summary appear in Table 6. Table 6 also reports the indicators for the top and bottom 20%, the median, the overall range and the coefficient variation. These confirm the impression that the majority of countries are relatively close to the median but that there exist outliers in every country group. The table also reports the top and bottom performing countries. Sweden, for example, is among the top performers in needs, but among the worst in satisfaction.
Table 6.
Summary results.
The scatter plot in Figure 9 attempts a graphical representation of all indicators together. There exists a relationship between care need (for the population age 65+) and care gaps (expressed as a percent of those needing care): greater needs imply larger gaps. Importantly, the Scandinavian countries and Switzerland form exceptions, where large formal systems coexist with ‘abnormally high’ care gaps and are also combined with low satisfaction. Many countries appear to bunch around the overall averages. Both care gaps and incidence of dissatisfaction, however, are surprisingly extensive for countries with advanced welfare systems. Apart from this observation, it must be admitted that the picture defies easy categorisations. With the exception of Scandinavia, countries usually thought similar exhibit very different behaviour. This is most obvious in the southern countries, with Greece and Portugal at opposite ends and Italy and Spain securely in the middle. However, it also applies to continental countries, where Austria, Germany, Belgium and France appear in different quadrants of the chart.
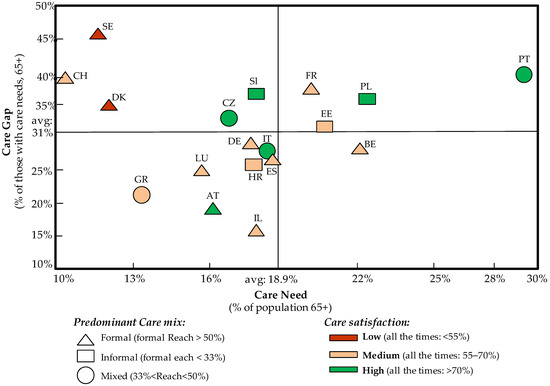
Figure 9.
Key country LTC index mapping, authors’ own calculations.
5. Discussion
This exercise reached some robust conclusions and raised some questions. Regarding the need for care, while half the countries lie within a few percentage points of the mean and median, there are notable outliers, with the overall range being quite wide. The Nordic countries appear to need less care, while Poland and Portugal are at the other end. Our findings are in line with other studies [11,30,31,42]. The probit showed that health and age are the most significant parameters affecting the proportion of persons 65+ being in need of care. An obvious research question is why people of similar age and characteristics appear to have such great differences in the need for care in certain countries. Are these differences due to better physical health or do they simply reflect national answering styles, a different level of stoicism?
As far as care provision is concerned, the probability that someone will not receive any care at all—the care gap—is, surprisingly wide, for countries with advanced welfare states. This could be explained by our findings related to the limited informal care provision; informal care may be expected to be quicker to respond to needs [43]. One in three people who are unable to perform at least one daily activity are not receiving help. This is negatively related to seriousness of need, so the systems do react to greater need, however imperfectly. Wide gaps in care occur to a similar extent in countries following different logics in care provision. Older people face a lower probability of denial, as do men. Finding little association between care gaps and public expenditure seems paradoxical, especially given that home-based LTC is held to be the preferred kind of care for the EU [9,11]. It is explainable in conjunction with the subsequent finding that public expenditure is inversely associated with informal care (Figure 6). This would happen, for instance, if expenditure is directed to supporting informal carers—e.g., by respite schemes. This could be because encouraging female carers to participate in the labour market serves as a reminder that the question of the substitutability of the two kinds of care is complex. It is true to say, however, that where combinations of care are common, care gaps tend to be less frequent. Spasova et al. [17], through the study of national policies, point out the insufficient availability of formal care provision in southern and Eastern European countries compared with the Nordic and continental countries, while Mot and Biro [44] used SHARE data (wave 2) for different years and also found wide differences, with the care gap being highest in Germany and lowest in Poland. However, although care gaps in southern Europe are still high, it seems they follow a decreasing trend compared with 2007, despite the ravages of the financial crisis; the authors of [26] interpret this as a sign of the maturation of formal systems but also evidence of a more active care market.
Regarding the care mix, the north–south gradient in care is a finding common to all comparative investigations, e.g., [16,18,29,45,46,47]. This is usually interpreted as arising from supply-side factors such as the capacity of public bodies or from the character of the welfare state; the social context is also a determinant of the use of the type of care [48]. A reinforcing reason could be the existence of different attitudes as to who should bear the responsibility for care—the family or the state. This was probed in SHARE wave 1 and wave 2, which asked who should provide ‘help with household chores for older persons in need’. Answers in 2004 and 2007 almost exactly mirror each other on the responsible care provider. Eastern countries and Greece agree that this should be the family (over 50%), northern countries and France believe that it should be the state (over 85%) while continental countries lie somewhere in between [49]. This suggests that attitudes could adapt to the prevalent system, or possibly vice versa. Similarly, differences in the nature of social expectations about the role of the family and the community are marked across countries over time [11,18,50]. The sign and magnitudes of individual country effects seem to conform to the Esping-Andersen [19] categorization, where within-group differences are minor compared with between-group effects. The likelihood of receiving formal care increases with the severity of need and age. Men have a reduced probability of receiving formal care; one could argue this could be because of the care provided by spouses. The link between informal care and public expenditure is strongly negative. This, combined with the lack of association between a lower care gap and higher public expenditures, could indicate that public expenditures have been aimed, as already proposed above, to allow informal carers—mainly women—to partially abstain from care responsibilities to facilitate their labour market participation.
Satisfaction with care received was a clear case where informal care helps, adding the ‘human touch’ to the ‘professionalism’ of formal care. Previous studies [35,51] examine issues related to satisfaction and note that beneficiaries of care seek a greater voice and more control over their lives [35]. We find that people seem to prefer that formal and informal care coexist; the optimum is a combination of both. It should not escape comment that Nordic countries, widely considered models for social care policies but places where informal care is less frequent, are the locus of most expressed dissatisfaction. One could argue that formal care guarantees professionalism, while informal care provides emotional security and is more generous in terms of time. Informal care given to relatives or friends has no time limitations and can be emotionally generous, even if lacking in technical expertise. Formal professional help can be efficient but has to economise on face time with recipients, running the risk of being thought impersonal [52]. The two can be complements in the sense that informal help can make tailor services to individual needs. An alternative interpretation is that the intervention of payment for professional services places the relationship with recipients on a different level, with greater expectations than for services provided free with no overt obligation, the Titmuss [53] argument for free provision. An interesting finding is that of those receiving care, only those in severe need (more than 3 ADLs) express satisfaction, possibly acknowledging situations where technique or expertise matter. Conversely, the majority who have lighter needs would like more attention. Informal care recipients appear happy with the care they are given, presumably acknowledging the (selfless) efforts of their carers. This, however, says little about how those carers feel, for example about having to give up employment or retire early (which is common for women informal carers).
A word is due to country effects. Much commentary on LTC uses as a starting point the categorization of ‘the Worlds of Welfare Capitalism’ of Esping-Andersen [9,11,18]. Our analysis mixes individual effects with country level and country-group effects and thus enables a direct test of salience of the categorization. While the country groups supposedly corresponding to different welfare models certainly play a role in the provision of care, as evidenced in our analysis of the care mix, their effect in explaining outcomes such as the need for care or the care gap recedes considerably. Only the Nordic group seems somewhat homogeneous, while in other cases there is considerable national heterogeneity within groups, and individual factors provide the bulk of explanation. A positive reading of the robustness of individual effects to allow for national effects is that all systems are (roughly) equally responsive to individual circumstances. Still, the overall picture can be taken as a stern warning against the adoption of easy ex ante generalisations.
What do our findings mean for policy at a European level? It is clear that formal and informal care are both significant for the stability of an LTC provision system; one type of care cannot fully supplant the other. Countries with mixed care systems—a combination of formal and informal care—can reap the benefits of both. They appear able to reconcile the well-being of informal caregivers, the satisfaction of the needs of care recipients, the adequacy of care and the balanced distribution of human and financial resources, which are not inexhaustible. Whereas there is a clear implication that policy should move in the direction of greater support to familial/or informal carers and of maximising synergies between formal and informal systems, it is hard to be more specific. There is a clear need for a standardized needs assessment and for the classification of care needs that also takes into account those in moderate need of care, of ages 65–80, as an instrument that would enable fruitful national and transnational conversations to take place [24]. Similarly, the existence of wide gaps in very different systems could signal the need to encourage mixed systems; it also probably signals the need to ensure an adequate workforce for LTC, whether private or public. National policymakers should not abandon the search for new modes and avoid the traps of ruling off options, which could prove useful.
6. Conclusions and Policy Lessons
The 18th principal Statement of the European Pillar of Social rights states boldly: “Everyone has the right to affordable long-term care services of good quality, in particular home-care and community-based services” [54]. Our paper, as mentioned in the introduction, used individual data to look at the ‘big LTC picture’ comprehensively, both how needs are articulated in the EU and what guides or distinguishes the systemic response to those needs. What would policymakers’ intent on realising the stated goal make of our findings?
The overview of the situation pertaining to long-term care in Europe in the years before the pandemic often yielded a picture of unexplained heterogeneity, both in needs and in responses to them. These differences appeared impervious to easy explanations, whether arising from circumstances of individuals or systemic effects that operate at country level. Greater expenditure does not seem to guarantee greater success in responding to needs: in some cases (such as in the provision of formal care), it may have exposed beneficiaries to greater dangers during early stages of the pandemic. If a generalisation is to be made, it is that national long-term care systems exist in a state of flux, where similar needs appear to elicit very different responses in different countries with results which are not always easy to assess. Neither the difference in the character of needs nor the responses to them appear amenable to easy explanations. Dissatisfaction appears to affect beneficiaries—who are ready to reward only people close to them who provide informal care, but who remain sceptical of formal provision—whether private or public.
However, these recommendations, at this stage, cannot be made specific. Discussions of the optimum care mix need to shed the ideological overtones of much of the debate on the public character of care and come to grips with the reality that the two systems need to work together to accommodate the growing needs. The characteristics and modalities of cooperation between public, private and informal care provision are a more urgent matter for research than any search for the elusive ‘optimum’. Similarly, research needs to address the reasons for and determinants of the low level of satisfaction.
The final thought returns to the starting point of the paper. The looming challenge of long-term care is so large, and the resources available are already so stretched, that no country can afford to ignore what is happening around it. The heterogeneity uncovered in our paper is certainly a challenge for researchers to explain; at the same time, it represents a wealth of experience, both negative and positive, out of which a response to the challenge can be fashioned.
Author Contributions
Conceptualization, P.T. and Z.V.; methodology, P.T., Z.V. and T.G.; formal analysis, P.T., Z.V. and T.G.; writing—original draft preparation, P.T. and Z.V.; writing—review and editing, P.T.; visualization, Z.V.; supervision, P.T. All authors have read and agreed to the published version of the manuscript.
Funding
The publication of this paper has been partly supported by the University of Piraeus Research Center.
Institutional Review Board Statement
Not applicable.
Informed Consent Statement
Not applicable.
Data Availability Statement
http://www.share-project.org/data-access.html (accessed on 21 January 2020).
Acknowledgments
This paper uses data from SHARE Wave 6 (DOI: 10.6103/SHARE.w6.600), see Börsch-Supan et al. (2013) [55] for methodological details. The SHARE data collection has been funded by the European Commission, DG RTD through FP5 (QLK6-CT-2001-00360), FP6 (SHARE-I3: RII-CT-2006-062193, COMPARE: CIT5-CT-2005-028857, SHARELIFE: CIT4-CT-2006-028812), FP7 (SHARE-PREP: GA N°211909, SHARE-LEAP: GA N°227822, SHARE M4: GA N°261982, DASISH: GA N°283646) and Horizon 2020 (SHARE-DEV3: GA N°676536, SHARE-COHESION: GA N°870628, SERISS: GA N°654221, SSHOC: GA N°823782, SHARE-COVID19: GA N°101015924) and by DG Employment, Social Affairs & Inclusion through VS 2015/0195, VS 2016/0135, VS 2018/0285, VS 2019/0332, and VS 2020/0313. Additional funding from the German Ministry of Education and Research, the Max Planck Society for the Advancement of Science, the U.S. National Institute on Aging (U01_AG09740-13S2, P01_AG005842, P01_AG08291, P30_AG12815, R21_AG025169, Y1-AG-4553-01, IAG_BSR06-11, OGHA_04-064, HHSN271201300071C, RAG052527A) and from various national funding sources is gratefully acknowledged (see www.share-project.org, accessed on 16 June 2022) [36].
Conflicts of Interest
The authors declare no conflict of interest.
Appendix A
Table A1.
The sample sizes of persons aged 65+ by gender and age.
Table A1.
The sample sizes of persons aged 65+ by gender and age.
| Country | 65+ | Men | Women | 65–79 | 80+ |
|---|---|---|---|---|---|
| Austria | 2224 | 943 | 1281 | 1798 | 426 |
| Germany | 2365 | 1216 | 1149 | 1977 | 388 |
| Sweden | 2817 | 1315 | 1502 | 2235 | 582 |
| Spain | 3629 | 1660 | 1969 | 2513 | 1116 |
| Italy | 3091 | 1474 | 1617 | 2517 | 574 |
| France | 2264 | 956 | 1308 | 1629 | 635 |
| Denmark | 1875 | 892 | 983 | 1508 | 367 |
| Greece | 2669 | 1253 | 1416 | 2087 | 582 |
| Switzerland | 1730 | 820 | 910 | 1348 | 382 |
| Belgium | 3015 | 1356 | 1659 | 2256 | 759 |
| Israel | 1331 | 587 | 744 | 990 | 341 |
| Czech Republic | 3101 | 1291 | 1810 | 2583 | 518 |
| Poland | 953 | 417 | 536 | 756 | 197 |
| Luxembourg | 732 | 364 | 368 | 591 | 141 |
| Portugal | 1012 | 476 | 536 | 844 | 168 |
| Slovenia | 2412 | 1058 | 1354 | 1891 | 521 |
| Estonia | 3323 | 1251 | 2072 | 2544 | 779 |
| Croatia | 1164 | 534 | 630 | 996 | 168 |
| Total | 39,707 | 17,863 | 21,844 | 31,063 | 8644 |
Table A2.
The composition of the overall sample of persons aged 65+ by gender and age.
Table A2.
The composition of the overall sample of persons aged 65+ by gender and age.
| Country | 65+ | Men | Women | 65–79 | 80+ |
|---|---|---|---|---|---|
| Observations | % | % | % | % | |
| Austria | 2224 | 42.4 | 57.6 | 80.8 | 19.2 |
| Germany | 2365 | 51.4 | 48.6 | 83.6 | 16.4 |
| Sweden | 2817 | 46.7 | 53.3 | 79.3 | 20.7 |
| Spain | 3629 | 45.7 | 54.3 | 69.2 | 30.8 |
| Italy | 3091 | 47.7 | 52.3 | 81.4 | 18.6 |
| France | 2264 | 42.2 | 57.8 | 72.0 | 28.0 |
| Denmark | 1875 | 47.6 | 52.4 | 80.4 | 19.6 |
| Greece | 2669 | 46.9 | 53.1 | 78.2 | 21.8 |
| Switzerland | 1730 | 47.4 | 52.6 | 77.9 | 22.1 |
| Belgium | 3015 | 45.0 | 55.0 | 74.8 | 25.2 |
| Israel | 1331 | 44.1 | 55.9 | 74.4 | 25.6 |
| Czech Republic | 3101 | 41.6 | 58.4 | 83.3 | 16.7 |
| Poland | 953 | 43.8 | 56.2 | 79.3 | 20.7 |
| Luxembourg | 732 | 49.7 | 50.3 | 80.7 | 19.3 |
| Portugal | 1012 | 47.0 | 53.0 | 83.4 | 16.6 |
| Slovenia | 2412 | 43.9 | 56.1 | 78.4 | 21.6 |
| Estonia | 3323 | 37.6 | 62.4 | 76.6 | 23.4 |
| Croatia | 1164 | 45.9 | 54.1 | 85.6 | 14.4 |
| Total | 39,707 | 45.0 | 55.0 | 78.2 | 21.8 |
Table A3.
The sample sizes of persons aged 65+ with 1+ ADL, by gender and age.
Table A3.
The sample sizes of persons aged 65+ with 1+ ADL, by gender and age.
| Country | 65+ | Men | Women | 65–79 | 80+ |
|---|---|---|---|---|---|
| Austria | 305 | 122 | 183 | 164 | 141 |
| Germany | 340 | 167 | 173 | 228 | 112 |
| Sweden | 281 | 135 | 146 | 183 | 98 |
| Spain | 617 | 230 | 387 | 252 | 365 |
| Italy | 445 | 166 | 279 | 244 | 201 |
| France | 418 | 175 | 243 | 206 | 212 |
| Denmark | 174 | 85 | 89 | 111 | 63 |
| Greece | 327 | 121 | 206 | 180 | 147 |
| Switzerland | 144 | 64 | 80 | 80 | 64 |
| Belgium | 537 | 217 | 320 | 306 | 231 |
| Israel | 269 | 110 | 159 | 115 | 154 |
| Czech Republic | 499 | 194 | 305 | 342 | 157 |
| Poland | 201 | 82 | 119 | 123 | 78 |
| Luxembourg | 85 | 41 | 44 | 51 | 34 |
| Portugal | 246 | 86 | 160 | 178 | 68 |
| Slovenia | 403 | 175 | 228 | 253 | 150 |
| Estonia | 644 | 216 | 428 | 400 | 244 |
| Croatia | 171 | 58 | 113 | 116 | 55 |
| Total | 6106 | 2444 | 3662 | 3532 | 2574 |
Table A4.
The composition of persons aged 65+ with 1+ ADL, by gender and age.
Table A4.
The composition of persons aged 65+ with 1+ ADL, by gender and age.
| Country | 65+ | Men | Women | 65–79 | 80+ |
|---|---|---|---|---|---|
| Observations | % | % | % | % | |
| Austria | 305 | 40.0 | 60.0 | 53.8 | 46.2 |
| Germany | 340 | 49.1 | 50.9 | 67.1 | 32.9 |
| Sweden | 281 | 48.0 | 52.0 | 65.1 | 34.9 |
| Spain | 617 | 37.3 | 62.7 | 40.8 | 59.2 |
| Italy | 445 | 37.3 | 62.7 | 54.8 | 45.2 |
| France | 418 | 41.9 | 58.1 | 49.3 | 50.7 |
| Denmark | 174 | 48.9 | 51.1 | 63.8 | 36.2 |
| Greece | 327 | 37.0 | 63.0 | 55.0 | 45.0 |
| Switzerland | 144 | 44.4 | 55.6 | 55.6 | 44.4 |
| Belgium | 537 | 40.4 | 59.6 | 57.0 | 43.0 |
| Israel | 269 | 40.9 | 59.1 | 42.8 | 57.2 |
| Czech Republic | 499 | 38.9 | 61.1 | 68.5 | 31.5 |
| Poland | 201 | 40.8 | 59.2 | 61.2 | 38.8 |
| Luxembourg | 85 | 48.2 | 51.8 | 60.0 | 40.0 |
| Portugal | 246 | 35.0 | 65.0 | 72.4 | 27.6 |
| Slovenia | 403 | 43.4 | 56.6 | 62.8 | 37.2 |
| Estonia | 644 | 33.5 | 66.5 | 62.1 | 37.9 |
| Croatia | 171 | 33.9 | 66.1 | 67.8 | 32.2 |
| Total | 6106 | 40.0 | 60.0 | 57.8 | 42.2 |
References
- Atkinson, A.B.; Cantillon, B.; Marlier, E.; Nolan, B. Social Indicators. The EU and Social Inclusion; Oxford University Press: Oxford, UK, 2002. [Google Scholar]
- Claude Pepper Center. COVID-19′s Impact on Long-Term Care. Available online: https://claudepeppercenter.fsu.edu/coronavirus-covid-19-and-you/covid-19s-impact-on-long-term-care (accessed on 4 June 2022).
- Rochon, P.A.; Li, J.M.; Johnstone, J.; Brown, K.; Armstrong, P.; Tanuseputro, P.; Savage, R.; Gill, S.; Mather, R.; Costa, A.; et al. The COVID-19 Pandemic’s Impact on Long-Term Care Homes: Five Lessons Learned; Ontario COVID-19 Science Advisory Table: Toronto, ON, Canada, 2022; Volume 3. [Google Scholar] [CrossRef]
- EUR-Lex. Social Policy. Available online: https://eur-lex.europa.eu/EN/legal-content/glossary/social-policy.html (accessed on 28 February 2022).
- Eurofound. Available online: https://www.eurofound.europa.eu/observatories/eurwork/industrial-relations-dictionary/open-method-of-coordination (accessed on 28 February 2022).
- Prpic, M. At a Glance. The Open Method of Coordination; European Parliamentary Research Service: Brussels, Belgium, 2014. Available online: https://www.europarl.europa.eu/EPRS/EPRS-AaG-542142-Open-Method-of-Coordination-FINAL.pdf (accessed on 28 February 2022).
- Zeitlin, J. Is the Open Method of Coordination an Alternative to the Community Method? In The Community Method: Obstinate or Obsolete? Palgrave Macmillan: London, UK, 2011. [Google Scholar] [CrossRef] [Green Version]
- European Commission. Available online: https://ec.europa.eu/social/main.jsp?catId=1063&langId=en (accessed on 28 February 2022).
- OECD. Health at a Glance 2021: OECD Indicators; OECD Publishing: Paris, France, 2021. [Google Scholar] [CrossRef]
- Glinskaya, E.; Feng, Z. Options for Aged Care in China: Building an Efficient and Sustainable Aged Care System; World Bank Group: Washington, DC, USA, 2018. [Google Scholar] [CrossRef]
- European Commission; Directorate-General for Employment; Social Affairs and Inclusion and Social Protection Committee. 2021 Long-Term Care Report: Trend, Challenges and Opportunities in an Ageing Society (Volume I); Publications Office of the European Union: Luxembourg, 2021.
- Greve, B. Some concluding reflections. In Long Term Care for the Elderly in Europe; Development and Prospects; Greve, B., Ed.; Routledge: New York, NY, USA, 2017; pp. 185–193. [Google Scholar]
- Roy, J.; Jain, R.; Golamari, R.; Vunnam, R.; Sahu, N. COVID-19 in the geriatric population. Int. J. Geriatr. Psychiatry 2020, 35, 1437–1441. [Google Scholar] [CrossRef] [PubMed]
- O’Neill, D.; Briggs, R.; Holmerová, I.; Samuelsson, O.; Gordon, A.L.; Martin, F.C. COVID-19 highlights the need for universal adoption of standards of medical care for physicians in nursing homes in Europe. Eur. Geriatr. Med. 2020, 11, 645–650. [Google Scholar] [CrossRef] [PubMed]
- Kaschowitz, J.; Brandt, M. Health effects of informal caregiving across Europe: A longitudinal approach. Soc. Sci. Med. 2017, 173, 72–80. [Google Scholar] [CrossRef] [PubMed]
- Brugiavini, A.; Carrino, L.; Orno, C.; Pasini, G. Vulnerability and Long Term Care in Europe: An Economic Perspective; Springer International Publishing AG: Cham, Switzerland, 2017; pp. 25–133. [Google Scholar]
- Spasova, S.; Baeten, R.; Coster, S.; Ghailani, D.; Peña-Casas, R.; Vanhercke, B. Challenges in Long-Term Care in Europe. A Study of National Policies; European Social Policy Network (ESPN): Brussels, Belgium, 2018. [Google Scholar]
- Greve, B. Long Term Care for the Elderly in Europe; Development and Prospects; Routledge: New York, NY, USA, 2017. [Google Scholar]
- Esping-Andersen, G. The Three Worlds of Welfare Capitalism; Princeton University Press: Princeton, NJ, USA, 1990. [Google Scholar]
- Ferrera, M. The ‘Southern Model’ of welfare in social Europe. Eur. J. Soc. Policy 1996, 6, 17–37. [Google Scholar] [CrossRef]
- Ferrera, M. The South European Countries. In The Oxford Handbook of the Welfare State; Castles, F., Leibfried, F., Lewis, J., Obinger, H., Pierson, C., Eds.; Oxford University Press: Oxford, UK, 2010; pp. 616–629. [Google Scholar]
- Ferrera, M.; Hemerijck, A.; Rhodes, M. Recasting European Welfare States for the 21st Century. Eur. Rev. 2000, 8, 427–446. [Google Scholar] [CrossRef]
- European Commission; Directorate-General for Economic and Financial Affairs. Ageing Report: Economic and Budgetary Projections for the EU-27 Member States; Publications Office of the European Union: Luxembourg, 2021.
- Tinios, P.; Valvis, Z. Defining Long-Term-Care Need Levels for Older Adults: Towards a Standardized European Classification. J. Aging Soc. Policy 2022, in press. [Google Scholar]
- Carrino, L.; Orso, C.E.; Pasini, G. Demand of long-term care and benefit eligibility across European countries. Health Econ. 2018, 27, 1175–1188. [Google Scholar] [CrossRef] [PubMed]
- Lyberaki, A.; Tinios, P.; Papadoudis, G.; Georgiadis, T. The economic crisis, fiscal austerity and long term care: Responses of the care mix in three adjustment countries. In Health and Socioeconomic Status over the Life Course: First Results from SHARE Waves 6 and 7; Börsch-Supan, A., Bristle, J., Andersen-Ranberg, K., Brugiavini, A., Jusot, F., Litwin, H., Weber, G., Eds.; De Gruyter: Berlin, Germany, 2019; pp. 197–206. [Google Scholar]
- Survey of Health, Ageing and Retirement in Europe (SHARE). Available online: http://www.share-project.org/data-documentation/questionnaires/questionnaire-wave-6.html (accessed on 25 January 2022).
- Health and Retirement Study. Available online: https://hrs.isr.umich.edu/sites/default/files/meta/2020/core/qnaire/online/07hr20G.pdf (accessed on 28 February 2022).
- Bettio, F.; Veraschagina, A. Long-Term Care for the Elderly. Provisions and Providers in 33 European Countries; European Network of Experts on Employment and Gender Equality Issues; Publications Office of the European Union: Luxembourg, 2010.
- Lee, J.; Phillips, D.; Wilkens, J.; Chien, S.; Crimmins, E.M.; Lin, Y.-C.; Angrisani, M. Cross-Country Comparisons of Disability and Morbidity: Evidence from the Gateway to Global Aging Data. J. Gerontol. Ser. A 2017, 73, 1519–1524. [Google Scholar] [CrossRef] [PubMed] [Green Version]
- Srakar, A.; Filipovič Hrast, M.; Hlebec, V.; Majcen, B. Social exclusion, welfare regime and unmet long-term care need: Evidence from SHARE. In Ageing in Europe—Supporting Policies for an Inclusive Society; Börsch-Supan, A., Kneip, T., Litwin, H., Myck, M., Weber, G., Eds.; De Gruyter: Berlin, Germany, 2015; pp. 189–198. [Google Scholar]
- Dyer, S.; Valeri, M.; Arora, N.; Ross, T.; Winsall, M.; Tilden, D.; Crotty, M. Review of International Systems for Long-Term Care of Older People. In The Royal Commission into Aged Care Quality and Safety; Australian Government: Canberra, Australia, 2019; ISBN 978-1-921730-01-6. [Google Scholar]
- European Network of Economic Policy Research Institutes. Assessing Needs of Care in European Nations; Mot, E., Willeme, P., Eds.; ENEPRI Policy Brief No. 14, December 2012; CEPS: Brussels, Belgium, 2012. [Google Scholar]
- Fernández-Carro, C.; Vlachantoni, A. The role of social networks in using home care by older people across Continental Europe. Health Soc. Care Community 2019, 27, 936–952. [Google Scholar] [CrossRef] [PubMed]
- Calvo-Perxas, L.; Vilalta-Franch, J.; Litwin, H.; Turro-Garriga, O.; Mira, P.; Garre-Olmo, J. What seems to matter in public policy and the health of informal caregivers? A cross-sectional study in 12 European countries. PLoS ONE 2018, 13, e0194232. [Google Scholar] [CrossRef] [Green Version]
- Survey of Health, Ageing and Retirement in Europe (SHARE). Available online: http://www.share-project.org/home0.html (accessed on 16 June 2022).
- Malter, F.; Börsch-Supan, A. (Eds.) SHARE Wave 6: Panel Innovations and Collecting Dried Blood Spots; Munich Center for the Economics of Aging (MEA): Munich, Germany, 2017. [Google Scholar]
- OECD. Spending on Long-Term Care; OECD: Paris, France, 2020; Available online: https://www.oecd.org/health/health-systems/Spending-on-long-term-care-Brief-November-2020.pdf (accessed on 28 February 2022).
- Riffe, T.; Acosta, E.; Aburto, J.M.; Alburez-Gutierrez, D.; Altová, A.; Basellini, U.; Bignami, S.; Breton, D.; Choi, E.; Cimentada, J.; et al. COVerAGE-DB: A database of age-structured COVID-19 cases and deaths. medRxiv 2020. [Google Scholar] [CrossRef]
- Maddala, G.S. Limited Dependent and Qualitative Variables in Econometrics; Cambridge University Press: Cambridge, UK, 1983. [Google Scholar]
- Menec, V.H.; Nowicki, S.; Blandford, A.; Veselyuk, D. Hospitalizations at the End of Life Among Long-Term Care Residents. J. Gerontol. Ser. A 2009, 64, 395–402. [Google Scholar] [CrossRef] [PubMed] [Green Version]
- Laferrère, A.; van den Bosch, K. Unmet need for long-term care and social exclusion. In Ageing in Europe—Supporting Policies for an Inclusive Society; Börsch-Supan, A., Kneip, T., Litwin, H., Myck, M., Weber, G., Eds.; De Gruyter: Berlin, Germany, 2015; pp. 331–341. [Google Scholar]
- Wanless, D.; Forder, J.; Fernandez, J.; Poole, T.; Beeslay, L.; Henwood, M.; Moscone, F. Securing Good Care for Older People. Taking a Long-Term View; King’s Fund: London, UK, 2006; pp. 137–152. [Google Scholar]
- Mot, E.; Bíró, A. Performance of Long-Term Care Systems in Europe; ENEPRI Policy ENPRI Policy Brief No. 13, December 2012; CEPS: Brussels, Belgium, 2012. [Google Scholar]
- Riedel, M.; Kraus, M. Informal Care Provision in Europe: Regulation and Profile of Providers; ENEPRI Research Report (96); CEPS: Brussels, Belgium, 2011. [Google Scholar]
- Brandt, M. Intergenerational help and public support in Europe. A case of specialization? Eur. Soc. 2013, 15, 26–56. [Google Scholar] [CrossRef]
- Muir, T. Measuring Social Protection for Long-Term Care; OECD Health Working Papers, No. 93; OECD Publishing: Paris, France, 2017. [Google Scholar] [CrossRef]
- Hlebec, V.; Srakar, A.; Majcen, B. Long-Term Care Determinants of Care Arrangements for Older People in Europe: Evidence from SHARE. Rev. Soc. Polit. 2019, 26, 135–152. [Google Scholar] [CrossRef]
- Lyberaki, A.; Tinios, P. Poverty and Social Exclusion. In Life 50+: Health, Ageing and Pensions in Greece and in Europe; Lyberaki, A., Tinios, P., Philalithis, A., Eds.; Kritiki: Athens, Greece, 2009; pp. 275–304. (In Greek) [Google Scholar]
- Fernandez, J.; Forder, J.; Trukeschitz, B.; Rokosva, M.; McDaid, D. How can European States Design Efficient, Equitable and Sustainable Funding Systems for Long-Term Care for Older People? WHO Regional Office for Europe: Copenhagen, Denmark, 2009. [Google Scholar]
- OECD/European Commission. A Good Life in Old Age? Monitoring and Improving Quality in Long-Term Care; OECD Health Policy Studies; OECD Publishing: Paris, France, 2013. [Google Scholar] [CrossRef] [Green Version]
- Cavendish, C. Extra Time: 10 Lessons for an Ageing World; HarperCollins: London, UK, 2019. [Google Scholar]
- Titmuss, R.M. The Gift Relationship; Penguin: London, UK, 1970. [Google Scholar]
- European Commission. Available online: https://ec.europa.eu/info/strategy/priorities-2019–2024/economy-works-people/jobs-growth-and-investment/european-pillar-social-rights/european-pillar-social-rights-20-principles_en (accessed on 25 January 2022).
- Börsch-Supan, A.; Brandt, M.; Hunkler, C.; Kneip, T.; Korbmacher, J.; Malter, F.; Schaan, B.; Stuck, S.; Zuber, S. Data resource profile: The Survey of Health, Ageing and Retirement in Europe (SHARE). Int. J. Epidemiol. 2013, 42, 992–1001. [Google Scholar] [CrossRef] [PubMed]
Publisher’s Note: MDPI stays neutral with regard to jurisdictional claims in published maps and institutional affiliations. |
© 2022 by the authors. Licensee MDPI, Basel, Switzerland. This article is an open access article distributed under the terms and conditions of the Creative Commons Attribution (CC BY) license (https://creativecommons.org/licenses/by/4.0/).