Article

Experimental Design of a Novel Daylighting Louver System (DLS); Prototype Validation in Edinburgh Climate for Maximum Daylight Utilisation

1
Faculty of Engineering & Digital Technologies, University of Bradford, Bradford BD7 1PH, UK
2
School of Computing, Engineering & the Built Environment, Edinburgh Napier University, Edinburgh EH10 5DT, UK
3
Architectural Engineering Department, Faculty of Engineering, The Hashemite University, Zarqa 13115, Jordan
4
School of Energy, Infrastructure, Geoscience & Society, Heriot Watt University, Edinburgh EH14 4AS, UK
*
Author to whom correspondence should be addressed.
Architecture 2025, 5(4), 93; https://doi.org/10.3390/architecture5040093 (registering DOI)
Submission received: 24 July 2025 / Revised: 16 September 2025 / Accepted: 22 September 2025 / Published: 9 October 2025

Abstract

Achieving optimal daylighting in buildings necessitates complex and expensive control systems. This research addresses this challenge by proposing a simple and more practical solution: a parametric louver system based on rotating slats controlled by stepper motors, powered by an Integrated Circuit platform (Arduino board), which can translate the digital figures (the rotation angles) to a physical action. The system automatically adjusts the slats in accordance with solar altitudes and reflects them to specific targets over the ceiling. This ensures a uniform and comfortable distribution of daylight throughout a room. This system was developed using Grasshopper as the parametric software, with future control planned via a user-friendly mobile app through a preliminary prototype. This daylighting system prioritises human visual comfort while targeting a significant 53% reduction in electrical lighting energy consumption. The system aims to enhance occupant well-being to significantly increase energy savings, making it a compelling solution for sustainable building design.

Graphical Abstract

1. Introduction

Daylighting systems can be exploited to improve buildings’ envelope and save electrical energy, consequently reducing carbon emissions [1]. Recently, architecture has become more alive as it has been integrated with different modern features such as using smart glazing [2], sustainable materials [3], active/passive solutions [4,5,6], and dynamic responsive facades inspired by nature [7,8]. All these approaches aim to provide a healthy and comfortable indoor environment and feasible architecture. To achieve such goals, daylighting systems are integrated with kinetic technology to control indoor performance in response to sun movements [9]. In the context of modern architectural technology, automated daylighting systems can help to optimise building energy performance for better energy efficiency [10].
Sunlight offers an excellent source of light for buildings; however, it must be handled and controlled to ensure its optimum use. Otherwise, low or excessive sunlight can lead to discomfort and other health issues [11,12]. The human eye receives signals from natural daylight that help control our circadian rhythms [13]. The 24 h solar day–night cycle is the primary natural signal that stimulates our body clock [14]. Our bodies must receive the right amount of light at the correct time and frequency, which affects our bodily functions. The most powerful signal is the bright light received from the sun [13].
In response to the G7 climate calls hosted in Germany in 2022 and the recent environmental crisis, governments are planning a strategic transformation towards utilising cleaner energy resources like solar power, which offers diverse applications including heating, lighting, and electricity generation. Accordingly, dynamic daylighting systems have been investigated intensively over the last few decades [15,16], aiming to enhance their technical performance, improve their accuracy [17,18,19], and increase occupant visual comfort while achieving greater energy and carbon savings [20]. A comprehensive study, including a comparison and statistical survey on daylighting systems and automation control [9], concluded that using advanced daylighting systems in commercial buildings can achieve up to 50% in energy savings for lighting. However, this figure can potentially reach up to 70% by using an automated parametric approach [21].
With the aid of modern technology, innovative daylighting systems have dramatically improved [18,22,23,24]; however, size, cost, feasibility, and performance remain significant limitations [24]. To challenge these obstacles, several studies have been conducted to exploit daylight utilisation more effectively [25]. Although automated/dynamic systems can potentially save up to 50% of electrical energy, compared to conventional systems that achieve up to 20% at their best performance [26], the efficiency of those automated systems is still limited due to their huge sizes, sophistications, high cost, significant maintenance needs, and control constraints based on user preferences [27]. Moreover, they are actively functional only for a limited time during the day under specific conditions, and their energy savings rarely exceed 50%, a figure that can realistically drop to as low as 30% in a trade-off with all those feasibility factors.
Advanced technology, such as parametric design, can provide accurate control and simultaneously resolve sophisticated combinations [28]. Grasshopper (for Rhinoceros 8), as a parametric software, has been used in recent studies to control the rotation of mirrored surfaces to achieve better daylight distribution within deep-plan rooms [4,29]. For instance, a light shelf, used as a daylighting reflector, was used to redirect incident sunlight indoors to improve daylighting performance in a typical New York office [30]. Some automated control daylighting systems have been used to improve daylighting efficiency and comfort; however, their control was highly sophisticated and required regular maintenance [31]. For instance, the kinetic Mashrabiya facade on the Al-Bahar Towers in Abu Dhabi can respond to solar movements to control daylight penetration and reduce heat gain, although each tower uses a complex hydraulic system of 1049 units to operate the facade, which is considered a drawback compared to the energy savings outcome [32].
A crucial area of innovation in sustainable building design is the integration of electrical lighting with natural daylighting [33], often referred to as hybrid lighting [34]. This approach moves beyond simply using passive daylight and instead employs active control systems that work in concert with ambient light levels. Previous research has demonstrated that such systems can significantly reduce energy consumption by dimming or switching off artificial lights in response to available daylight [35]. These systems typically use sensors that measure the illuminance of a space, sending signals to a central control unit that adjusts the output of the electrical lighting fixtures [35]. However, early systems were often complex, expensive, and limited in their ability to consistently deliver high-quality light [24]. More recent studies have focused on developing more sophisticated yet simpler systems that can achieve greater efficiency and a more uniform distribution of light [36]. By combining the benefits of natural illumination with the reliability of electrical systems, hybrid lighting represents a key strategy for improving a building’s energy performance control and enhancing occupant comfort.
The current study, therefore, aims to achieve simplified control and high precision through a 1:1 prototype of an automated louver. The design is based on parametrically controlled reflective slats that can mimic the sun’s movement. The slats are rotated by simple actuators controlled by an Arduino board, which receives signals generated by Grasshopper and transmitted through the Firefly middleware. The proposed Daylighting Louver System (DLS) can provide evenly distributed daylight inside a deep-plan room [9,21,26,37], which will be supported with electrical LED light in areas and at times with lower illumination. This paper presents a practical evaluation and validation of the DLS performance in a preliminary prototype for potential market application, in conjunction with the aid of supplementary electrical lighting to achieve constant, steady, and distributed hybrid lighting during the working hours of the day.

2. Methodology

The research method is summarised in Figure 1, which briefly shows the circulation process of the Daylighting Louver System (DLS). The process begins with the software (Grasshopper), which calculates the rotation angles of the louver based on solar angles. These angles are then sent to an Arduino board, which transmits the signals to the actuators to create physical motion. Gears connected to the actuators increase the rotation precision, which in turn rotates the slats to reflect light onto the ceiling, effectively acting as the light source for the room.

2.1. Software Control and Prototype Simulation

Grasshopper (based on Rhinoceros 3D) is an open-source parametric modelling software developed to generate complex geometries based on scripting methods and mathematical algorithms [38]. Grasshopper can be connected to plugins such as “Ladybug & Honeybee”, which are developed as interfaces for environmental software including Radiance 6.0, EnergyPlus 25.1.0 and DAYSIM 4.0. These simulation tools operate in the background via the plugin interface.
In this study, Grasshopper calculations were sent to the Arduino board via Firefly Firmata medium that controls the rotation of the gears [9]. The Arduino board connects physically to a PC using a standard USB cable. Firefly is an open-source plugin for Grasshopper that acts as a translator between the visual programming language and the Arduino microcontroller. It essentially replicates the Arduino’s input and output pins as Grasshopper components. This setup allows the system to read rotation angles defined in Grasshopper and send them via a serial port to the Arduino, which controls the slat rotations accordingly.
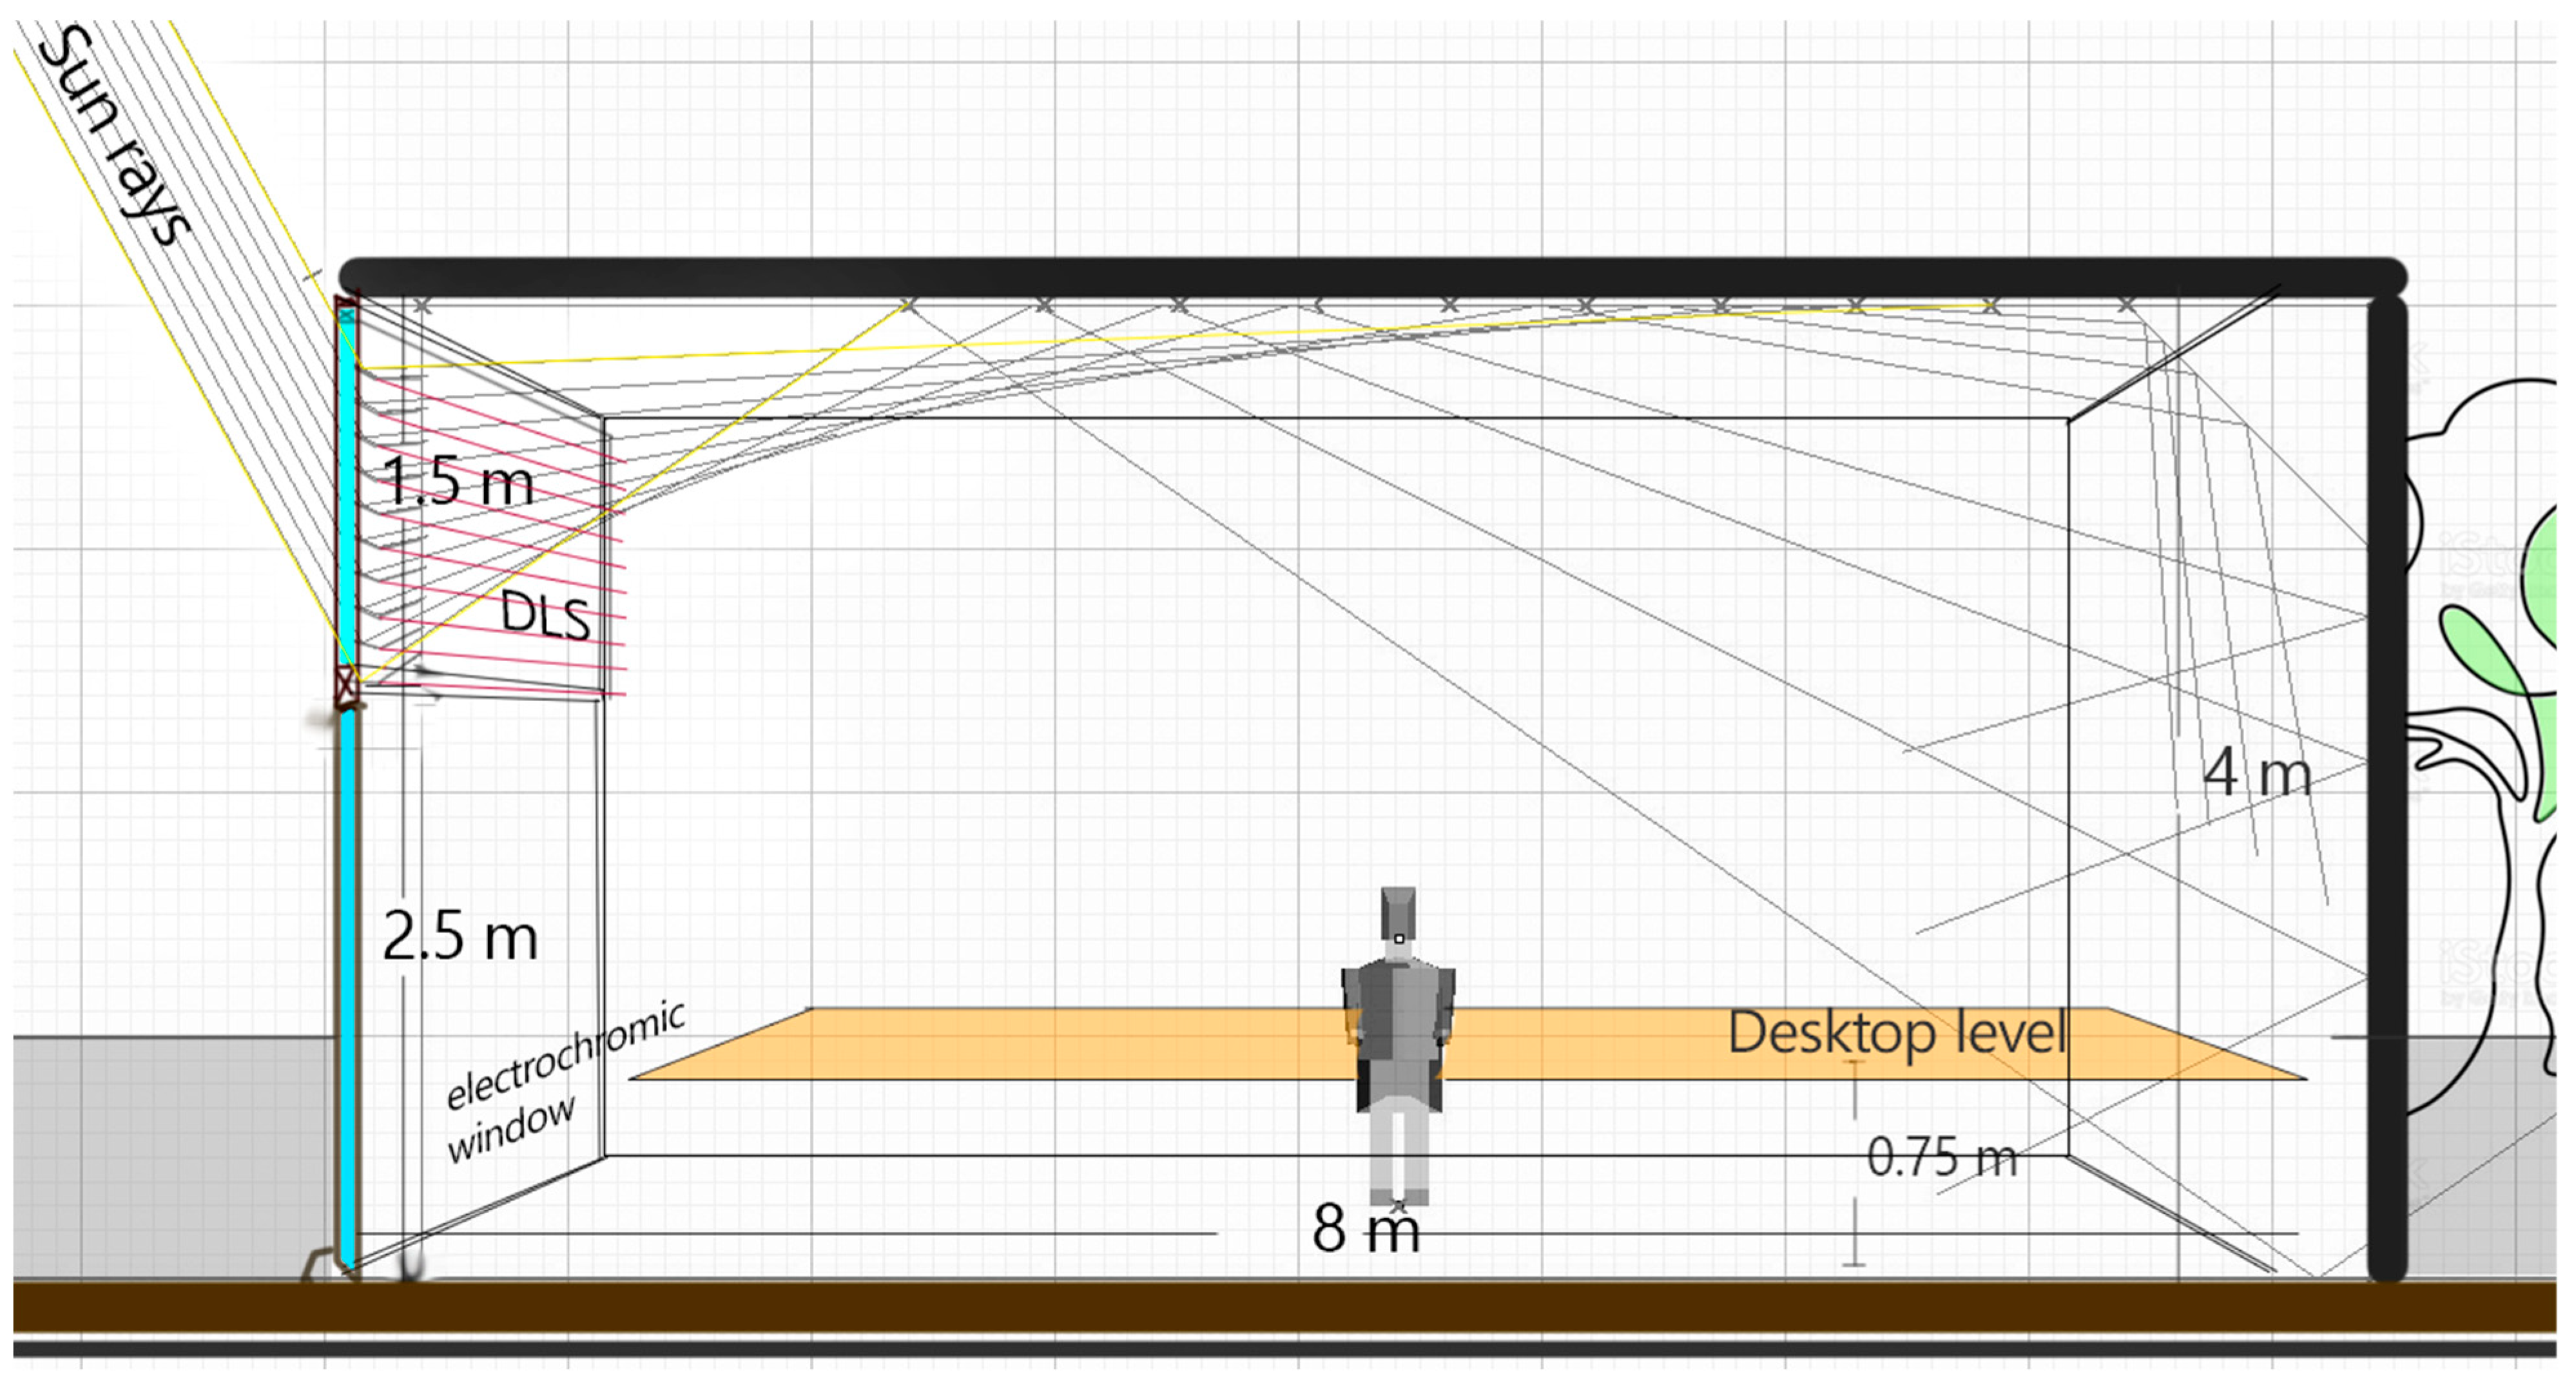
Rhino/Grasshopper was also used for the room and DLS modelling. The room is 5 m in width, 8 m in depth, and 4 m in height (see Figure 2). The Ladybug & Honeybee plugins were utilised to simulate the environmental conditions using an EPW weather file for Edinburgh. This allowed for calculations of the sun path, solar radiation intensity, solar angles, and sky types. These environmental inputs were used for light raytracing to derive the optimal slat rotation and, finally, to carry out daylight analysis within the room.

2.2. Physical Prototype Components

The DLS consists of four main components: the window frame, the rotating slats, the gears, and the servo motors. The latter are connected to an Arduino Mega board, which controls the slat rotation based on data received from Grasshopper. The purpose of the slats’ rotation is to maintain a consistent distribution of reflected sun vectors over the ceiling [37]. The DLS frame is made of plywood with dimensions of 100 cm in width and 80 cm in height, as shown in Figure 3. This specific height allows the system to cover a room up to 8 m in depth; for instance, every 10 cm can cover 1 m of depth. The DLS frame is mounted indoors, next to the window, under the lintel level at the upper part of the south-oriented window. It can be replicated to cover the entire window width. For example, if the room’s window is 6 m wide, it would require a number of 6 DLS units to cover the whole width.
The DLS consists of nine rotating slat units, each with an axial rotation controlled from one side, as shown in Figure 4 (left). The bare slat structure is made of 3D-printed polycarbonate and weighs 70 g, as seen in Figure 4 (right). With the addition of a 1 mm lumber slat (80 g) attached to its structure, the total weight of one rotating unit is 150 g. The lumber surface is coated with a 0.18 mm thick aluminium tape, providing an 80% reflective surface, as shown in Figure 5. Each slat surface measures 90 cm long and 8.5 cm wide, with a consistent spacing of 7.78 cm between them, to create a number of 9 slats.
The daylight intensity was monitored using two lux meters positioned at different distances from the window. Measurements were taken during the daytime, from 9 a.m. to 5 p.m., to determine the accurate distribution efficiency.
In response to solar radiation fluctuations, a 0.4 mm thick thermochromic layer was added over the aluminium layer to control the intensity of the reflected solar radiation and keep it relatively stable within a reasonable level (i.e., 300–500 lux). Thermochromic films can change their colour and optical properties in response to temperature fluctuations from solar radiation, and they perform actively with no need for electricity [40].
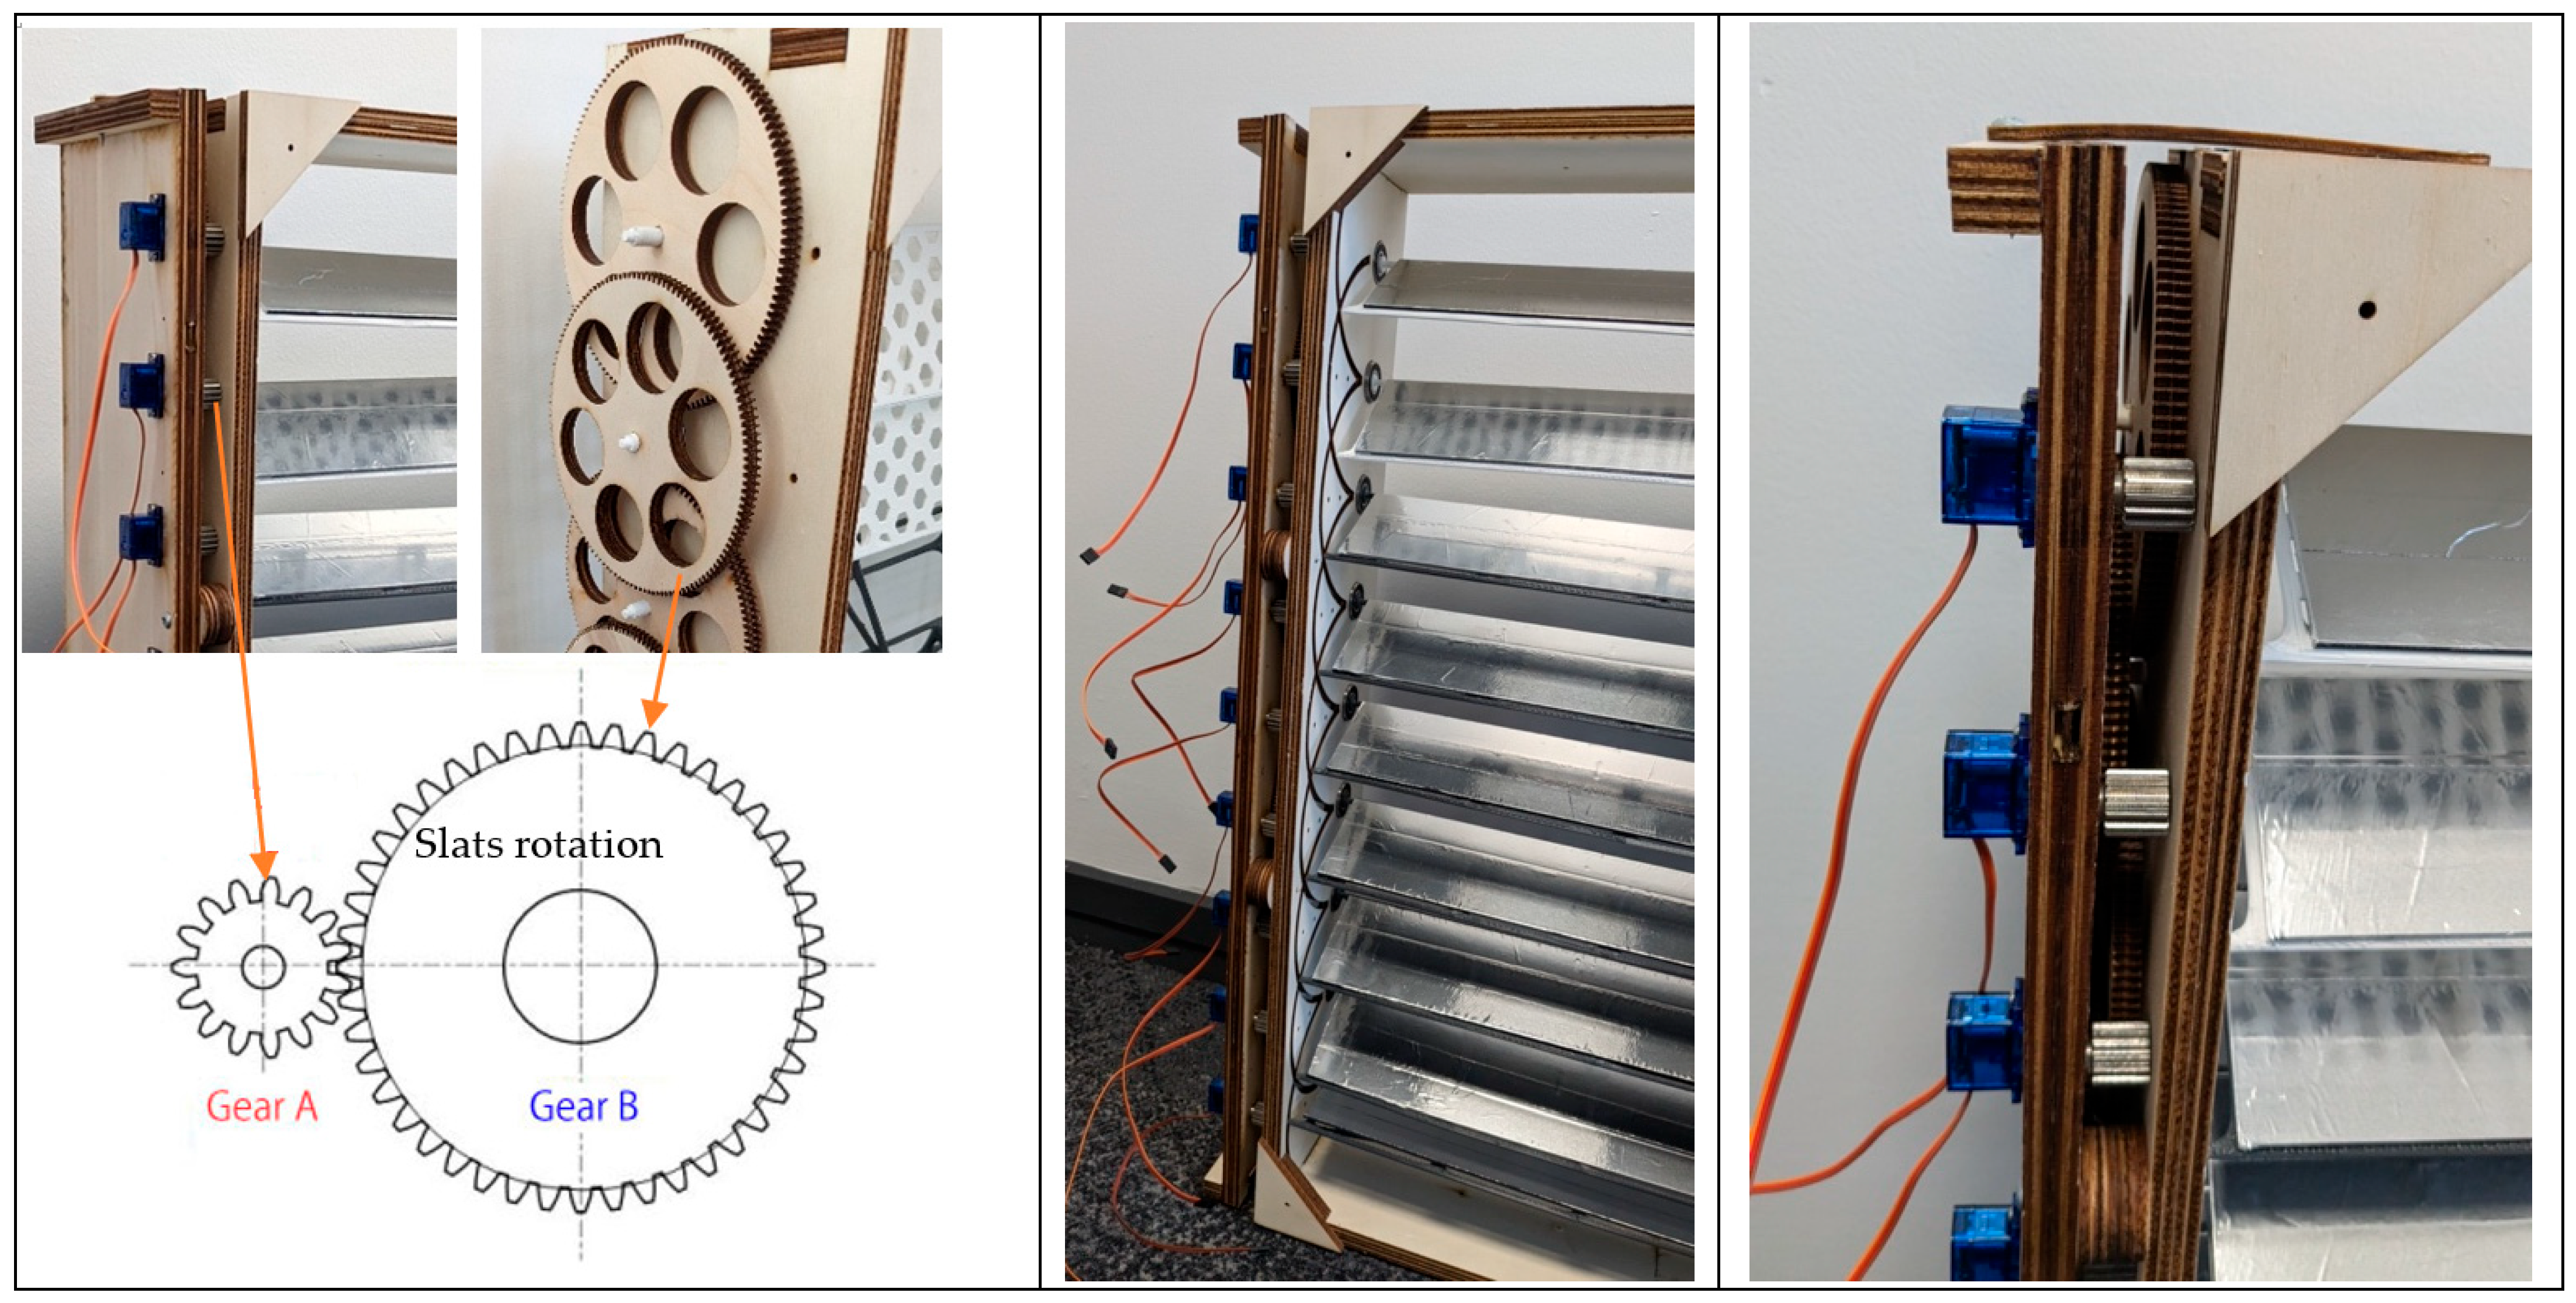
The rotating slats are connected to customized gears, which are driven by servo motors controlled by an Arduino Mega 2560 board. Each servo motor has a step accuracy of 1 degree and a 180-degree rotation range. To achieve higher accuracy, the slats’ rotation requires smaller steps (i.e., 10 steps for each one-degree rotation). Therefore, this rotation must be transferred through a conversion mechanism that can reduce the amount of rotation, as shown in Figure 6. The number of teeth on the gears was calculated using a formula in Grasshopper based on the specified rotating angles, which can achieve an accuracy of 0.1 degrees per rotation.
It is worth mentioning that the slat width of 8.5 cm with a total of 9 slats was chosen for easy manipulation of this preliminary experimental model to validate its performance and applicability. According to the findings in [21], deploying a greater quantity of 18 slats, each 4.2 cm wide, as seen in Figure 7, can achieve better daylight uniformity and glare control for enhanced visual comfort. This size is also ideal in case of integration within a double-glazing assembly system. Theoretically, the 18-slat system is considered a more feasible and better-optimized system [21]. However, for a more effective prototype demonstration, a one-sided control with 9 slats was utilised.

2.3. Utilising Hybrid Lighting for Compensation

To ensure consistent illumination across the room, 21 LED bulbs (14 W each) were installed 3 m above the floor to supplement any lack of natural daylight. These bulbs are strategically arranged in a 7 × 3 grid pattern (7 rows, 3 bulbs per row), as shown in Figure 8. An automated control system monitors the illuminance level at 21 pre-defined points on the floor (as patches). If the average illuminance at any patch drops below 300 lux, the corresponding bulb automatically switches on to maintain adequate lighting. This ensures consistent working conditions at the desk level (0.7 m from the floor) throughout the day, regardless of natural daylight fluctuations.
The system also calculates the total electrical energy consumed by the artificial lighting system, based on Table 1. To estimate the daily electricity consumption to light a 5 × 8 m office (a total area of 40 m2), considering a desk level of 0.7 m and an illuminance range of 300–500 lux (an average of 400 lux), the following steps should be followed:
  • Required Lumens on the work plane from the daylight source = (target illuminance) X (work plane area Lumens) = 400 lux × 40 m2 = 16,000 lm.
  • The illuminance at the desk level from the ceiling lights bulbs can be estimated using the Lumens per Watt (lm/W) of the LED lights and the Coefficient of Utilization (CU).
  • The efficiency of LED light usually ranges from 80–150 lm/W, i.e., an average value of 100 lm/W.
  • The Coefficient of Utilisation (CU) can be estimated as 0.7 (typical for offices with average reflectance) according to light loss due to factors like room dimensions, fixture type, and ceiling/surface reflectance.
  • Required illuminance at the work plane = Target illuminance/CU = 400 lux/0.7 = 571 lux
  • Lumens delivered by the light fixture = Required illuminance at work plane (considering loss) x Work plane area = 571 lux × 40 m2 = 22,840 lm
  • The required watts = Lumens from fixture/LED efficiency = 22,840 lm/100 lm/W = 228.4 Watts
  • Daily watt-hours = required watts x lighting duration Daily watt-hours = 228.4 W × 9 h = 2055.6 watt-h s (By Assuming the light is on for 9 h a day).
Thus, the estimated daily power consumption to light the office for the desired illuminance level at desk height would be around 2055.6 watt-hours. The actual wattage and lumens delivered by a light fixture will vary depending on the specific model and its technical specifications. A more accurate calculation would involve software that simulates light distribution in the space, considering factors like fixture type, placement, and reflectance. Additionally, this estimation does not account for potential dimming or control systems that could reduce energy consumption, which in turn would reduce associated carbon emissions.

3. Results and Discussion

3.1. The DLS Physical Prototype Performance

The DLS successfully reflected daylight over the ceiling, providing a continuous and evenly distributed amount of light, as shown in Figure 9. The monitored illuminance was relatively stable, ranging between 420–470 lux, which is attributed to the thermochromic layer that efficiently controlled the intensity level. This output was obtained under sunny, clear-sky conditions with a relatively stable illuminance intensity for two consecutive hours. For such a study, this one-sided controlled system served as a preliminary experiment to validate the DLS’s automation control and its ability to respond to sunlight movement while ensuring light distribution and stability performance. The prototype demonstrated that the automated gears responded parametrically to the sun movement, successfully achieving the minimum required illuminance level. One should bear in mind that under clear-sky conditions at noon time, the solar radiation intensity at Edinburgh’s latitude is around 1000 W/m2. However, this value drops significantly during winter months due to the shorter day hours and lower sun angle, in addition to any cloudy-sky conditions. For a more comprehensive approach in this study, the annual daylight performance was analysed using virtual simulation in Grasshopper, as described in the following Section 3.2.

3.2. Energy Savings by the DLS: Calculation Analysis

Data presented in Table 2 and Figure 10 reveals a seasonal variation in daylight availability. The contribution of daylight illumination is minimal in December and January due to the low solar altitudes experienced in Edinburgh during the winter months. This trend of daylight improves from February to September before diminishing again in December.
Promisingly, the proposed system demonstrates a significant reduction in electrical lighting energy consumption throughout the year. Reference Table 2 indicates an average energy saving of 53%, which would result in similar figures for carbon savings when considering the energy and emission factors of grid electricity (0.20705 kg CO2e per kWh). To validate these findings, we compared the estimated and simulated electrical light consumption for illuminating a 5 × 8 m2 room during daytime (9 h) to achieve a target illuminance of 400 lux. The estimated consumption was 2055.6 watt-hours, based on the calculations in Section 2.3, while the simulated consumption averaged 2646 watt-hours, equivalent to 0.55 kg CO2e per kW, based on an illuminance range of 300–500 lux. This close correspondence validates the reasonableness of the simulated figures.
The data provides a reasonable insight into the interplay between natural and artificial light inside the room throughout the year. Hourly measurements, spanning from 9:00 a.m. to 5:00 p.m. on representative days across the months, detail the percentage contribution of daylight and electric lighting, the number of active light bulbs, and the cumulative electrical energy consumed for illumination. This analysis aims to synthesize the dynamic relationship between daylight availability and the need for supplemental artificial lighting.
A clear seasonal pattern emerges from the average monthly contributions analysis. During the summer months of June to August, the average daylight contributions are the highest (74%, 72%, and 63%, respectively). This dominance of natural light naturally correlates with lower average electric light contributions (32%, 43%, and 43%) and a reduced reliance on artificial sources, as evidenced by the lower number of bulbs in use and the diminished cumulative energy consumption for lighting (672 Wh, 714 Wh, and 966 Wh). These figures indicate a significant potential for energy savings during the peak daylight hours in summer. However, it should be considered that even within these sunny months, the data reveals specific hours when electric lighting is still necessary. This suggests that despite abundant daylight, artificial supplementation is required to meet the illumination levels.
The transitional periods of spring (April and May) and early autumn (September) present a more balanced scenario. April and May show strong daylight contributions (77% and 78% average, respectively), leading to a moderate electric lighting demand (22% and 32% average contribution). However, September indicates a noticeable shift, with the average daylight contribution dropping to 49% and the electric light contribution rising to 63%, reflecting the reduced daylight hours and lower solar angles. The corresponding energy consumption figures for these months fall within a mid-range, reflecting the mixed reliance on both natural and artificial sources.
The winter months of December, January, February, and (incompletely represented) October and November are characterized by the lowest average daylight contributions. January and November, in particular, show a high dominance of electric lighting, with average daylight contributions of around 19% and 24%, respectively, leading to high average electric light contributions (75% and 67%). The number of bulbs in use and the cumulative energy consumption for lighting reached their peak during these months, recording the significant energy burden associated with compensating for limited natural light availability. Interestingly, February and October exhibit slightly improved average daylight contributions (59% and 51%), suggesting some intra-seasonal variability within the winter period. The missing daylight contribution for December provides a complete picture of late winter performance that indicates a total reliance on artificial lighting.
Beyond the broad seasonal patterns, the hourly data reveals a consistent diurnal trend. Across most months, the daylight contribution tends to peak around midday (12:00 p.m.–1:00 p.m.), coinciding with the highest solar altitude. During this time, the percentage of electric light contribution is typically at its lowest. Conversely, the early morning hours (9:00 a.m.–10:00 a.m.) and the late afternoon (4:00 p.m.–5:00 p.m.) consistently exhibit lower daylight contributions and a corresponding increase in electric lighting use, due to steep solar altitudes, as shown in Figure 11.
The implications of this data for daylighting design are significant. The substantial reliance on electric lighting, particularly during the winter months and the early and late hours of the day throughout the year, underlines the limitations of solely depending on uncontrolled daylight.
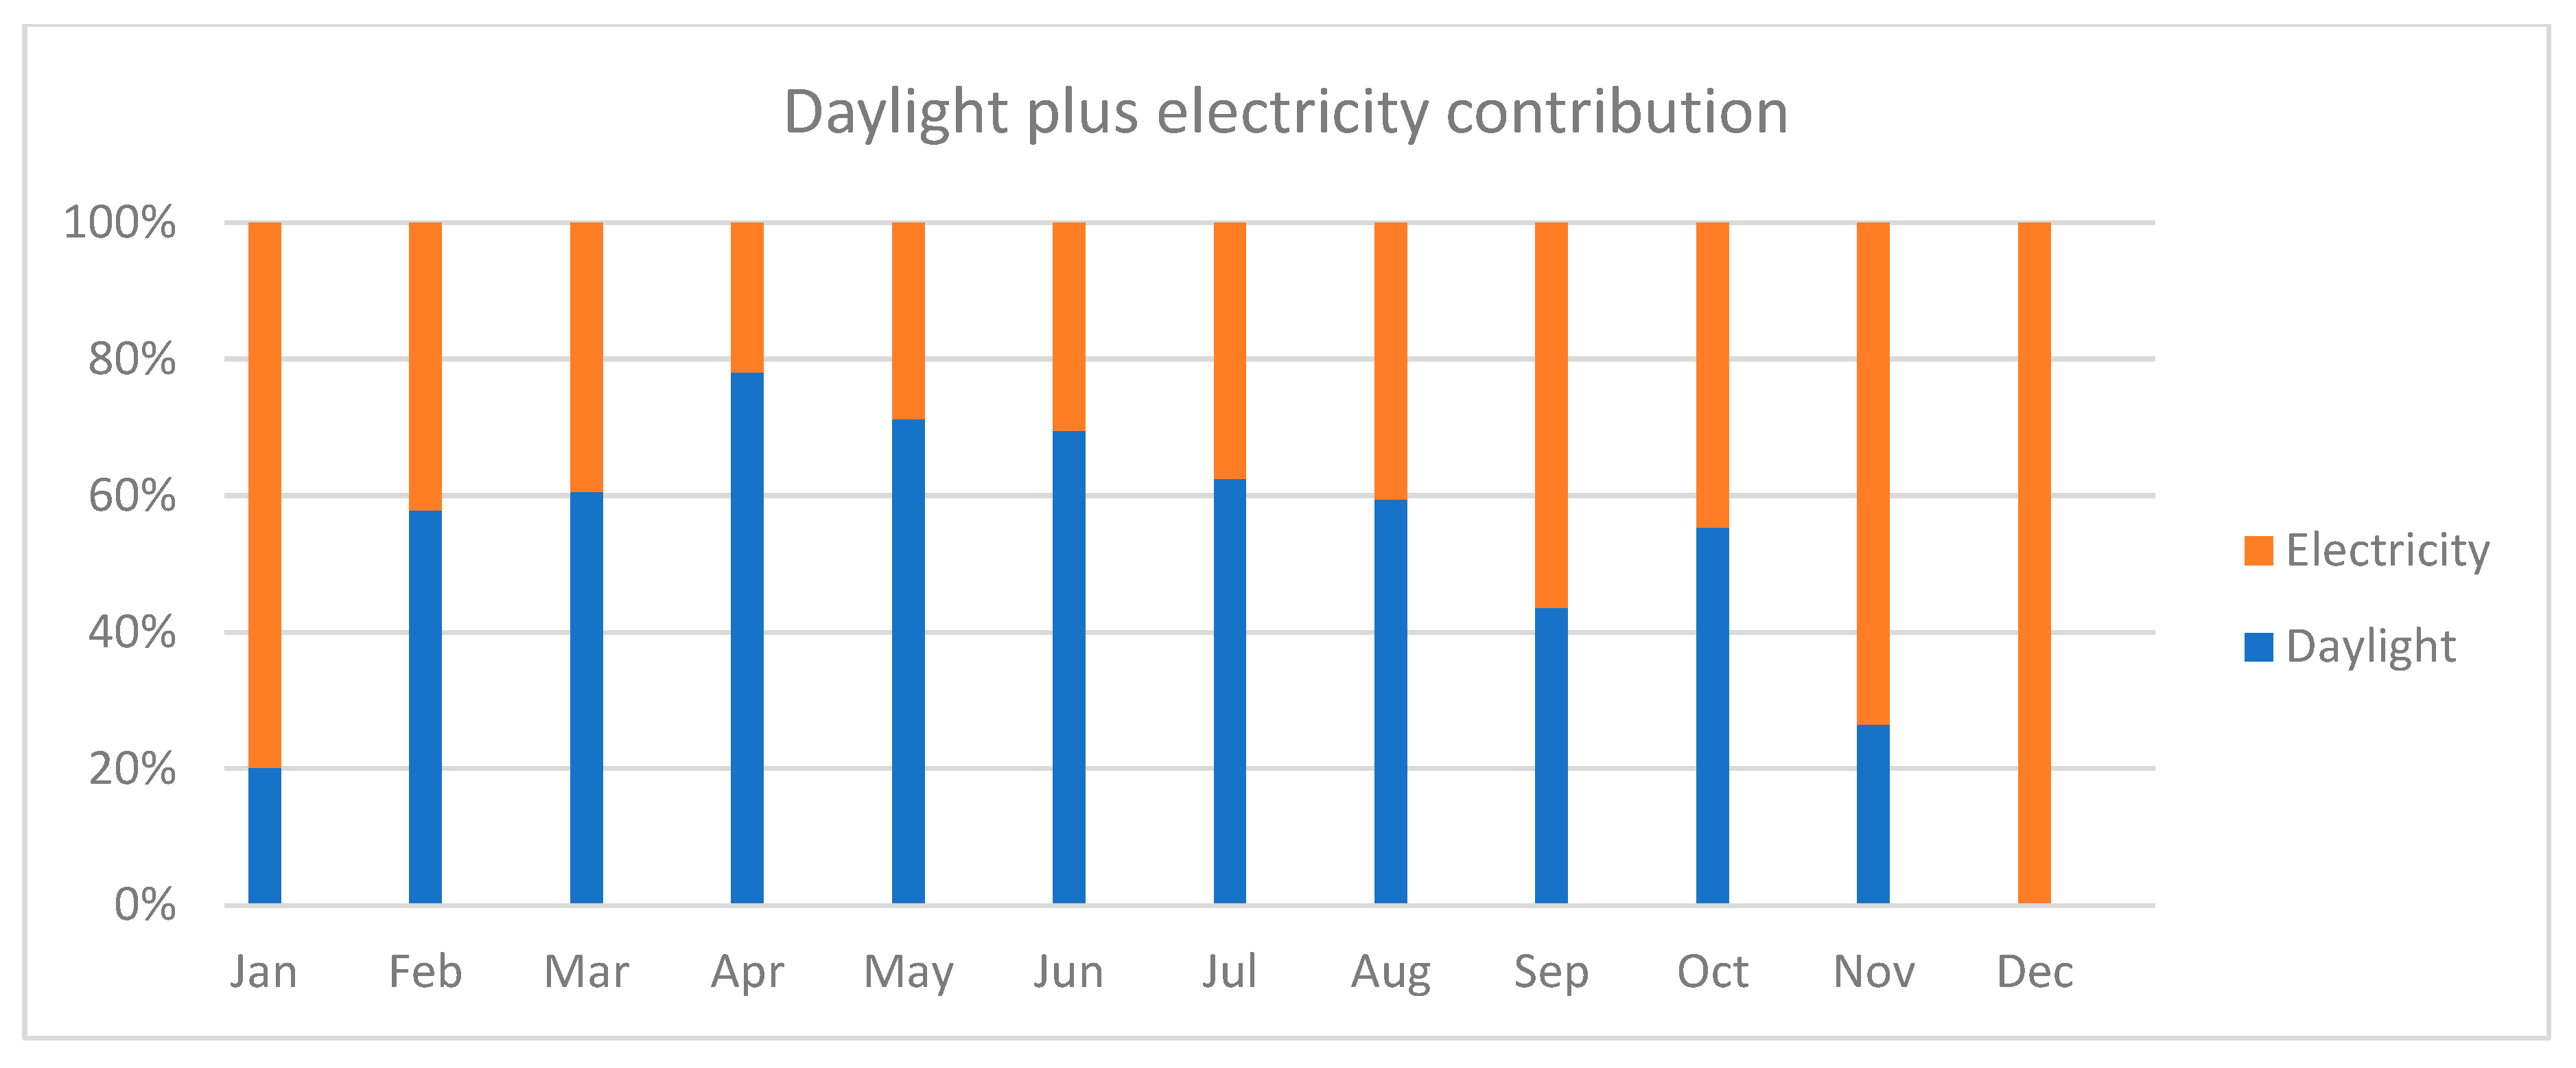
Finally, Table 2 was used to calculate the electrical lighting consumption if the lights were to remain on throughout the day (a December case). This translates to a daily consumption of 2646 watt-hours during the 9 h daytime period. The data in Table 2 have been summarised into Figure 12 to reveal the daily percentage contribution amount of electrical light that compensates for any lack of daylight during the daytime. Assuming lights are switched on only on the 21st day of each month to represent that month’s solar performance, the total consumption for 12 days would be 31,752 watt-hours. In contrast, using the DLS to supplement electrical lighting (assuming one LED bulb consumes 14 watts) reduces the cumulative consumption to 14,616 watt-hours. This results in 54% energy and carbon savings. Effective daylighting strategies must aim at maximizing the penetration of natural light during periods of availability while mitigating potential drawbacks such as glare and excessive heat gain. The data presented here strongly supports the need for such dynamic control, particularly in maximizing daylight availability during the winter and controlling intensity during peak summer hours.

3.3. Limitations and Factors Influencing Efficiency of Daylight

It is important to acknowledge that the observed energy savings from the DLS are relatively modest due to several factors. Firstly, the geographical location of Edinburgh, situated in the north with low solar altitudes throughout most of the year, particularly in winter, significantly reduces daylight influence. Secondly, the room width is another crucial factor affecting daylight coverage. As shown in Figure 11, the influence of dimly lit areas at 10:00 a.m. and 4:00 p.m. would be less pronounced in a larger room. Note that the images in Figure 11 are based on a fisheye camera for a mannequin view generated by Radiance in Grasshopper. As mentioned previously, the mirrored slats are designed to reflect incident sunlight onto specific targets over the ceiling. However, their response to solar altitude alone, and not azimuth, causes the reflected light to form a parallel beam that moves horizontally, parallel to the window. Accordingly, this explains the presence of dim diagonal areas observed in the early and late times of the day.
For instance, considering a 30-degree solar azimuth angle relative to the window, an 8 m deep room would have an uncovered area of approximately 5 m, creating a triangular dim area. This can be seen in our case of the 5 m wide room for the limited daylight coverage observed in Figure 10 in May. However, for larger spaces, such as workstations or lecture rooms with a width exceeding 20 m, the uncovered area becomes negligible compared to the lit area. To illustrate, if the room depth is 8 m and the width is 8 m at a solar azimuth of 45 degrees at 4 p.m., the illuminated area would cover 50% of the room. However, if this room width increases to 12 m, this lit area will expand, and the dim triangle can only occupy ~15% of the total area (at 4 p.m.).
A previous theoretical study related to this system investigated a two-axis system that dramatically solved the early/late daylight issue [39]. That approach proved to be overly complex in practice, requiring extensive controls and maintenance, which compromises its feasibility. Our current system directly addresses this limitation by introducing a more practical hybrid control model. This model uses real-time luminance sensors to seamlessly integrate and activate electrical lighting, effectively compensating for any lack of daylight throughout the day, especially during early and late hours.
Overall, Figure 10 clearly demonstrates that the system performs efficiently during months with relatively lower solar altitudes, achieving near-complete daylight coverage from March to August, with a slight decrease in September and October. On the other hand, in higher-altitude territories, in addition to using a two-sided controlled system of 18 slats, the potential of the daylight performance could promisingly improve by 20%, especially at oblique angles with lower altitudes and steep azimuths in the morning and late hours.
The reason for using 9 slats in this study (with one-sided control) was to demonstrate the system’s operational method in a simple and clear manner. The design was constrained by the need to maintain a manageable level of complexity for the prototype. Using 18 slats would have introduced a more intricate mechanism, requiring additional servo motors and more complex interconnections from both sides. This would have necessitated a higher level of assembly accuracy and the use of more robust materials, such as acrylic or an aluminium frame, which was not feasible due to the limited funding available for the prototype. Thus, this experimental work was done to validate the system’s feasibility and practicality for a potential application. Considering different orientations for the DLS, a detailed investigation of this system for other orientations has been comprehensively covered in a separate research work of this system [37].

4. Conclusions

This research investigated the influence of a Daylight Louver System (DLS) as a sustainable application for reducing electrical lighting consumption in office environments, which consequently impacts its associated carbon emissions. The prototype of the DLS uses a parametrically controlled system of rotating slats to reflect and distribute natural daylight deeper into the room, achieving more uniform and comfortable illumination.
The findings demonstrate the DLS’s potential to contribute significantly to energy-efficient building design. The system achieved an average energy saving of 53% throughout the year through optimized daylight utilization within the target workspace. Notably, the DLS exhibited near-complete daylight coverage during months with favourable solar altitudes (March to August). Additionally, a comparison between estimated and simulated electrical light consumption revealed a close correspondence, validating the accuracy of the simulated results.
The DLS offers advantages beyond energy savings. Increased exposure to natural daylight has been linked to various health and productivity benefits for building occupants, as well as a reduction in carbon dioxide emissions. Improved visual comfort, reduced glare, and more natural circadian rhythm regulation are just some of the documented advantages. Furthermore, the potential for this system to be used in other building types, such as educational and healthcare facilities, stems from its ability to provide consistent and evenly distributed daylight, which is essential for creating visually comfortable environments. In educational settings, this visual comfort is crucial for a student’s focus and learning. Furthermore, natural light is vital for regulating the human circadian rhythm, which influences sleep–wake cycles and overall well-being. This is particularly beneficial in healthcare settings, where a patient’s recovery and staff’s cognitive function can be positively affected by a healthy body clock. Therefore, the system’s capacity to provide stable natural light positions it as a valuable asset for both educational and healthcare facilities. Widespread adoption of the DLS across these sectors could contribute significantly to overall energy efficiency within the built environment.
A key innovation of this system is its affordability and functionality. By using low-cost Arduino boards and actuators for control, alongside a thermochromic layer for automatic light intensity management, the DLS achieves promising performance compared to traditional static or even dynamic daylighting systems. This combination enables stable daylight distribution, protects from direct sunlight, minimizes reliance on electrical lighting through effective daylight harvesting, and even introduces the possibility of active energy generation via solar cells. This represents a significant paradigm shift, making the DLS a promising solution for sustainable buildings. While the research demonstrates the DLS’s benefits, it is crucial to acknowledge its limitations. The geographical location of the study (Edinburgh), with its relatively lower winter sun angles, impacted the system’s performance during those months. Additionally, the room size influenced daylight distribution, with smaller spaces experiencing more pronounced areas of limited daylight penetration.
This study presents a novel approach to daylighting systems, distinguished by its integration of supplementary electrical lighting to ensure constant, well-distributed illumination and achieve visual comfort throughout the daytime. A key contribution of this research is the quantification of potential electrical energy savings, particularly under challenging, worst-case scenarios like the short days and low solar altitudes of winter. Furthermore, the work distinguishes itself from previous purely theoretical investigations by validating the system’s feasibility and practicality for real-world application through the use of a simplified control mechanism. In summary, this study is novel for four main reasons: (1) it integrates hybrid lighting, (2) it ensures visual comfort, (3) it analyses worst-case scenarios, and (4) it validates practical application.
This research contributes to the development of sustainable building design solutions. The DLS demonstrates a practical approach to reducing reliance on artificial lighting and promoting energy-efficient buildings. In conclusion, the DLS presented in this preliminary prototype offers promising pathways toward creating more energy-efficient and visually comfortable indoor environments by effectively harnessing the ever-changing resource of natural daylight. Future efforts should focus on translating these research concepts into practical applications and evaluating their performance across diverse building types and climatic conditions in the long term to fully realize the potential of daylighting in reducing our reliance on artificial illumination. Additionally, exploring the integration of the DLS with AI systems for real-time control and optimization could further enhance its efficiency. This design solution also encourages the use of carbon offset methodologies and the adoption of such reliable energy simulation technologies.

Author Contributions

Conceptualization, A.E. and I.S.; methodology, A.E. and I.S.; software, A.E.; validation, A.E. and M.A.; formal analysis, A.E.; investigation, A.E., I.S. and M.A.; resources, A.E.; data curation, I.S. and J.A.; writing—original draft preparation, A.E.; writing—review and editing, I.S. and J.A.; visualization, M.A.; supervision, I.S.; project administration, A.E.; funding acquisition, A.E. All authors have read and agreed to the published version of the manuscript.

Funding

This research was funded by Edinburgh Napier University, Starter Grant number [Grant 21/22].

Institutional Review Board Statement

Not applicable.

Informed Consent Statement

Not applicable.

Data Availability Statement

The original contributions presented in this study are included in the article material. Further inquiries can be directed to the corresponding author.

Conflicts of Interest

The authors declare no conflict of interest.

References

  1. Habibi, S. Micro-climatization and real-time digitalization effects on energy efficiency based on user behavior. Build. Environ. 2017, 114, 410–428. [Google Scholar] [CrossRef]
  2. Wigginton, M.; Harris, J. Intelligent Skins; Routledge: London, UK, 2013. [Google Scholar]
  3. El Daly, H.M.T. Automated fenestration allocation as complying with LEED rating system. Alex. Eng. J. 2014, 53, 883–890. [Google Scholar] [CrossRef]
  4. Kontadakis, A.; Tsangrassoulis, A.; Doulos, L.; Topalis, F. An active sunlight redirection system for daylight enhancement beyond the perimeter zone. Build. Environ. 2017, 113 (Suppl. C), 267–279. [Google Scholar] [CrossRef]
  5. Konis, K.; Gamas, A.; Kensek, K. Passive performance and building form: An optimization framework for early-stage design support. Sol. Energy 2016, 125, 161–179. [Google Scholar] [CrossRef]
  6. Turrin, M.; Von Buelow, P.; Kilian, A.; Stouffs, R. Performative skins for passive climatic comfort: A parametric design process. Autom. Constr. 2012, 22, 36–50. [Google Scholar] [CrossRef]
  7. Ramzy, N.; Fayed, H. Kinetic systems in architecture: New approach for environmental control systems and context-sensitive buildings. Sustain. Cities Soc. 2011, 1, 170–177. [Google Scholar] [CrossRef]
  8. Henriques, G.C.; Duarte, J.P.; Leal, V. Strategies to control daylight in a responsive skylight system. Autom. Constr. 2012, 28, 91–105. [Google Scholar] [CrossRef]
  9. Eltaweel, A.; Su, Y.; Hafez, M.; Eltaweel, W. An automated louver with innovative parametrically-angled reflective slats: Prototyping and validation via using parametric control in Grasshopper along with Arduino board. Energy Build. 2021, 231, 110614. [Google Scholar] [CrossRef]
  10. Shao, Z.; Chen, X.; Yao, T.; Hu, K.; Ding, S.; Xu, Y.; Sun, L. Indoor daylighting quality optimization methods of a novel linear transmissive concentrator-photovoltaic/daylighting system in overcast conditions. J. Clean. Prod. 2024, 484, 144314. [Google Scholar] [CrossRef]
  11. Kent, M.G.; Altomonte, S.; Tregenza, P.R.; Wilson, R. Discomfort glare and time of day. Light. Res. Technol. 2015, 47, 641–657. [Google Scholar] [CrossRef]
  12. Kent, M.G.; Altomonte, S.; Wilson, R.; Tregenza, P.R. Temporal effects on glare response from daylight. Build. Environ. 2017, 113, 49–64. [Google Scholar] [CrossRef]
  13. Boubekri, M. Daylighting, Architecture and Health; Routledge: London, UK, 2008. [Google Scholar]
  14. Heidari, B.; Abravesh, M.; Khodabakhshian, M. Human-centric lighting in office spaces: Daylight strategies and environmental influences on visual effects and circadian health. Build. Environ. 2025, 285, 113538. [Google Scholar] [CrossRef]
  15. Bellia, L.; Fragliasso, F. Automated daylight-linked control systems performance with illuminance sensors for side-lit offices in the Mediterranean area. Autom. Constr. 2019, 100, 145–162. [Google Scholar] [CrossRef]
  16. Bellia, L.; Fragliasso, F. Evaluating performance of daylight-linked building controls during preliminary design. Autom. Constr. 2018, 93, 293–314. [Google Scholar] [CrossRef]
  17. Littlefair, P.J.; Aizlewood, M.E.; Birtles, A.B. The performance of innovative daylighting systems. Renew. Energy 1994, 5, 920–934. [Google Scholar] [CrossRef]
  18. Littlefair, P.J. Review Paper: Innovative daylighting: Review of systems and evaluation methods. Light. Res. Technol. 1990, 22, 1–17. [Google Scholar] [CrossRef]
  19. Mayhoub, M.S. Fifty years of building core sunlighting systems—Eight lessons learned. Sol. Energy 2019, 184, 440–453. [Google Scholar] [CrossRef]
  20. Nezamdoost, A.; Van Den Wymelenberg, K.; Mahic, A. Assessing the energy and daylighting impacts of human behavior with window shades, a life-cycle comparison of manual and automated blinds. Autom. Constr. 2018, 92, 133–150. [Google Scholar] [CrossRef]
  21. Eltaweel, A.; Su, Y.; Mandour, M.A.; Elrawy, O.O. A novel automated louver with parametrically-angled reflective slats; design evaluation for better practicality and daylighting uniformity. J. Build. Eng. 2021, 42, 102438. [Google Scholar] [CrossRef]
  22. Tsangrassoulis, A. A review of innovative daylighting systems. Adv. Build. Energy Res. 2008, 2, 33–56. [Google Scholar] [CrossRef]
  23. Hashemi, A. Daylighting and solar shading performances of an innovative automated reflective louvre system. Energy Build. 2014, 82, 607–620. [Google Scholar] [CrossRef]
  24. Mayhoub, M.S. Innovative daylighting systems’ challenges: A critical study. Energy Build. 2014, 80, 394–405. [Google Scholar] [CrossRef]
  25. Koo, S.Y.; Yeo, M.S.; Kim, K.W. Automated blind control to maximize the benefits of daylight in buildings. Build. Environ. 2010, 45, 1508–1520. [Google Scholar] [CrossRef]
  26. Eltaweel, A.; Su, Y. Evaluation of Suitability of a Parametrically Controlled Louvers for Various Orientations throughout a Year Comparing to an Existing Case. Buildings 2017, 7, 109. [Google Scholar] [CrossRef]
  27. Konstantoglou, M.; Tsangrassoulis, A. Dynamic operation of daylighting and shading systems: A literature review. Renew. Sustain. Energy Rev. 2016, 60, 268–283. [Google Scholar] [CrossRef]
  28. Wu, S.; Lu, W.Z.; Qin, C.; Wen, B.; Wu, D.; Xiang, Y. A goal-oriented planning approach for two-dimensional cutting components in architectural design: Coupling BIM and Parametric design (PD). J. Build. Eng. 2023, 76, 107156. [Google Scholar] [CrossRef]
  29. Tsangrassoulis, A.; Kostantoglou, M.; Kontadakis, A. Lighting energy savings due to the use of a sun tracking mirrored lightself in office buildings. In Proceedings of the 3rd International Conference “ENERGY in BUILDINGS 2014, Visby, Sweden, 26–27 September 2018; ASHRAE Hellenic: Athens, Greece, 2014. [Google Scholar]
  30. Dogan, T.; Stec, P. Prototyping a façade-mounted, dynamic, dual-axis daylight redirection system. Light. Res. Technol. 2018, 50, 1477153516675392. [Google Scholar] [CrossRef]
  31. Jamilu, G.; Abdou, A.; Asif, M. Dynamic facades for sustainable buildings: A review of classification, applications, prospects and challenges. Energy Rep. 2024, 11, 5999–6014. [Google Scholar] [CrossRef]
  32. Andia, A.; Spiegelhalter, T. Post-Parametric Automation in Design and Construction; Artech House: New York, NY, USA, 2014. [Google Scholar]
  33. Vu, D.T.; Nghiem, V.T.; Tien, T.Q.; Hieu, N.M.; Minh, K.N.; Vu, H.; Shin, S.; Vu, N.H. Optimizing optical fiber daylighting system for indoor agriculture applications. Sol. Energy 2022, 247, 1–12. [Google Scholar] [CrossRef]
  34. Lv, Y.; Xia, L.; Yan, J.; Bi, J. Design of a Hybrid Fiber Optic Daylighting and PV Solar Lighting System. Energy Procedia 2018, 145, 586–591. [Google Scholar] [CrossRef]
  35. Wang, Y.; Chen, Y.; Liu, Y.; Hu, P.; Lei, Y.; Liang, M.; Li, B. Closed-loop intelligent lighting for precision dimming under non-uniform illuminance and dynamic daylight compensation. Build. Environ. 2025, 281, 113230. [Google Scholar] [CrossRef]
  36. Ahmed, R.; Oh, S.J.; Mehmood, M.U.; Kim, Y.; Jeon, G.; Han, H.J.; Lim, S.H. Computer vision and photosensor based hybrid control strategy for a two-axis solar tracker—Daylighting application. Sol. Energy 2021, 224, 175–183. [Google Scholar] [CrossRef]
  37. Eltaweel, A.; Yuehong, S. Using integrated parametric control to achieve better daylighting uniformity in an office room: A multi-Step comparison study. Energy Build. 2017, 152, 137–148. [Google Scholar] [CrossRef]
  38. Davidson, S. Grasshopper. Algorithmic Modeling for Rhino [Modelling Software] 2020. 2017: [Algorithmic Modeling for Rhino]. 2020. Available online: http://www.grasshopper3d.com/ (accessed on 15 June 2025).
  39. Eltaweel, A.; Su, Y.; Lv, Q.; Lv, H. Advanced parametric louver systems with bi-axis and two-layer designs for an extensive daylighting coverage in a deep-plan office room. Sol. Energy 2020, 206, 596–613. [Google Scholar] [CrossRef]
  40. Kamalisarvestani, M.; Saidur, R.; Mekhilef, S.; Javadi, F.S. Performance, materials and coating technologies of thermochromic thin films on smart windows. Renew. Sustain. Energy Rev. 2013, 26, 353–364. [Google Scholar] [CrossRef]
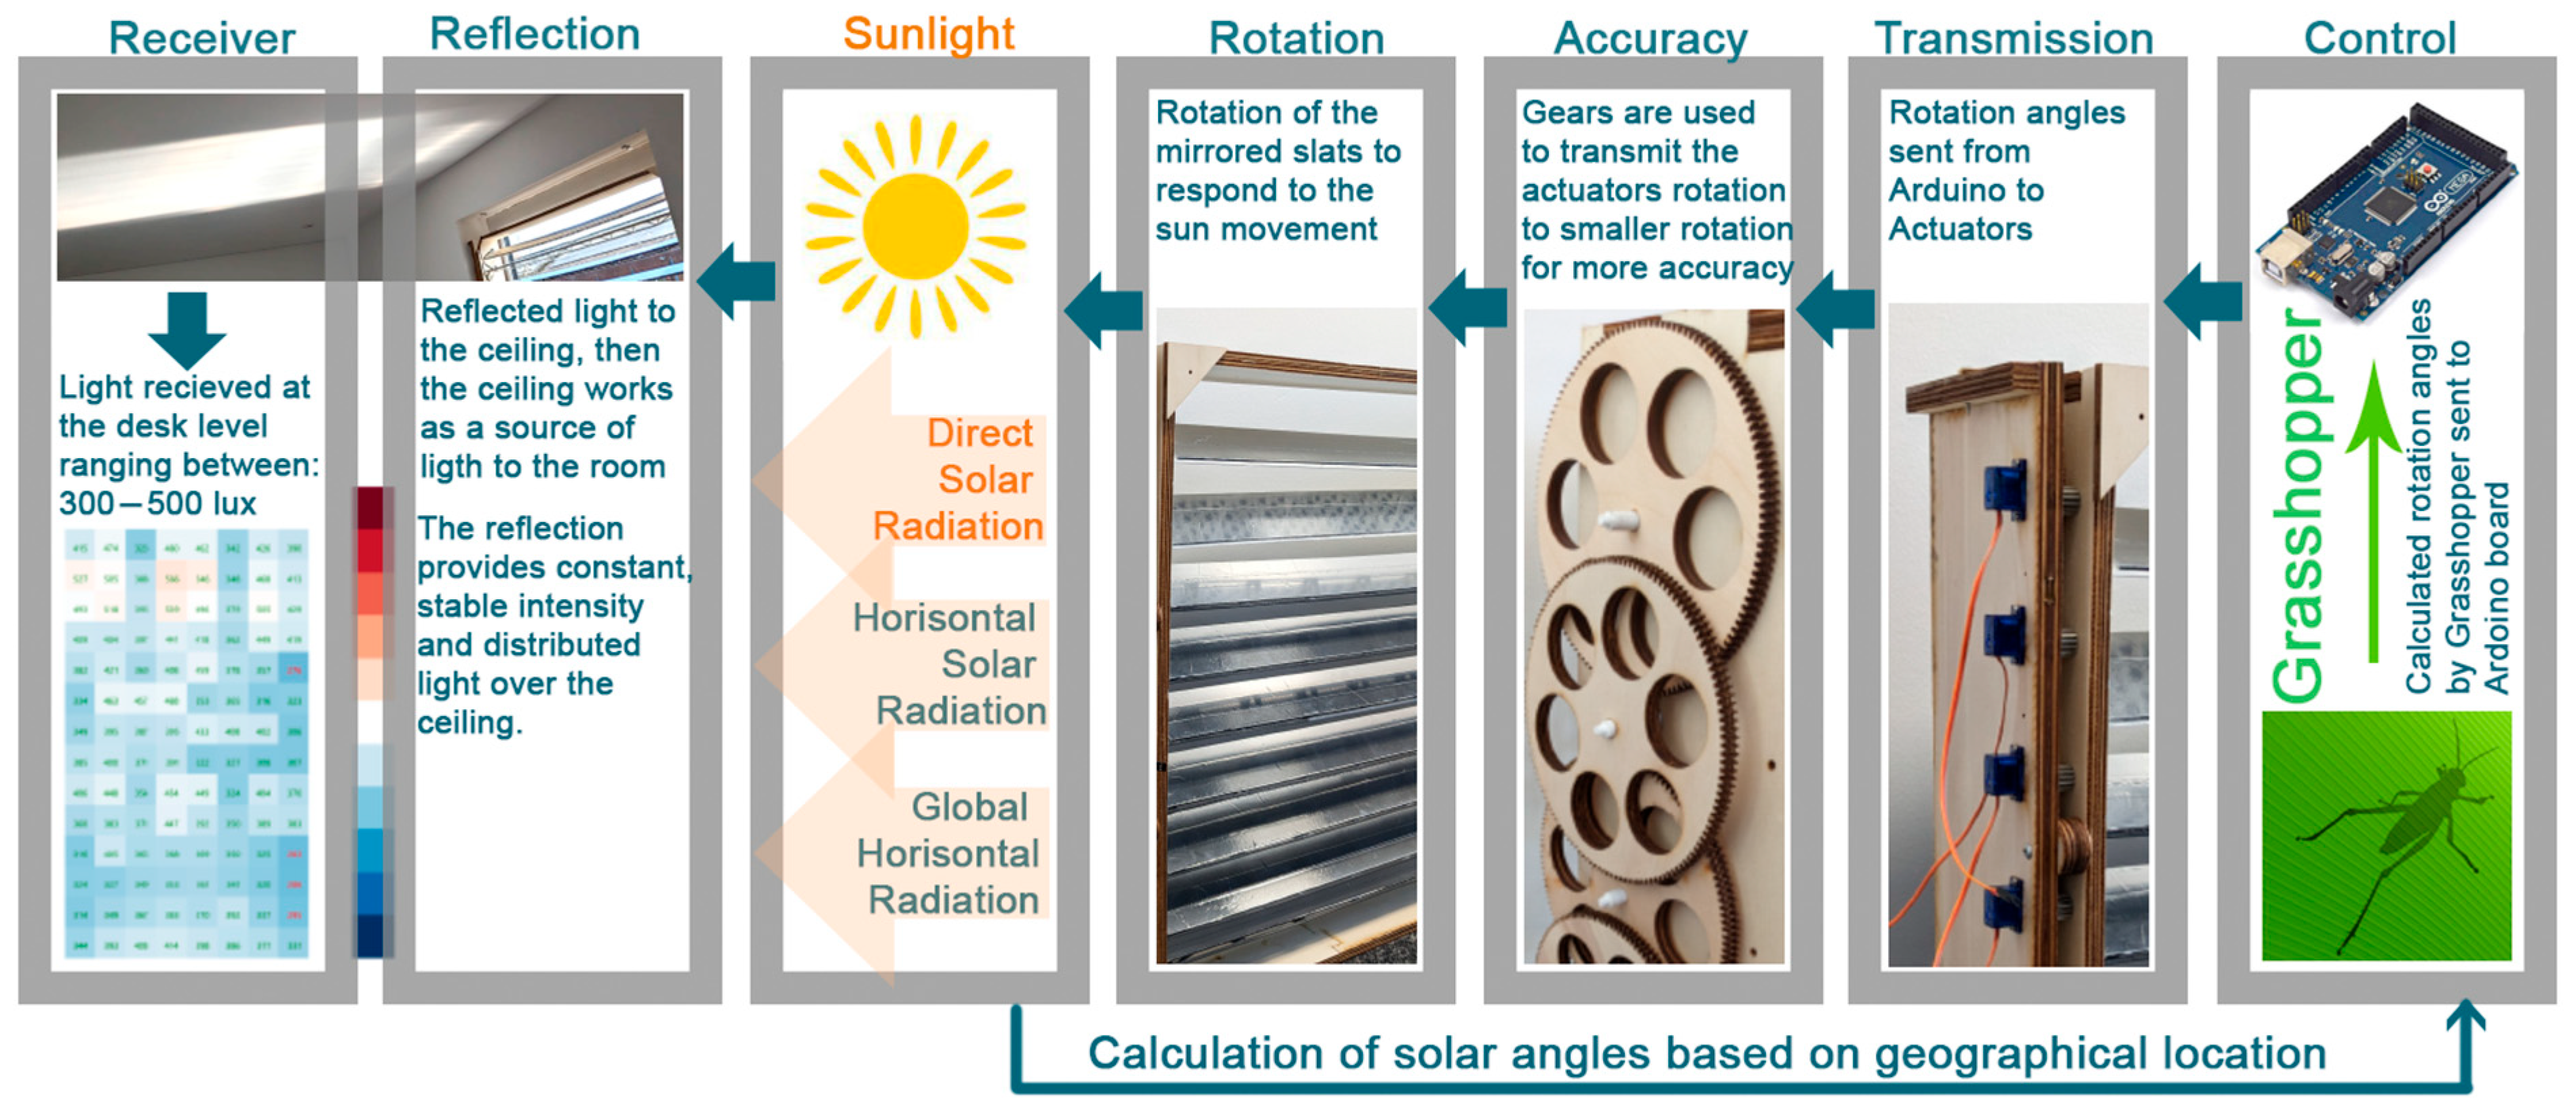
Figure 1. Summarised graph for the DLS process.
Architecture 05 00093 g001
Figure 2. Cross-sectional 3D diagram showing the DLS location inside the room at the upper part of the window under the lintel. A thermochromic window was used at the upper part to control the solar intensity, and electrochromic glazing was used at the lower part of the window to control the light transmittance [39].
Architecture 05 00093 g002
Figure 3. The DLS frame with 9 rotating slats drafted in AutoCAD 2021 (left) and the real image of the full prototype of the DLS (right).
Architecture 05 00093 g003
Figure 4. Slat rotation axis through a ball bearing for smooth rotation, the yellow line representing the rotation axis (left) and 3D-printed polycarbonate structure (right).
Architecture 05 00093 g004
Figure 5. CAD detailing for the rotating unit controlled from one side (dimensions in millimetres). The dashed circle representing the Gear B in Figure 6.
Architecture 05 00093 g005
Figure 6. Gear transition method to transfer the rotation from Servo Motors (1-degree rotation accuracy) to a higher-accuracy rotation (0.01-degree rotation accuracy), via using the Gear A that connected to the servo motor to transfer the rotation to Gear B which connected to the slats.
Architecture 05 00093 g006
Figure 7. CAD detailing for 18 rotating slats controlled from both sides.
Architecture 05 00093 g007
Figure 8. The 21 bulbs’ locations inside the room. The “red domes” indicted that the light at these specific patches is on, while the “red dots” indicate that the light bulbs are off. The yellow line representing the light tracing from the sun at 2 p.m. The color legend representing the illuminance intensity between 100 and 1000 lux.
Architecture 05 00093 g008
Figure 9. Daylight contribution from the DLS prototype at 2 p.m. in July.
Architecture 05 00093 g009
Figure 10. Daylight coverage average percentage inside the room (represented in purple bars)versus electricity supplement contribution (blue dots) during the 21st of each month.
Architecture 05 00093 g010
Figure 11. Fisheye shots showing lack of daylight at the early and late hours of the working hours during the daytime at 9 a.m., 10 a.m., 4 p.m. and 5 p.m., respectively.
Architecture 05 00093 g011
Figure 12. Daily average percentage of daylight plus electricity contribution for the 21st of each month.
Architecture 05 00093 g012
Table 1. Light bulb description.
▪ Luminaire Description: 51008.6 K3
▪ Lamp Catalog Number: LED 11.1 W
▪ Lamp Description: 892 lm
▪ Input Watts 14 W
▪ Luminaire Manufacturer: BEGA
▪ IES File Format Type: IESNA:LM-63-1995
▪ Photometry Type: C
▪ Diameter of Luminous opening 7.5 cm
Table 2. Daylight and electrical light average percentage for the year 2024 in the Edinburgh location. The “percentage figure” indicates the average of points inside the room that achieve illuminance levels between 300–500 lx at the desk level.
TimeJan 21st Feb 21stMar 21stApr 21stMay 21stJun 21stJul 21stAug 21stSep 21stOct 21stNov 21stDec 21st
9:00 a.m.-1001510048989879897893779239973895196-91-93
2121123331512212121
10:00 a.m.-9639989497969876988783813888-96
211561521
11:00 a.m.13958199859297971009797-96-98
212121
12:00 p.m.759898889594971008810088-98
21
1:00 p.m.7810099889398929770949692-96
321
2:00 p.m.79696969999989694689187-73-93
2132121
3:00 p.m.-96944593968985874895196-82-53-93
21121221212121
4:00 p.m.-93596-9538975696149922100-97-96-93-100-100
21212115921212121212121
5:00 p.m.-100-93-89-98-99-100299-98-98-100-100-100
212121212121212121212121
Ave % of Daylight contribution 1959647778747263495124-
Ave % of Elect. light contribution 754342223232434363416796
No. of bulbs/hr turned on during the day1477866363348516981105141189
Luminaire output for (9) h Watt-h205810929245044626727149661134147019742646
Color Legend%Full daylight contribution%Low daylight contribution%Electrical Light contributionCountNumber of bulbs turned on to compensate
Disclaimer/Publisher’s Note: The statements, opinions and data contained in all publications are solely those of the individual author(s) and contributor(s) and not of MDPI and/or the editor(s). MDPI and/or the editor(s) disclaim responsibility for any injury to people or property resulting from any ideas, methods, instructions or products referred to in the content.