Article

GIS Retrofitting Technique for Hong Kong Sports Center with a Large Hall

by
Ming-Lun Alan Fong
* and
Kai-Kwong Dennis Tsang
Division of Building Science and Technology, City University of Hong Kong, Hong Kong, China
*
Author to whom correspondence should be addressed.
Architecture 2023, 3(3), 410-427; https://doi.org/10.3390/architecture3030022
Submission received: 5 June 2023 / Revised: 28 June 2023 / Accepted: 29 June 2023 / Published: 4 July 2023
(This article belongs to the Topic Building Energy and Environment, 2nd Volume)

Highlights

What are the main findings?
  • These findings highlight the effectiveness of the GIS technique based on practical engineering judgment and simulation results in improving ventilation performance, reducing energy consumption, and optimizing thermal comfort in large-scale buildings in occupied zones.
  • Using the GIS retrofitting technique, sports canter allows for a significant increase of 1.5 ℃ in the supply temperature, leading to substantial energy savings while maintaining acceptable thermal comfort, a better Local Air Change Index (LCAI), Local Mean Age (LMA), and Air Diffusion Performance Index (ADPI) in comparison with the existing air distribution system.
What is the implication of the main finding?
  • The GIS technique is highly suitable for large volumes of space in Hong Kong and has become an effective way to achieve carbon neutrality.

Abstract

:
The energy consumption of air conditioning systems in large spaces is a concern due to inefficiencies caused by the high ceiling. This paper presents the Green aIr-distribution System (GIS) retrofitting technique as a solution to reduce energy consumption and optimize thermal comfort in a large Hong Kong sports center to achieve carbon neutrality. A comparison is made between the existing air distribution system with ceiling supply and return as baseline model and the GIS with occupied wall supply and ceiling return as retrofit models regarding ventilation performance, thermal comfort, and energy aspects. Computational fluid dynamics (CFD) is employed to analyze the average operative temperature, airspeed, and other thermal comfort parameters. The findings demonstrate that implementing the GIS in the large sports center allows for a 1.5 °C increase in the supply temperature without significantly compromising thermal comfort. The algorithm for developing GIS for the large space application is also discussed. Additionally, the GIS model exhibits notable improvements in ventilation factors, such as Local Mean Age (LMA), Local air change index (LACI), and Air Distribution Performance Index (ADPI), resulting in improved air quality and reduced energy use within the occupied space.

1. Introduction

The building sector, which accounts for around 90% of electricity consumption and approximately 66% of GHG emissions [1,2], is significant in meeting habitability needs and reducing energy consumption and environmental effects in Hong Kong. An energy-efficient building system is a solution. Various air distribution strategies, such as stratum and displacement ventilation, have been developed to reduce energy consumption. These systems focus on an occupied zone and an unoccupied area. However, they are limited to supply and exhaust air conditioning and lack information on room non-uniformity, especially for large spaces. These knowledge gaps may vary depending on the specific research focus of each article. More targeted research focuses on particular types of large spaces, such as warehouses, exhibition halls, or sports arenas. Tailoring ventilation strategies to the unique characteristics and requirements of different large space applications for further exploration [3,4,5]. Some references [6,7] study passive cooling techniques for large spaces, but there may be room for further research on the integration and effectiveness of various passive cooling strategies, such as natural ventilation, shading, and thermal mass utilization, in large space applications. Optimization of airflow distribution: References like [8,9,10] discuss airflow distribution control strategies, indicating an interest in optimizing the distribution of conditioned air in large spaces. However, there may be a need for additional research on advanced control algorithms, design approaches, and technologies to achieve improved airflow distribution and enhance indoor comfort and energy efficiency. Several references [11,12] compare different ventilation systems in terms of their impact on the indoor thermal environment, energy consumption, and occupant comfort. In large and high spaces, displacement ventilation seems more suitable than mixing and stratum ventilation. Mixing ventilation is better suited for smaller spaces where air quality is not as excellent a concern, such as single-occupant offices, and where the room height is not tall, such as lower than 2.4 m. Stratum ventilation by elevated supply air temperature is suited for small-to-medium-sized spaces without mitigating the thermal comfort at the occupied zone. For sports centers, larger air output is required, and displacement ventilation is hard to control indoor humidity due to the higher supply of air temperature. The advantage of this GIS will be further discussed in the following sections.
However, there may be a need for more comprehensive and comparative studies that evaluate a wider range of ventilation strategies, including hybrid systems, to identify the most effective and efficient approaches for large space applications. These references provide insights into the performance of ventilation systems in large spaces. Still, there may be a lack of long-term performance assessments considering different seasons, climate conditions, and occupancy patterns for passive architectural design. Further research investigating the design technique and developing an algorithm adopting suitable ventilation strategies in large spaces could provide valuable information for the practical implementation of retrofit work study.
Energy-saving guidelines recommend raising room temperatures to save energy, which requires elevating room temperature and air velocities for thermal comfort. Unfortunately, building management systems usually cannot provide these data, which leads to poor indoor air quality, discomfort, and waste of energy. Green air distribution techniques are proposed to address this issue in a large space. The simulation results will demonstrate the effectiveness compared to the baseline and retrofit (improved) model.
Sharpening the development of Green aIr-distribution System (GIS) for both existing and new high-ceiling buildings under air-conditioning/ventilation (AC/V) systems would be developed. An optimized AC/V system is adopted by balancing the indoor environment setting and innovative air distribution strategies with high-ceiling buildings with specified energy utilization index. One of the technologies involves distributing conditioned air directly to the occupancy zone. The proposed system is expected to optimize thermal comfort, indoor air quality, and energy consumption for high-ceiling buildings in Hong Kong. This technology may have significant benefits to the local building services industry and aligns with a global policy of reducing carbon emissions, such as the Building Energy Efficiency Ordinance (Cap 610) [13], HK3030 campaign [14], and current energy-saving policy plan for Hong Kong’s Built Environment 2015–2025+ [15], implemented in Hong Kong Buildings. The collaborative development of GIS can effectively further reduce electricity consumption, and greenhouse gas emissions, and enhance building energy efficiency.
The evaluation of the trial case may be conducted using simulation and experimental validation. Such an analysis can lead to designs that minimize HVAC energy consumption and carbon dioxide emissions and promote environmental sustainability. With GIS, electricity consumption is expected to be further reduced by at least 10% for building systems.
The design of traditional AC/V systems for high-ceiling buildings is solely concerned with the active systems of energy-efficient building systems after completion of the passive design for building envelopes and the use of material selected by the Architect. However, passive strategies serve as the foundation for an active building system’s heating, cooling, ventilation, and lighting. Thus, energy saving is focused on the dynamic building system and closely relates to the passive architecture design.
The renovated sports center consists of one floor with a 9.3 m ceiling height and a floor area of 3000 m2. This revised ductwork design shall align with the existing architectural layouts and accommodate scheduled sporting activities in summer and winter conditions. The existing air-cooled chiller and its distribution chilled water pipework are retained. The existing air distribution ductworks connected to three existing air handling units (AHUs) will be modified to enhance indoor conditions and overall system efficiency.
Three major disadvantages of traditional air supplied from the high ceiling are (i) disablement of horizontal air supply; (ii) needs more fan power to achieve the required air movement in the occupied region due to the long distance between the air supply outlets at the ceiling and the occupied region and (iii) unnecessarily cools the unoccupied upper zone/top region of the air-conditioned area. Thus, GIS may become one of the practical design measures to reduce the energy use in Hong Kong air-conditioned buildings focusing conditioning on occupied regions. This design fully complies with the mandatory building energy codes and governmental guidelines on elevated temperatures in summer air-conditioned Hong Kong premises.

2. Methodology

Numerical and Geometrical models based on a commercial program SOLIDWORKS Flow Simulation are used to compare the traditional system and GIS by finite volume method [16]. The equation is listed in Appendix A. The uniqueness of this scheme is to consider the constraints of the site environment, including the structure and the coordination of various building service facilities. For example, changing the plan does not affect the original site’s design and the current system’s installation. Figure 1 shows a GIS retrofitting technique algorithm of sequence control action in high-ceiling buildings illustrating both passive and active design factors.

2.1. Numerical Model

2.1.1. Boundary Conditions and Initial Conditions for CFD Simulations

The typical indoor condition for a sports complex in Hong Kong is considered and adopted for the baseline model simulation. The sports complex is assumed to have an initial temperature of 22 °C and 60% relative humidity. Cheng et al. found that the supply temperature could be increased by a maximum of 2 °C when the discharged air is introduced directly into the breathing zone [17]. Consequently, the discharged air temperature for the retrofit model would be increased by 1.5 °C without significantly compromising thermal comfort. The boundary conditions for the baseline and retrofit model are illustrated in Table 1 and Table 2.
Inside the sports complex there are four badminton courts with a maximum capacity of 16 people. Therefore, the number of people can be assumed as 16. According to the ASHRAE Handbook, the sensible heat load for athletics is 210 W [18]. The total occupant load is calculated as 3.36 kW. The lighting power densities are assumed as 11 kW/m2 based on the latest energy requirements in Hong Kong [19].

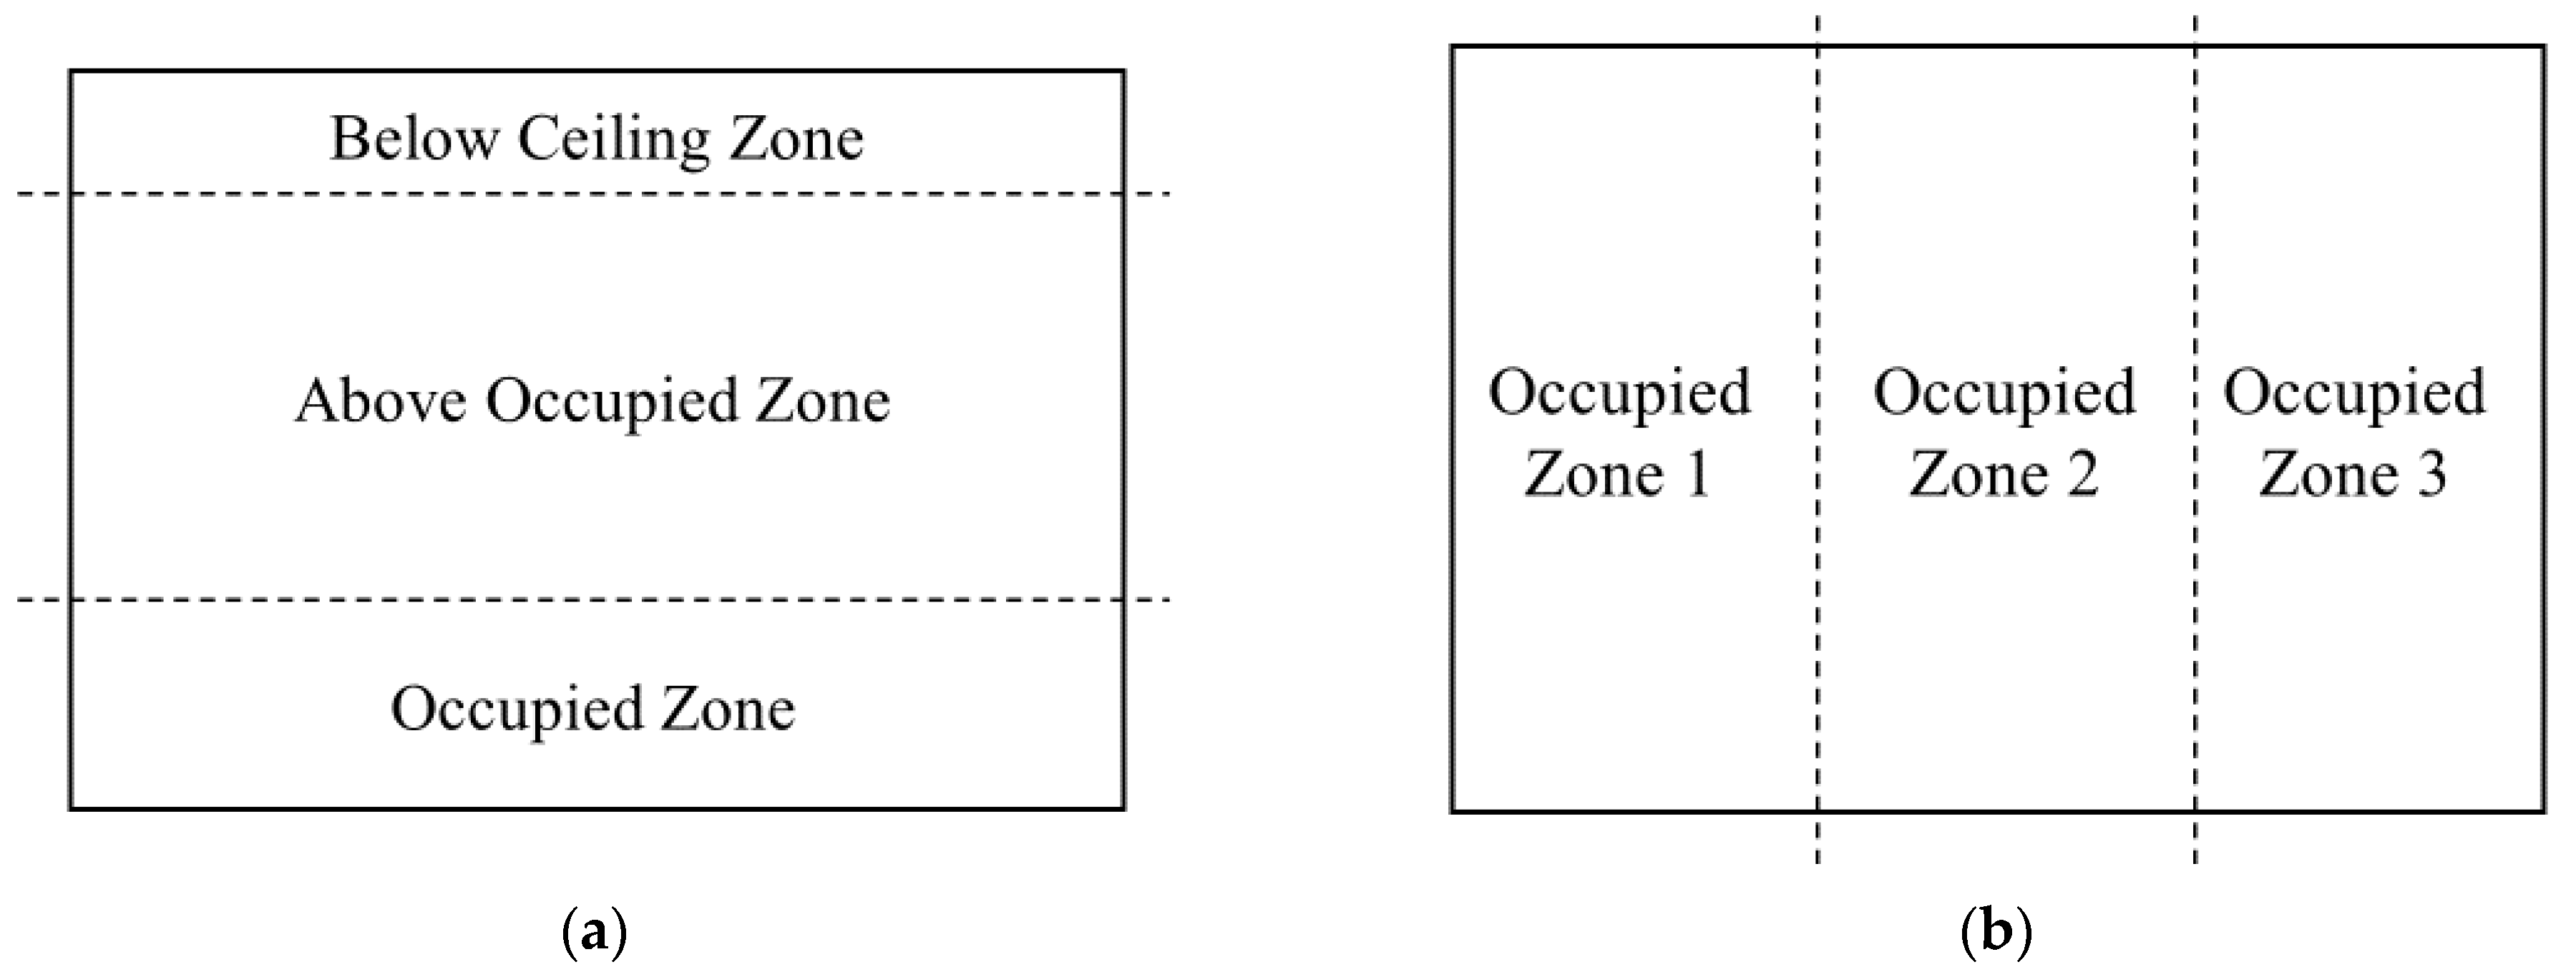
2.1.2. Zoning of the Simulation

In general, thermal stratification occurs in high-ceiling buildings. The conditioned air (cold air) is driven to the occupied zone while the hot air is raised to the ceiling due to the buoyancy force. To simulate the energy performance of GIS and facilitate comparison and further analysis purposes, the entire hall was divided into three zones: (i) the occupied zone (0.0 m to 1.8 m), (ii) the zone above the occupied zone (1.8 m to 6.0 m) and (iii) the below-ceiling zone (6.0 m to 9.3 m). The zoning is illustrated in Figure 2a to assess the ventilation performance and thermal stratifications in the entire hall. The approach provides values for each sub-zone rather than a single value for the entire space. Additionally, the occupied zone is subdivided into three zones representing each active sports player’s zone at the badminton courts (Figure 2b). Thermal stratification is expected to occur in the below-ceiling zone [20]. The occupied zone is the primary concern in ensuring the expected thermal comfort environment through the conditioned air system. The layout of existing ceiling-mounted supply air terminals and wall-mounted return louvers associated with the plant room is shown in Appendix B.

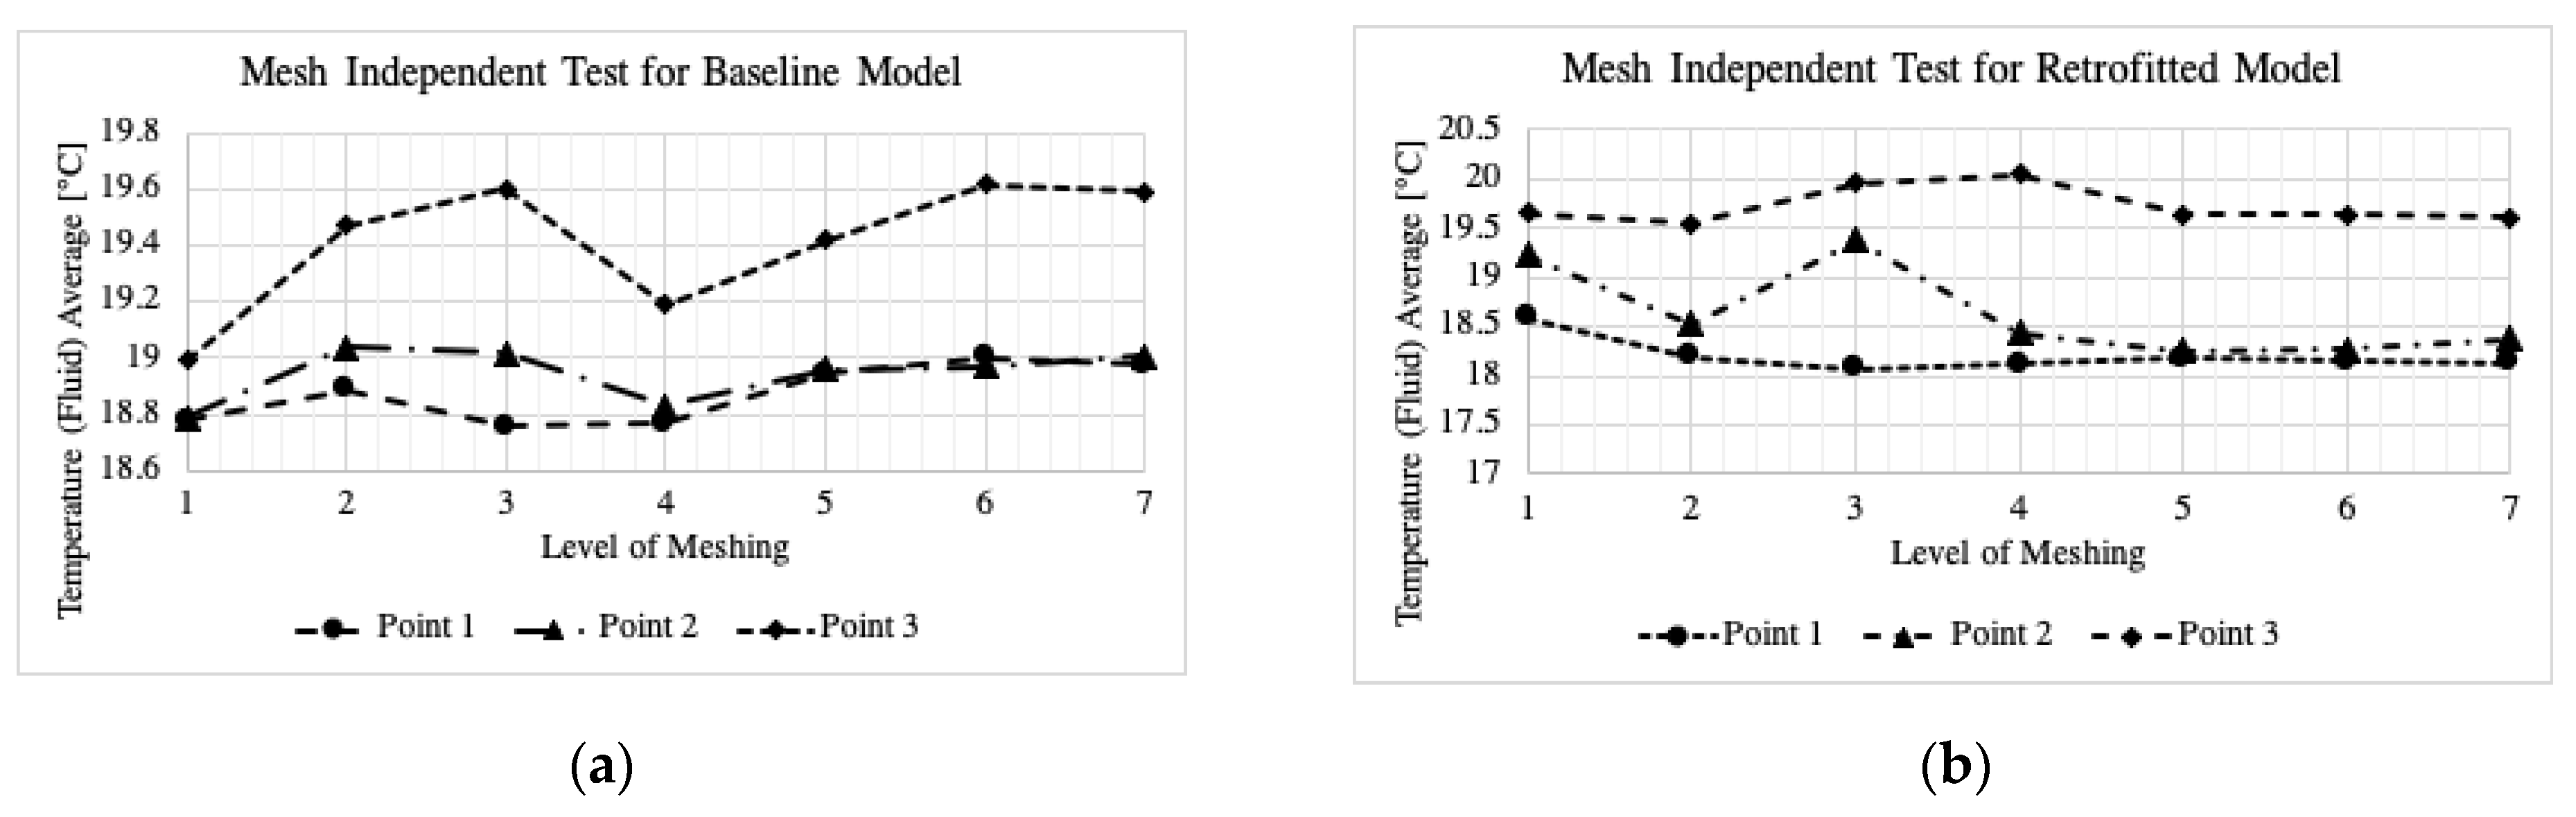
2.1.3. Grid Independence Analysis

The grid independence analysis is conducted to determine sufficient mesh quality. Three observation points are located at the center of the model, at heights of 4 m, 6 m, and 8 m, to determine the suitable mesh size without compromising accuracy. The temperatures of each observation point are plotted against the cell quality illustrated in Figure 3a,b for the baseline and retrofit models, respectively. SOLIDWORKS contains seven levels of mesh density which could be adopted in the simulation. Level 1 mesh is the coarsest, and level 7 mesh is the finest. The simulation results show good convergence for baseline and retrofit models with level 6 meshing. Therefore, level 6 meshing is selected for further study.

2.1.4. Evaluation Parameters

Several criteria are adopted to assess thermal comfort. The retrofitted model would be evaluated against the baseline model by the following parameters: average operative temperature, average airspeed, local mean age, local air change index, air distribution performance index, predicted mean vote, and the predicted percentage of dissatisfaction.
Thermal comfort could be quantified by Predicted Mean Vote (PMV) and Predicted Percentage of Dissatisfied (PPD), which are the functions of air temperature, radiant temperature, air speed, humidity, clothing insulation, and metabolic rate. This paper mainly utilized these two parameters to determine the thermal comfort performance from the retrofit model.

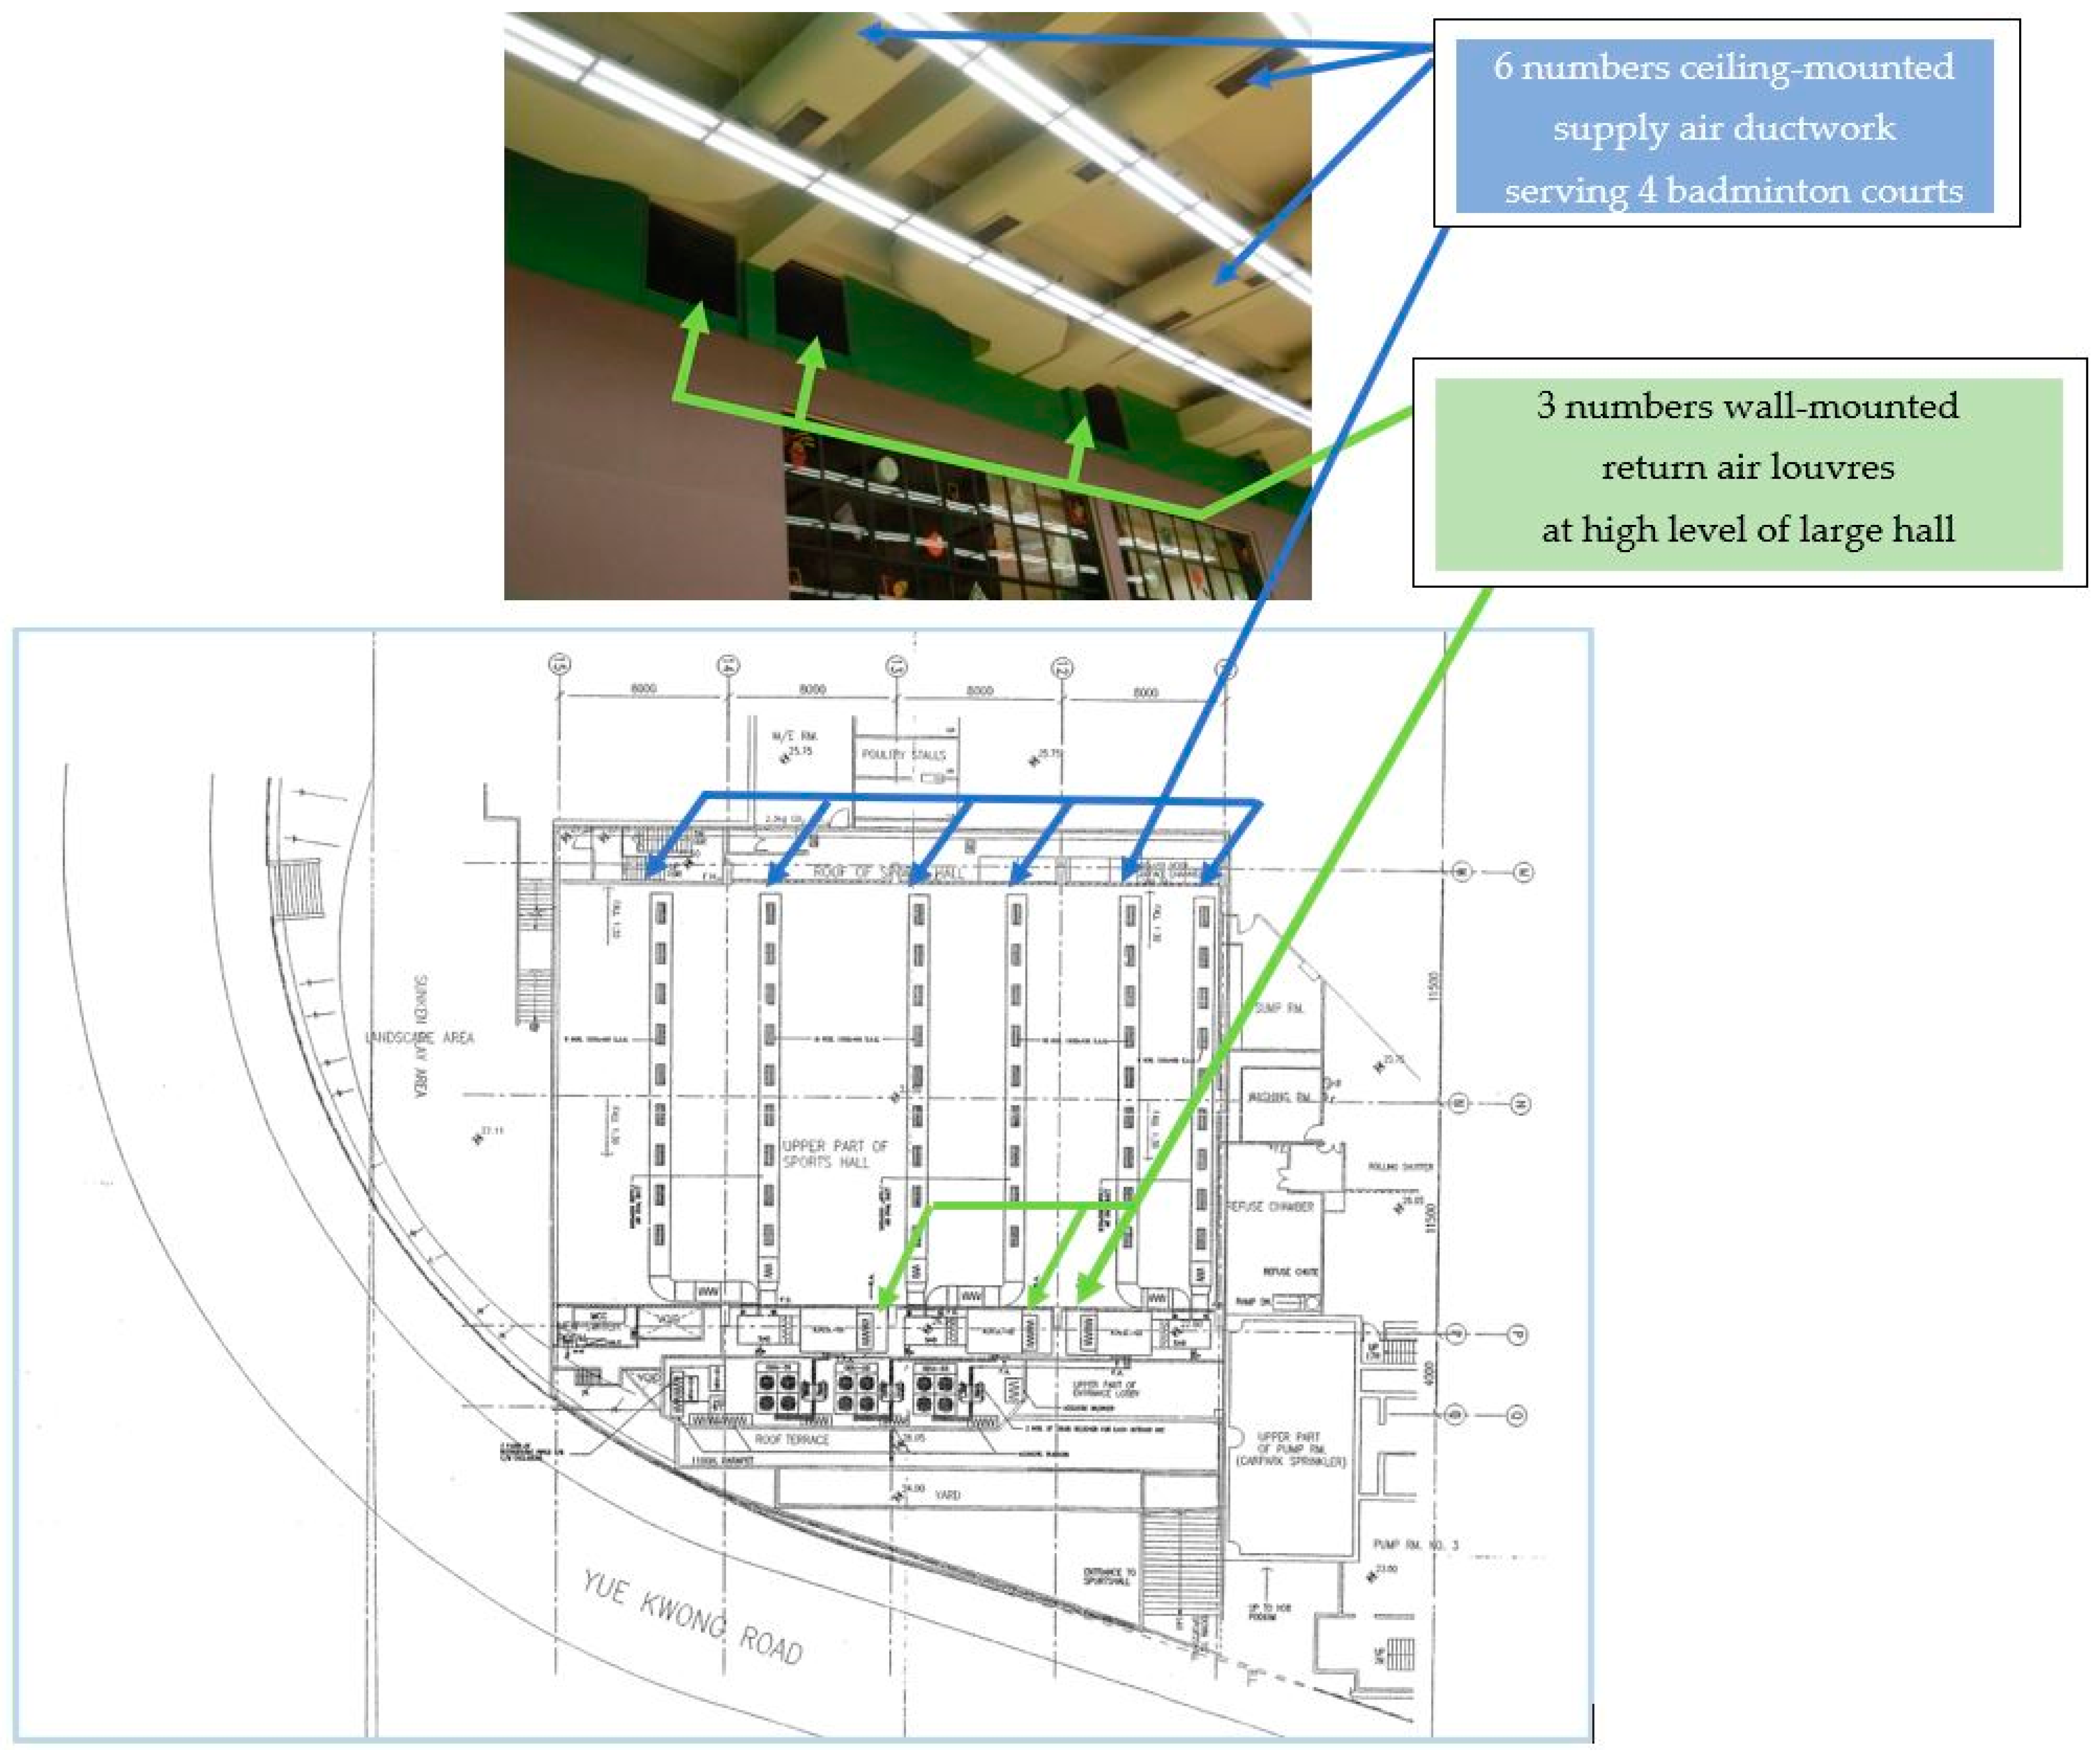
2.2. Geometrical Model

2.2.1. Baseline Model

The baseline model consists of a sports hall with dimensions of 32 m × 21 m × 9.3 m (L × W × H) located in Hong Kong. The existing air distribution system in the sports hall is controlled by three Air Handling Units (AHUs), with each AHU connected to two sets of Supply Air Ducts (SAD). The conditioned air is supplied through ceiling-mounted air outlets, specifically 18 supply air grills for each AHU, resulting in a total of 54 supply air grills (Figure 4). Additionally, three return inlets are positioned on the high level of the 32 m walls. This configuration is considered the baseline for the CFD simulation case. The layout of the existing ceiling-mounted supply air ductwork and wall-mounted return louvers associated with the plant room area serving the Sports Centre is provided in Appendix B.

2.2.2. Retrofit Model

The dimension of the sports hall and the air-conditioning system adopted in the proposed retrofit model are identical to the baseline model. The only difference is the location and the size of the air grills. In the retrofitted GIS design, the supply outlets are relocated to each 32 m long wall, and one of the existing SADs is converted to return air ducts (RAD). The air is discharged horizontally at a low level and returned to the ceiling level. The centerline of the discharge air supply plenum is 1.7 m above ground level, where the air is discharged directly into the breathing zone of the occupants (Figure 5). Implementing this retrofit design aims to enhance air distribution and thermal comfort within the sports hall.

3. Results and Discussion

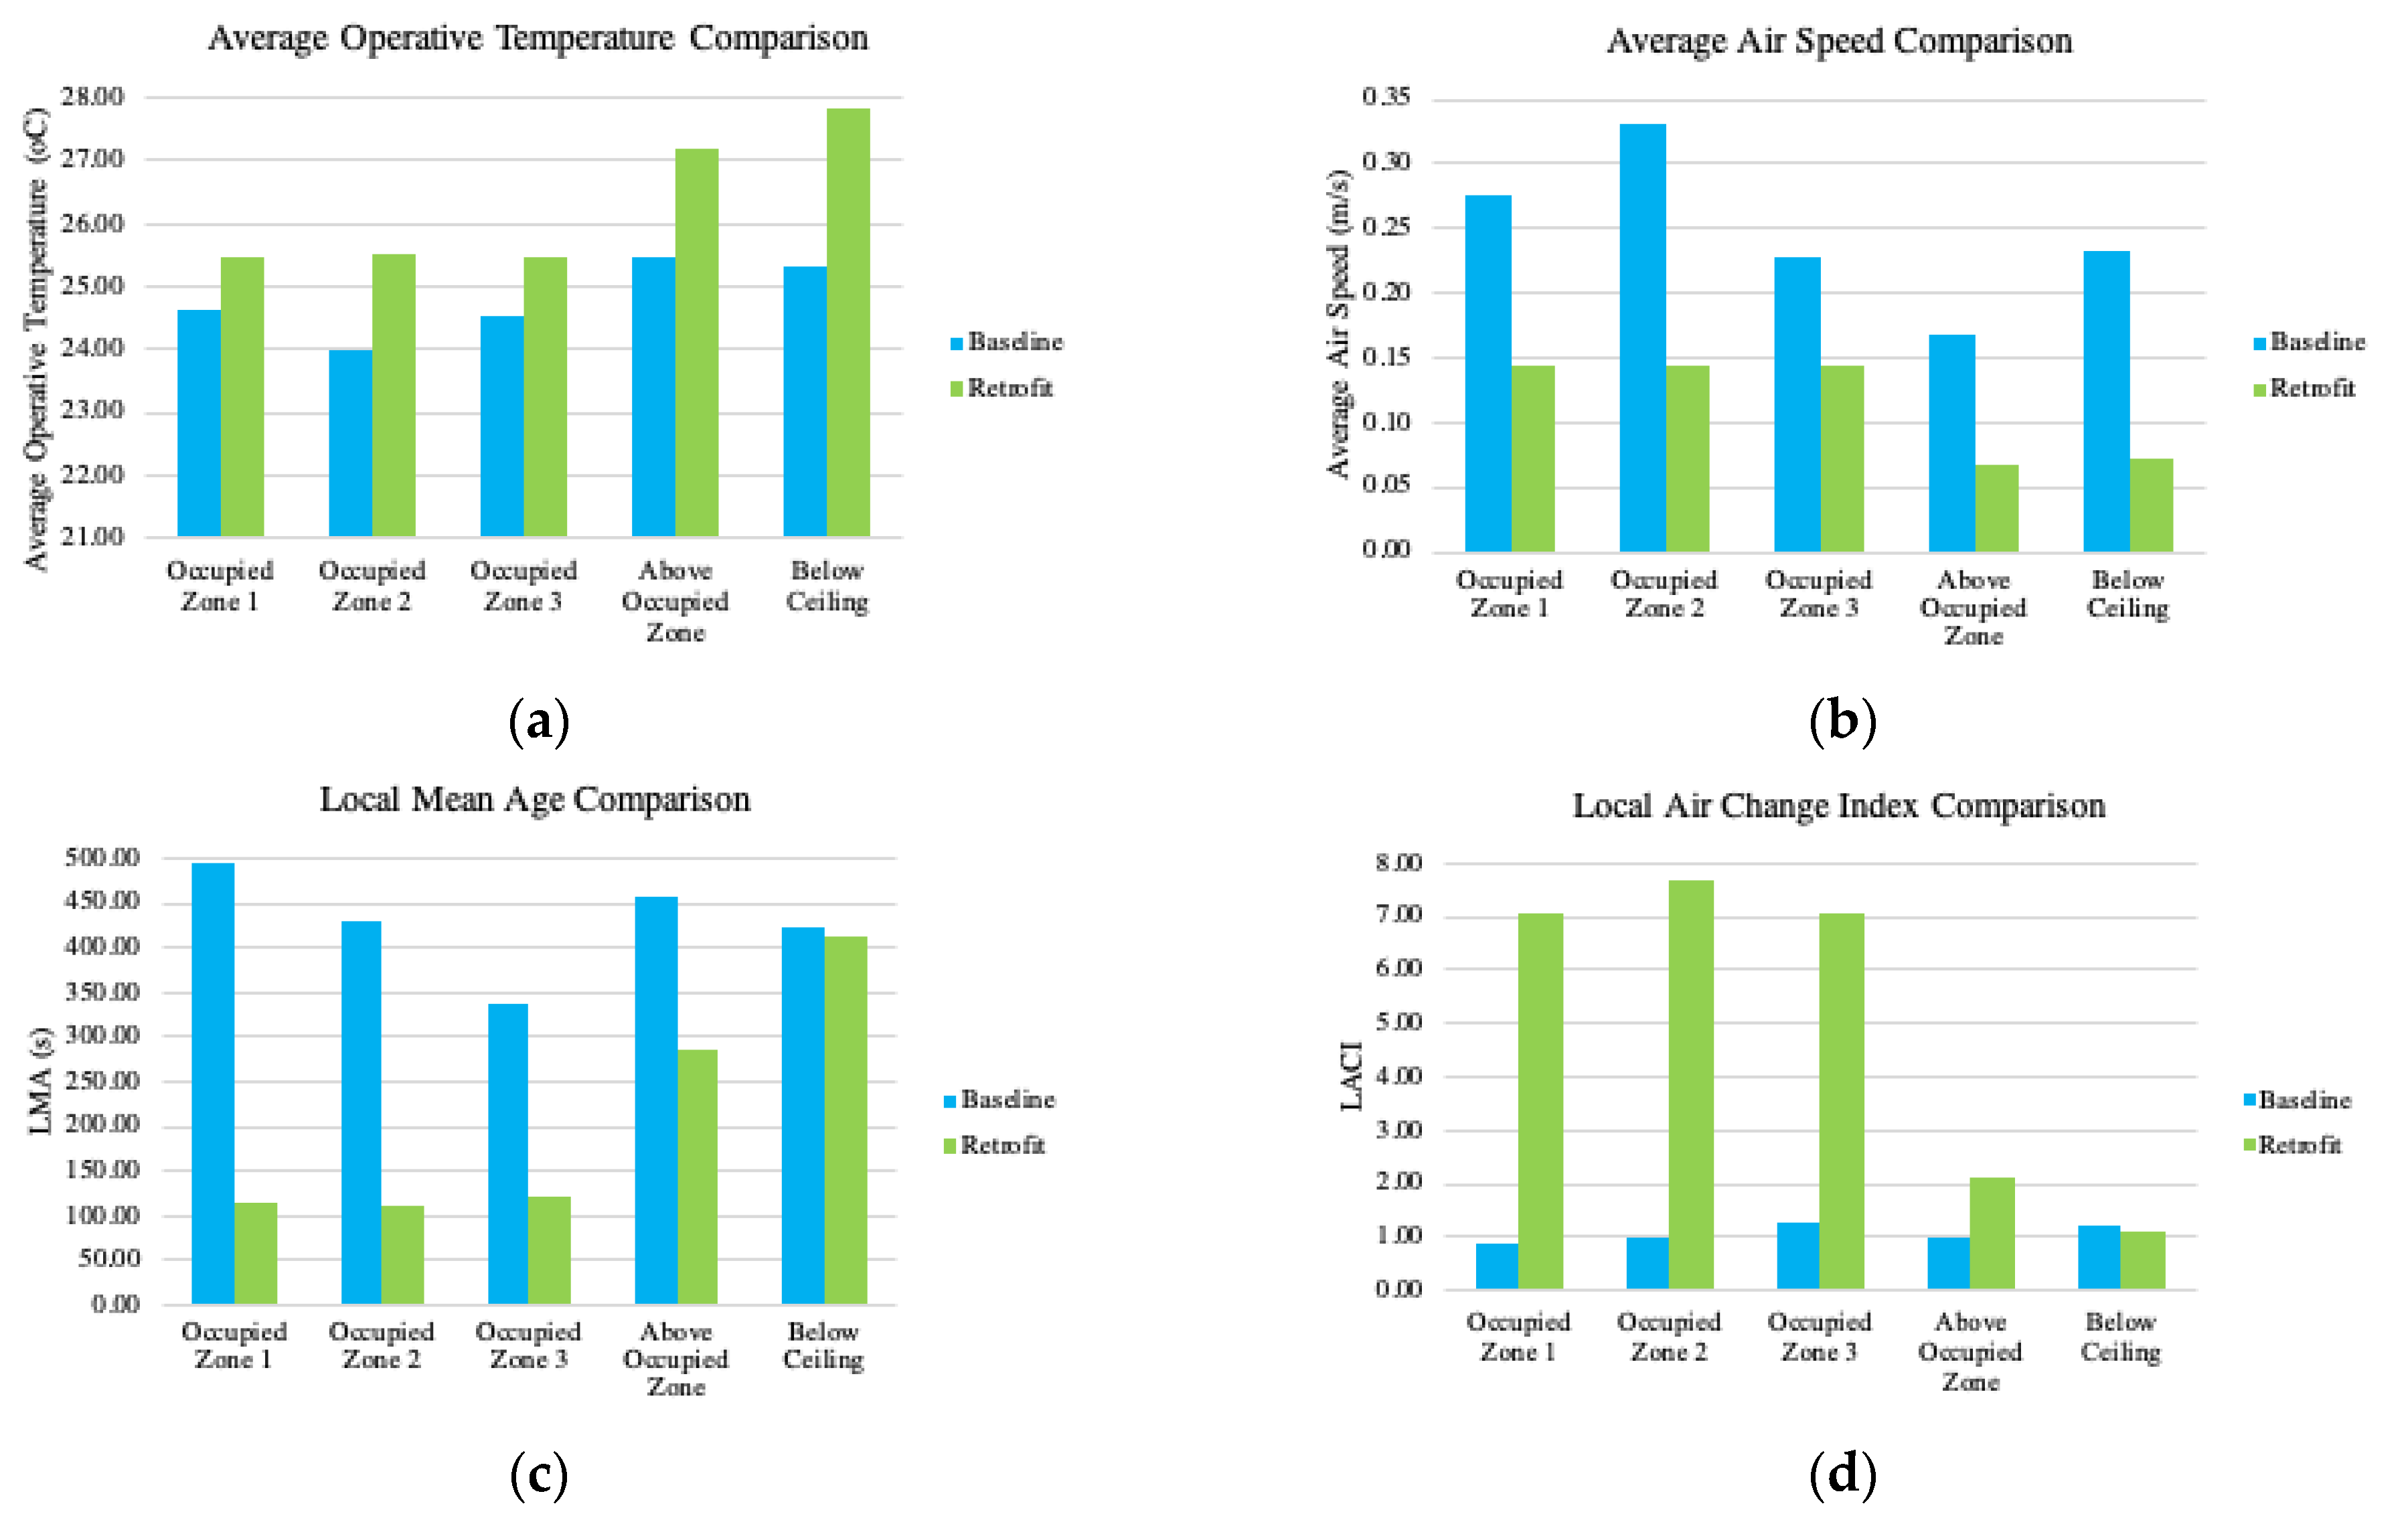
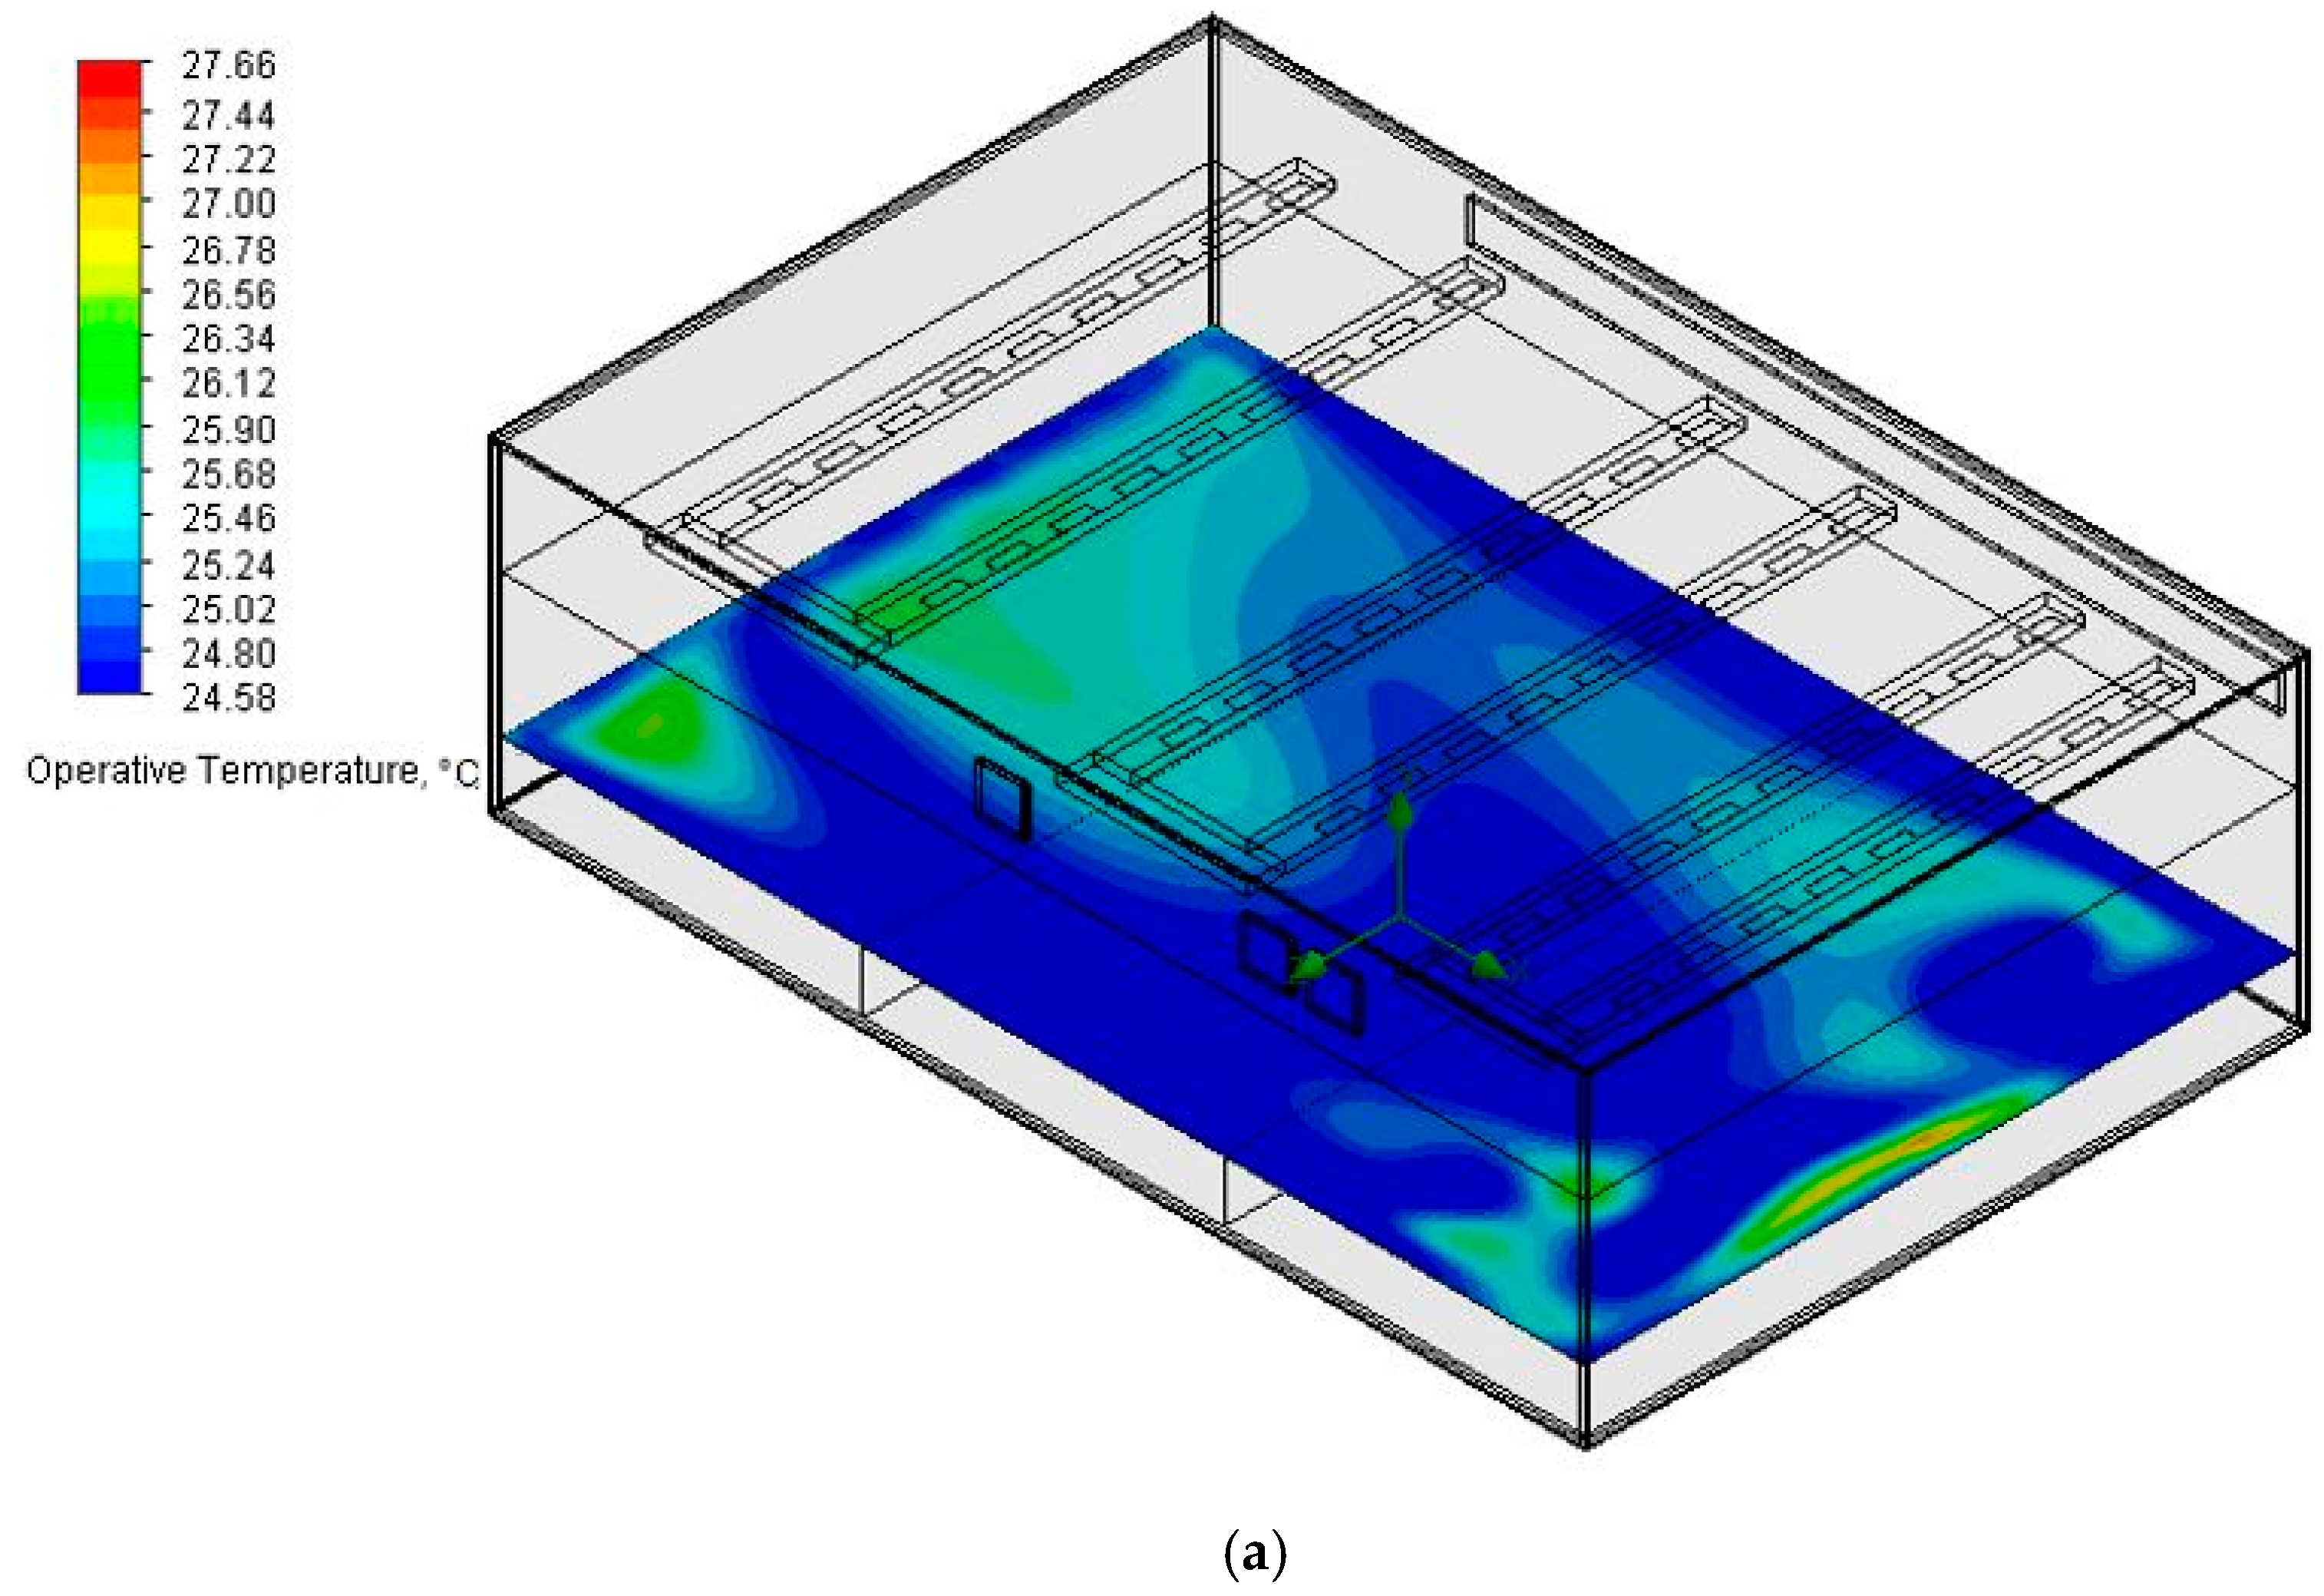
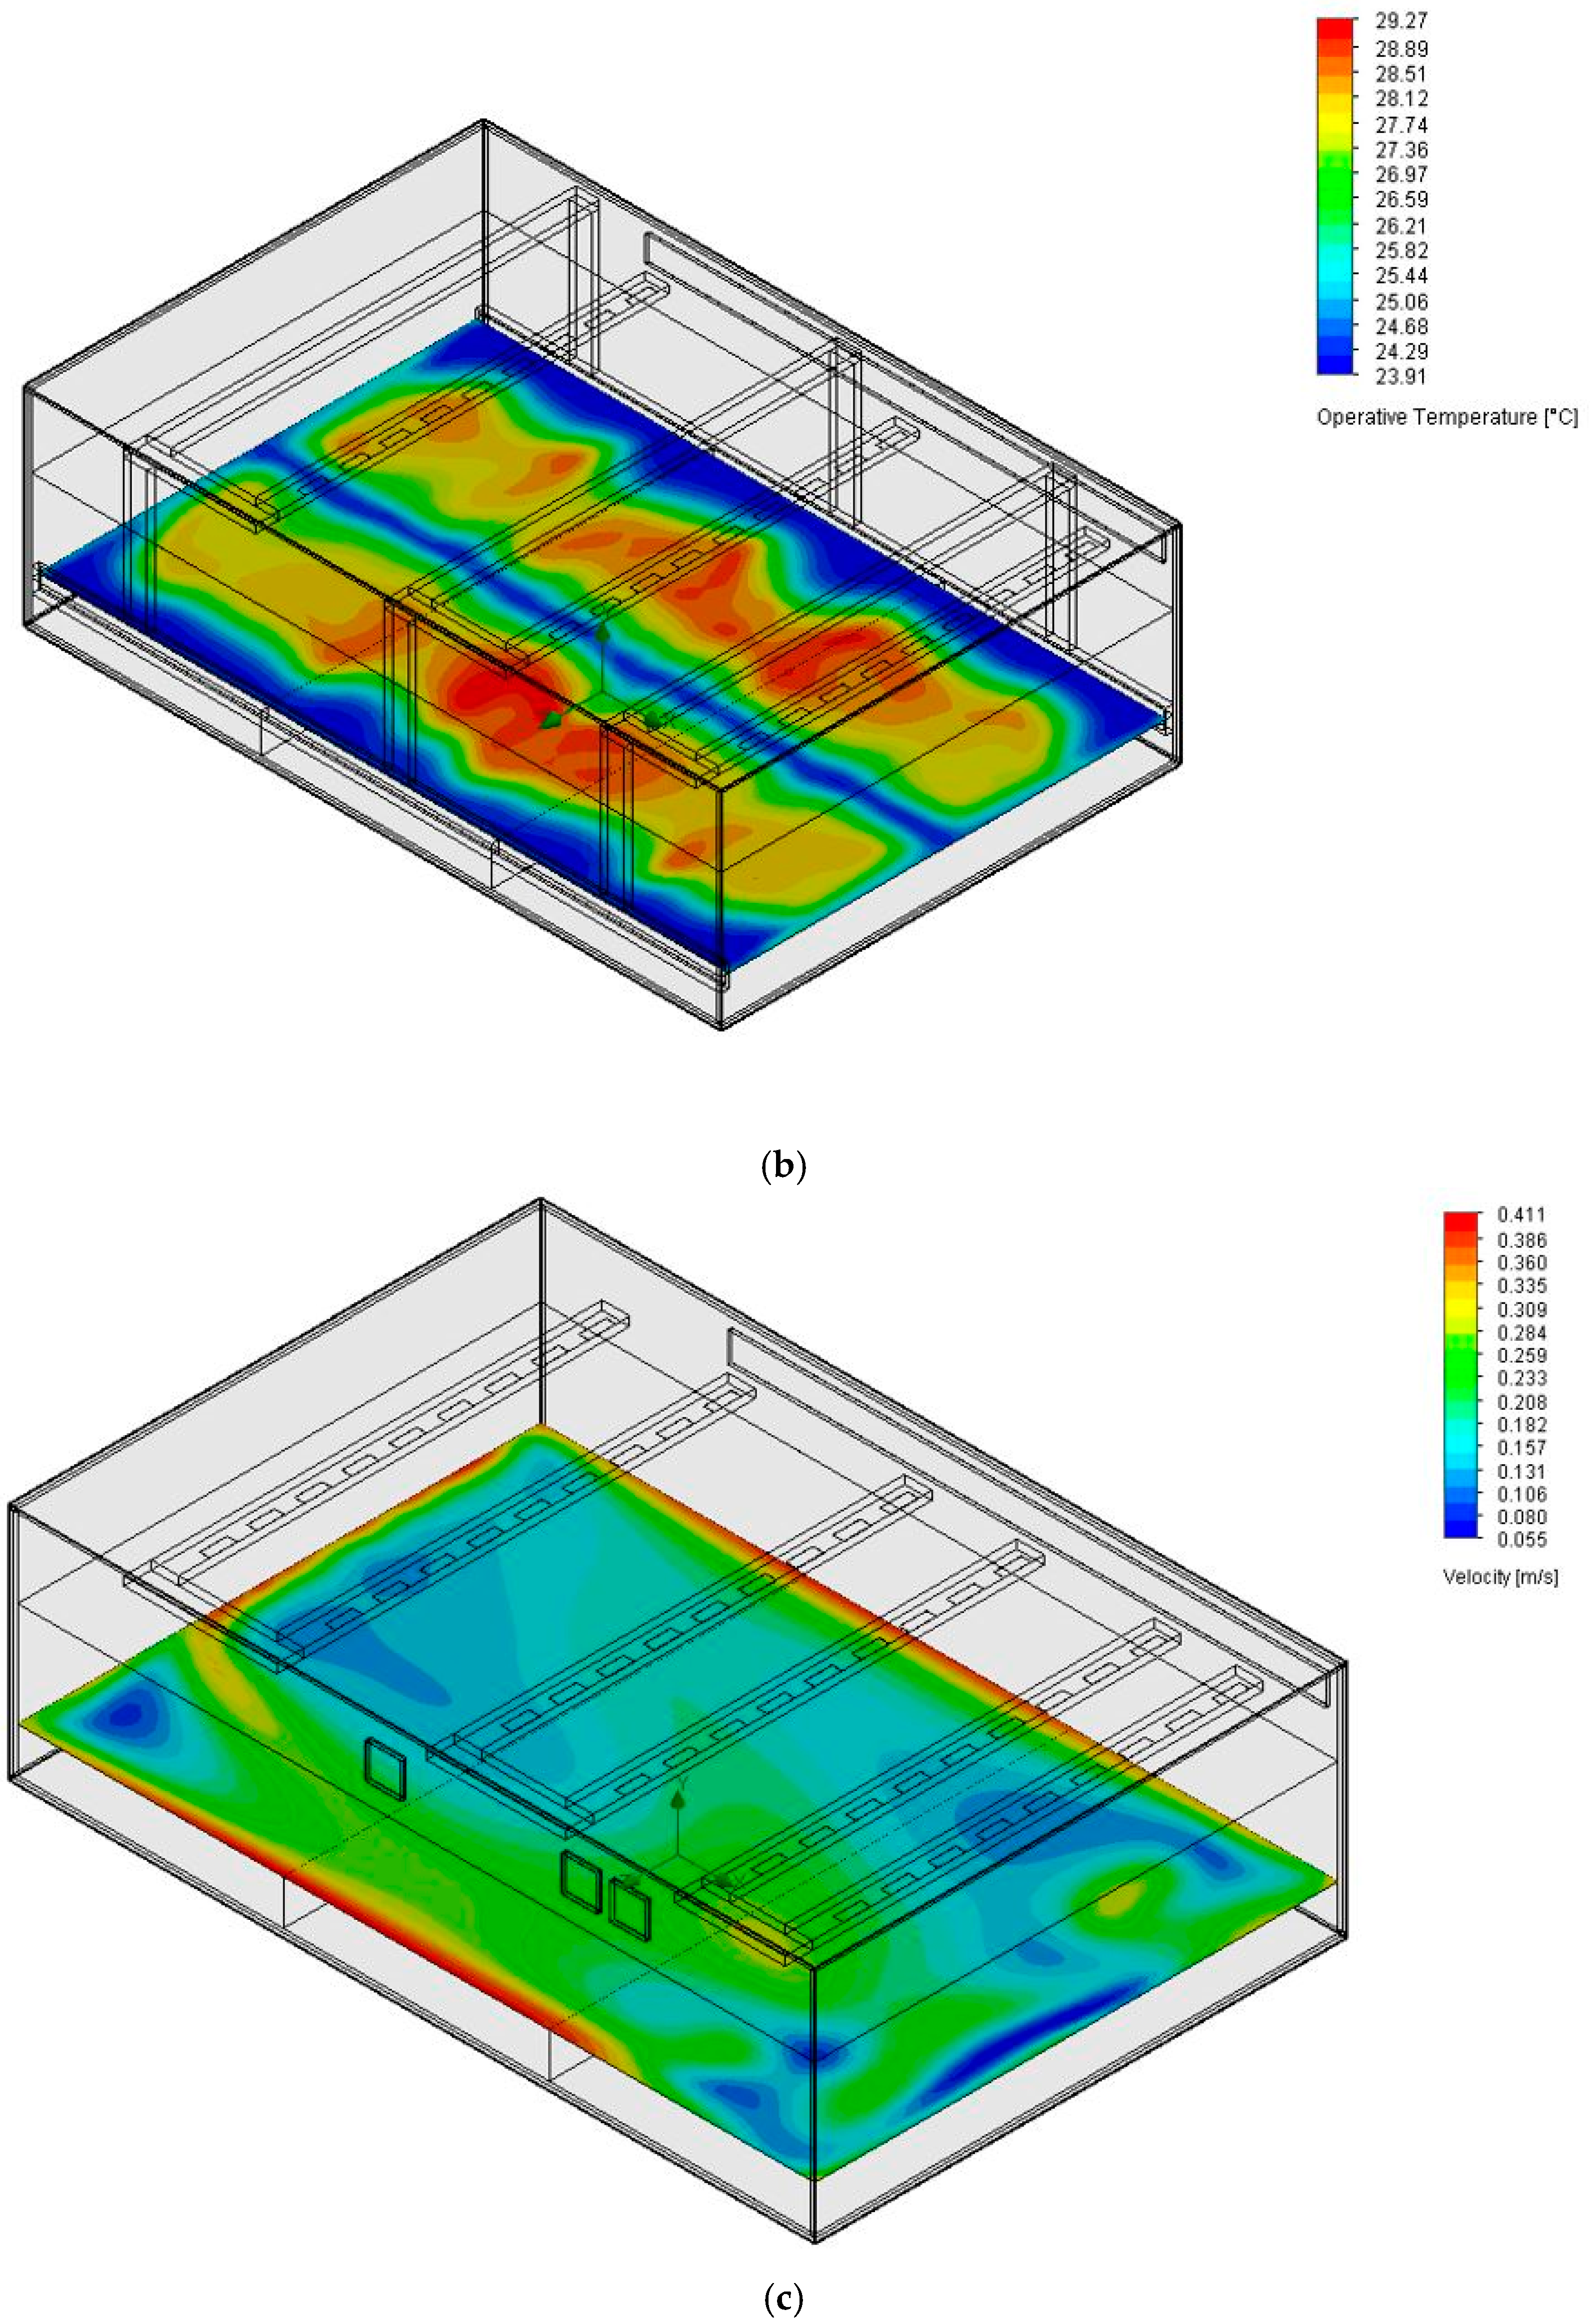
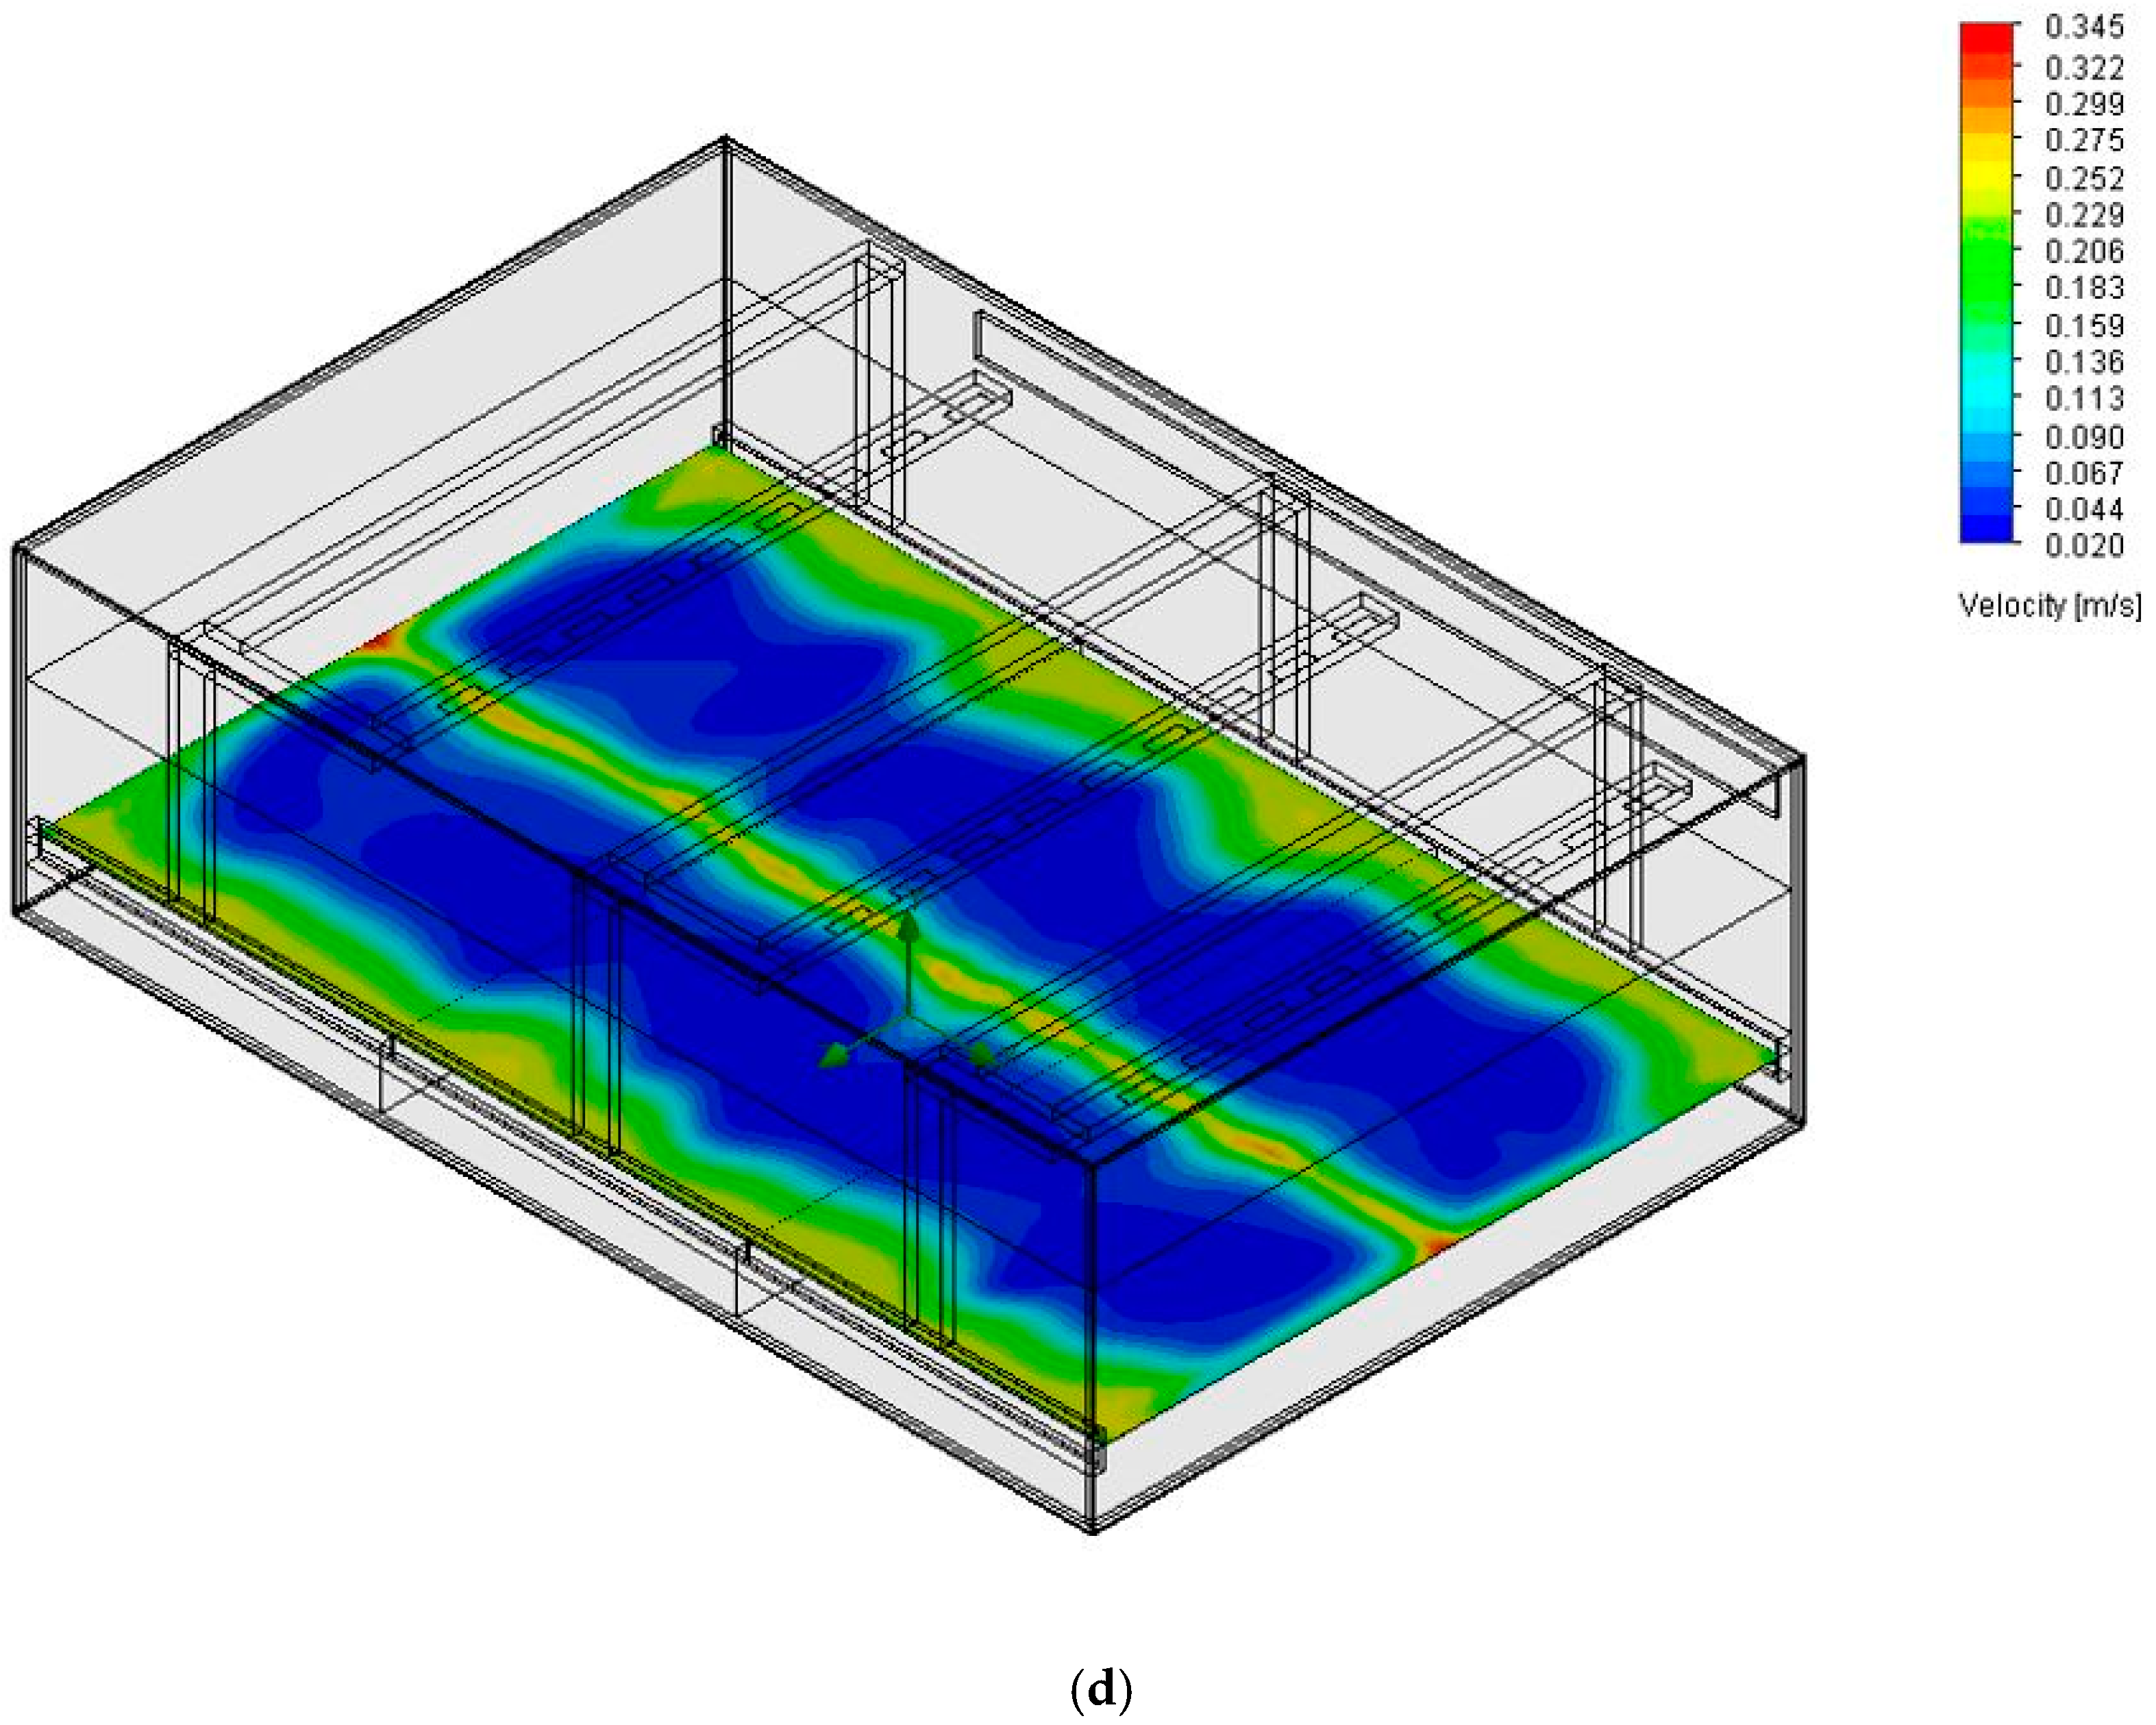
3.1. Comparison of Baseline and Retrofit Modeling Results

Table 3 and Figure 6a–d show the results of the ventilation performance findings for the existing (baseline) and improved (retrofit) cases, respectively. The numerical results demonstrated that the different air terminal layouts affect the ventilation performance, as observed in the Average Operative Temperature (AOT), Average Air Speed (AAS), Local Mean Age (LMA) and Local Air Change Index (LACI). The numerical results indicate that the exhaust’s location can impact an air distribution performance. The LMA and LACI of the occupied zones in the retrofit model is around 1.8–3.3 times and 4.5–7.2 times better, respectively, compared to the baseline model.
Air diffusion of ceiling-mounted air terminal devices performs better than expected throughout the room volume. The air is discharged from a plenum with a large air discharge surface area. In considering the performance within the occupied zones, the Local Mean Age (LMA) and Local Air Change Index (LACI) demonstrate that the alternative case provides a significantly improved performance over the baseline model, as shown in Figure 6c,d, respectively. The improved LMA suggests that more fresh air flows in these zones, particularly for active sports players who require it the most. Reducing elevated contaminants, mainly CO2 and other indoor-associated pollutants, enhances the air quality within the player’s zone. Similarly, the improved LACI optimizes the total volume flow rate, presenting energy-saving opportunities in ventilation fan operations.
Compared with the distribution performance factor in Table 4, better achievements were found in the retrofit model regarding the Air Diffusion Performance Index (ADPI) in various zone. The thermal comfort parameters, such as PMV and PPD, were slightly worse in retrofit cases but remained within acceptable ranges. The results are summarized in Table 4. The Predicted Mean Vote (PMV) and Predicted Percentage of Dissatisfied (PPD) are similar across the occupied zones. The retrofit model showed slightly higher PMV and PPD than the baseline model in the occupied zones, primarily due to the raised supply temperature (i.e., PPD is 0.28–0.57 times higher in the retrofit model). Nevertheless, the PPD value of the retrofit model is still within the acceptable range according to the ASHRAE standard (i.e., <10% of PPD) [21].
These identified supply air temperature settings provide a starting point for further exploration and research in the different fields of large space applications and ventilation strategies. Researchers can build upon their findings to develop studies that address specific challenges and contribute to understanding and advancing ventilation practices in large spaces.
Moreover, despite the 1.5 °C increase in the supply temperature in the retrofit model, GIS only results in a slight rise in the operating temperature within the occupied zones (i.e., 3.14%–6.47% higher than the baseline model). The 1.5 °C increment is based on the uniqueness of this sports field. The ambient surface temperature and layered treatment at longitudinal and traversal zones also take into account the use of air outlets and return air technology to achieve zero emissions and a fresh neutral occupied is the originality of the paper constraints the results of this software to provide designers with a scientific basis as a pre-construction review. The GIS design presents an opportunity to raise the air temperature supply. A higher supply temperature could reduce the cooling coil loading of the AHUs, thereby decreasing the energy consumption of the air-conditioning system. The building energy performance of the retrofit model could be simulated.
The operational temperature in the occupied zones, z = 1.8 m in the retrofit model, is distributed more evenly compared to the baseline model. Figure 7a–d illustrate the distribution of average operational temperature and the air speed contour between the baseline and retrofit models, respectively.

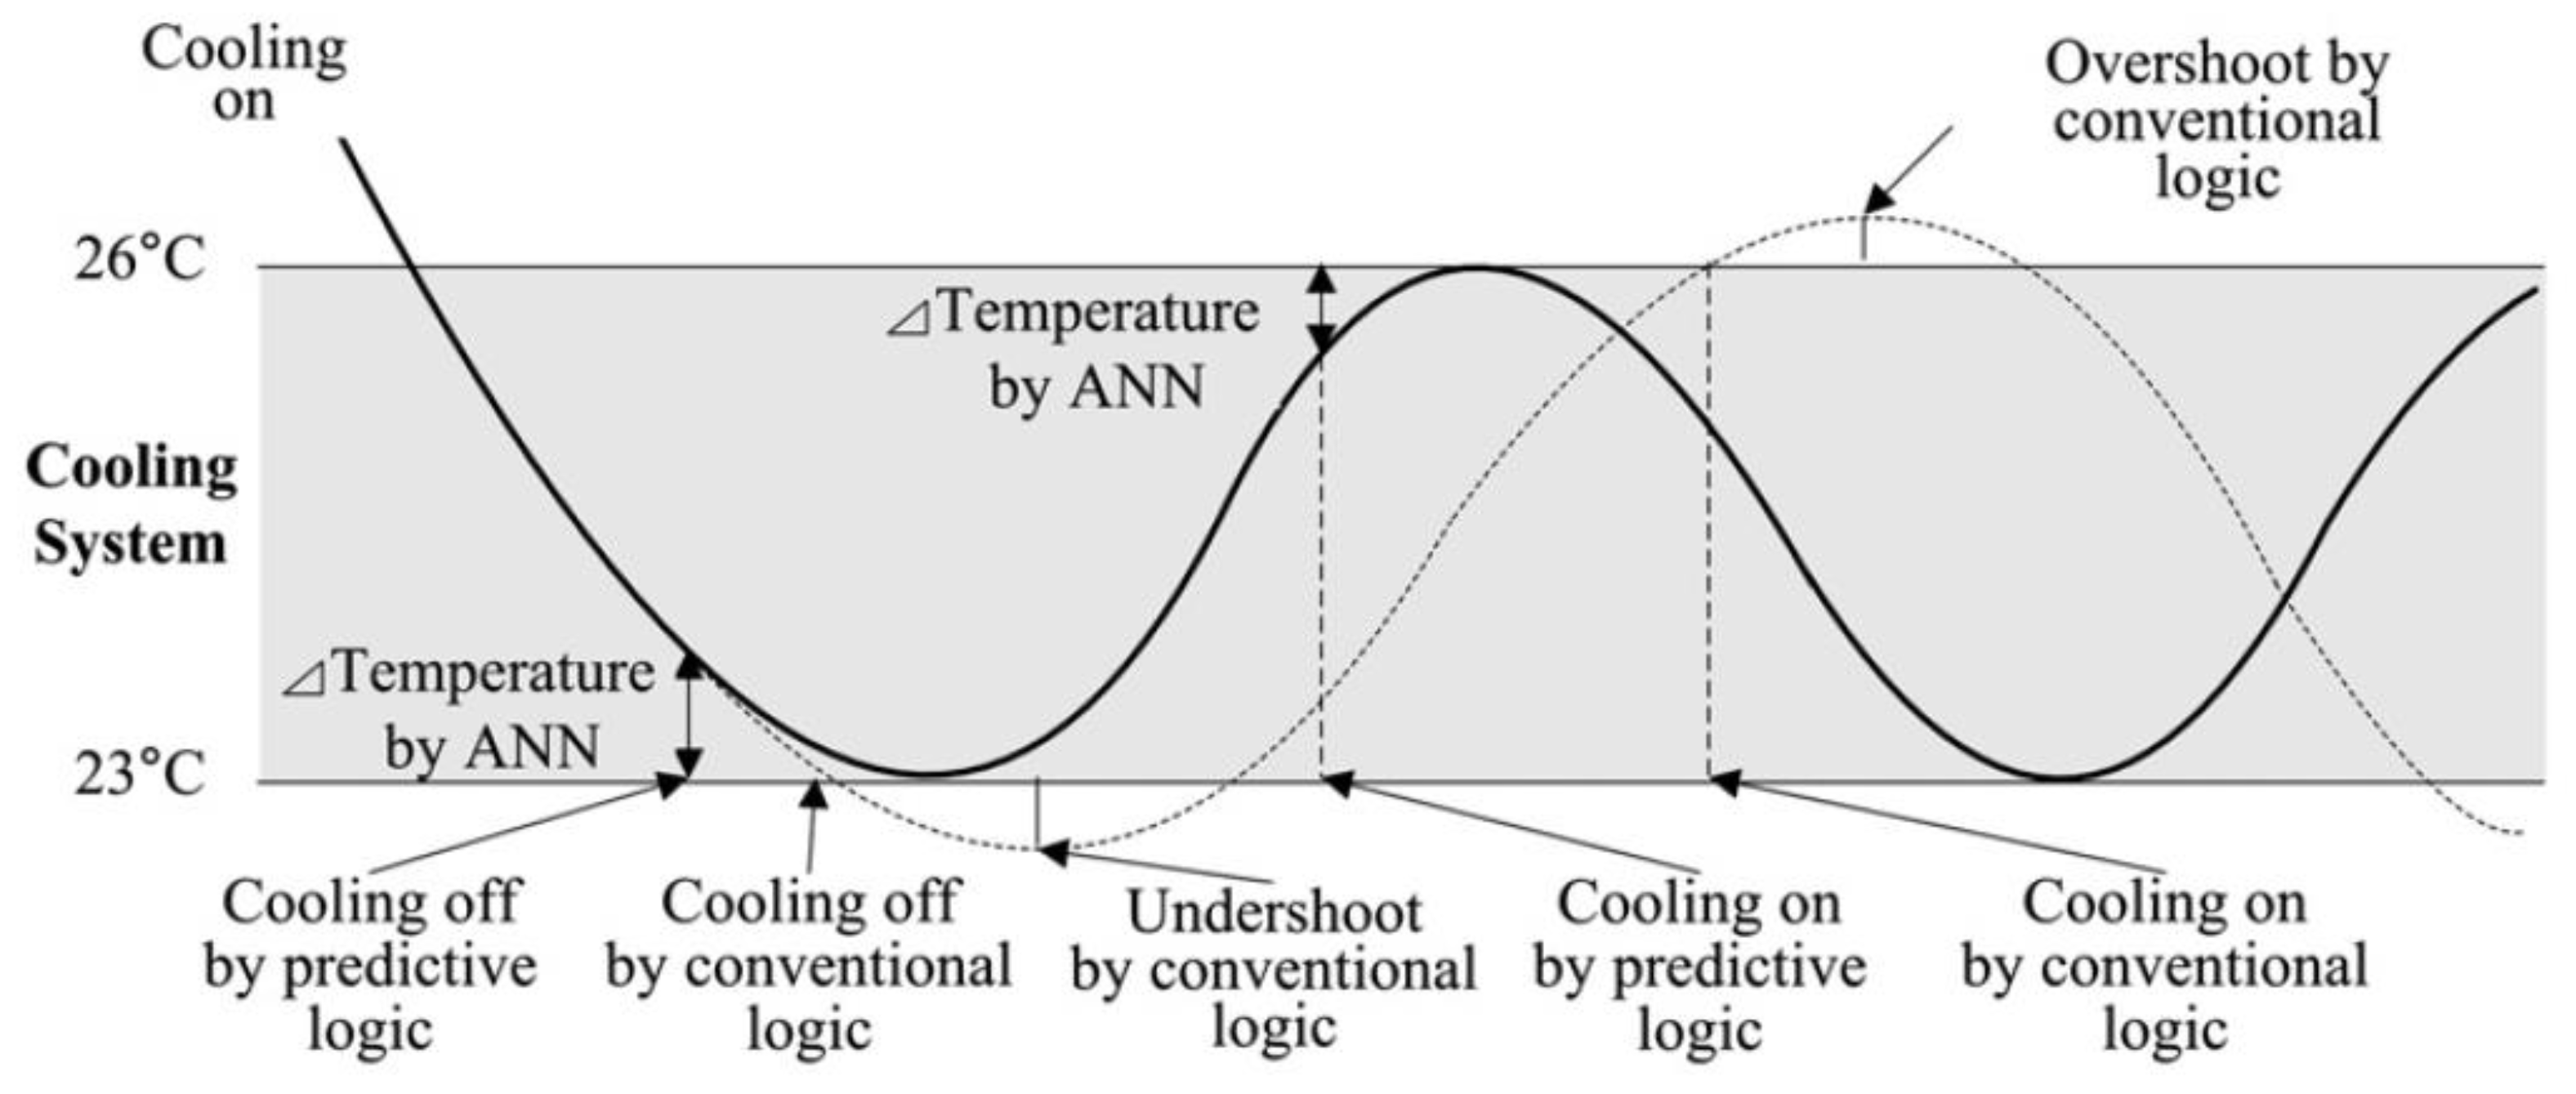
3.2. GIS Algorithms of Sequence Control

The GIS design appears to align with sustainable development, known as Stratum Ventilation [22]. However, it is not widely implemented for the following two major reasons:
  • Air distribution strategy and control parameter sets are scientific issues related to thermal comfort that administrative measures find challenging to address. Conventional methods of ceiling-supply and ceiling-return air distribution methods are not suitable for providing thermal neutrality at elevated temperatures, particularly in high-ceiling air-conditioned spaces and
  • Even if the GIS technology is ready for adoption, integrating it with architectural design poses challenges in incorporating various types and locations of supply and return terminals, especially in occupied regions, while adhering to optimized air distribution strategies and specific control algorithms. This integration is a case-by-case process and cannot standardize the aesthetic design practices of passive architecture, which is a fundamental prerequisite for GIS.
Addressing the first points, an air distribution strategy is considered based on the specific ventilation mode to be used and the type, number, and placement of each terminal serving an air-conditioned area. The boundary condition encompasses all the physical properties in a room that can impact individuals, such as supply airspeed, airflow rate, and temperature settings. Those control parameters must align with cooling needs, architectural layout, room size, and seating arrangement. Differentiation among various air distribution strategies under special boundary condition requirements can influence the actual benefit of GIS.
Addressing the second point, the geometry factor is closely related to both passive architecture design and active building systems. Adopting GIS control algorithms is essential for at least one of the key elements in mainstream practices. Passive architecture is designed to respond to project-specific parameters, including external wall design and interior functional layout plan design. The geometry factor can serve as a distinguishing feature to optimize energy use in high-ceiling buildings.
Most conventional building automation control systems do not consider the thermal comfort parameter, making it challenging to achieve a balance between building energy and thermal comfort. The indoor environment is subject to variations over time. Current control methods such as On/Off, Proportional-Integral, or even Proportional-Integral-Derivative fail to provide stable indoor environment control [23]. Moon and Kim developed an Artificial Neural Network-based thermal control method to address the overshoot and undershoot issues in conventional control logic, as shown in Figure 8 [24].
Developing an algorithm for designing a sustainable GIS system in a new and existing building is necessary to minimize energy consumption and optimize thermal comfort. This approach utilizes a simplified air distribution strategy in the occupied region (Figure 2a) to mitigate the low carbon emission resulting from the daily operation of the chiller plant and central air conditioning system, particularly in the high ceiling area. The interrelationships between passive and active factors are evaluated during the development of the GIS control algorithm.
Sensors play a vital role in the control algorithm as their accuracy directly impacts the overall system operation. It is necessary to note that the drifting or biasing of sensors would be more pronounced over extended periods. Wang et al. developed an improved sensor by incorporating a microprocessor chip with a network interface [25]. This allows for establishing a communication channel among decentralized sensors through a wireless network, enabling sensor fault detection and self-correction. The decentralized system also reduces the cost and need for manpower to develop and maintain a central monitoring system. Such a system is particularly well-suited for locations with multiple zoning, as individual sensors can effectively control each zone.

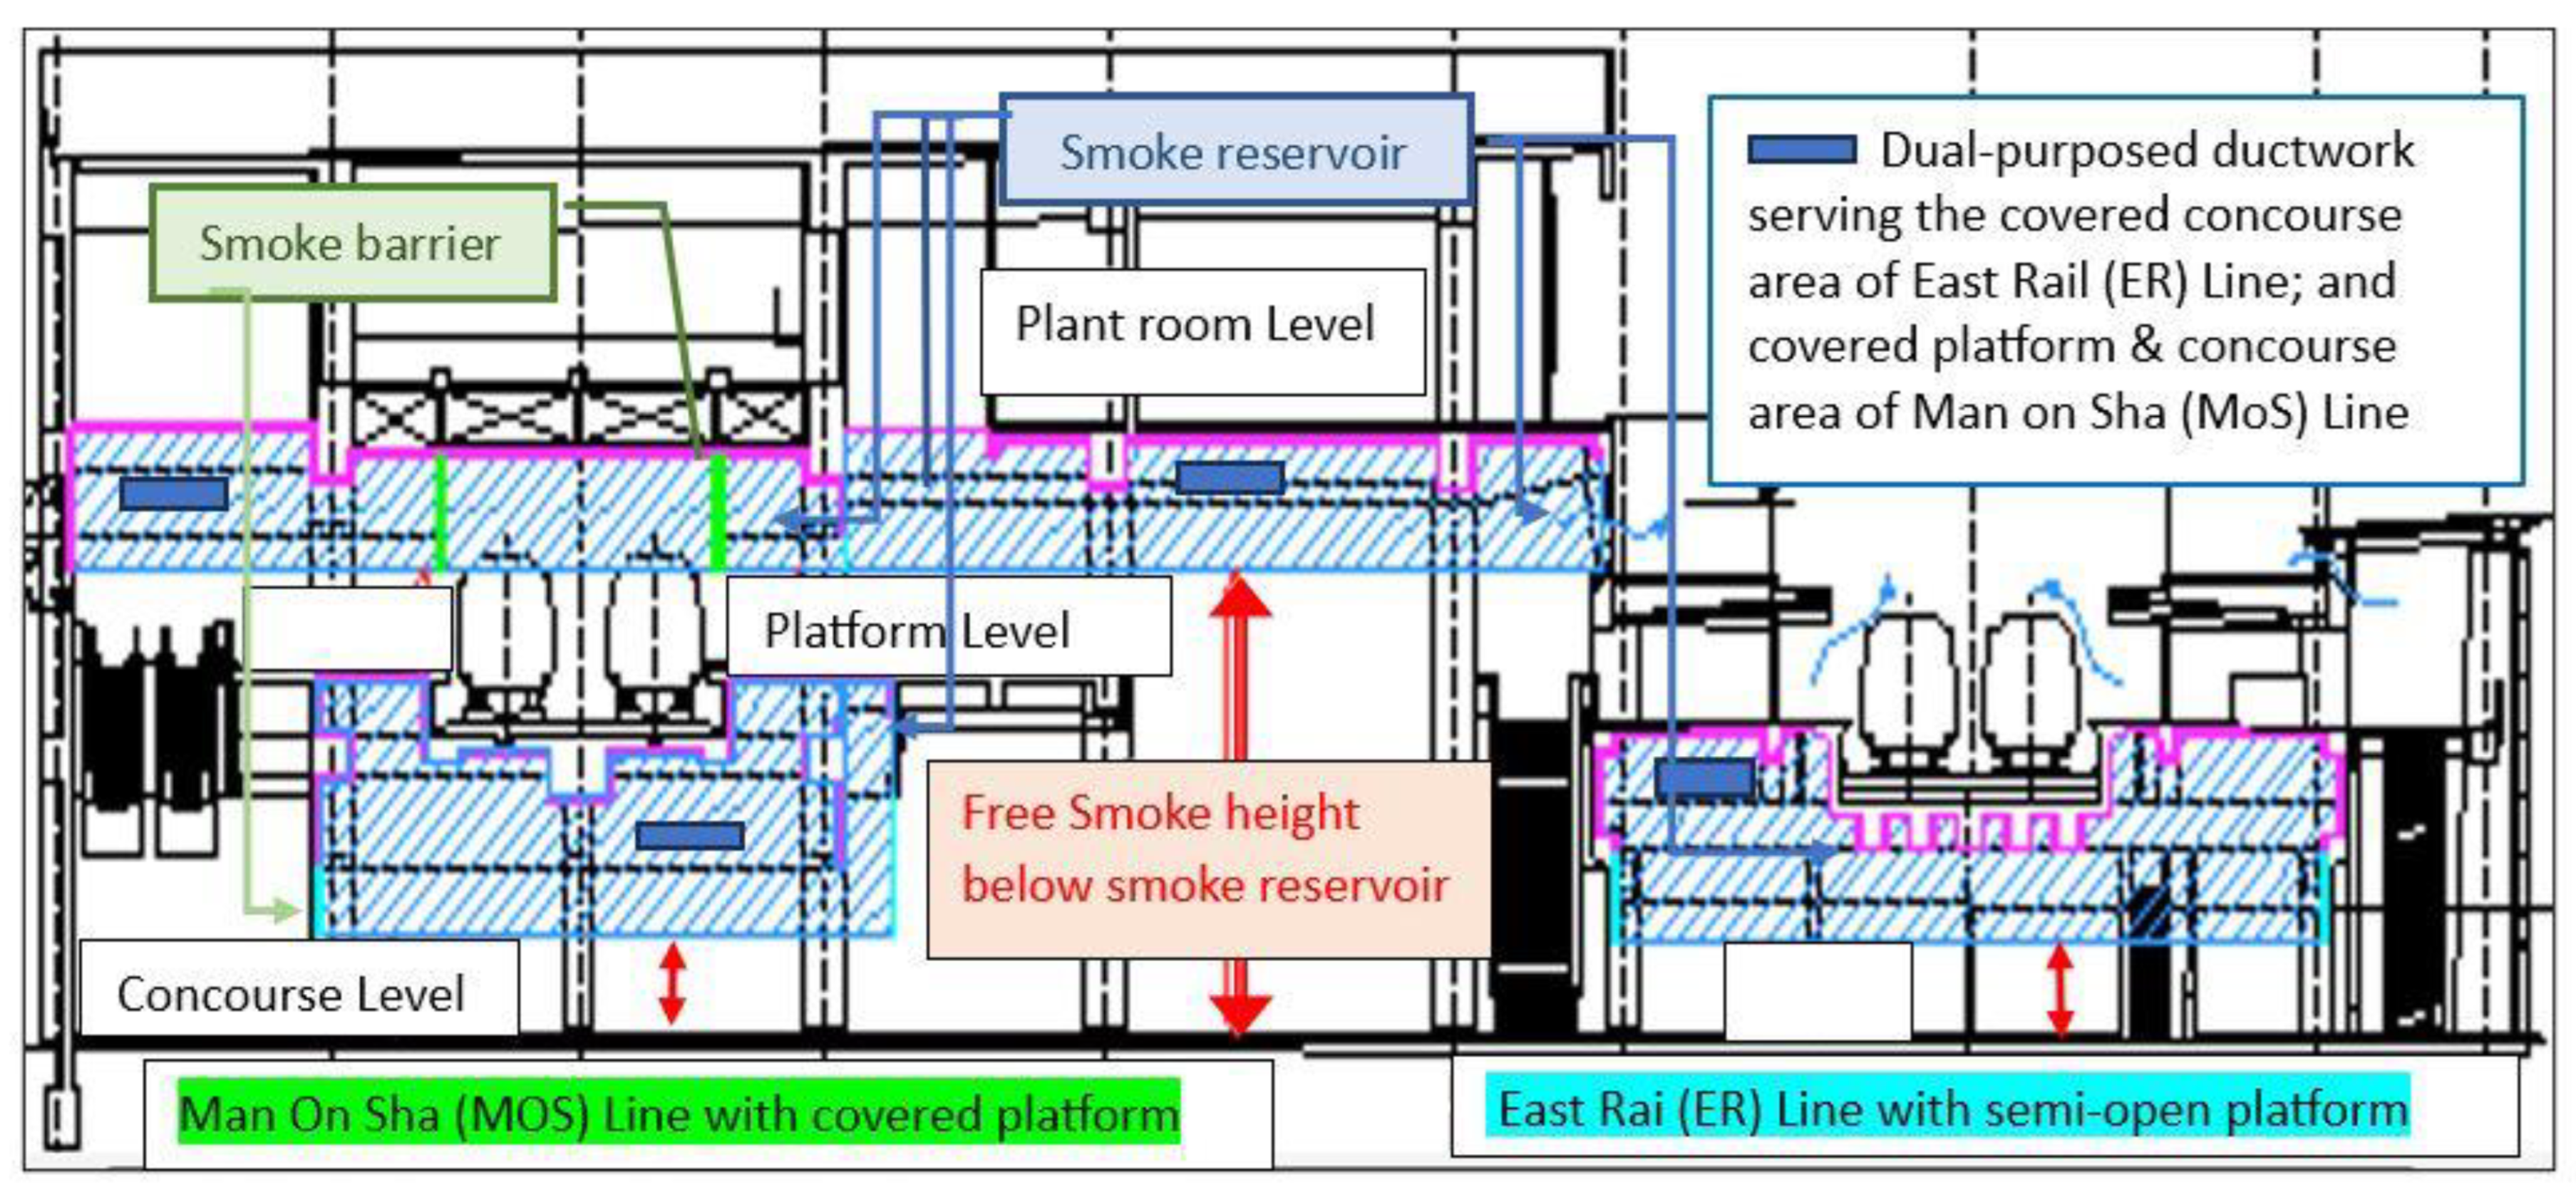
3.3. Integration with Other MEP Systems

In this large space study, there is still much research feasibility on the practice consideration, for example: using the return air duct at the ceiling as the smoke extraction system’s smoke ductwork, which can reduce the installation cost and space to achieve cost-effectiveness results. The author also uses this direction in the Mechanical and Electrical, Piping (MEP) system design serving one of the Hong Kong Mass Transport Railway (MTR) stations at Tai Wai, hereafter called Tai Wan Station. The Smoke Extraction Principle in Tai Wai Station uses a dual-purposed ceiling-mounted ductwork design to remove the smoky gases from the upper parts of a compartment during a fire. The details are illustrated in Appendix C. Smoke extraction aims to facilitate people’s escape by restricting the spread of smoke and hot gases in escape routes. In normal conditions, this smoke extraction duct is also a return air duct to provide circulating air conditioning to the occupied zone. Due to case-by-case site constraints, the design step and guidance are tabulated in Table 5. Cost-effectiveness is the originality of different project considerations. The quantifiable benefit of GIS, along with the critical design algorithm and prototype, need to be validated through actual data for the new project and retrofitting work of existing buildings with high ceilings. The significant percentages of energy and space-saving in GIS systems can further investigate compared to the other passive and active system designs in different high-ceiling buildings based on the provided design guidelines.

3.4. Guideline of GIS Application

There is currently no existing design procedure for GIS. Therefore, this technique aims to propose a set of design algorithms for GIS that can be experimentally and numerically validated. The proposed algorithm consists of five steps with essential components, which are tabulated below.
For item (2) in Table 5,
Q h & C = H L H G + M C p d T d t
where Qh&c is the heating or cooling consumption (kW), M is the thermal mass of the building (kg), cp is the specific heat capacity (kW/(kg·°C)), T is the indoor temperature (°C), t is the time step (1 min), HG the heat gains (kW), and HL the heat losses (kW) [26]. The 1-min simulation results are aggregated to hourly data to match the electricity consumption profile temporally.
For item 4 in Table 5, the cost-effectiveness study in large space installation is more significant than the small-to-medium application. In this large space study, there is still much research feasibility on the practical consideration of integrating with other ventilation systems to achieve a dual-purpose usage of system components. For example: using the return air duct at the ceiling as the smoke ductwork of the smoke extraction system, which can reduce the installation cost and space to achieve cost-effectiveness results, for example, using dual-purpose ductwork design as mentioned in the above Section 3.3 and illustrated the actual installation in Hong Kong Tai Wan MTR Station in Appendix C. In addition, this GIS can use during the epidemic by providing more fresh air in the occupied zone.
Due to case-by-case site constraints, the design step and guidance outline the design idea. For further energy-saving analysis in large-scale rooms, real-time optimization can be adopted to control all variable-air-supply at the occupied zone. The control parameter is based on the differential temperature between the occupied zone and the set point. A multiple-sensor-input with multiple-output (MIMO) design can ensure thermal comfort by addressing the vertical temperature gradient and achieving an even distribution of cooling load in the occupied level. Additionally, it can enhance energy efficiency by conditioning areas without cooling requirements (e.g., unoccupied areas) simultaneously. Using a wireless sensor network and advanced control techniques, this approach improves air conditioning systems’ thermal comfort and energy efficiency in large-scale rooms. It is recommended to install at least one sensor node at the occupied level in each area served by a single AHU supply zone [27]. All sensor nodes and receivers from a wireless sensor network can be deployed to measure and transfer the temperature data to a more sophisticated thermostat. The actual energy data-driven method can quantify behavioral patterns through transfer learning and provide practical guidelines for developing cost-effective data-driven solutions for building energy predictions [22,28].

4. Conclusions

The simulation results have shown that the retrofit model significantly improves ventilation performance compared to the baseline model. Moreover, the retrofit model saves energy by increasing the supply air temperature by 1.5 °C while maintaining good thermal comfort in the occupied zones. The improved Local Air Charge Index (LACI) indicates the potential for energy savings in ventilation fans by optimizing the total airflow rate to a lower value, thus reducing fan power or fan sizing.
The reduction of 1.5 degrees is based on the uniqueness of this sports field. The ambient surface temperature and layered treatment at longitudinal and traversal zones also take into account the use of air outlets and return air retrofitting technique from the development of GIS algorithm force on occupied and the possibility of integrating other building systems to achieve carbon neutrality. The results of this software provide designers with a scientific basis for a pre-construction review. Air temperature, flow rate, and various ventilation strategies affect thermal comfort. The findings are aligned with the trend of acceptance percentage and neutral temperature based on three ventilation strategies with six exhaust configurations for the small-to-medium-size air-conditioned space [29,30].
GIS does not impose special requirements on the air handling equipment and air ducts compared with the existing ventilation system. As explained in Section 3 above, the capacity required for a GIS system in a specific application is like that of the conventional approach. Therefore, the spatial requirements for the plant room are comparable to the existing design, with the added benefits of reduced annual energy consumption and operational cost.

Author Contributions

K.-K.D.T.: software, writing—original draft preparation, visualization. M.-L.A.F.: conceptualization, writing—review and editing, supervision, project administration. M.-L.A.F. and K.-K.D.T.: methodology, formal analysis, investigation, data curation, validation. All authors have read and agreed to the published version of the manuscript.

Funding

The research work received no external funding.

Institutional Review Board Statement

Not applicable.

Informed Consent Statement

Not applicable.

Data Availability Statement

No new data were created for this paper content.

Acknowledgments

I thank my City University of Hong Kong and J. Roger Preston consultant firm for their support. I am thankful to all the collaborative firms, engineers, and team members who inspired me to do this case study.

Conflicts of Interest

The authors declare no conflict of interest.

Appendix A

The conservation form of the control equation used in SOLIDWORKS flow simulation is listed as follows:
ρ t + ρ u i x i = 0 ( ρ u i ) t + ( ρ u i u j ) x j + p x i = x j τ i j + τ i j R + S i = 1 , 2 , 3 ρ H t + ρ u i H x i = x i u j τ i j + τ i j R + q i + p t τ i j R u i x j + ρ ϵ + S i u i + Q H H = h + u 2 2
where ρ is the fluid density in kg/m3; t is the time components in second; u i and u j are the fluid velocities in m/s; x i and x j are the coordinate directions; τ i j is the viscous shear street tensor in Pa; p is the pressure in Pa; Si is the mass-distributed external force per unit mass in kg/m2/s2; q i is the dissipation rate of the turbulent kinetic energy in W/kg; QH is the heat source/ sink per unit volume in kg/m3/s3; H is the height in meters; h is the thermal enthalpy in J/kg.
The energy equation adopted in the program is listed as follows:
ρ E t + ρ u i E + p ρ x i = x i u j τ i j + τ i j R + q i τ i j R u i x j + ρ ε + S i u i + Q H E = e + u 2 2
where e is the internal energy in J/kg.
For Newtonian fluids, the viscous shear stress tensor is defined as follows:
τ i j = μ ( u i x j + u j x i 2 3 δ i j u k x k )
where δij is the Kronecker delta function; μ is the dynamic viscosity coefficient.
Under Bossinesq assumption, the Reynolds-stress tensor has the following form:
τ i j R = μ t u i x j + u j x i 2 3 δ i j u k x k 2 3 ρ k δ i j
where μt is the turbulent eddy viscosity coefficient in Pa/s; k is the turbulent kinetic energy in J/kg; μt is determined by turbulence kinetic energy (k) and turbulent dissipation ( ε ) under the frame of the k- ε turbulence model. The relationship is listed as follows:
μ t = f μ C μ ρ k 2 ε
where fμ is the turbulent viscosity factor, and fμ is determined by the following expression:
f μ = 1 e x p   0.025 R y   2 ( 1 + 20.5 R T )
where RT = ρ k2/μ ε; Ry = ρ k1/2 y/μ; y is the distance from the wall.
Two additional transport equations are adopted in the program to describe the turbulent kinetic energy and dissipation rate of kinetic energy.
ρ k t + x i ρ u i k = x i μ + μ t σ k k x i + S k
ρ ε t + x i ρ u i ε = x i μ + μ t σ k ε x i + S ε
where Sk and are defined as follows:
S k = τ i j R u i x j ρ ϵ + μ t P B
S ε = C ε 1 ε k f 1 τ i j R u i x j + μ t C B P B C ε 2 f 2 ρ ε 2 k
Here, PB represents the turbulent generation due to buoyancy forces and could be expressed as follow:
P B = g i σ B 1 ρ ρ x i
where g is the gravitational acceleration in direction xi; the constant σ B = 0.9, and constant CB is defined as: CB = 1 when PB > 0, and 0 otherwise.
f 1 = 1 + ( 0.05 f μ ) 3
f 2 = 1 e x p ( R T 2 )
The constants , Cε1, Cε2, δk, δε are defined empirically. The simulation software Flow Simulation, the values are listed in Table A1.
Table A1. Constants of turbulence models.
ConstantsCμCε1Cε2δkδε
Values0.091.441.921.31.0

Appendix B

Outlook of the existing ceiling-mounted supply air ductwork and wall-mounted return louver associated with the plant room area serving the Sports Centre.
Figure A1. Ductwork layout plan of Sports Centre.
Architecture 03 00022 g0a1

Appendix C

Smoke Extraction Principle in Tai Wai Station using dual-purposed ceiling-mounted ductwork design to remove the smoky gases from the upper parts of a compartment during a fire. The aim is to facilitate people’s escape by restricting the spread of smoke and hot gases in the means of escape routes. In normal conditions, this smoke extraction duct is also a return air duct to provide circulating air conditioning to the occupied zone. In the following sectional views, the upper zone highlighted with Slash is used as a smoke reservoir to trap the smoke and remove it outside the Station during the smoke extraction process through the dual-purposed ceiling-mounted ductwork. This cost-effective concept is adopted in Hong Kong Mass Transportation Railway at Tai Wai.
Figure A2. Sectional veiw of interchange station for Man On Sha (MOS) Line and East Rail Line of Hong Kong Mass Transportation Railway (MTR) at Tai Wai, named “Tai Wai Station”.
Architecture 03 00022 g0a2
Figure A3. Dual-purposed ceiling- mounted duct for smoke extraction and return air system at Concourse level of Tai Wai Station.
Architecture 03 00022 g0a3

References

  1. HKEMSD. Hong Kong Energy End-Use Data. 2022. Available online: https://www.emsd.gov.hk/filemanager/en/content_762/HKEEUD2022.pdf (accessed on 5 June 2023).
  2. Energyland. Greenhouse Gases. Available online: https://www.emsd.gov.hk/energyland/en/energy/environment/greenhouse.html (accessed on 5 June 2023).
  3. Zhang, Y.; Wang, S. A review of ventilation strategies for large-space buildings: Current status, challenges, and future directions. Build. Environ. 2021, 196, 107800. [Google Scholar] [CrossRef]
  4. Heiselberg, P.; Brohus, H.; Hesselholt, A. Cooling of large spaces by displacement ventilation. Energy Build. 2001, 33, 579–586. [Google Scholar] [CrossRef] [Green Version]
  5. Santamouris, M.; Kolokotsa, D. Passive cooling dissipation techniques for buildings and other structures: The state of the art. Energy Build. 2010, 42, 762–769. [Google Scholar] [CrossRef]
  6. Li, L.; Zhang, Z.; Wang, S.; Yang, Y.; Zhang, G. CFD simulation and experimental study on the impact of different types of large space ventilation systems on indoor thermal environment. Energy Build. 2020, 225, 110347. [Google Scholar] [CrossRef]
  7. Li, D.; Luo, X.; Huang, Z.; Liu, L.; Li, X.; Du, Y. Comparative study of different ventilation systems on indoor thermal environment and energy consumption in large public buildings. Energy Procedia 2018, 152, 205–210. [Google Scholar] [CrossRef]
  8. Fan, Y.; Wang, S. A review of airflow distribution control strategies for large space buildings. Energy Build. 2021, 244, 111274. [Google Scholar] [CrossRef]
  9. Lin, C.H.; Chang, M.Y.; Cheng, Y.C.; Lin, C.W. Energy consumption comparison of different ventilation methods for large space buildings. Sustain. Cities Soc. 2019, 49, 101588. [Google Scholar] [CrossRef]
  10. Chen, M.; Wu, Y.; Wei, H.; Fang, L. Energy-saving design and performance analysis of ventilation systems for large-space buildings in winter. Energy Procedia 2019, 158, 640–645. [Google Scholar] [CrossRef]
  11. Xie, H.; Wang, Q.; Zhang, L. Effects of ventilation modes on indoor thermal environment and energy consumption in large space buildings. Energy Build. 2020, 213, 109841. [Google Scholar] [CrossRef]
  12. Zhang, L.; Fong, S.; Li, H.; Wang, S. Study on thermal comfort of people in large space buildings with various ventilation systems. Build. Simul. 2017, 10, 95–107. [Google Scholar]
  13. Buildings Energy Efficiency Ordinance. Available online: https://www.emsd.gov.hk/beeo/en/mibec_beeo_WhatsNews.html (accessed on 5 June 2023).
  14. Hong Kong Green Building Council Limited (HKGBC). Available online: https://www.hkgbc.org.hk/hk3030/eng/ (accessed on 5 June 2023).
  15. Energy Saving Policy Plan for Hong Kong’s Built Environment 2015–2025+; Environment Bureau: Hong Kong, 2015.
  16. Solidworks Flow Simulation Technical Reference; Solidworks: Waltham, MA, USA, 2021.
  17. Cheng, Y.; Lin, Z.; Fong, A.M.L. Effects of temperature and supply airflow rate on thermal comfort in a stratum-ventilated room. Build. Environ. 2015, 92, 269–277. [Google Scholar] [CrossRef]
  18. ASHRAE. ASHRAE Handbook 2013 Fundamentals; American Society of Heating, Refrigerating and Air-Conditioning Engineers: Peachtree Corners, GA, USA, 2013. [Google Scholar]
  19. Electrical and Mechanical Services Department HG. Code of Practice for Energy Efficiency of Building Services Installation 2018; Electrical and Mechanical Services Department HG: Hong Kong, 2018. [Google Scholar]
  20. Lam, J.C.; Chan, A.L.S. CFD analysis and energy simulation of a gymnasium. Build. Environ. 2001, 36, 351–358. [Google Scholar] [CrossRef]
  21. ANSI/ASHRAE Standard 55-2013; Thermal Environmental Conditions for Human Occupancy. ASHRAE: Peachtree Corners, GA, USA, 2013.
  22. Lin, Z.; Yao, T.; Chow, T.T.; Fong, K.F.; Chan, L.S. Performance evaluation and design guidelines for stratum ventilation. Build. Environ. 2011, 46, 2267–2279. [Google Scholar] [CrossRef]
  23. Ngarambe, J.; Yun, G.Y.; Santamouris, M. The use of artificial intelligence (AI) methods in the prediction of thermal comfort in buildings: Energy implications of AI-based thermal comfort controls. Energy Build. 2020, 211, 109807. [Google Scholar] [CrossRef]
  24. Moon, J.W.; Kim, J.J. ANN-based thermal control models for residential buildings. Build. Environ. 2010, 45, 1612–1625. [Google Scholar] [CrossRef]
  25. Wang, S.; Xing, J.; Jiang, Z.; Dai, Y. A novel sensors fault detection and self-correction method for HVAC systems using decentralized swarm intelligence algorithm. Int. J. Refrig. 2019, 106, 54–65. [Google Scholar] [CrossRef]
  26. Campana, P.E.; Cioccolanti, L.; François, B.; Jurasz, J.; Zhang, Y.; Varini, M.; Stridh, B.; Yan, J. Li-ion batteries for peak shaving, price arbitrage, and photovoltaic self-consumption in commercial buildings: A Monte Carlo Analysis. Energy Convers. Manag. 2021, 234, 113889. [Google Scholar] [CrossRef]
  27. Syed, A.H.; Kit, Y.R.K.; Gongsheng, H. Multiplexed real-time optimization of HVAC systems with enhanced control stability. Appl. Energy 2017, 187, 640–651. [Google Scholar] [CrossRef]
  28. Fan, C.; Lei, Y.; Sun, Y.; Piscitelli, M.S.; Chiosa, R.; Capozzoli, A. Data-centric or algorithm-centric: Exploiting the performance of transfer learning for improving building energy predictions in data-scarce context. Energy 2022, 240, 122775. [Google Scholar] [CrossRef]
  29. Fong, M.L.; Hanby, V.; Greenough, R.; Lin, Z.; Cheng, Y. Acceptance of thermal conditions and energy use of three ventilation strategies with six exhaust configurations for the classroom. Build. Environ. 2015, 94, 606–619. [Google Scholar] [CrossRef]
  30. Fong, M.L.; Lin, Z.; Fong, K.F.; Chow, T.T.; Yao, T. Evaluation of thermal comfort conditions in a classroom with three ventilation methods. Indoor Air 2011, 21, 231–239. [Google Scholar] [CrossRef] [PubMed]
Figure 1. Sequence of control action with major factors.
Architecture 03 00022 g001
Figure 2. (a) Three vertical zones study for GIS. (b) Three horizontal sub-divided occupied zones.
Architecture 03 00022 g002
Figure 3. (a) Fluid temperature with 7-level grid densities for the baseline model. (b) Fluid temperature with 7-level grid densities for the retrofit model.
Architecture 03 00022 g003
Figure 4. Baseline model: Ceiling supply and wall return.
Architecture 03 00022 g004
Figure 5. Retrofit Model: Occupied wall-level supply and ceiling return.
Architecture 03 00022 g005
Figure 6. (a) Average Operational Temperature. (b) Average Air Speed. (c) LMA. (d) LACI.
Architecture 03 00022 g006
Figure 7. (a) Average Operational Temperature Contour for Baseline model (z = 1.8 m). (b) Average Operational Temperature Contour for Retrofit model (z = 1.8 m). (c) Airspeed Contour for Baseline model (z = 1.8 m). (d) Airspeed Contour for Retrofit model (z = 1.8 m).
Architecture 03 00022 g007aArchitecture 03 00022 g007bArchitecture 03 00022 g007c
Figure 8. Overshoot and Undershoot.
Architecture 03 00022 g008
Table 1. Boundary conditions adopted in the simulations of an active system.
Supply OutletExhaust OutletSupply Flow RateExterior Environment Temperature
Baseline Mode16 °CPressure-outlet14.7 m3/s35 °C
Retrofit Model17.5 °CPressure-outlet14.7 m3/s35 °C
Table 2. Boundary conditions adopted in the simulations of passive system.
U-Value of Exterior WallU-Value of RoofU-Value of FloorU-Value of Window
Baseline Mode1.13 W/m2K0.38 W/m2KIsothermal1.4 W/m2K
Retrofit Model1.13 W/m2K0.38 W/m2KIsothermal1.4 W/m2K
Table 3. Comparison of AOT, AAS, LMA and LACI of two models at various zones.
ZonesHeight
(m)
Average Operative Temperature, AOT (°C)Average Air Speed, AAS (m/s)Local Mean Age, LMA (s)Local Air Change Index, LACI
BaselineRetrofitBaselineRetrofitBaselineRetrofitBaselineRetrofit
Occupied Zone 10.0–1.824.6525.450.280.14494.59115.030.867.08
Occupied Zone 20.0–1.823.9725.520.330.14429.42113.000.997.69
Occupied Zone 30.0–1.824.5425.460.230.14338.37122.241.287.05
Above Occupied Zone1.8–6.025.4827.200.170.07457.33287.380.992.11
Below Ceiling6.0–9.325.3427.840.230.07422.04412.941.191.10
Table 4. Comparison of ADPI, PMV and PPD of two models at various zones.
ZonesHeight
(m)
Air Distribution Performance Index, ADPI (%)Predicted Mean Vote, PMVPredicted Percentage of Dissatisfied, PPD (%)
BaselineRetrofitBaselineRetrofitBaselineRetrofit
Occupied Zone 10.0–1.872.3596.650.160.436.99.6
Occupied Zone 20.0–1.855.0997.37−0.090.446.19.6
Occupied Zone 30.0–1.885.6297.000.160.427.49.6
Above Occupied Zone1.8–6.089.7286.580.400.609.612.9
Below Ceiling6.0–9.356.2177.140.350.8111.519.7
Table 5. Development of Green Air-distribution System (GIS) Algorithm.
Steps (1) to (5)Items to be Developed
(1): Judging the control measures GIS
  • Understand all requirements, such as functional, aesthetic, operational, and any constraints in the existing project.
  • Adopting sequence control action to optimize energy use and thermal comfort.
(2): Calculating cooling load
  • Calculating space cooling Load;
  • Determine influential cooling load factors, such as local regulation and culture factors.
(3): Calculating effective cooling load and ventilation performance at breathing height of the occupied zone
  • Determine the preliminary supply air temperature;
  • Determinate the required flow rate of the supply air;
  • Determinate the ratio of fresh air to the supply air;
  • Ventilation performance evaluation
(4): Cost-effectiveness study by integrated with Mechanical and Electrical Piping (MEP) and its control system
  • Using well-designed system component(s) to integrate with other MEP Systems with advanced control strategies.
(5): Evaluation process
  • Validation of simulation data and results
  • Estimate the merit points, such as Energy-saving potential
Disclaimer/Publisher’s Note: The statements, opinions and data contained in all publications are solely those of the individual author(s) and contributor(s) and not of MDPI and/or the editor(s). MDPI and/or the editor(s) disclaim responsibility for any injury to people or property resulting from any ideas, methods, instructions or products referred to in the content.

