Article

Assessing Participation: Toward Long-Term Experiences, Trajectories and Maturity

by
Clémentine Schelings
* and
Catherine Elsen
Department of Urban and Environmental Engineering, University of Liège, 4000 Liège, Belgium
*
Author to whom correspondence should be addressed.
Architecture 2022, 2(3), 518-543; https://doi.org/10.3390/architecture2030029
Submission received: 31 December 2021 / Revised: 20 July 2022 / Accepted: 21 July 2022 / Published: 26 July 2022
(This article belongs to the Special Issue Contemporary Issues in Participatory Architecture)

Abstract

:
Building knowledge on participation successes and failures is essential to enhance the overall quality and accountability of participatory processes. This paper relates to participatory assessment conducted in four cities, where 12 participatory workshops were organized, bringing together more than 230 participants. On-the-spot feedback was collected from the participants and generated 203 logbook entries, which helped define participant-related variables. Those variables in turn unfolded unique participatory trajectories for each participant. Four retrospective focus groups were then organized to bring qualitative, in-depth understanding to the participants’ expectations and (dis)satisfactions all along the participatory processes. On the basis of these empirical data, we developed a contextual, analytical tool to review participation in a longitudinal way. This qualitative tool articulates several intertwined influences: the level of satisfaction, the level of expectations and participatory background from the participants’ perspectives, as well as the participatory maturity from the organizing agency’s perspective. We argue that evaluating participation in the long term and in a transversal way, focusing on agencies’ and participants’ trajectories rather than uniquely on on-the-spot experiences, provides additional meaning to criteria applied to participation evaluation and teaches us more about participation quality and efficiency than repeated assessments of disconnected and isolated initiatives.

1. Introduction

Designers and users are inextricably related in regard to both the design process and the design output. Designers, and especially architects, have major impacts on the quality of the built environment, i.e., on the quality of life of many people. Designed artifacts, on the other hand, are useless and forsaken unless endorsed by end-users [1,2]. As a consequence, the traditional model of architectural design seen as the result of a sole master’s artful persuasion [3], although still widespread, is nowadays considered outdated and no longer practicable [1,4,5,6], especially in view of users’ current willingness to integrate the process [7] and to enrich it with their unique and relevant expertise [8].
Acknowledging such an evolution, urban planning was among the first design disciplines to upscale design participation by integrating to the process those who would ultimately be affected by the design [9,10], paying particular attention to the neighborhood needs and desires in regard to temporary and permanent public spaces [11]. Disciplines such as product, service, social or software design also progressively shifted over the past four decades from “utilizability” to “user-centered approaches” and to “user-driven experiences” [12,13], eventually moving forward to “post-anthropocentric” approaches that equally include human and non-human actors to reach more participatory, inclusive and ecological solutions [14,15]. Resources for design participation such as “participatory design”, “co-design” or “open innovation” emerged, either in an institutionalized way (end-users volunteering to integrate participatory, top–down initiatives [16]), or in an “horizontal” way, i.e., the sole innovative consequence of practical and concrete problems end-users decide to tackle by their own means [17].
The practical implementation of such approaches over the years nevertheless proved to be challenging. The participatory design’s egalitarian approach, for instance, foreseeing in the “authority of consumers” a way to increase social awareness, consciousness and cultural pluralism [18], was sometimes reduced to a simple consultation tool with limited genuine decision making and became subverted by populist discourses leading to tokenism [19], retrieving possibilities of involvement from “resource-weak” stakeholders [1,20,21]. Moreover, such approaches were found to be rarely conducive of convincing solutions [4,22,23] and dismissed both the frequent unforeseen users’ appropriations [20,24,25] and the competing constraints designers have to deal with on a daily basis, sometimes prevailing over user-related values [26].
Looking back on these challenges, several authors underlined the necessity to start evaluating participatory initiatives in order to highlight recurrent successes and drawbacks associated with their implementation. Such evaluation indeed proves to be essential to build knowledge and increase the quality and accountability of participatory processes [27,28] and to empirically demonstrate their usually expected and acclaimed—but somehow intangible—benefits over non-participatory approaches [29]. Assessing Canadian public participation experiences and their impacts, Abelson and Gauvin consider that participation evaluation is “still in its infancy”, despite years of documenting a variety of experiences [30] (p. v). They formulate six main research gaps to overcome in order to reach a certain level of maturity in that regard. The very first gap holds our attention in this specific paper: “evaluate the context more rigorously” (p. v). Whereas Rowe and Frewer call for “contextual attributes” to be developed in regard to each participatory episode [31], our inquiry will rather focus on longitudinal experiences and trajectories (from both organizing agencies and participants) in order to qualify various levels of participatory maturity.
While the following section will briefly review some of the most influential papers in the field of participation evaluation, Section 3 will formulate the research questions. Section 4 and Section 5 will, respectively, present four cases and the methods rooting our data collection across the Walloon territory (Belgium). The empirically rich results will expand through Section 6, and Section 7 will develop a threefold contextual analytical tool to review participation in a longitudinal way. Concluding remarks will eventually review the theoretical and practical contributions of this paper before considering the limitations of the current study and expand toward paths for future research, which are still crucially needed in the field of participation evaluation.

2. Literature Review

As summarized by Bossen and colleagues, the evaluation of social programs has been dominated for long by positivism, in an illusive attempt to reach objective knowledge through quantitative approaches only. Progressively, the field expanded to include qualitative, interpretative and constructivist approaches and in this way enriched its methods, models and theories [32]. This brief literature review will browse through the last 30 years of research in participation evaluation and summarize the most frequent difficulties; the most frequently used criteria and recent contemporary issues when it comes to assessing participation. By doing so, we do not intend to conduct meta-comparative analysis of various evaluation processes, activities and tools nor to critically review them in the hope of providing suggestions to enhance them. We are rather interested in building our own evaluation process—inspired by past initiatives, as reported in the literature—and see how our own process in turn may/may not generate valuable feedback, which is able to enhance participatory processes.

2.1. Recurring Difficulties in Assessing Participation

The importance of participation is nowadays largely acknowledged by researchers and practitioners. Yet, participatory processes often fail to reach all of their goals, and the field of participation still lags behind when it comes to clarifying its successes and failures [33].
As early as 1981, Rosener documented four key challenges when assessing public participation [34]: (i) the lack of commonly accepted evaluation criteria, to which is added (ii) the lack of widely acknowledged evaluation methods and (iii) the absence of reliable measurement tools, all of those being entangled with the fact that (iv) public participation, as a concept, is complex and associated with a set of intertwined, hard-to-measure values.
Nowadays, post-participation evaluations become more systematic but are more often than not conducted as a “routine obligation with little attention to learning, knowledge and value” [32] (p. 159), in an attempt to make participation accountable through high-level indicators. Such a reluctance to thoroughly evaluate participation roots back to Rosener’s lack of methods and resources, to which Laurian and Shaw add lack of political commitment [33].
Building knowledge on participation successes and failures yet seems essential in order to improve and adapt the methods and tools and, as a consequence, to enhance the overall quality of participatory processes [28]. Increasingly attracting scientific interest, assessment procedures with the primary objective of gaining knowledge [32] have thus emerged these last 20 years and have progressively generated a growing amount of evaluation criteria.

2.2. Multiple Criteria for Assessing Participation

While Rosener in 1981 suggested user-based evaluations starting from participants’ satisfaction (with both the process and its outcomes), Webler defined “fairness” (as in equal distribution of opportunities throughout the participation process) and “competence” (as in appropriate knowledge and understanding achieved for every stakeholder) as the main principles for assessing participation [35]. Looking at various criteria to assess public participation “against external goals”, Laurian and Shaw [33] pinpointed Beierle and Cayford’s “social goals”, such as educating and keeping the public informed; integrating public-driven values into the decision-making process; solving conflicts among competing interests and building trust in institutions (Beierle 1998; Beierle and Cayford 2002, in [33]), or Innes and Booher’s focus on institutional capacity and resilience (2002, in [33]), to which they added balance in power sharing in between institutions and citizens.
In the field of co-design adapted to older adults, Hendriks, Slegers and Duysburgh [36] suggested the Method Stories approach for assessing processes once they are completed but still building on what designers did and felt during the process (in situated action), and not on basis of data collected afterwards, for instance through post-event interviews. Among the suggested criteria building toward positive assessment, we pinpoint the involvement of the participants in defining the co-design process itself; the use of common language to improve the balance between participants and designers; the fact that the process itself certainly will impact the participants and should above all constitute an enriching experience; the way ethical issues were addressed (before or during the process); the flexibility and willingness to adjust co-design methods and techniques to take into account the desires and characteristics of the participants, and eventually the way the designers dealt with challenges encountered during data collection, analysis and interpretation.
Reviewing 30 public participation evaluation studies, Rowe and Frewer [31] first acknowledged the vast variability found in terminology to describe both the processes and the evaluation criteria, with very rare definitions for those criteria. They managed to circumscribe this variability to 24 criteria relating to processes and 19 relating to outcomes while still underlining their lack of generalizability. Process evaluation criteria for instance cover representativeness, participation rate, continuous involvement, transparency, or satisfaction, while outcomes evaluation criteria would focus on the influence on public and participants’ opinions; conflict resolution; cost effectiveness or proportion of public views incorporated into decision making.
More recent literature review work conducted by Bossen and colleagues [32] moreover identifies three main types of evaluation: while 32 out of 66 papers were concerned with participation evaluation in terms of outputs (number of participants; of workshops; of design ideas, concepts, products or prototypes and their quality, etc.), 17 rather referred to evaluation in terms of methods, tools and techniques, and the remaining 17 tackled evaluation in terms of process and outcomes, which are understood here as gains and benefits for the participants (including involvement and influence on decision making; improvement of participants’ life or mutual learning).
Building on a survey conducted with 761 experts in participation, Laurian and Shaw also sorted the main criteria for assessment into three categories, namely “outcomes”, “processes” and “satisfaction” [33]. Eventually, let us refer to the work of Klüber et al. [28] that concludes that most evaluations are concerned with achieving material outcomes; some of them are researching and comparing the methods (mainly their theoretical implications); and only few of them are looking into processes and outcomes concerning user gains.
Looking back at 40 years of participation evaluation, we note that most criteria identified by fellow researchers relate to “circumscribed” participation approaches, that is considering participation through a certain predefined time frame and through the prism of a specific project/issue. We wonder whether participation assessment could benefit from a more longitudinal perspective and whether “time” could play a role in participation maturity, both for the organizing agencies and for the participants, and could in turn enhance participation.

2.3. Contemporary Issues when Assessing Participation

To conclude this literature review, we decide to retrieve insights from more recent work, i.e., participation evaluation studies of less than five years. We do not pretend to cover the full diversity of recent scientific publications, but we rather deliberately identify three contemporary issues that particularly resonate with our own interests when it comes to participation evaluation.
First, as underlined by Drain and colleagues, there is still today too little focus on participant empowerment during participation [29] and, we would add, “through time”. Participatory processes are overly concerned with (design-related) outputs and do not sufficiently acknowledge the short or long-lasting effects they might have on participants, be they lay persons or experts.
Second, we still regret the lack of participation evaluation by the participants themselves: those participants’ perspectives are either rarely taken into account [28] or dismissed and reserved for experts, allegedly because participants would lack direct interest in the evaluation of participatory processes [37]. Citizen participation paradoxically remains a subject where participants’ experiences and capacity to determine a process’ strengths and weaknesses are underrated, thus denying the great value held by such “meta-participation” through evaluation.
Third, when taken into account, participants’ feedback is still more often than not collected in a superficial and quantitative way, with very few studies studying it in depth and in a qualitative way [32,38]. When conducted qualitatively, they often proceed to retrieve assessment retrospectively, while evaluations should also cover short-term perceptions [28] as to grasp both on-the-spot and long-term phenomena.

3. Research Questions

Considering the above, we seek to integrate the notion of temporality into the evaluation of participatory processes, as conducted by the participants themselves. The concepts associated with participation are multiple, complex, and value-laden. We argue that, as a consequence, participation assessment is particularly time-sensitive and context-dependent. It thus becomes difficult to enhance participation when only looking through the lens of one peculiar participatory event. We make the hypothesis that evaluating participation over the long term and in a transversal way, focusing on agencies’ and participants’ trajectories rather than uniquely on on-the-spot experiences, will teach us more about participation quality and efficiency than repeated assessments of disconnected and isolated initiatives. We thus formulate the following research questions:
  • When applied longitudinally over long periods of time, what do evaluation criteria teach us about participation (its successes and failures) in terms of outputs, outcomes, and processes?
  • Looking at various participatory trajectories (from both organizing agencies and participants), is there any level of participation maturity emerging over time, which could contribute to participation enhancement?
The participatory events we are researching in this paper are exclusively co-design processes (i.e., face-to-face workshops contributing to a design process and including collective creativity, in accordance with Sanders and Stappers’ understanding [39]). The following section will briefly present the four participatory cases that were studied.

4. Cases’ Presentation

4.1. Context of the Participatory Initiative

This research was conducted in the framework of the “Wal-e-Cities” research portfolio, which was co-funded by the European Union and the Walloon Region (south part, French-speaking part of Belgium). More specifically, the authors were active on a sub-project that aimed to improve well-being in urban areas through citizen participation. The operational goal for us, the researchers (acting here as facilitators/participation professionals), was thus to organize and conduct participatory processes in four pilot cities, and to initiate projects that organizing agencies (here, the cities’ institutions, at a municipality or school level) would implement while aiming at increasing citizens’ well-being. Therefore, we decided to organize a similar participatory process in each of the four Walloon cities, as generically illustrated in Figure 1, involving citizens through successive face-to-face co-design workshops.
In addition, the scientific goal for us, researchers, was to design and implement assessment tools (logbooks and focus groups, see Section 5.1) to comparatively analyze the outputs, outcomes, and feedback over the implemented process through the cities, thus trying to delineate how participation could be enhanced overall. The organizing agencies had no particular interest in participation assessment, and they did not require it; they were also not interested in becoming involved in the design of the assessment itself, even though they were systematically invited to take part in debriefing meetings (organized in between co-design workshops) during which participants’ feedback was studied. The evaluation process thus resulted from our own interest (as researchers) to generate data that could be helpful to enhance participation. Organizing agencies, on the other hand, were rather interested in the processes’ outputs and positive political impacts of simply being seen as “supporters of participation”.
The authors of this paper designed every step of the protocol, organized the workshops and facilitated them, taking the lead as researchers/facilitators/participation professionals of the entire process. The protocol is structured in five main stages:
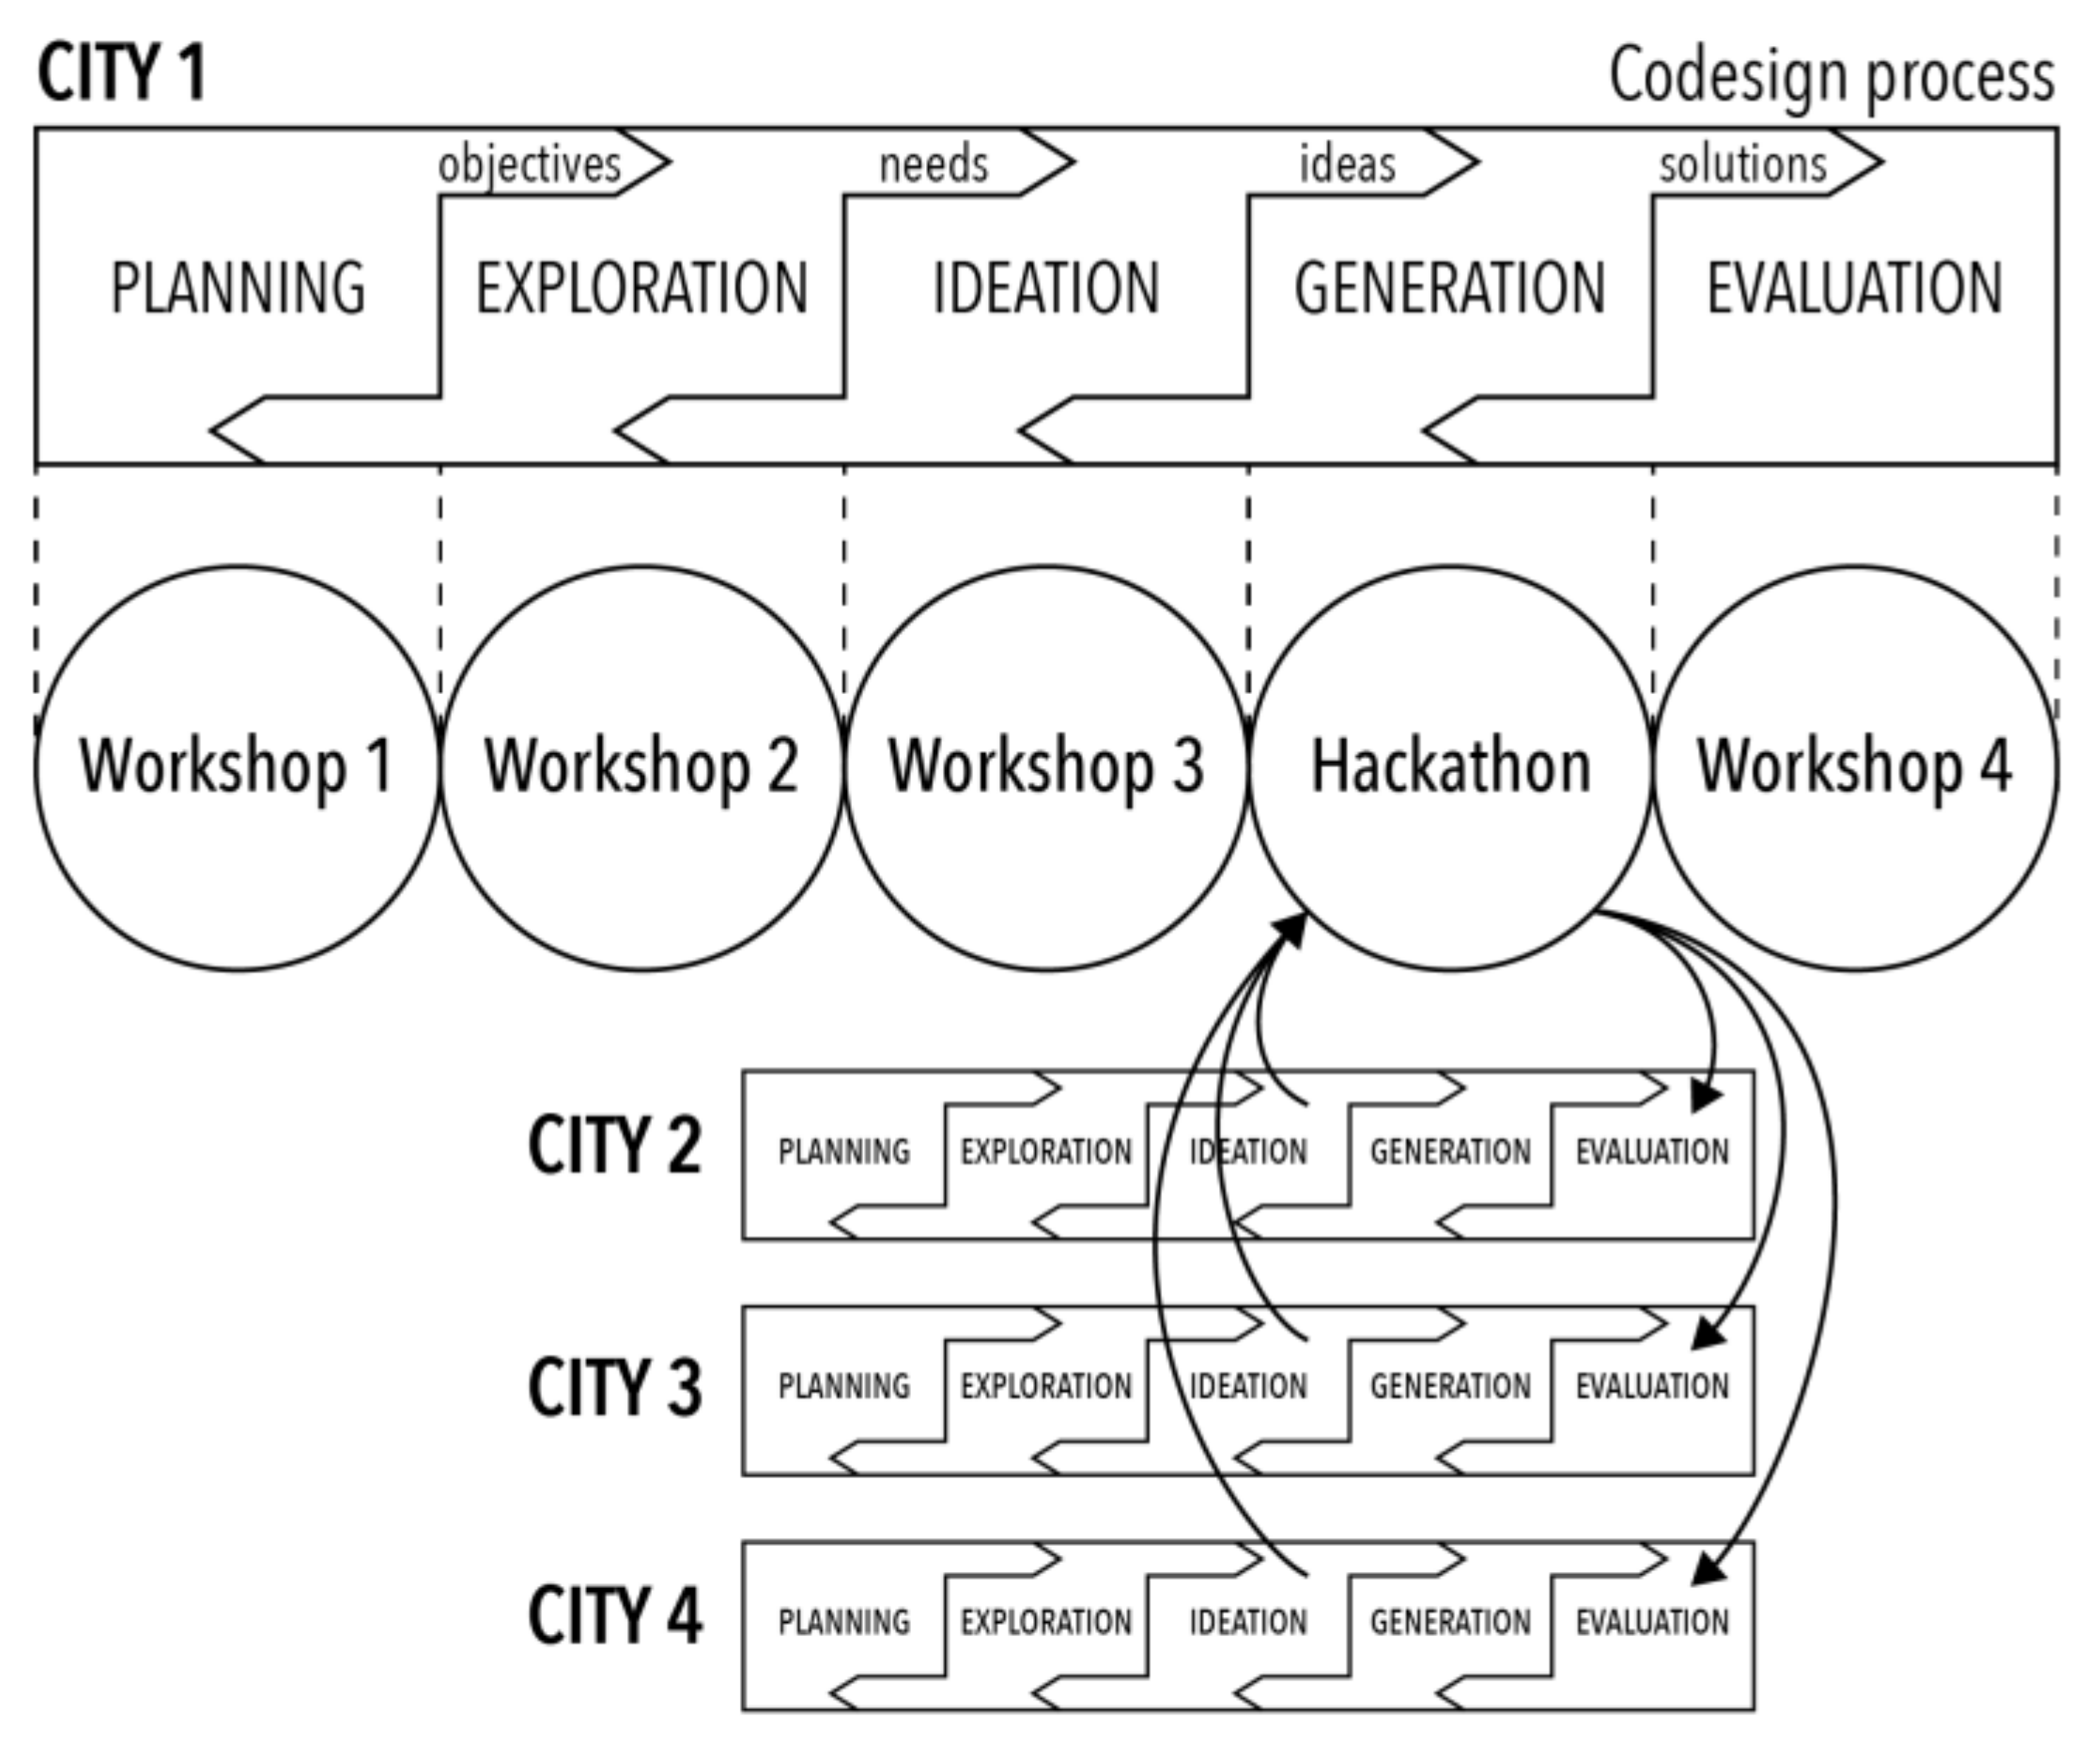
  • Workshop W1 invites citizen participants to contribute to the planning step, which defines the goal of participation, the recruitment strategy and the topic to be addressed through the process;
  • Workshop W2 explores the needs, problems, desires, and priorities of the participants in relation to the topic chosen at the end of workshop W1;
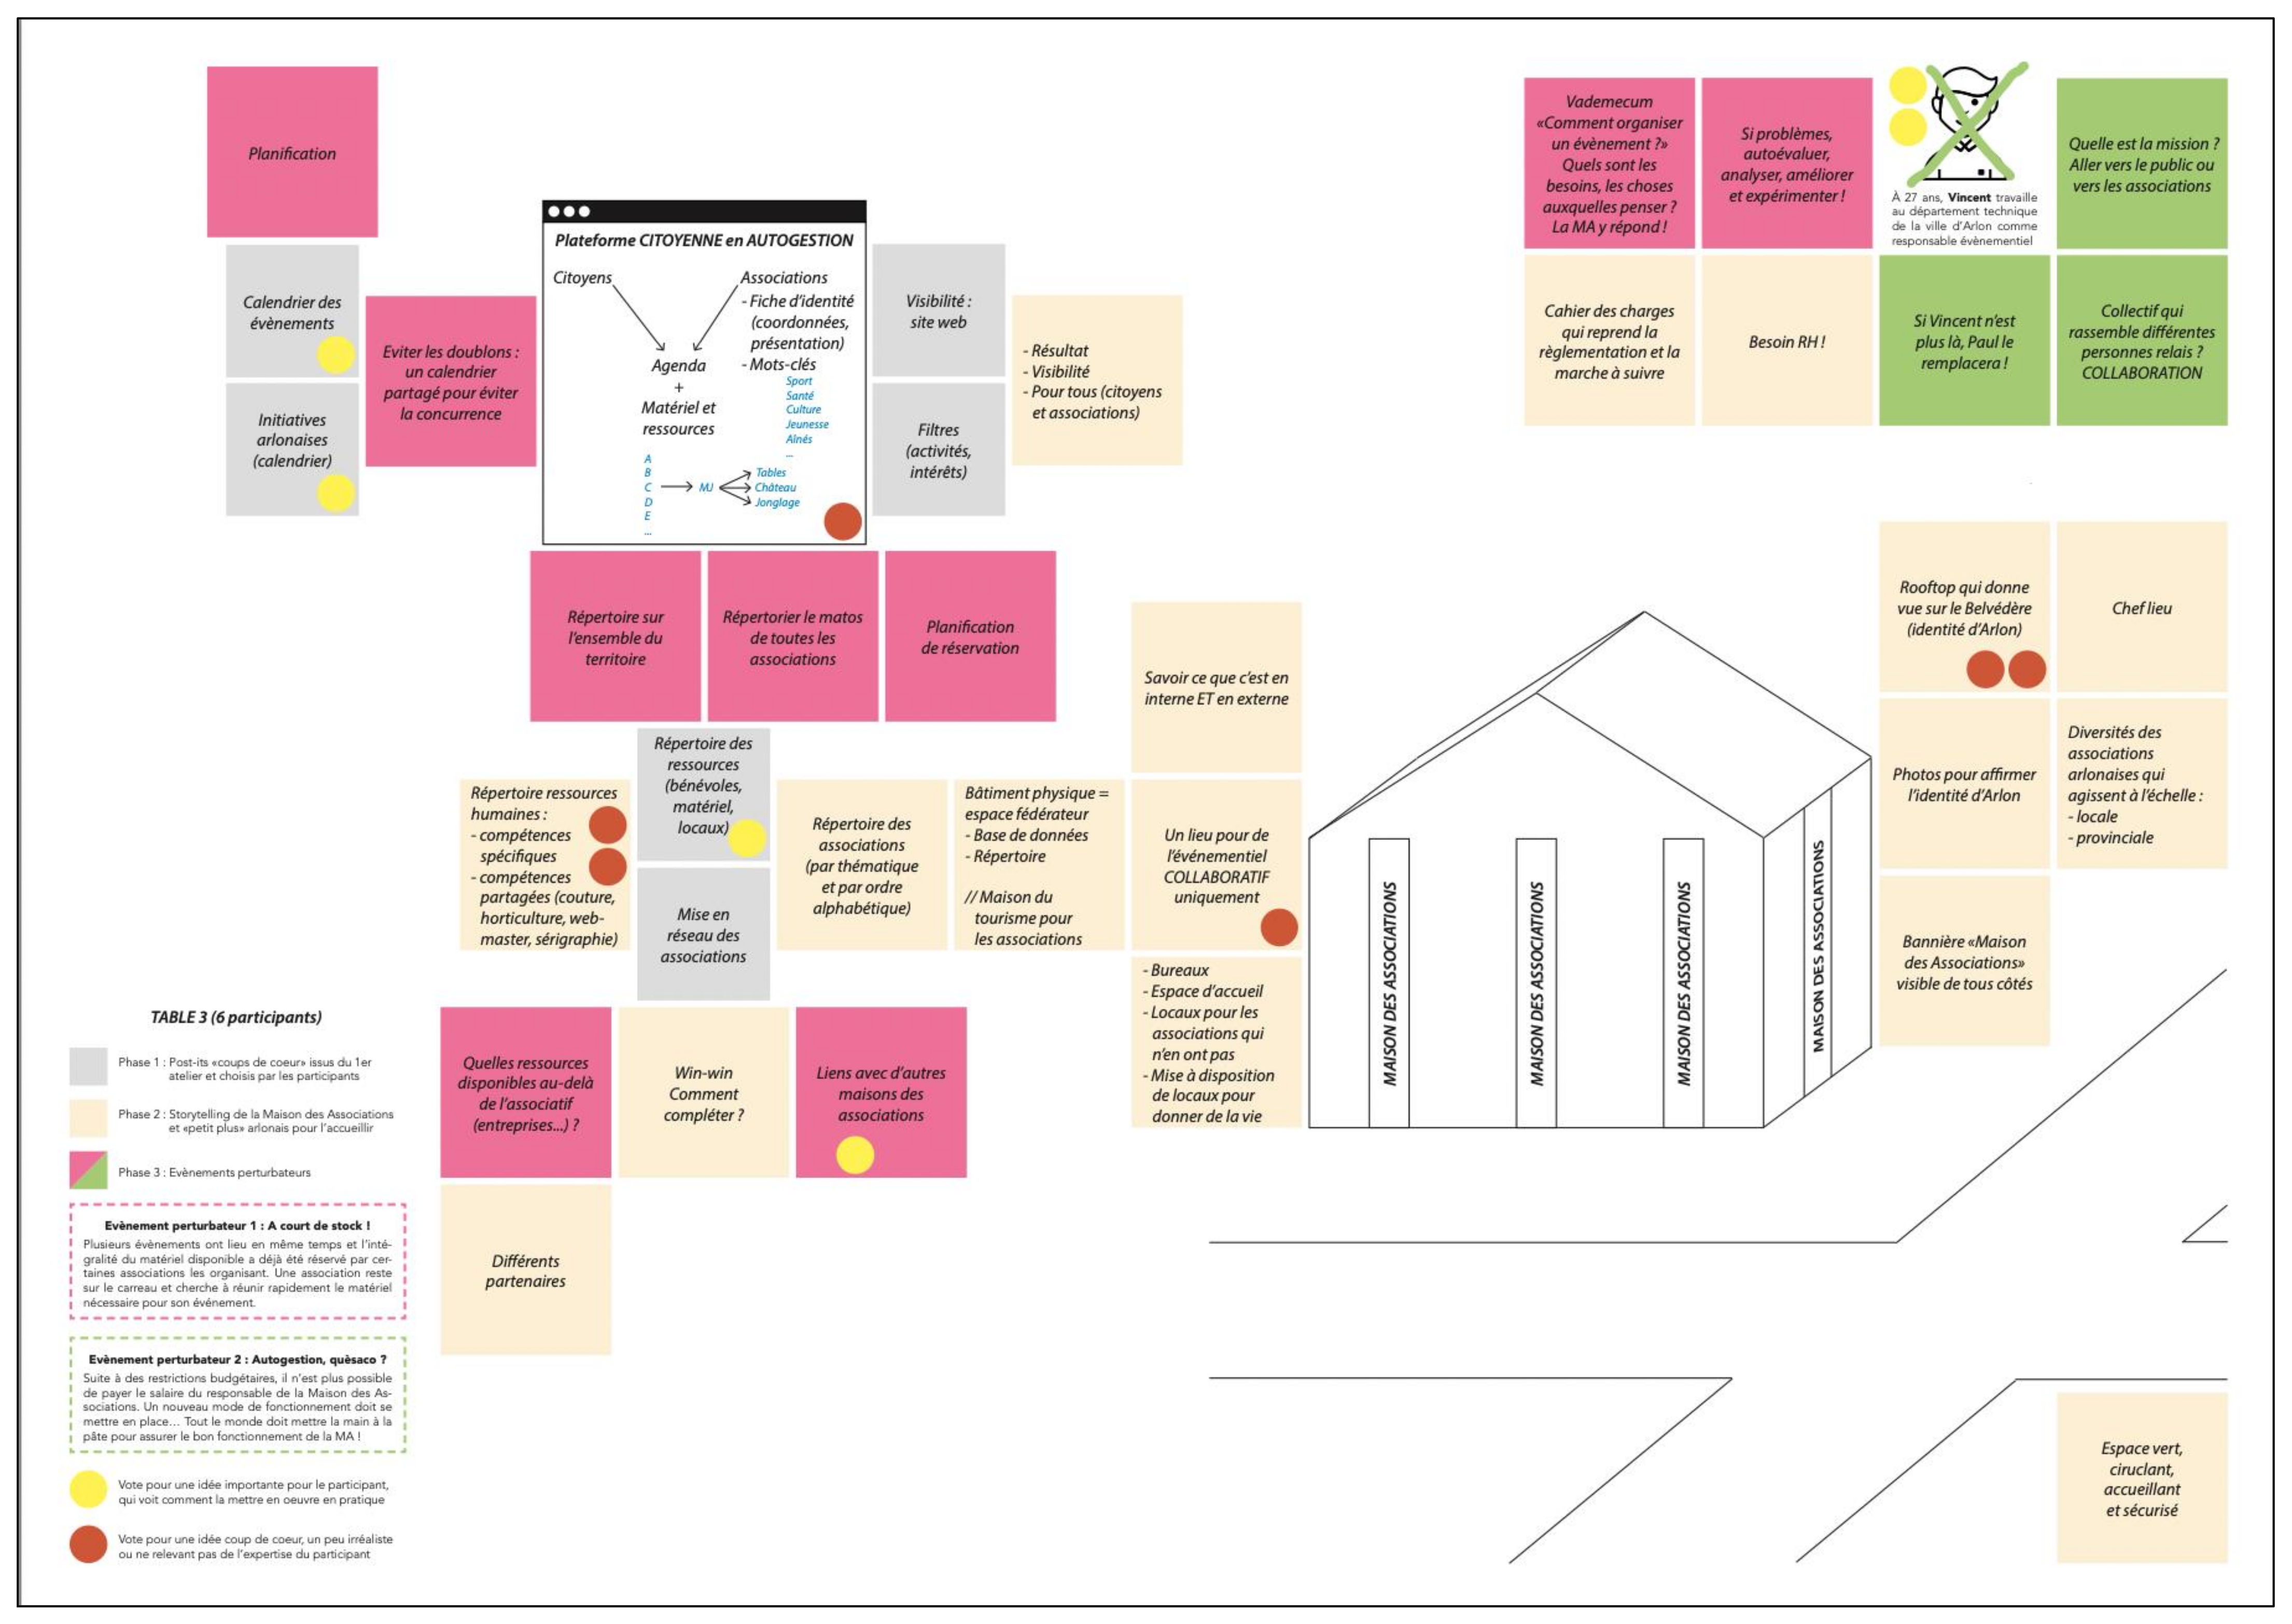
  • Workshop W3 brings out ideas in response to the needs and concerns identified in workshop W2. During this stage, the participants first formulate their ideas freely, together select a few of them and then summarize those under the form of project sheets. These project sheets are eventually synthesized through short video clips which are submitted as “challenges” to the hackers participating in the next stage;
  • The fourth step of the process is the generation of concrete prototypes and therefore requires professional expertise (in design, architecture, IT development, management, communication, etc.). We call on the teams of the “Citizens of Wallonia” hackathon organized in Wallonia (by FuturoCité with the support of the Walloon Region) from 6 to 8 March 2020, only one week before the COVID lockdown in Belgium;
  • Workshop W4 aims to present the prototypes developed during the hackathon to the citizens and to collect their feedback.
Between March 2019 and February 2020, twelve participatory workshops were organized in the four cities. As shown in Table 1, these workshops brought together more than 230 participants in total and focused on a different theme in each city. Another difference between the four processes is that Workshop W4 was eventually only organized in City B. This decision stemmed from the output of the hackathon (see Section 4.2). Moreover, there was no workshop W1 for City C, since the city representatives decided to choose the topic without citizens’ input, given that the city schedule was quite tight, which added to the huge difficulty to recruit participants for such a planning workshop.
Each workshop began with an ice-breaker activity (usually using a local photo-language exercise) and a contextualization of the whole initiative. From the outset, the complete protocol and its justification were therefore provided to the participants in order to remain fully transparent about the objectives at each stage. In particular, we informed participants about the transmission of their ideas to the hackathon participants. Citizens participants were therefore aware that analog ideas (such as the outline of an architectural project or the definition of internal house rules for a shared space, for instance) did not necessarily fit in with the spirit of the hackathon, and they were much more likely to push forward digital solutions such as mobile applications or connected objects for example (Figure 2). Nevertheless, we did not limit the ideation process to digital projects only, responding to the willingness to let all types of ideas emerge in response to the chosen issue. The decision to implement non-technological ideas was left to the organizing city, to which we provided the whole set of data resulting from the workshops.
Moreover, participants were warned that the hackers themselves would decide on which subject they would work on and that we had no control over their choice. The video clips suggested as challenges were an effective way to publicize the ideas coming from each participatory process, but we had no guarantee that the hackathon teams would take up one of these challenges. In that regard, it was quite possible that some ideas would attract several hackathon teams, while others would remain orphaned.
Furthermore, it should be noted that a co-design process is intrinsically iterative and that some backtracking is sometimes necessary to achieve a satisfactory result. Yet, due to time and organizational constraints, we never completely returned to a previous step, but we did revisit some decisions all along the process. For example, the ideation phase could give rise to new needs that were not anticipated in the previous stage but that still could be exploited subsequently. Similarly, the facilitation protocol could not be fixed at the outset but had to evolve from one workshop to another given the issues that arose from the previous stages. This flexibility is required to design a facilitation protocol for each workshop, thus always unique and tailor-made for each city.
Finally, the generic protocol (Figure 1) itself had to evolve, considering some overlaps between its theoretical stages. Indeed, we sometimes initiated the exploration phase as early as Workshop W1 or started the ideation phase as early as Workshop W2. These adjustments depended on the maturity of the participants’ thinking and stemmed from the sometimes tenuous limits between needs, ideas, and solutions generation. Nevertheless, we wanted to avoid confusion and always clearly reformulated the goals of each workshop and each activity early on at the beginning of each event. These small overflows from one stage to the next are empirical evidence of the flexible nature of the participatory protocols put in place. In practice, the structure of the participatory process is therefore less fragmented than the somewhat too linear representation suggested by the generic protocol (Figure 1).

4.2. Key Results of the Participatory Initiative

The four participatory processes attracted a different audience, gathering participants with various profiles, depending on the theme of the workshop and the context of the city. Without going into detail about the audience at each workshop, Table 2 provides an overall picture for each city.
The four cities did not all provide the same number of challenges to the hackathon. This number varies between one idea in City C and five ideas in City B, depending on three factors:
  • The number of participants involved: the more participants, the higher the number of challenges. Indeed, we divided all the citizens present in workshops W3 into tables of four to eight people, each table working on a specific topic. Since each table proposed a video clip with a project sheet, it is quite logical to obtain more ideas from City B than from City C;
  • The level and nature of motivation. The level of creativity and therefore the number of ideas proposed is often directly related to the intrinsic or extrinsic nature of the participants’ motivation [40]. For example, participants from City B are intrinsically motivated by the “house for associations” project and are full of ideas to improve a situation that affects them closely. Conversely, participants from City C were very difficult to recruit, and some of the municipal employees were only present because they were forced to be. Their relationship to the project is therefore completely different, as they just wanted to fulfill their professional duty and not to satisfy a personal interest;
  • The nature of the proposed ideas. The technological or analogical connotation of the suggested challenges impacted the choice of the hackers. For example, the students from City-D school instinctively turned to mobile applications to address their mobility issue. On the contrary, City-A citizens gave a lot of thought to the layout of the future cultural center building. Not all of their ideas could therefore be retained for the hackathon, even though they were still obviously transferred to the city to pursue the project.
The challenges formulated by the citizens through the workshops W3 were added to the hackathon idea pool, which was also fed by other initiatives. The 19 hackathon teams were free to work on one of our challenges, on one of the other topics of the idea pool or even on their own project. Out of the ten challenges submitted by the participants, five attracted the attention of a team of hackers and resulted in a prototype (Table 3). Unfortunately, none of the City-A projects were selected by a team.
From the very first hours of the hackathon, we contacted the participants of our workshops to inform them of the selected challenges and invited them to join the hackathon and meet the hackers working on their ideas. Given the geographical proximity between the hackathon venue (University of City D) and their school, three participants from City D took this opportunity and interacted directly with the hackers to answer any questions they might have, discuss any problems they encountered and give their opinions on possible developments. At the end of the hackathon, the citizens’ ideas were transformed into prototyped solutions and presented by the hackers in front of a jury of experts. Some of them received awards (Table 3).
Given the multiple dropouts, accelerated by the COVID-19 health crisis, only the Solution-B1 team is pursuing its development for now. One of the limits of the hackathon is thus the ephemeral nature of the solutions proposed to the detriment of more sustainable projects. According to the hackathon organizer, the difficulty of establishing a viable business model is often the main obstacle to the continuity of projects. Due to the lack of prototypes, workshop W4 for the evaluation of solutions was canceled for the Cities A, C and D. In City B, the workshop was held remotely via a videoconference platform.

5. Methodology

5.1. Data Collection

In this research project, we decided to let the participants themselves assess the participatory initiative through time in order to hopefully reach clues for participation enhancement in the long run. We also decided to not involve our own point of view (as researchers/facilitators) into the evaluation, as previous research has demonstrated that researchers/facilitators tend to lack the necessary hindsight and assign higher ratings than participants [32]. We, as researchers, moreover designed the assessment tools and approach, with no direct involvement of the participants; the possible bias introduced in that regard will be discussed in Section 8 below.
To conduct such an evaluation, we opted for two methods to collect the participants’ feedback. Firstly, a logbook was completed by each participant at the end of each workshop in order to capture participants’ on-the-spot reactions about their participatory experience. The final logbook is a compilation of participants’ answers to self-administered, longitudinal questionnaires each being a 3 to 4-page long, paper format. The participants were not always the same, but some took part in several workshops and answered the questionnaire several times. For this reason, participants entered their names so that we could link their various logbook entries before anonymizing the data. We refer to it as a “logbook” rather than a “satisfaction questionnaire”, since our aim is to not only collect participants’ feedback but above all to keep track of the whole process and to compare their feedback during the consecutive participatory stages. The various questions asked to evaluate participants’ experiences are detailed in Table 4. Some questions were short, open-ended in nature, offering a two to three line-space to answer; others were closed (simple boxes to be checked). The intention was not to favor quantitative over qualitative data but rather to design the logbook so that it would be quick and easy for the participants to fill-in at the end of each workshop, while still bringing valuable information to the researchers.
Secondly, we collected the participants’ cold-minded thinking about their experience at the end of the participatory process. We therefore organized four focus groups in order to explore the reasons why the participants’ experiences were positive or negative with regard to the different concepts addressed in the logbook. The participants’ feelings are very subjective, and we could not pretend to capture them through the answers they provided to the logbook’s questions. In that regard, retrospective focus groups are an excellent way of adding depth to the data obtained, as participants were stimulated by the presence of others and could discuss their respective opinions. As identified by Klüber and colleagues, a long time-lag can help identify consistent long-term changes after participation, although possibly suffering bias or difficulties in retrieving the memory of the events [28]. The data obtained through the focus groups were generally very rich, as the participants interacted with each other and developed ideas that they might not have thought of during an individual interview. Moreover, as the organized participatory experience was itself collective, it seemed appropriate to maintain this group dynamic even during its evaluation.
Both data collection methods are thus complementary [28]. On the one hand, the logbook takes the pulse at each stage of the process and provides an overview of the participants’ experiences before they forget them and leave the workshop. In addition, the use of such a short questionnaire before a focus group meeting is an effective way of obtaining the opinions of participants before being influenced by group dynamics or other biases, such as social desirability. On the other hand, focus groups are particularly relevant for collecting information about an intrinsically collective phenomenon such as this participatory initiative. Focus groups are therefore ideal for assessing the lived experience of a group of participants who “are known to have been involved in a particular concrete situation” [41] (p. 541).
Given the COVID-19 health crisis, these focus groups, originally planned for April 2020, were postponed to September 2020. In addition, these focus groups were held remotely via a video-conference platform. The exchanges were therefore less fluid, and the sessions were shortened because of the time needed to connect and the mental fatigue generated by these virtual meetings. Aware of these issues, we decided to limit the duration of each focus group to one hour and to restrict our interview grid to seven main questions listed in Table 5.
The four focus groups gathered a total of 12 participants. This low participation rate can be explained by four simultaneous phenomena:
  • The small size of the initial sample, particularly in Cities C and D where the total number of persons involved (n) was, respectively, 17 and 23 (compared to 62 and 78 in Cities A and B);
  • The last-minute withdrawals of seven people out of the 19 who initially confirmed their participation in the focus groups;
  • The relatively high average age of the participants in Cities A and B, some of whom (n = 5) told us that they wanted to take part in the discussion but were unable to master the necessary digital tools;
  • The postponement of the focus groups from April to September, who were organized too late after the previous stages and thus attracted lower interest.
Such a small sample has its advantages, though, as it lends itself better to a virtual meeting: smaller groups are easier to moderate and allow for a better distribution of speaking time. However, we expected less dynamic exchanges and more hesitations to take their turn and speak up. To mitigate these risks and to give participants confidence, we included a playful aspect in our questions. If we refer to Table 3, we observe that four out of seven questions can give rise to the binary choice “yes/no”. This type of question is not really advisable in conducting focus groups, as it does not encourage participants to expand on their answers. We are fully aware of this issue, but our objective here was rather to animate the exchanges. We therefore suggested that the citizens give an immediate answer to each question, all at the same time using gestures in front of the camera: thumbs up for ‘yes’, thumbs down for ‘no’, or hands out for ‘more or less’. This way, participants first answered the question instinctively, without being influenced by others. We could identify the answers that stood out (e.g., only one “no” among the participants) and then ask the participants to justify their choices and let the others react to what their colleagues said. In this way, we could observe the divergences and convergences of opinions within each group but also detect possible changes of position during the debate.

5.2. Data Analysis

The data collected are of two types: quantitative and qualitative data from the logbook (given the answers to open-ended questions) on the one hand, and qualitative data collected during the retrospective focus groups on the other.
Given the relatively small number of participants, the quantitative results extracted from the logbook are statistically poor but have two major interests. Firstly, the data obtained allows us to define a preliminary profile for each participant (in terms of their familiarity with participatory processes, their frequency of participation in our initiative and their overall satisfaction with their participation). This way, we could ensure that the profiles invited to take part to the focus groups were diverse and complementary. Secondly, the logbook served as a memo to obtain a rough assessment of the experience curve of the participants. For example, we knew if one workshop was more appreciated than another, generally speaking; if the satisfaction of the participants decreased or increased over the course of the process, or which profiles of people were present (citizens, but also elected officials or professionals for instance).
These quantitative data, and qualitative data for the open-ended questions, were then simply transcribed into an Excel file and systematically coded so that the data could be easily compared between the different workshops and between the four cities. After each workshop, the questionnaires were analyzed and reflected on; problems encountered or specific requests expressed by the respondents were considered before continuing the process. The answers to the open questions were thus directly taken into account to build the next workshop, so as to improve the process in vivo. For example, the students of City-D school complained about the lack of technical explanations in workshop W2, so we invited experts to help them in workshop W3. That being said, we have to acknowledge the fact that few respondents took the time to provide an answer to these open-ended questions, certainly lacking the time and/or the energy at the end of a 2 and a half hour workshop. When they did though, they answered in a rather complete way (two to three lines each).
As mentioned earlier, these data needed to be further elaborated during the focus groups. Those discussions were transcribed live by another researcher in the team and recorded in case some key verbatims were missed. The transcribed qualitative data were then analyzed manually. We started by reading the content of the four meetings several times before identifying recurring themes, possible contradictions, and salient arguments.

6. Results

6.1. Preliminary Results from the Logbook

The logbook provided useful information to profile the participants. Table 6 presents the number of participants who took part in each event (N) and their average level of satisfaction (S), which was calculated from a satisfaction score ranging from “very low” (S = 1) to “very high” (S = 5).
These figures reveal the high level of satisfaction of the participants who generally appreciated the process they took part in. Indeed, the “very low” rating was never chosen, and the “low” rating was chosen only four times (out of 177 responses collected for this question), by two people from City A and two from City C.
Cities B and D were characterized by an almost constant level of satisfaction throughout the process. Conversely, there was a drop in satisfaction between workshops W1 and W2 in City A and between workshops W2 and W3 in City C. As previously mentioned, the logbook does not allow us to justify these variations with certainty, but the results provided by the focus groups will help us understand them better.
In addition to their possible multiple participation, we were also interested in the participatory background of the participants involved. In other words, we wanted to know whether our participants had already taken part in another participatory process or whether they were used to such processes. Table 7 thus distinguishes between “novices”, who had never taken part to any participatory process before our initiative, “insiders” and “usual suspects” [42] who had participated once or several times in the past.
In general, the participatory process has a majority of novices, a smaller proportion of insiders and a minority of usual suspects. Only the City-C initiative is characterized by a large proportion of people who were used to participatory processes. Given the small number of participants in City C, it seems quite logical to find among them people who are regularly involved in community life. For example, there is one citizen who was already a member of the Municipal Participation Council and five people who were regularly involved in various participatory actions, such as a five-month participatory process aimed at co-constructing the Transversal Strategic Plan of City C.
In City D, the number of participants is also low, but there were very few usual suspects. In fact, we have a very young audience here, since 70% of the participants were high-school students. It is therefore quite normal that they have little participatory experience. Nevertheless, several of them have already had the opportunity to participate in another initiative in the past, and several took part in a simulation of the UN Climate Change Conference COP25 with their class the previous year. Two students were even regularly involved in neighborhood meetings.
City A had the most novices, but many participants had already taken part in one previous initiative. Six of them had posted ideas or voted for their favorite projects on a participatory online platform. Others had participated in various projects for the development of public spaces. The few usual suspects were involved in consultative commissions or had participated in several projects.
In City B, there were almost as many usual suspects as insiders among the participants. The most frequently mentioned activities were two previous participatory initiatives linked to the house for associations and which had served as a springboard for our own initiative, bringing together again at least 13 people who had already given some time and thought to the subject. Two participants were moreover part of a collective called “(City-B) Identity”, and two others were involved in the City’s consultative commissions. It should also be noted that in Cities A, B and C, some of the participants were elected officials or municipal employees who were politically involved in their cities.
Looking at the participants’ participatory backgrounds and their respective representation throughout the workshops (participatory trajectory), we defined an “ideal combination” of profiles to constitute our focus groups and invited some participants accordingly. Table 8 below shows which types of participants eventually took part in our focus groups.
Table 8 above illustrates a certain diversity among the people who took part in our focus groups. The level of satisfaction of the participants recruited corresponds to the average obtained for each process, but we would have liked to hear the opinion of those less convinced by the initiative. Similarly, the proportion of usual suspects here is 50%. It is not surprising to find these usual suspects at this stage, as this type of profile is the more prone to agree to this additional investment. However, there were few novices present to testify to their first participatory experience. In terms of sociodemographic characteristics, the participants that took part in the evaluation process were part of both the youngest and the oldest profiles’ groups.

6.2. In-Depth Results from the Focus Groups

Through focus groups, we were able to clarify some of the findings from the logbook. We asked the participants about their expectations, the benefits and the problems encountered during the participatory process. In the following subsections, we do not detail each case separately but rather present the results obtained in a transversal way by grouping them thematically. Following the literature review, we can divide participants’ feedback into three main categories focusing on their participatory experience in terms of process (methods and recruitment process of the participants), outcomes (motivation and satisfaction) and outputs/results (in this case, hackathon prototypes).

6.2.1. Participants’ Evaluation of the Process

Before participating in this initiative, citizens all had their own idea of what citizen participation could mean and what form it could take in terms of methods, interactions, and objectives. Some of the usual suspects based their expectations on their previous participatory experiences, while first-time participants did not necessarily know what to expect:
“We went in blind, not really knowing if we would like it.”
(D1)
Through the focus groups, however, we found that several participants had a common image of participation, namely the classic information meeting where citizens play a relatively passive role:
“I expected to be in front of a group of politicians who asked us ‘here, what do you think?’ about a project that is already much more concrete.”
(A1)
At the outset, the participants had a very narrow view of the participatory spectrum and were deeply imbued with the traditional, top–down, informative participatory model, which is characteristic of the lower rungs of Arnstein’s ladder [43]. Before participating in our workshops, citizens therefore did not seem to be aware that there were other participatory alternatives such as co-design activities. Therefore, the flexible and playful character of the workshops surprised both novices and usual suspects. While the initiative was attractive, it also confused the participants:
“This process was sometimes surprising (…) At the beginning, I was a bit skeptical… All these games… In the end, it came together, we got out of it!”
(B2)
The citizens were indeed more used to other forms of participation, and some of the steps must have seemed “less serious” to them. However, playful activities tend to create a climate of trust and develop the intrinsic motivation and creativity of participants. Given the positive feedback from the participants, we perceive a greater enthusiasm for taking part in this type of less rigid participatory arrangements, even if they may be disconcerting at first. In particular, they appreciated the way in which the participatory initiative allowed everyone to express themselves. The face-to-face modality and the multi-stage structure of the co-design process encouraged exchanges between participants without restricting their creativity.
If the participants were surprised by the process we set up, it is also because it was non-institutionalized and closer to a bottom–up dynamic. The fundamental difference with the mechanisms they were used to was our presence as the third party playing the role of facilitators and mediators between the elected representatives and the citizens:
“What I felt was this desire to bypass mediation by the elected official, to go directly to the citizen.”
(B3)
Although a long process, our initiative, however, was still relatively ephemeral. Indeed, our action had a definite end, as did our role as facilitator. The organizing agency and participants should ideally coordinate to continue the project without our help. In practice, this handover requires the development of a certain amount of participatory expertise on the one hand and the political will to support the project on the other. The participants were well aware of these limitations:
“In the end, given that there is no constraint for the decision-makers or for the people who hold the budget, the probability that the thing will remain a dead letter is quite high.”
(B3)
Such a non-institutionalized process is therefore perfectly legitimate in the eyes of the city and the citizens, but it runs the risk of not lasting over time if no one commits to continuing the project (due to lack of budget, time, conviction, coordination, etc.). It therefore seems necessary to consider professionalizing cities to manage the organization and, above all, the follow-up of their citizen participation projects internally.
Another issue raised by the respondents in relation to the process is the recruitment of participants. As previously announced, the participation rate is much lower in Cities C and D than in the other two cities. The citizens present at the focus groups expressed their disappointment about the small number of participants involved in the workshops:
“Between the number of parents who said ‘we’ll come’ and the number who actually came, (…) it was a quarter.”
(D2)
“We all have hectic lives, it’s not easy to free up time”.
(C1)
C1 and D2 were themselves in charge of recruiting participants and encountered the difficulty of mobilizing people, particularly because they have other priorities than participating in this kind of activity. In both Cities C and D, the communication of the event was relatively extensive, but it was not enough to interest people to really engage them in the process. We therefore changed the recruitment pool from citizens to municipal agents in City C and from parents to students in City D.
On the contrary, City B had more experience in terms of citizen participation than other cities, and this maturity was reflected in easier recruitment. In particular regarding the house for associations, other previous events had already created a community of people ready to invest time in our participatory initiative.
It is also interesting to note that the City-A process was well attended, but that citizens were expecting more involvement:
“That’s maybe the regret, there weren’t a lot of people”.
(A1)
This brings us back to the recurring question of representativeness. The participants were well aware that they did not reflect the full diversity of their city and did regret not seeing more people involved. In the end, a larger number of people ensures more diversity and certainly a result that is more representative of the real needs of the population. However, it remains quite illusory to hope to reach all citizens. From our point of view, further efforts should be made to improve mobilization within cities, but a small number of citizens does not mean failure. The ideas proposed and solutions developed in the different cities were not meant to be universal and suitable for everyone but rather to respond to the problems, however small and specific, of the participants who were present and willing to invest in them.

6.2.2. Participants’ Evaluation of the Outcomes

The various participatory processes differ regarding the level of motivation of the participants. Figure 3 shows that citizens are on average highly motivated and satisfied.
If we compare the four cities, participants from City C are both the least motivated and the least satisfied, whereas participants from City D are the most motivated and the most satisfied. One explanation for these differences is the nature of the motivation that drives the participants during the process. In workshop W3 in City C, some municipal employees attended out of professional obligation and, although they were interested in the subject, they participated out of duty and not out of desire. In City D, some participants were also forced to attend by their fellow students, but this extrinsic motivation soon gave way to intrinsic motivation. The big difference between the two cases is that the students from City D became caught up in the game and eventually enjoyed participating.
The experience thus seems to support the theory that the more intrinsically motivated citizens are, the more satisfactory the participatory process might be. As a reminder, Amabile argues that extrinsic motivation can interfere with the co-design process, as the participants present are no longer involved out of pleasure or interest but for an external reason that does not encourage them to become deeply involved [44]. For example, participants from City D developed intrinsic motivation during the workshop to the extent that they wanted to participate in the next workshop and even to visit the hackathon, whereas the people from City C left their role as participants as soon as the workshop ended and they left the room.
In our view, the lack of intrinsic motivation of the City-C participants also stems in part from the choices we made in anticipation of the hackathon. In both cities, we made the participants think about mobile application interfaces, but this decision was perceived differently in Cities C and D:
“Well, in relation to the application, I wouldn’t have done it so…”
(C3)
“I think it was just better that you were the one who took the decisions. (…) It gave us good guidance so that we didn’t do things that were unfeasible.”
(D1)
It is clear that the City-C participants would have liked to define their own objectives, which did not correspond to those we set on the basis of the previous workshop with the citizens. Conversely, the choices previously made in City D matched the expectations of the students who were enthusiastic about working on the development of an application. Where the people from City C lost confidence in our animation team and thus lost all desire to work on the project, the City-D students gained in motivation by seeing that they could decide on the continuation of the project:
“The main ideas came from us. (…) The two computer experts who passed around the tables were there to answer our questions but not to impose their ideas.”
(D1)
We can see from the experiences in Cities C and D that the motivation to participate can be greatly affected by the feeling of being (or not being) listened to. The big problem in City C was in fact the change in the recruitment pool between the two workshops and in particular the incompatibility between the ideas put forward by the first ‘lay’ group (citizens) and the second ‘expert’ group (municipal agents).
The fact that the participants sometimes come from different backgrounds can indeed lead to difficulties, particularly in terms of facilitation and protocol definition. Generally speaking, we assumed that the participants were not necessarily experts in the topic being discussed but rather in their lifestyles and in the local context. Our protocol therefore aimed to go into the details step by step, and this gradual approach seemed to be reassuring for the participants in Cities A, B and D:
“At the first session, I was a bit scared… I thought: ‘What are they going to ask me? Will I be up to it?’ But no, it went very well.”
(B2)
In City C, on the other hand, we made the mistake of applying the same protocol with two very different groups: the first a bit more layman and the second a bit more specialist, for whom “these are things that are known, that seem obvious” (C1). It is therefore essential to always adapt the protocol in order to avoid incomprehension, or even frustration, on the part of certain expert participants who would not feel valued or listened to.

6.2.3. Participants’ Evaluation of the Outputs

For this participatory process, one of our choices was to pass on the participants’ ideas to the hackathon teams so that they could transform those ideas into concrete prototypes. In general, citizens were clearly looking forward to real prototypes and were excited to have benefited from the hackers’ work:
“I’m glad that there were concrete, realized projects, that we weren’t always talking about ‘blah blah blah’. There was a result at the end thanks to the hackathon team.”
(B4)
The participants from Cities B and D were therefore satisfied with the results of the hackathon, as their ideas were crystallized into applications and web platforms that corresponded to their expectations (Figure 4). The people of City D were also impressed by the ease with which the hackers had transcribed their ideas into something concrete:
“It’s a very nice result for two–three days [of hackathon]. It wasn’t their idea in the first place, they had to make our idea their own.”.
(D1)
Obviously, the participants from City A could not express themselves on this subject since their ideas were not selected by the hackers. The hackathon was therefore a disappointing step in the process for them, as they did put in a lot of effort which unfortunately was not rewarded:
“It’s a shame because in a way we all want to get involved, at first we think ‘oh nice’ and then in the end ‘oh no, as usual in (City A), there is nothing’”
(A1)
Nevertheless, it is not the principle of the hackathon itself that displeased the people of City A but the principle of competition between all the projects and the fact that some ideas may be abandoned. In today’s competitive context between cities, City-A participants therefore felt abandoned along the way. Nevertheless, the participants remain very pragmatic and recognize that they were warned from the start:
“From the university’s side, it was clear that there was no guarantee that the ideas would find concretization, as it was a wider project.”
(A2)
One solution to ensure that the proposed ideas are selected by a team would be for delegated participants to take part in the hackathon and to form a team with hackers to work on the project they are championing. However, it is not easy to convince participants to dedicate a whole weekend to the hackathon when they have already participated in several workshops before. The difficulty to reach such an investment is confirmed by the fact that only three participants from City D shortly visited the hackers.
However, those participants from City D would have liked to become even more involved, as they regret not having interacted more actively with the hackers:
“They were really in their own world, it’s not like we were working together with them. These were our ideas, we could have accompanied them at least for some time.”
(D1)
Although the hackathon produced some concrete solutions, the focus group participants sometimes hoped for more and therefore repeatedly expressed frustration with the outcomes of the various participatory processes. In order to better understand their feelings, we look back at the participatory context of each city and recall the level of concretization achieved in each of them. Figure 5 illustrates two variables: on the one hand, the level of confidence of the participants in the realization of the project, as reported in the logbook, and on the other hand, the actual level of realization observed in each context.
We note that confidence in the project’s implementation was higher in the cities where the results were eventually the most concrete. Indeed, City A is characterized by the lowest level of confidence, and no project was selected during the hackathon. Conversely, the people of City B were the most confident about their ideas being realized, and one of them is indeed the only project still active today. We therefore suggest that the participants themselves are able to predict whether their ideas have a chance of succeeding or not. The participants indeed showed a certain foresight with regard to their ideas:
“The problem was that the ideas were a bit theoretical, and in my opinion, they did not lead to practical implementation.”
(A2)
Furthermore, we note that confidence in the success of the project was one of the lowest scoring evaluation criteria of the participatory experience (along with decision-making power). We were therefore particularly attentive to the reasons behind this relatively low conviction, which was unfortunately confirmed in practice. According to the focus group participants, one of the main constraints to the realization of any project is the available budget:
“Architects have a budget… We also dreamed of beautiful things and, if it were up to us, we would have a new building. But we realize that we have to see what is available.”
(B2)
It is interesting to note that the participants from Cities A, B, C and D had a very similar discourse even though the resources at stake were not at all the same. Indeed, there are important nuances between the different cases:
  • In City B, a building is eventually going to be transformed to accommodate the house for associations; funds have already been released to hire a part-time “house manager” and the city is in contact with the Solution-B1 winning team to find funding;
  • In City A, the cultural center project will probably take place, a design office has already proposed some sketches of the ground plans, but the results of the participatory approach will perhaps not be integrated, especially as no project was pushed forward during the hackathon;
  • In Cities C and D, the projects will not take place because the hackathon team members were all students who abandoned their project due to the COVID-19, lack of time and funding.
It therefore appears that participants may develop a sense of frustration even if the project succeeds. Indeed, while people from City B would prefer a new building, people from City A would prefer to have more impact on the new building that will eventually be built. The people of City D regret above all their lack of control over the situation and the total absence of concrete results at the moment. This phenomenon illustrates that we must not only evaluate the outputs of participation but the broad context in which those outputs unfold.

7. Discussion

The rich results stemming from the evaluation process show that citizens have a relevant say in how their participation takes place. We note that the retrospective focus groups mainly attracted young adults and seniors, which could demonstrate their willingness to be part of a long-term process. On the one hand, young people are not yet weary of participatory initiatives and might feel they have a great responsibility in neighborhood projects that will influence their future. On the other hand, seniors can be more available and may want to take on the role of guardians of the neighborhood where they have lived for many years. The empowerment of participants in the evaluation thus seems to be based on their motivation to shape and preserve their direct environment.
Except for “local” adaptations, the overall participation protocol has been quite stable from workshop W1 to workshop W3 through the four cities. In addition, the results discussed above demonstrate quite similar levels of satisfaction, motivation, and confidence in successful implementation throughout the participating cities, except for City C, where those levels were lower. When looking at City B’s results, we indeed observe that the overall feedback is not excessively more positive (Figure 3), even though the output of this specific process can be considered as the “most successful” in all aspects. The overall quality of the participation process thus does not seem to be uniquely linked to the ultimate success of the design output, at least from the participants’ points of view. How could this be explained?
To answer this, we have to recall that these initiatives are distinguished by the context in which they are implemented. Indeed, each city is characterized by local specificities, including a history of citizen participation. Some cities have therefore experimented with a greater number and/or a greater variety of participatory mechanisms than others; likewise, some participants have been in contact with a greater number and variety of participatory opportunities. Evaluation criteria considered “on the spot”, independently of the context and of the city history; therefore, they do not fully explain the overall quality attributed to participation, at least in our cases. We argue that even when participants do evaluate “on the spot”, they integrate long-term experiences and expectations into their assessment.
Without going into many details regarding the history of each participating city, we observe differences in their level of participatory maturity. Among the Walloon cities, City A is probably the least mature because; apart from a recent e-participation platform, participatory initiatives are quite rare there. On the contrary, City B had already organized several initiatives, including a few to prepare the “house for associations” project, similarly to City D who hosted twice a large-scale e-participation initiative as well as several co-design workshops. In addition to the number of organized events, their variety may also reinforce the participatory maturity of the city, which can test different methods and tools; in that regard, City B had also experienced various approaches before, including participatory budgets and consultative commissions.
Through the focus groups, we moreover studied the participants’ initial expectations and their overall, final levels of satisfaction. We realized that these expectations and satisfaction levels not only depended on the participatory maturity of the city but also on the participatory backgrounds of the participants themselves. For similar workshops, the usual suspects and experts were naturally less enthusiastic and more demanding than the novices. In the case of City D, for example, having tested different participatory methods was not the sole key to success, since the quite young participants of City D who took part in our process were not necessarily aware of them. The level of maturity of the city therefore goes hand-in-hand with the participatory background of its citizens, and it is generally close to the level of maturity of the usual suspects who regularly participate in all kinds of processes.
This threefold, intertwined influence—level of satisfaction; level of expectation; level of maturity—is illustrated in Figure 6 and is suggested as a contextual, analytical tool to review participation in a longitudinal way.
On the basis of the participants’ feedback, we represent the level of participatory maturity of a city by an X-axis that progressively unfolds in four stages, so as to schematize its possible evolution and its impact on the levels of satisfaction and expectation:
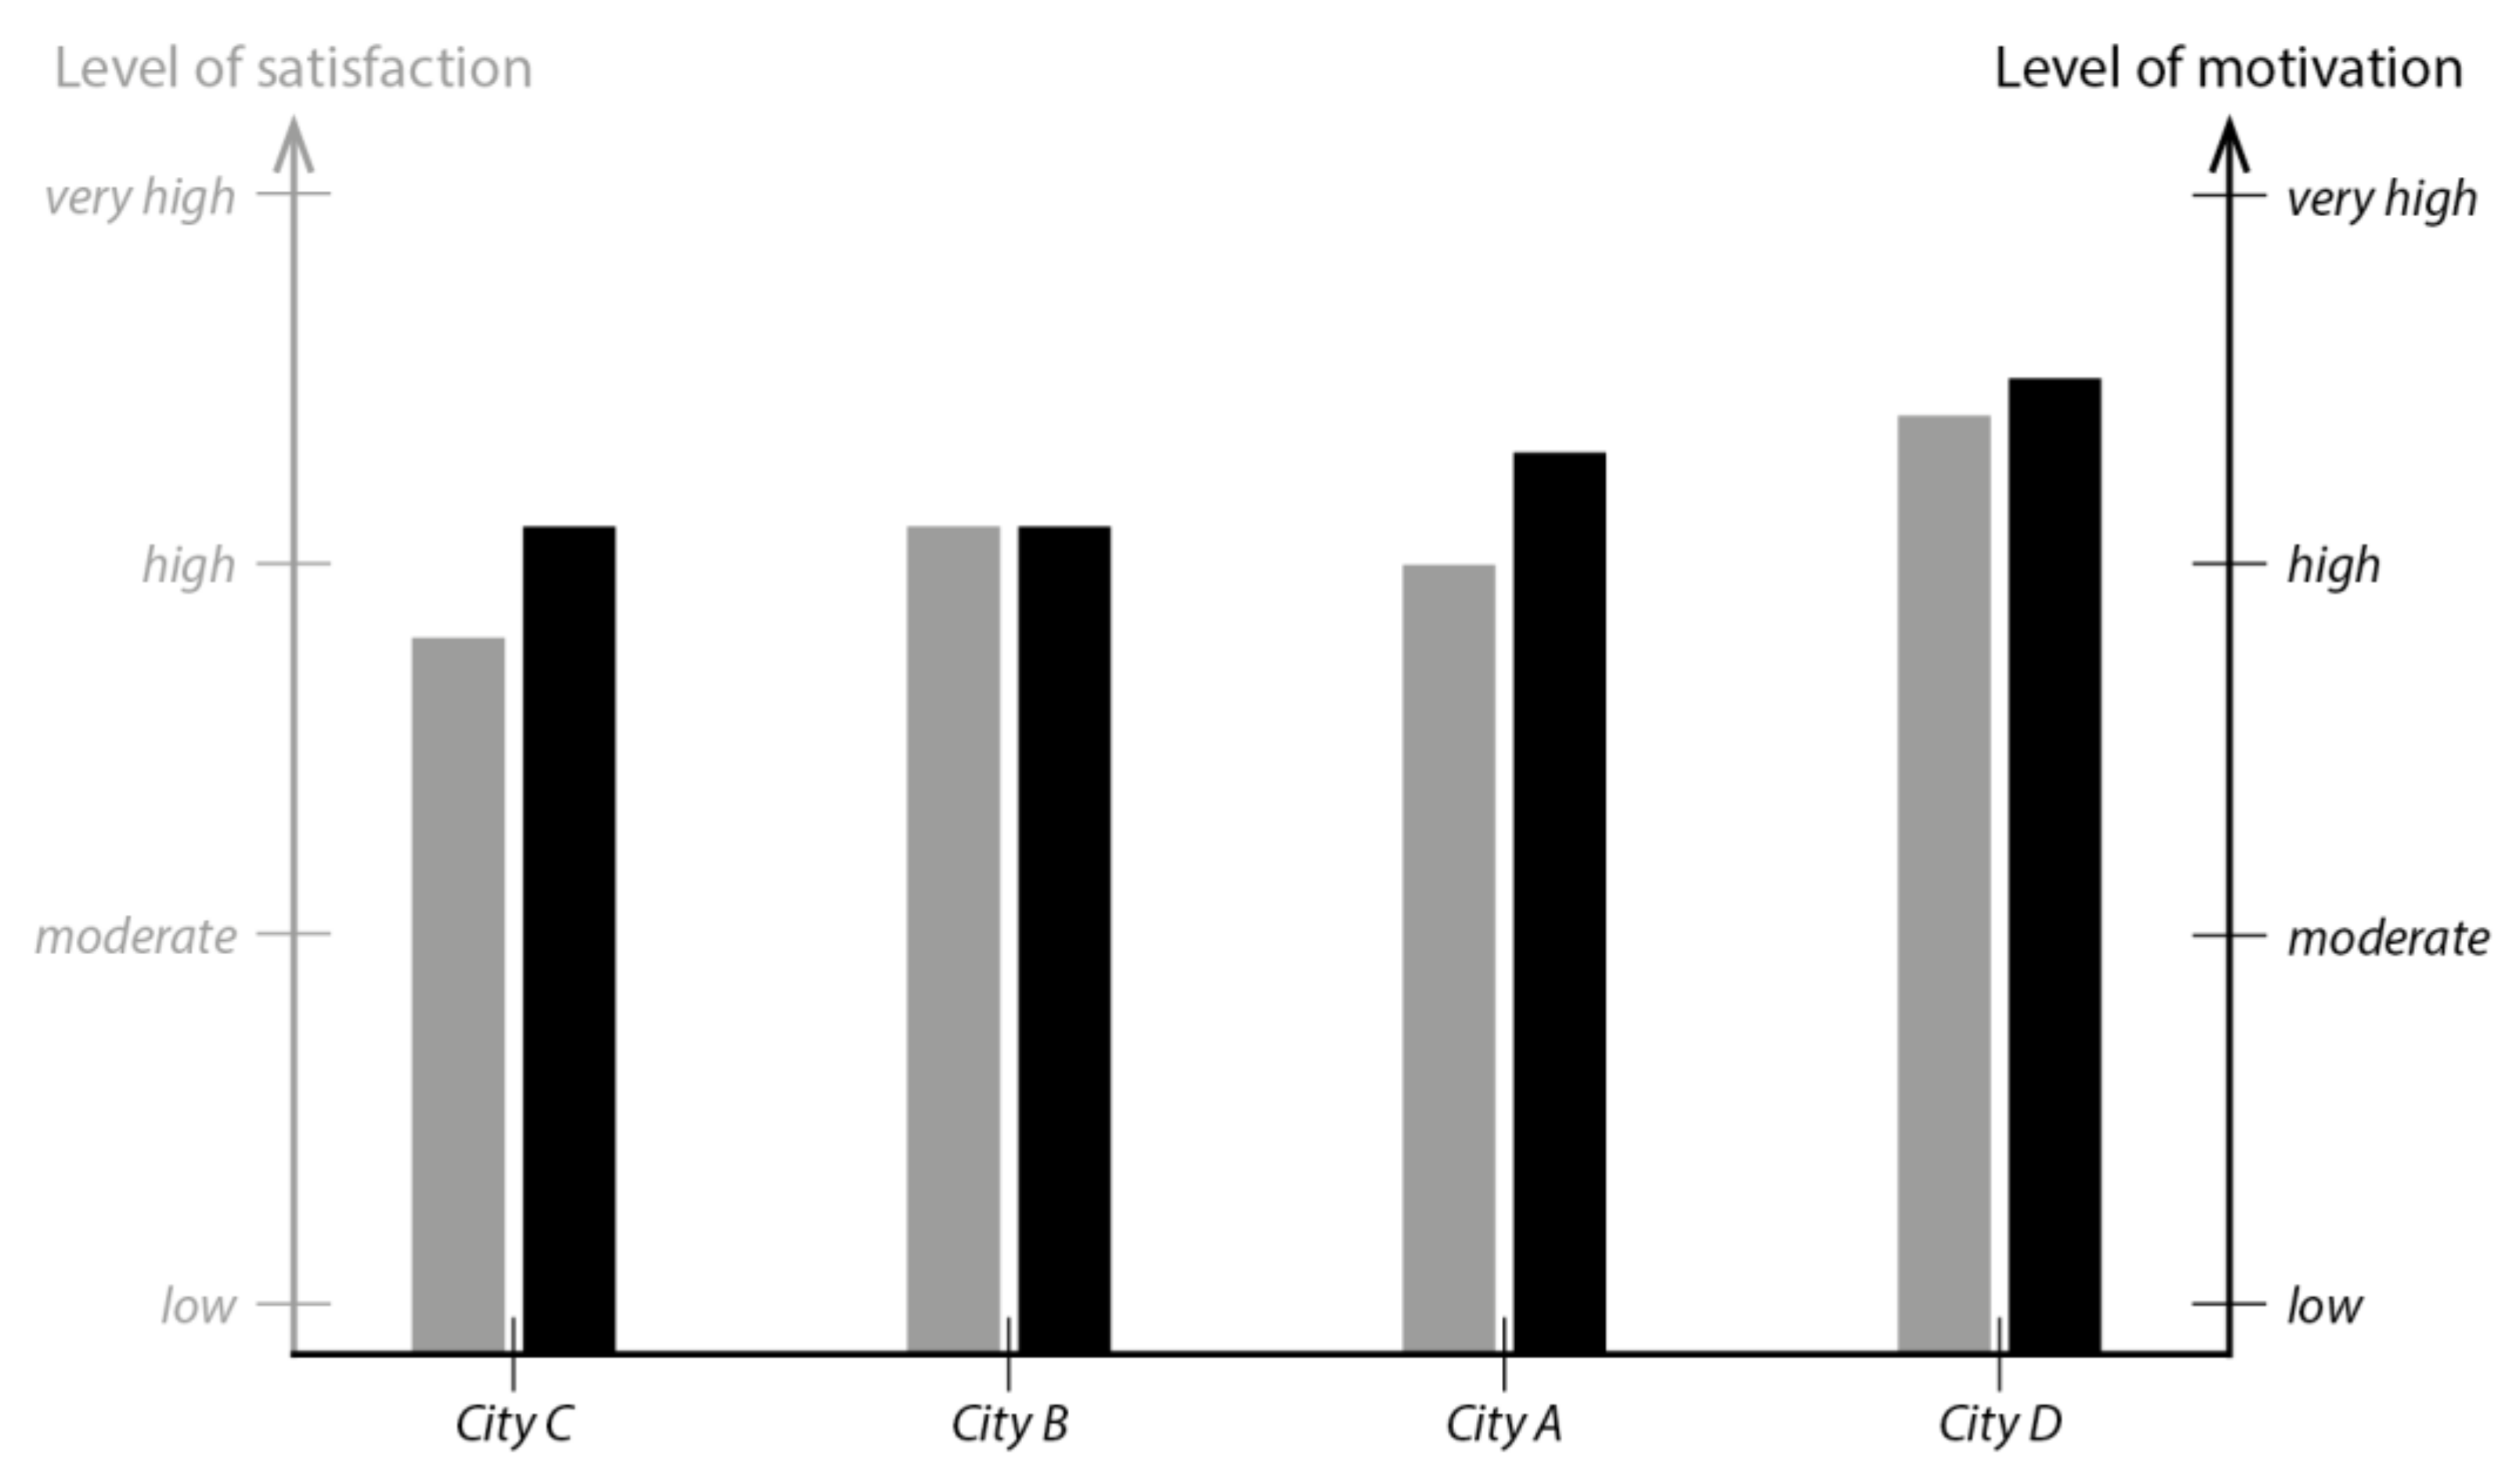
  • When the first participatory initiative is organized in a city, the level of satisfaction is high and the level of expectation is low, because the novice participants are enthusiastic about discovering something new and do not know what to expect;
  • As similar initiatives are repeated, participants refine their expectations, sharpen their demands and are no longer as satisfied with some of the elements they enjoyed in the first initiative. The level of satisfaction of those “insiders” decreases as their expectations increase;
  • If recurrent initiatives differ in terms of tools and methods, participants experiment with a new way of participating, whose originality or novelty for their city may generate a peak of satisfaction and a stabilization in terms of expectations;
  • If these initiatives in turn become recurrent, the participants become more intransigent again and increasingly picky about the quality of the participatory process.
Furthermore, one of the reasons why satisfaction is often higher for a first experience is related to the perceived benefits for the city and the participants. Indeed, the simple fact of participating, whatever the form of the process, already brings its share of benefits such as the creation of a sense of community, the increase in social cohesion, the feeling that one is contributing to something bigger than oneself, the satisfaction of the work accomplished, and the opportunity to express oneself and to hear the opinion of others. Citizen participation therefore has an intrinsic value that leads to a positive perception of those involved; the organizing agencies should be aware of this “beginner” intrinsic value in order to make the most of it as soon as possible and as to facilitate the emergence of “usual suspects” profiles, whose participatory background will grow in expectations and satisfaction side-by-side with the organization’s participatory maturity.
In view of this interrelation between levels of maturity, satisfaction, and expectation, we think it is crucial for participation professionals to find out about the participatory record of the organizing agency inviting them to organize a new initiative. We recommend not designing a process that is too similar to the previous one, as this could create a feeling of déjà vu among the participants. Especially if previous processes have not yet produced concrete results or if citizens have already identified some areas for improvement, inviting them to take part in a similar initiative will probably disappoint them. One of the roles of the designer is to make the most of the participation of citizens, both in terms of content, by means of a concrete achievement, and in terms of form, by integrating their feedback. The designer of a participatory process must therefore first understand the participatory context in which he or she is implementing in order to manage the expectations of potential participants and maximize the chances of success of the initiative. Being studied in the long run instead of being studied distinctively after each peculiar participatory event, the criteria usually called for to assess participation will therefore reveal much richer insights and help the designers of participatory events anticipate participants’ perception on value-rich participatory concepts.

8. Conclusions

To conclude this paper, we will shortly summarize some theoretical and practical recommendations useful when implementing and assessing a participatory initiative.
Practically speaking, the organization of a face-to-face, co-design process has many advantages, but it also has limitations to which attention must be paid. The advantages of this kind of process are the time allocated to reflection and ideation, the playful and concrete character of the activities, or the freedom of expression. However, these advantages can be undermined by difficulties in recruiting participants, a lack of long-term follow-up or a failure to put the initiative into practice. All these elements create frustrations and disappointments that can be avoided in part by taking certain precautions. Therefore, we advise organizers of similar initiatives to:
  • Announce the objectives of each workshop at the time of recruitment, on top of communicating the overall objective, so that each activity matches the expectations of participants;
  • Not to rush into too many activities and to devote the necessary time to the process, without going into too many details, to achieve the objectives naturally;
  • Share the results obtained at each stage of the process in order to avoid loss of confidence among the participants and their weariness with processes that do not lead to anything;
  • Adapt the protocol to the level of expertise of the participants and manage the heterogeneity of the group to minimize disappointments and misunderstandings.
Specifically, the details provided about our participatory processes illustrate the absolute need for flexibility when building some participatory protocol. Each of our organized processes indeed had a similar basis but adapted to the specificities of each city. The articulation of participatory workshops with a hackathon is also original; it provides concretization for (some) of the citizens’ ideas and it values different forms of participation and expertise. The intrinsic quality of the citizens’ proposals can also be assessed through the number of projects selected by the hackers and rewarded by the hackathon jury.
Theoretically speaking, the study of the participants’ experiential feedback makes it possible to collect empirical data that are rarely considered. Most evaluations of participatory processes are indeed limited to a satisfaction questionnaire or neglect this last step and thus neglect to collect insights to feed future participatory initiatives. As suggested by Klüber and colleagues, we developed on-the-go and in-between methods to collect feedback [28], but we did not apply evaluation criteria to punctual events considered independently: we rather built longitudinal trajectories (from both the organizing agencies’ and participants’ perspectives) to nurture the assessment of participation and to eventually lead to recommendations to enhance participation.
In addition, our logbook not only allowed us to keep track of the participatory experience but also to define variables to profile the participants: their participatory background (novice, insider, or usual suspect), their participatory path (number and distribution of participations) and the level of overall satisfaction. These variables determine a unique participatory trajectory for each participant and provide a better understanding of their expectations and (dis)satisfactions. The retrospective focus groups deepened the logbook’s results and highlighted another variable to be taken into account that is likely to influence the participants’ levels of expectations and satisfaction: that is, their level of expertise with regard to the subject in question. We argue these participant-related variables should be considered hand in hand with agency-related variables—mainly the contextual participatory maturity—as to provide real meaning to criteria applied to participation evaluation.
If the research points out possibilities for improvement when it comes to the assessment of participatory initiatives and when it comes to the organization of participation per se, the study of four cases in the Walloon Region cannot lead to generalities nor imply representativeness of all participatory projects. In particular, pragmatic and time-related issues constrained the number of evaluation criteria we could test, either as logbook entries or during our focus groups; our generic protocol was disrupted by unexpected events (the COVID-19 crisis; the workshop W1 skipped by City C who imposed the participatory topic; the unchosen project sheets during the hackathon…) as well as our data collection (the impossibility to organize face-to-face focus groups; the absent participants’ profiles during those focus groups…). Additionally, in the time-frame of this research project, we could not involve participants in the design of the evaluation tools nor could we afford to collect feedback about those tools and their implementation. Biases were certainly introduced by the choices we made as researchers/facilitators, which should have been further studied. Further research is thus needed to involve participants beyond what was achieved here, through the assessment design as well, and to analyze the sensitivity of various criteria over time and their added value to assess participatory initiatives on the long haul. Additionally, the design nor representations’ dimensions of the projects envisioned by the participants during our workshops (and later developed by the hackers) could not be thoroughly studied here given the scope of this specific paper: the impacts these dimensions might have on participation and on participation assessment certainly constitutes an interesting path for further research as well.

Author Contributions

Conceptualization, C.S. and C.E.; methodology, C.S. and C.E.; formal analysis, C.S.; investigation, C.S. and C.E.; writing—original draft preparation, C.S.; writing—review and editing, C.S. and C.E.; visualization, C.S.; project administration, C.E.; funding acquisition, C.E. All authors have read and agreed to the published version of the manuscript.

Funding

This research was funded by the ERDF and the Walloon region, grant number [3135].

Institutional Review Board Statement

This study was conducted in accordance with the guidelines of ethical research in Belgium and University of Liège. No formal ethical approval was required by the ERDF and Walloon region (the funding agencies), but we still conducted every step of the research in strict compliance with those ethical and deontological guidelines.

Informed Consent Statement

Informed consent was obtained from all subjects involved in the study.

Data Availability Statement

Not applicable.

Acknowledgments

This research is part of the “Wal-e-Cities” project, funded by the European Regional Development Fund (ERDF) and the Walloon region. The authors would like to thank the funding authorities, as well as all who contributed to this research, in particular the cities, citizens and organizations involved in the participatory process.

Conflicts of Interest

The authors declare no conflict of interest.

References

  1. Siva, J.P.S.; London, K. Investigating the role of client learning for successful architect-client relationships on private single dwelling projects. Archit. Eng. Des. Manag. 2011, 7, 177–189. [Google Scholar] [CrossRef]
  2. Biau, V.; Fenker, M.; Macaire, E. Les métiers de l’architecture et de l’urbanisme à l’épreuve de l’implication des habitants et des usagers. In Cahier Ramau 6 L’Implication des Habitants dans la Fabrication de la Ville Métiers et Pratiques en Question; Biau, V., Fenker, M., Macaire, E., Eds.; Cahiers Ramau: Paris, France, 2013; pp. 11–28. [Google Scholar]
  3. Prost, R.; Chaslin, F. Pratiques de Projet en Architecture: Le Tournant Silencieux: Essai; Infolio: Gollion, Switzerland, 2014. [Google Scholar]
  4. Albrech, J. Towards a theory of participation in architecture—An examination of humanistic planning theories. J. Archit. Educ. 1988, 42, 24–31. [Google Scholar] [CrossRef]
  5. Macaire, E. Des architectes à l’épreuve de la participation. In Ville Éphémère, Ville Durable—Nouveaux Usagers, Nouveaux Pouvoirs; De Coninck, F., Deroubaix, J.-F., Eds.; L’oeil D’or: Cannes, France, 2009; pp. 135–147. [Google Scholar]
  6. McDonnell, J.; Lloyd, P. Beyond specification: A study of architect and client interaction. Des. Stud. 2014, 35, 327–352. [Google Scholar] [CrossRef]
  7. Sanders, E. Information, Inspiration and Co-creation. In Proceedings of the 6th International Conference of the European Academy of Design, Bremen, Germany, 29–31 March 2005; p. 14. [Google Scholar]
  8. Fleming, D. Professional-Client discourse in design: Variation in accounts of social roles and material artifacts by designers and their clients. Text Interdiscip. J. Study Discourse 1996, 16, 133–160. [Google Scholar] [CrossRef]
  9. Chadoin, O. La ville des individus. Sociologie, urbanisme et architecture, propos croisés. In Villes et Entreprises; L’Harmattan: Paris, France, 2004. [Google Scholar]
  10. Zetlaoui-Léger, J. Urbanisme participatif. In Dictionnaire Critique et Interdisciplinaire de la Participation; Casillo, I., Barbier, R., Blondiaux, L., Chateayraynaud, F., Fourniau, J.-M., Lefebvre, R., Neveu, C., Salles, D., Eds.; GIS Démocratie et Participation: Paris, France, 2013. [Google Scholar]
  11. Harrop, D. “Let’s make a prototype”: Exploring temporary urbanism in the form of transitional urban design schemes that can be tested prior to permanent implementation. In Proceedings of the Empowering Change—Transformative Innovation Sin and Projects: Book of Proceedings of the 8th International Urban Design Conference, Brisbane, Australia, 15–16 November 2015; Association for Sustainability in Business Inc.: Brisbane, Australia, 2015; pp. 124–146. [Google Scholar]
  12. Barcenilla, J.; Bastien, J.-M.-C. L’acceptabilité des nouvelles technologies: Quelles relations avec l’ergonomie, l’utilisabilité et l’expérience utilisateur ? Trav. Hum. 2009, 72, 311–331. [Google Scholar] [CrossRef] [Green Version]
  13. Lallemand, C.; Gronier, G.; Koenig, V. User experience: A concept without consensus? Exploring practitioners’ perspectives through an international survey. Comput. Human Behav. 2015, 43, 35–48. [Google Scholar] [CrossRef]
  14. Sevaldson, B. Beyond user centric design. In Proceedings of the RSD7, Relating Systems Thinking and Design 7, Turin, Italy, 23–26 October 2018; pp. 23–26. [Google Scholar]
  15. Davidova, M.; Zavoleas, Y. Post-anthropocene: The Design after the Human Centered Design Age. In Proceedings of the 25th CAADRIA Conference, Bangkok, Thailand, 5–6 August 2020; Holzer, D., Nakapan, W., Globa, A., Koh, I., Eds.; Chulalongkorn University: Bangkok, Thailand, 2020; Volume 2, pp. 203–212. [Google Scholar]
  16. Chesbrough, H.; Vanhaverbeke, W.; West, J. Open Innovation: Researching a New Paradigm; Oxford University Press: Oxford, UK, 2006. [Google Scholar]
  17. Cardon, D. Innovation par l’usage. In Enjeux de Mots. Regards Multiculturels sur les Sociétés de L’Information; Ambrosi, A., Peugeot, V., Pimienta, D., Eds.; C&F Editions: Caen, France, 2005; pp. 309–341. [Google Scholar]
  18. Steen, M. Tensions in human-centred design. CoDesign 2011, 7, 45–60. [Google Scholar] [CrossRef]
  19. Luck, R. Learning to talk to users in participatory design situations. Des. Stud. 2007, 28, 217–242. [Google Scholar] [CrossRef]
  20. Bjögvinsson, E.; Ehn, P.; Hillgren, P.-A. Design things and design thinking: Contemporary participatory design challenges. Des. Issues 2000, 28, 101–116. [Google Scholar] [CrossRef]
  21. Norouzi, N.; Shabak, M.; Embi, M.R.B.; Khan, T.H. The Architect, the Client and Effective Communication in Architectural Design Practice. Procedia Soc. Behav. Sci. 2015, 172, 635–642. [Google Scholar] [CrossRef] [Green Version]
  22. Roux, M. Inventer Un Nouvel Art D’habiter. Le Ré-Enchantement de L’espace; L’Harmattan: Paris, France, 2002. [Google Scholar]
  23. Faburel, G. L’habitant et les savoirs de l’habiter comme impensés de la démocratie participative. Cah. RAMAU 2013, 31–53. [Google Scholar]
  24. Hill, J. Occupying Architecture. Between the Architect and the User; Routledge: London, UK, 1998. [Google Scholar]
  25. Latour, B.; Yaneva, A. “Give me a gun and i will make all buildings move”: An ANT’s view of architecturearchitecture. In Explorations in Architecture: Teaching, Design, Research; Geiser, R., Ed.; Birkhäuser: Basel, Switzerland, 2008; pp. 80–89. [Google Scholar]
  26. Van der Linden, V.; Dong, H.; Heylighen, A. Tracing architects’ fragile knowing about users in the socio-material environment of design practice. Des. Stud. 2019, 63, 65–91. [Google Scholar] [CrossRef]
  27. Chess, C. Evaluating environmental public participation: Methodological questions. J. Environ. Plan. Manag. 2000, 43, 769–784. [Google Scholar] [CrossRef]
  28. Klüber, S.; Maas, F.; Hohm, A.; Hurtienne, J. Participant’s View: Short-Term Evaluation of Realizing PD Ideals. PervasiveHealth Pervasive Comput. Technol. Healthc. 2020, 2, 138–142. [Google Scholar] [CrossRef]
  29. Drain, A.; Shekar, A.; Grigg, N. Insights, Solutions and Empowerment: A framework for evaluating participatory design. CoDesign 2021, 17, 1–21. [Google Scholar] [CrossRef]
  30. Abelson, J.; Gauvin, F.-P. Assessing the Impacts of Public Participation: Concepts, Evidence and Policy Implications; Canadian Policy Research Networks: Ottawa, ON, Canada, 2006. [Google Scholar]
  31. Rowe, G.; Frewer, L.J. Evaluating public-participation exercises: A research agenda. Sci. Technol. Hum. Values 2004, 29, 512–557. [Google Scholar] [CrossRef]
  32. Bossen, C.; Dindler, C.; Iversen, O.S. Evaluation in Participatory Design: A literature survey. ACM Int. Conf. Proc. Ser. 2016, 1, 151–160. [Google Scholar] [CrossRef]
  33. Laurian, L.; Shaw, M.M. Evaluation of public participation: The practices of certified planners. J. Plan. Educ. Res. 2009, 28, 293–309. [Google Scholar] [CrossRef]
  34. Rosener, J. User-oriented evaluation: A new way to view citizen participation. J. Appl. Behav. Sci. 1981, 17, 583–596. [Google Scholar] [CrossRef]
  35. Webler, T. “Right” Discourse in Citizen Participation: An Evaluative Yardstick. In Fairness and Competence in Citizen Participation: Evaluating Models for Environmental Discourse; Renn, O., Webler, T., Wiedemann, P., Eds.; Kluwer Academic Press: Dordrecht, The Netherlands, 1995; pp. 35–86. [Google Scholar]
  36. Hendriks, N.; Slegers, K.; Duysburgh, P. Codesign with people living with cognitive or sensory impairments: A case for method stories and uniqueness. CoDesign 2015, 11, 70–82. [Google Scholar] [CrossRef]
  37. Lundmark, S. Design project failures: Outcomes and gains of participation in design. Des. Stud. 2018, 59, 77–94. [Google Scholar] [CrossRef]
  38. Jacquet, V.; van der Does, R. Should we care about small-scale deliberation? A systematic literature review of minipublic consequences. In Proceedings of the Kongress der Deutschen Vereinigung für Politikwissenschaft, Frankfurt, Germany, 25–28 September 2018. [Google Scholar]
  39. Sanders, E.; Stappers, P.J. Co-creation and the new landscapes of design. CoDesign 2008, 4, 1–16. [Google Scholar] [CrossRef] [Green Version]
  40. Collins, M.A.; Amabile, T.M. Motivation and creativity. In Handbook of Creativity; Sternberg, R.J., Ed.; Cambridge University Press: Cambridge, UK, 1999; pp. 297–312. [Google Scholar]
  41. Merton, R.K.; Kendall, L. The focused interview. Am. J. Sociol. 1946, 51, 541–557. [Google Scholar] [CrossRef]
  42. May, J. The triangle of engagement: An unusual way of looking at the usual suspects. Public Money Manag. 2007, 27, 69–75. [Google Scholar] [CrossRef]
  43. Arnstein, S.R. A Ladder of Citizen Participation. J. Am. Plan. Assoc. 1969, 35, 216–224. [Google Scholar] [CrossRef] [Green Version]
  44. Amabile, T.M. Social environments that kill creativity. In Readings in Innovation; Gryskiewicz, S.S., Hills, D.A., Eds.; Center for Creative Leadership: Colorado, NC, USA, 1992; pp. 1–13. [Google Scholar]
Figure 1. Generic participatory protocol implemented throughout the four pilot cities.
Architecture 02 00029 g001
Figure 2. Example of participants’ ideas proposed for the house of associations in City B, bringing together both digital ideas such as a shared online platform (left area of the figure) and analog ideas about the identity and function of the physical space (right area). The colors of the post-its correspond to the phase of the participatory activity (gray = ideas coming from a previous workshop; beige = new ideas; pink and green = ideas generated to react to some disruptive events). The colors of the round stickers correspond to participants’ votes for their favorite ideas that are easy (yellow) or difficult (red) to implement.
Architecture 02 00029 g002
Figure 3. Average satisfaction (in gray) and motivation levels (in black) in each city.
Architecture 02 00029 g003
Figure 4. Snapshots of solution D1 as presented at the end of the hackathon. From left to right: (1) home interface indicating the number of kg of CO2 saved; (2) itinerary; (3) selection of the mode of transportation used for this trip; (4) summary of points earned and advance personal or class goals in terms of distance, shared rides, CO2 savings and speed; (5) awards available this month.
Architecture 02 00029 g004
Figure 5. Level of participants’ confidence in the success of the project at the time of the logbook (in black) and level of achievement actually reached at the end of the process (in gray), in each city.
Architecture 02 00029 g005
Figure 6. Qualitative, schematic representation of the evolution of participants’ satisfaction (in black) and expectation levels (in gray) according to the city level of participatory maturity.
Architecture 02 00029 g006
Table 1. Summary figures of the organized participatory initiatives.
CityCity ACity BCity CCity DTotal
TopicA cultural center on the main squareA house for associationsEco-friendly behaviors and smart meters at the household levelMobility in the surroundings of one specific school/
Number of workshops3
(W1–W2–W3)
4
(W1–W2–W3–W4)
2
(W2–W3)
3
(W1–W2–W3)
12
Total number of participants (N) 1791031833233
Total number of persons (n) 162781723180
Total number of logbook entries76851527203
1 The number of participants N is greater than the number of people involved n, because some people participated more than once.
Table 2. Overall picture of the main profile of participants in each city.
CityCity ACity BCity CCity D
AgeMainly seniors and some people in their thirtiesMainly people over 50From 30-year-old to 60-year-old peopleMainly 16-year-old and 17-year-old students
Socioeconomic profileWorking-class and retired peopleWorking-class and retired peopleVulnerable people and municipal staffStudents, school parents and teachers
Thematic profileCulture amateurs or producers; municipal actorsAssociative network and active neighborsPeople with ecological or/and economical concernsUsers of the school and mobility facilities in the surrounding area
Table 3. Challenges submitted to the hackers; projects resulting from the hackathon and current status of the projects.
IDCityCitizens’ ChallengeHackers’ SolutionPossible AwardsStatus
1City AAn algorithm to transform music into images and to ornament a facadeProjects 1 to 5 were not selected by hackers
2City AAn interactive tool for designing modular spaces
3City BA platform to centralize associative information
4City BA solution to make the house for associations a convivial and
multi-purpose place
5City BAn inter-association coordination platform
6City BA material and human resources management platformSolution B1Best prototype
Best citizen service
Best solution for “smart territories”
Still active: the application is evolving and the team is looking for funding
7City BA system for managing access and occupation of the house for associationsSolution B2[Omitted for blind review] PrizeAbandoned in November 2020 due to lack of funding
8City CAn interface to visualize energy consumptionSolution C/Abandoned at the end of the hackathon, as these were student projects that did not have the means to invest in the long term, especially in the middle of the COVID-19 pandemic
9City DAn application to encourage soft mobility from/to home/schoolSolution D1Best Pitch
10City DA co-biking application to go to schoolSolution D2/
Table 4. Structure of the logbook.
Types of QuestionsQuestions
Relationship to citizen participationShort, open-ended questions:
How did you find out about the workshop?
What motivated you to participate in this workshop?
Have you ever participated in another participatory event (apart from this one)? If so, what was it about?
Do you intend to participate again in this project? Why or why not?
Evaluation of the participatory experienceHow would you rate your participation? Indicate your feelings by ticking one option per line (very low–low–moderate–high–very high):
Your motivation to participate
Your contribution to the project
Your decision-making power
Your understanding of the objectives of the day
Your confidence that the project will succeed
Your confidence in the organizers
Your overall satisfaction
Benefits of the participatory experienceWhat benefits do you get from your participation? Check the one that best describes your experience (not at all—a little—moderately—a lot—I don’t know):
New knowledge
New skills
Cohesion between participants
Awareness of new issues
Recognition of your contribution
Degree of commitment to the project
Other commentsShort, open-ended questions:
What did you particularly like about your participation?
What did you find disappointing or annoying?
In your opinion, what objectives should ideally be achieved at the end of the participatory process?
Any comments? A question? Express yourself here.
Table 5. Interview grid for the focus groups.
TimingInstructions and Questions
0′–5′Objectives of the meeting
5′–15′Round table presentation
15′–20′Reminder of the stages of the participatory process and presentation of the results from the hackathon
20′–60′In your own words, what were the objectives of the participatory workshop(s) you attended?
Did this (these) workshop(s) meet your expectations?
Do you feel that your contribution has had/will have an impact on the final project?
Do you think that you can contribute to the future of the project?
Are you satisfied with the decisions that were made?
What do you think are the benefits of your participation for the city?
What do you think about taking part in other participatory initiatives in the future?
Table 6. Number of participants (N) and average level of satisfaction (S) during the participatory process.
CitiesWorkshop 1Workshop 2Workshop 3HackathonWorkshop 4Whole Process
City AN = 18
S = 4.4
N = 33
S = 3.7
N = 28
S = 4.0
//N = 79
S = 4.0
City BN = 48
S = 4.1
N = 25
S = 4.0
N = 26
S = 4.1
/N = 4N = 103
S = 4.1
City C/N = 8
S = 3.9
N = 10
S = 3.6
//N = 18
S = 3.8
City DN = 10
S = 4.4
N = 12
S = 4.3
N = 8
S = 4.3
N = 3/N = 33
S = 4.4
Table 7. Types of participants given their participatory background.
Cities“Novices” =
No Previous
Participation 1
“Insiders” =
Only One Previous
Participation
“Usual Suspects” =
Frequent
Participation
City An = 26 (61%)n = 13 (30%)n = 4 (9%)
City Bn = 20 (53%)n = 10 (26%)n = 8 (21%)
City Cn = 6 (43%)n = 2 (14%)n = 6 (43%)
City Dn = 13 (56%)n = 8 (35%)n = 2 (9%)
In generaln = 65 (55%)n = 33 (28%)n = 20 (17%)
1 With the possible exception of other activities from our own participatory process.
Table 8. Profile of the 12 participants who took part in the focus groups.
CitiesParticipant 1Average
Satisfaction
Participatory
Background
Participatory
Trajectory
City AA1HighInsider2 participations (W2–W3)
A2HighNovice1 participation (W3)
City BB1HighNovice2 participations (W1–W2)
B2HighUsual suspect4 participations (W1–W2–W3–W4)
B3HighUsual suspect1 participation (W1)
B4HighUsual suspect3 participations (W1–W2–W3)
B5HighInsider3 participations (W2–W3–W4)
City CC1High to very highUsual suspect2 participations (W2–W3)
C2HighUsual suspect1 participation (W2)
C3LowUsual suspect1 participation (W3)
City DD1HighNovice3 participations (W2–W3)
D2Very highInsider4 participations (W1–W2–W3)
1 Each participant is anonymously identified by a code composed by the first letter of the considered city and a number.
Publisher’s Note: MDPI stays neutral with regard to jurisdictional claims in published maps and institutional affiliations.

