Article

Lime-Based Plaster Reinforced with Hemp Braids as Sustainable Building Product

Department of Structures for Engineering and Architecture, School of Polytechnic and Basic Sciences, University of Naples “Federico II”, Piazzale Vincenzo Tecchio 80, 80125 Naples, Italy
*
Author to whom correspondence should be addressed.
Architecture 2022, 2(1), 135-156; https://doi.org/10.3390/architecture2010008
Submission received: 4 February 2022 / Revised: 23 February 2022 / Accepted: 1 March 2022 / Published: 8 March 2022

Abstract

:
Sustainability is of fundamental importance for the construction industry: in recent decades researchers focused on supplementing building components with multiple natural fibres, evaluating their mechanical performance and application fields. In this field, the common plasters are usually equipped with glass fibre mesh to avoid crack patterns due to shrinkage. Natural fibres, thanks to their high tensile resistance, can represent a green solution to solve this problem. In particular, this work investigates the properties and the mechanical characteristics of a biocompound obtained with hemp fibres. The first phase aims at identifying the ideal mixture between hemp fibres and mortar to improve workability and avoid altering the water/lime ratio. The performed physical tests provide useful information for the evaluation of the consistency and the workability of the compound. Based on these preliminary results, 10 combinations of 3 parameters, namely fibre diameter, percentage of hemp fibre in the mortar and length of the hemp braid fragments, are tested. Among the mechanical properties, bending, compressive and tensile behaviours are evaluated. For each test, the performances of fibre-reinforced samples are compared to reference specimens. From compressive tests it is noted that the best performances were obtained from fibres with diameter of 1 mm and length of 2 cm. On the other hand, from flexural tests, it is seen that braids with a length of 2 cm provide an average bending stress about 13% less than that of the control specimen. Contrarily, braids with a length of 3 cm give a mean increase of bending stress of about 8% compared to the control specimen.

1. Introduction

Environmental sustainability is a topic of great interest in the construction industry, which is responsible for great primary energy consumption and CO2 emissions [1]. Thus, over recent decades, new materials have been investigated and proposed as alternatives to standard ones to support more sustainable practices in civil engineering. The general aim to employ components derived from renewable sources or with a biodegradable disposal process, to replace the use of materials that are toxic to humans or pollute the environment [2]. In particular, the scientific community has shown interest in investigating the mechanical performances of natural fibres in composite materials (NFCs) for their minor environmental impact and low cost [3]. Plant-based fibres are the most suitable for structural applications due to their high strength and stiffness [4]. Recent studies have focused their attention on the mechanical characterization of many species, including jute [5], hemp [6,7,8], flax [9], bamboo [10], kenaf [11] and ramie [12]. Flax, hemp and ramie fibres have the highest Young’s moduli and tensile strengths [3]. In particular, hemp is characterized by tensile strength of about 690 MPa, Young modulus of 30–60 GPa and failure strain of about 1.6% [13,14].
With a simple processing of its fibers, thanks to its mechanical and physical properties, hemp can be employed in the production of bricks, blocks, panels, plasters, coats and screeds, used for a great variety of applications in new and old buildings [15]. Eco-friendly construction materials were previously developed by mixing hemp fibres with lime [16], pozzolan matrix [17], concrete [18], or other natural components such as starch [19]. Furthermore, hemp fibres are widely employed for their thermal and acoustic insulation properties, low density and mechanical resistance [20].
From an environmental perspective, hemp cultivation has numerous advantages. As the plants are not damaged by insects and rodents, they do not require insecticides and pesticides. Furthermore, it has been shown that a hectare of hemp cultivation absorbs a quantity of CO2 four times higher than a forest in the same area [21]. The fibres are obtained by macerating the stem of the Cannabis sativa plant, which can reach a maximum height of 5 m. The elementary fibres, called cells, are joined together by pectin bridges to form the fibre bundle, characterized by an average diameter of 25 μm and an average length of 25 mm.
The wide employment of natural fibres, including hemp, remains challenging currently. Many factors affect the mechanical performances of NFCs [22,23,24,25], including the selection of fibres and matrix, as well as their manufacturing process [20]. The unsatisfactory reinforcement level reported by studies on natural fibres in comparison to glass fibres is often motivated by compatibility and adhesion issues between the fibres and the matrix [26,27]. Investigations focused on improving the mechanical performance of hemp concrete are very limited. Currently, only the mechanical characterization of hemp concrete is studied. In the view of applying the research results to the industrial manufacturing, a further element to be considered is the reduction of processing. The choice of materials for engineering purposes relies on the interplay between price, processibility and performance. This interaction should be carefully taken into account for any material system [28].
With these limitations and research gaps in mind, this study aims to employ low-cost hemp fibres with reduced manufacturing or prior transformation to explore the performances of a new reinforced hydrated lime. It integrates a previous work aimed at measuring the tensile strength of hemp stems [29]. Other than the environmental benefits of lime, which represents a widely employed material in the present Italian construction industry, as well as in historical buildings, this binder is the most compatible with hemp due to the increased water absorption [30]. This research aims at evaluating the interaction of hemp braids with hydrated lime to replace the use of ordinary glass fibre meshes employed to limit the negative shrinkage effect caused by cracks in the binder material.
In the experimental activity herein developed and presented, hydrated lime is supplemented with hemp braids derived from organic farming with a low environmental impact. A first experimental campaign is conducted to determine the appropriate composition of the biocompound to provide optimal physical and mechanical properties. First, the water absorption degree of hemp braids is studied to determine the amount of water to be supplemented to the biocompound mixture without altering the optimal water/lime ratio. Subsequently, the percentages and dimensions of the hemp braids to be supplemented without altering their rheological capacities are defined through workability tests on the shaking table. Based on these preliminary tests, the mechanical characteristics of three different percentages of braids by weight, two diameters and two lengths are consequently analysed. Bending and compressive mechanical tests are carried out on the specimens packed with different percentages, diameters and fibres lengths. The results are compared with control samples (i.e., specimens without the addition of fibres) to evaluate the change in resistance due to the addition of hemp fibres. Likewise, tensile tests are performed on four braids of different diameters. The whole experimental setup is summarized in the flow chart of Figure 1.
The results provide excellent perspectives for the use of hemp braids in construction. Thanks to their high stiffness modulus and the low specific weight, they allow the improvement of the structural behaviour of plasters without significantly altering the weight of the elements on which they are applied.

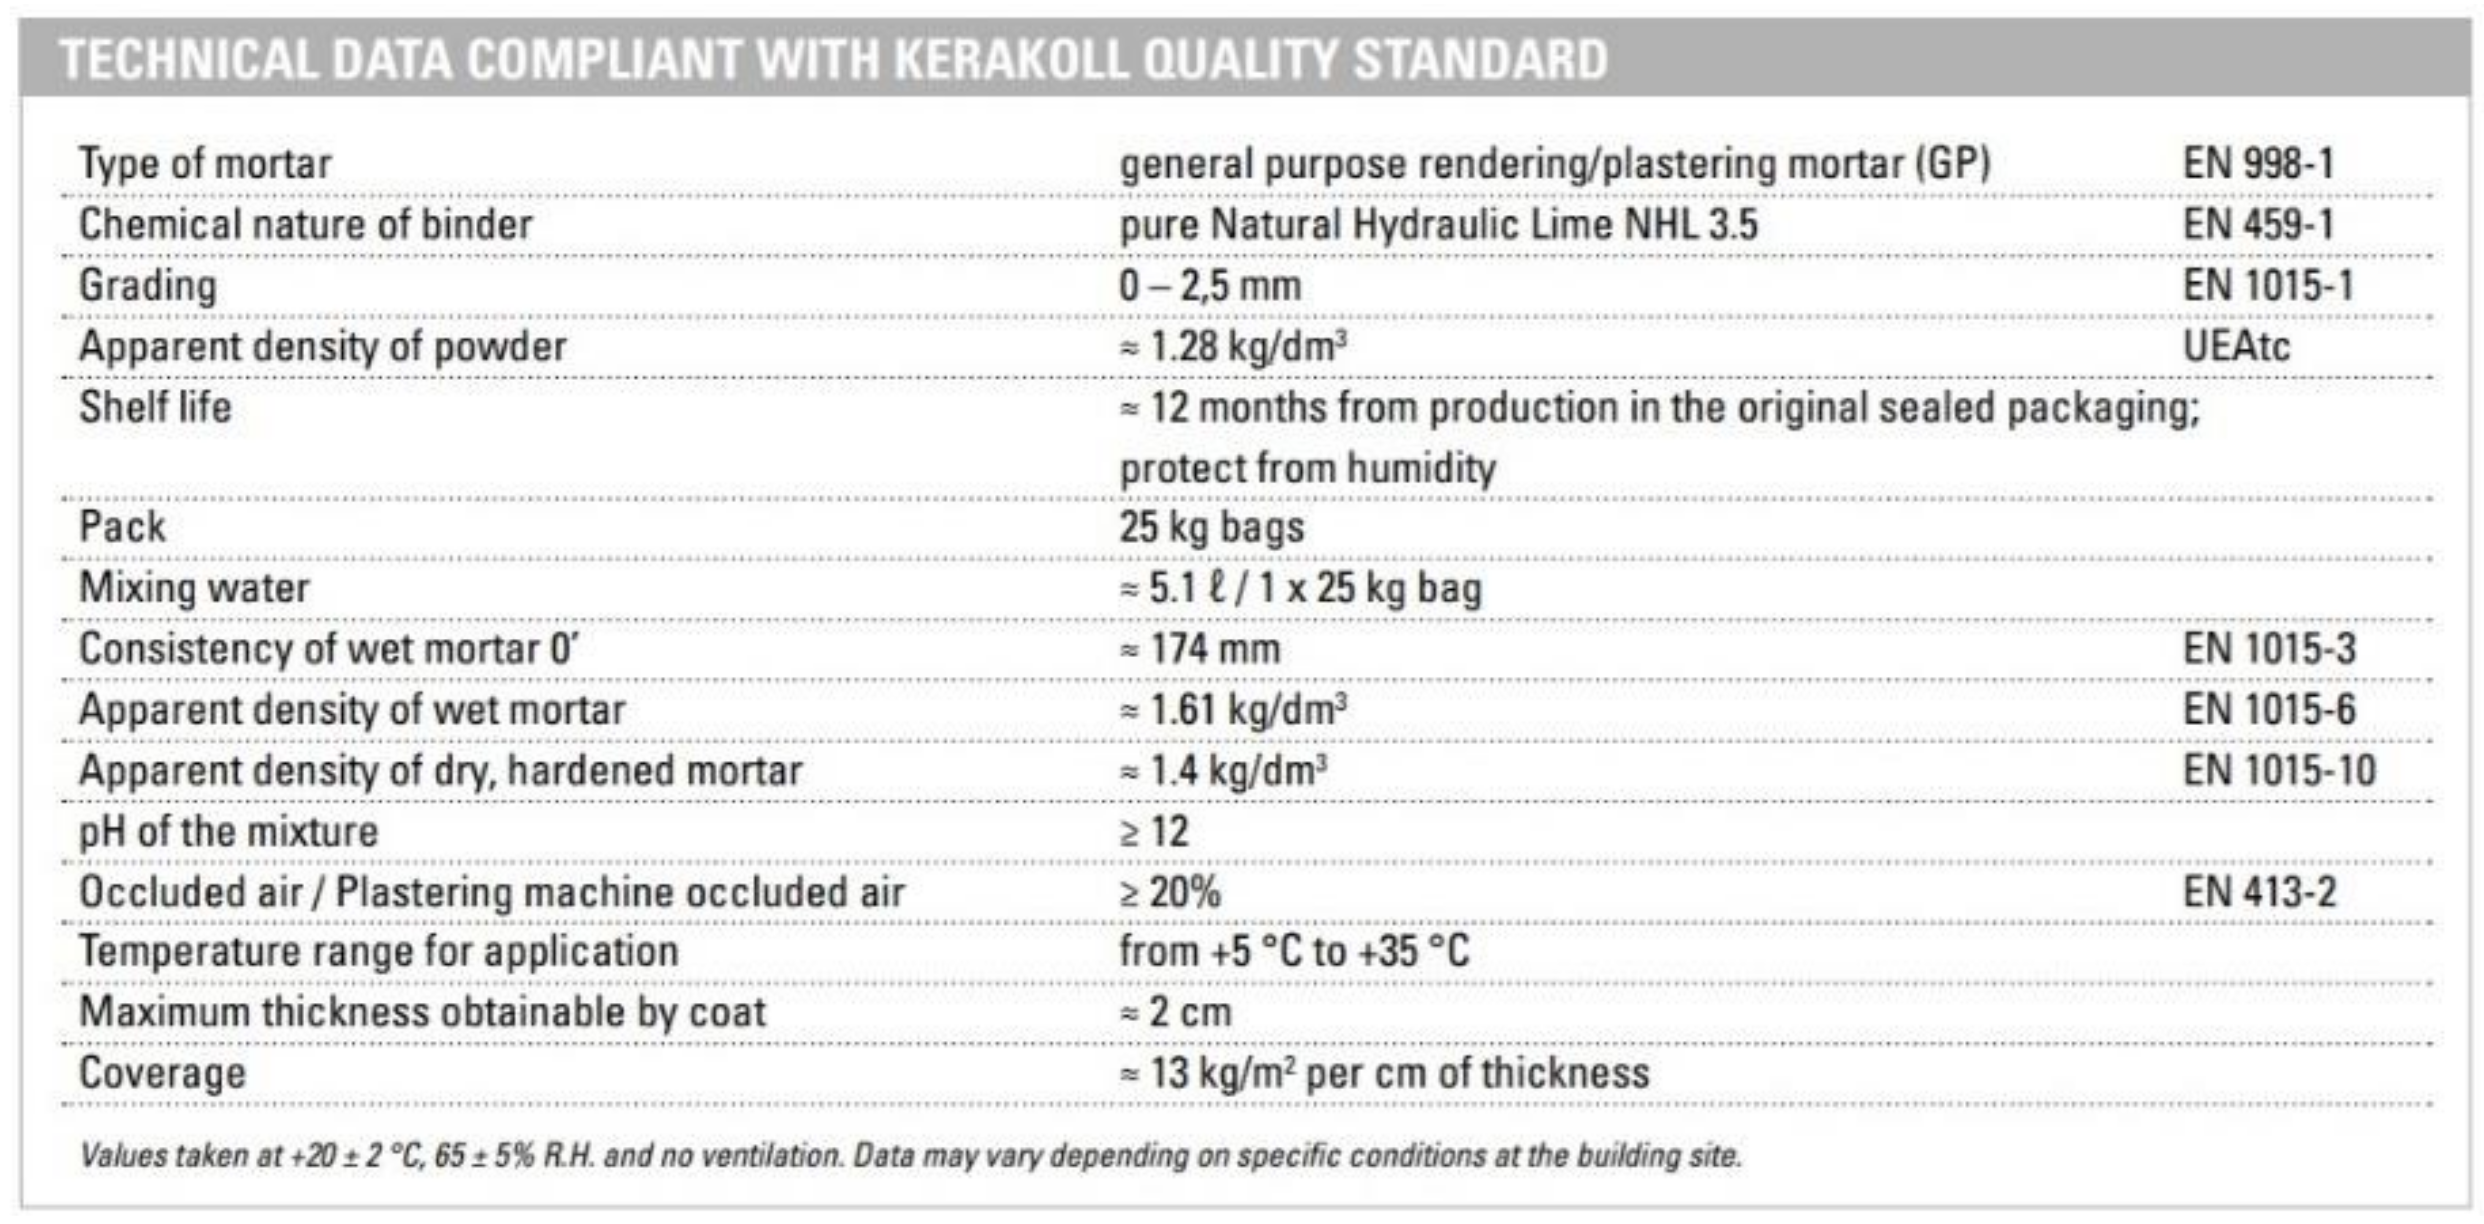
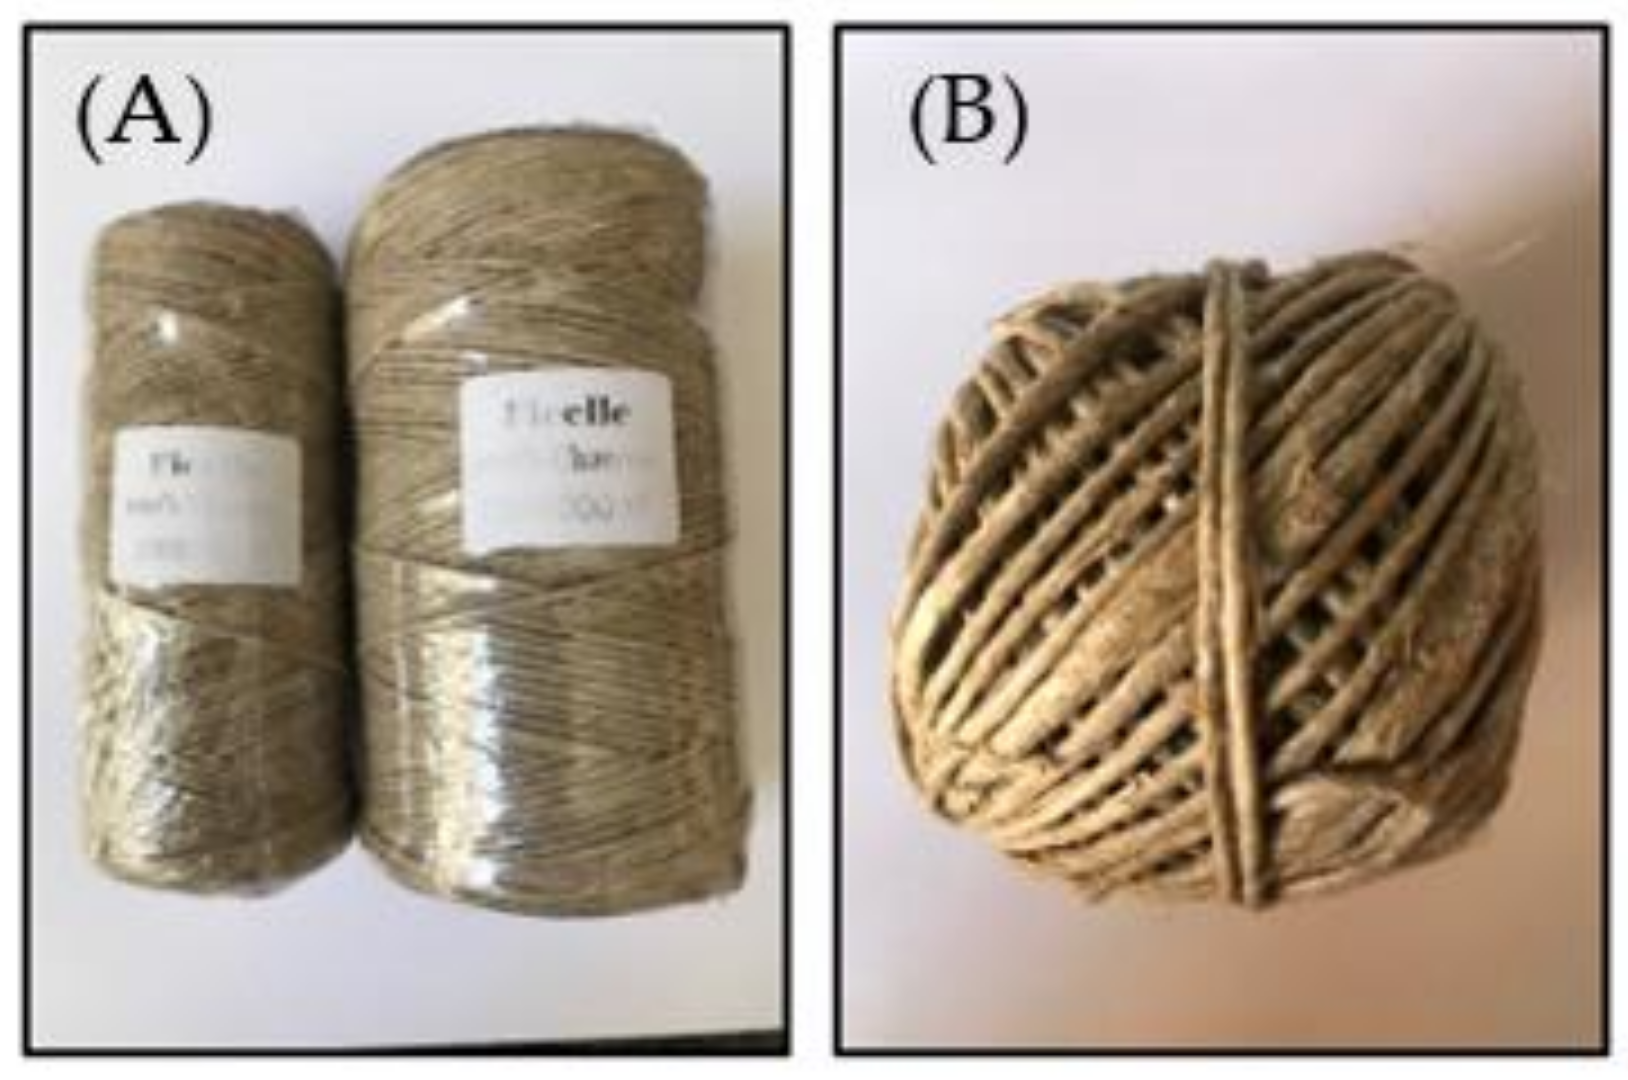
2. Properties of Materials
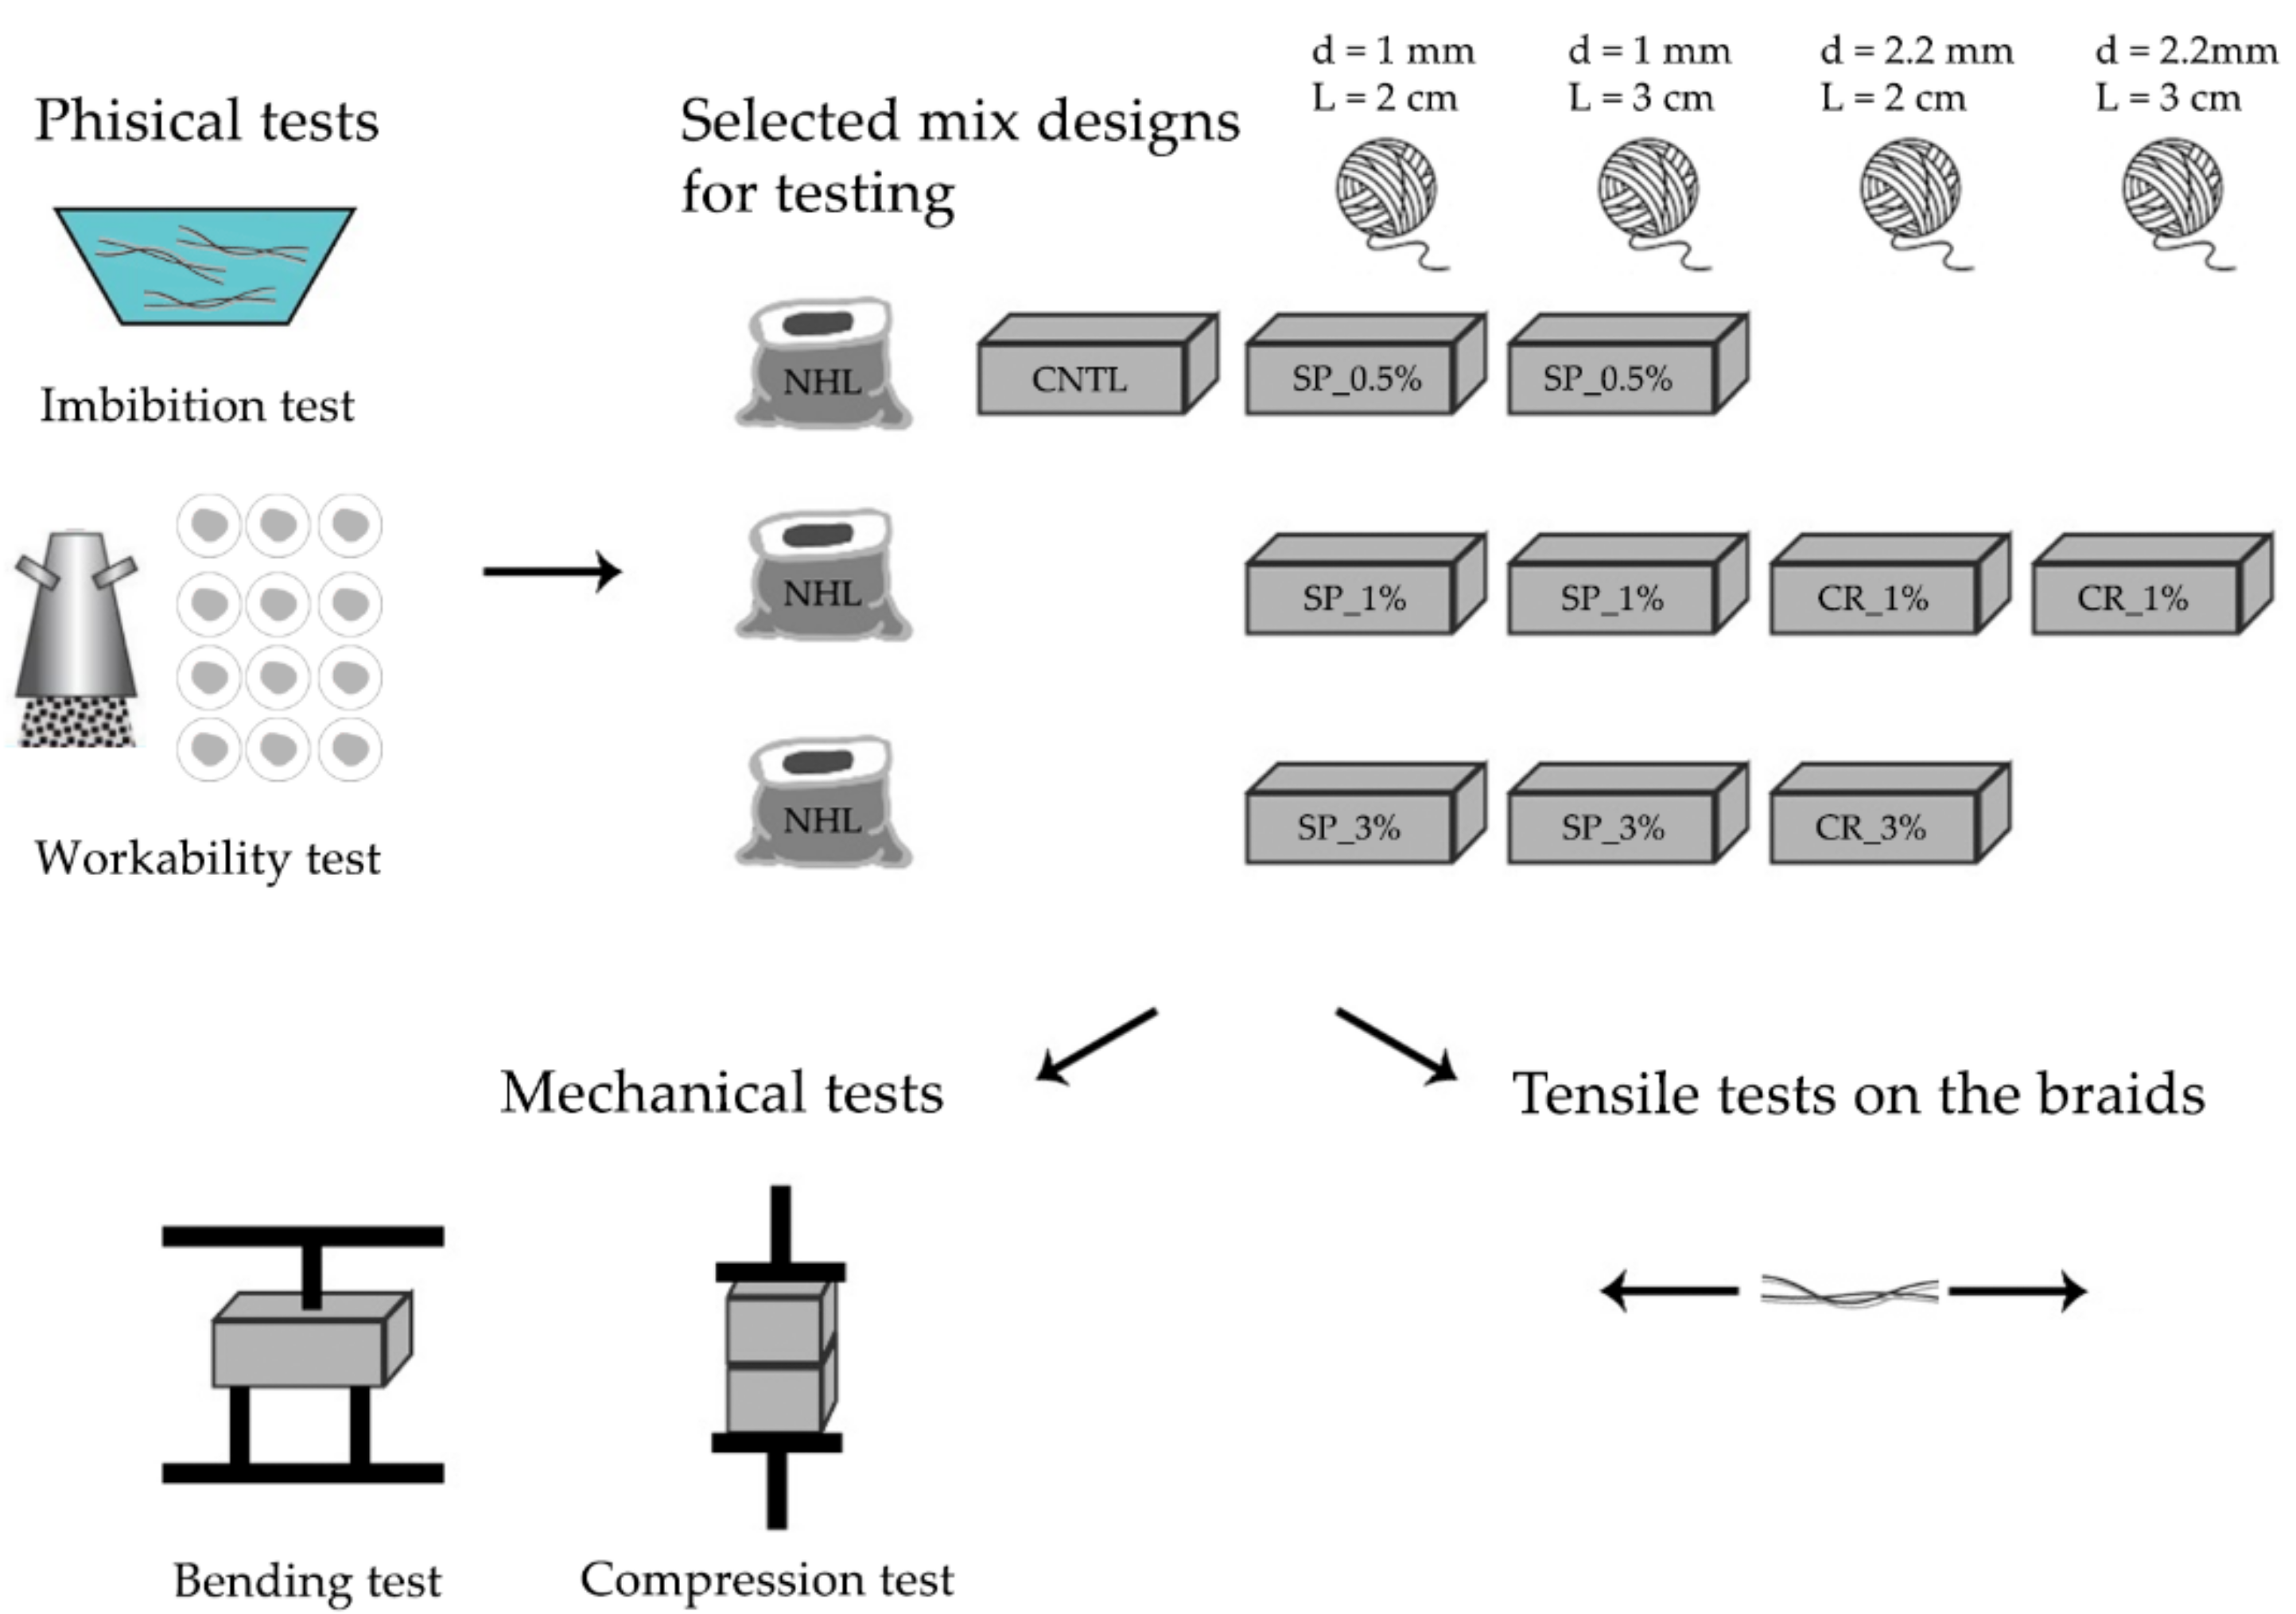
The specimens are prepared with the BIOCALCE® premixed for plasters, which is manufactured by the Kerakoll company. It is a Natural Hydraulic Lime (NHL 3.5), with properties defined according to the EN 459-1 standard [31]. Due to its characteristics, the mortar is suitable for the breathable and protective plastering of load-bearing masonry. It falls within a CS II resistance category according to the EN 998-1 standard [32]. Figure 2 reports the technical data of the used ecofriendly natural mortar.
The reinforcement fibres are hemp braids produced in Italy from local cultivation and arranged in a discontinuous manner in the blend. Figure 3 illustrates the two variants of employed braids, having diameters (d) of 1 mm and 2.2 mm, respectively. The contribution of braids with lengths of 2 cm and 3 cm is separately investigated. Further, three different weight percentages of hemp fibres (0.5%, 1% and 3%) are investigated.

3. Physical Tests

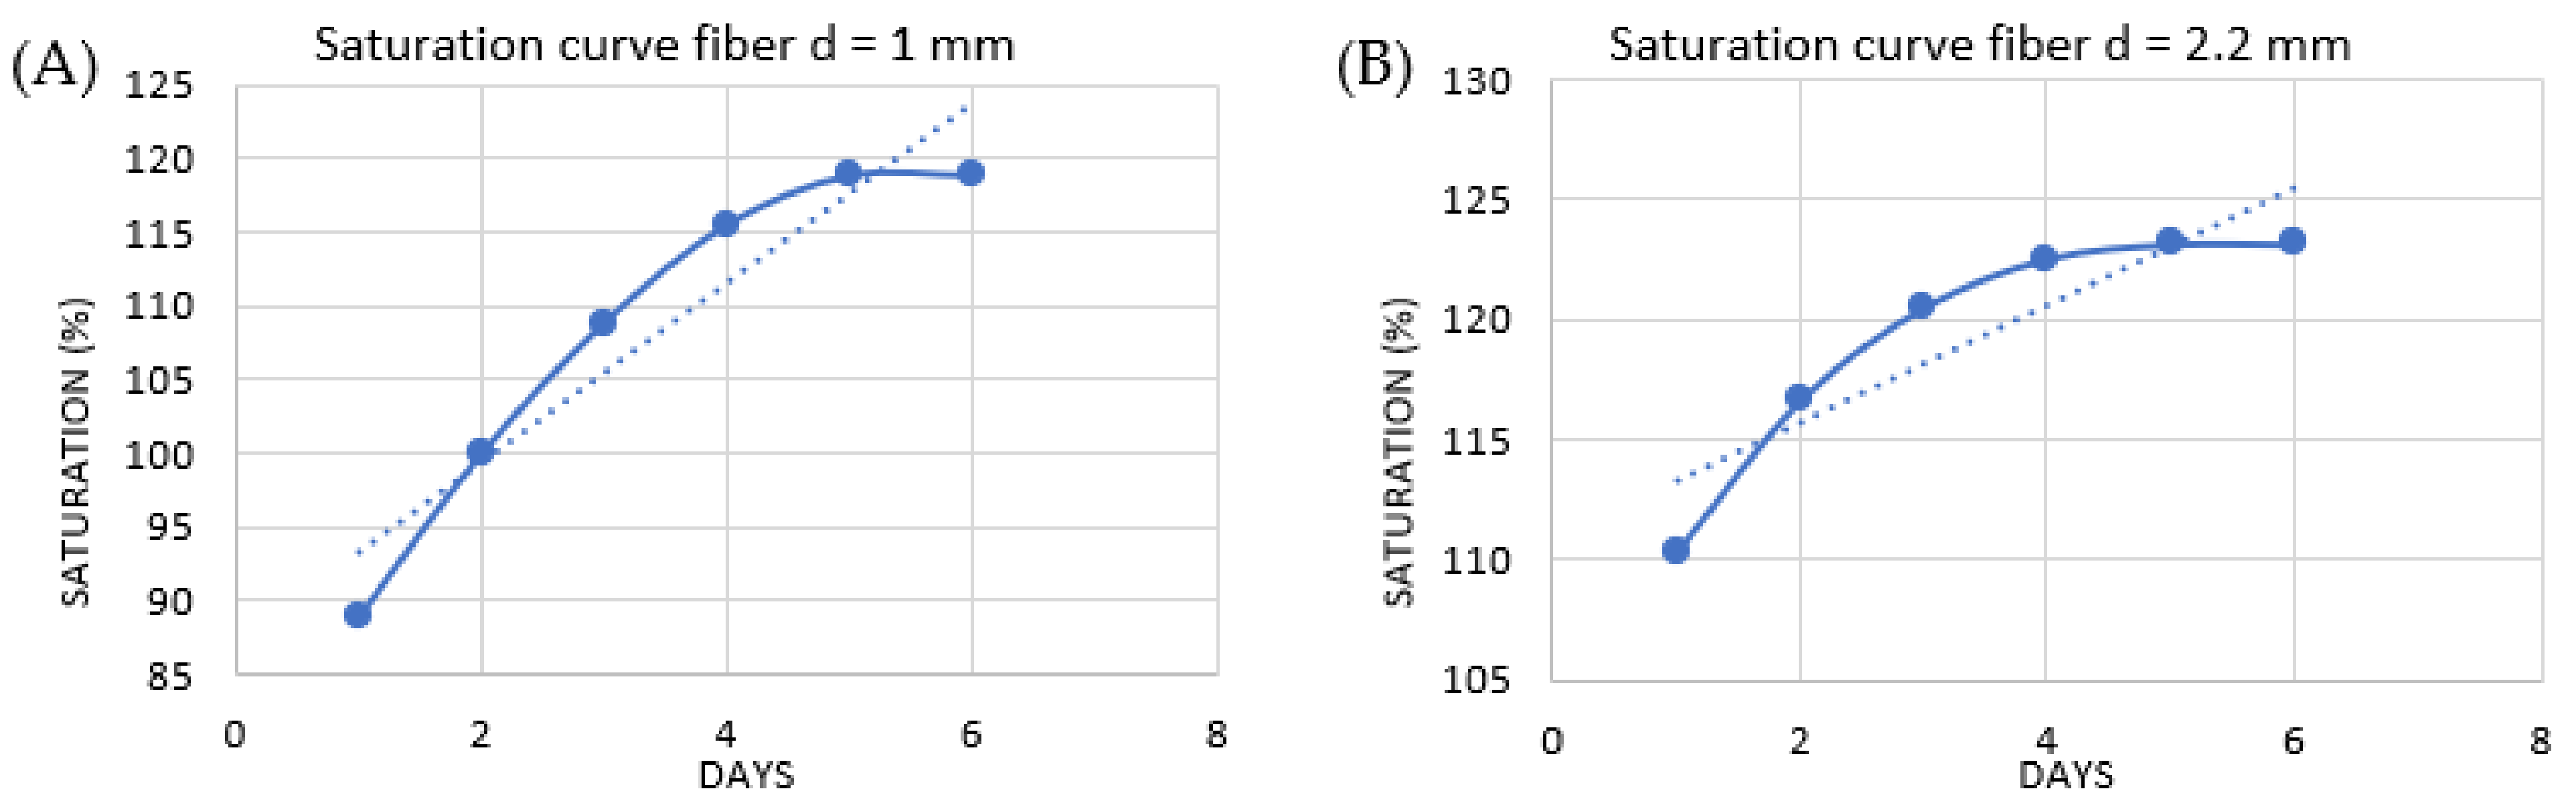
3.1. Imbibition Tests

The amount of water to be supplemented to the mixture is calculated by first assessing the degree of water absorption of the braids. This is essential to avoid altering the optimal water/lime ratio and to ensure adequate workability and resistance values, as reported by the Kerakoll manufacturer.
The quantity of absorbed water is calculated by weighing a sample of hemp braid soaked in water every day over 5 days and subtracting its dry weight. In this way, the percentage of weight variation is calculated. Table 1 and Table 2 report the initial and final weights, the difference and the percentage of water calculated for hemp braids having different lengths and diameters of 1 mm and 2.2 mm, respectively.
The saturation curves processed on the braids with two diameters (1 mm and 2.2 mm) after 6 days of saturation are shown in Figure 4.

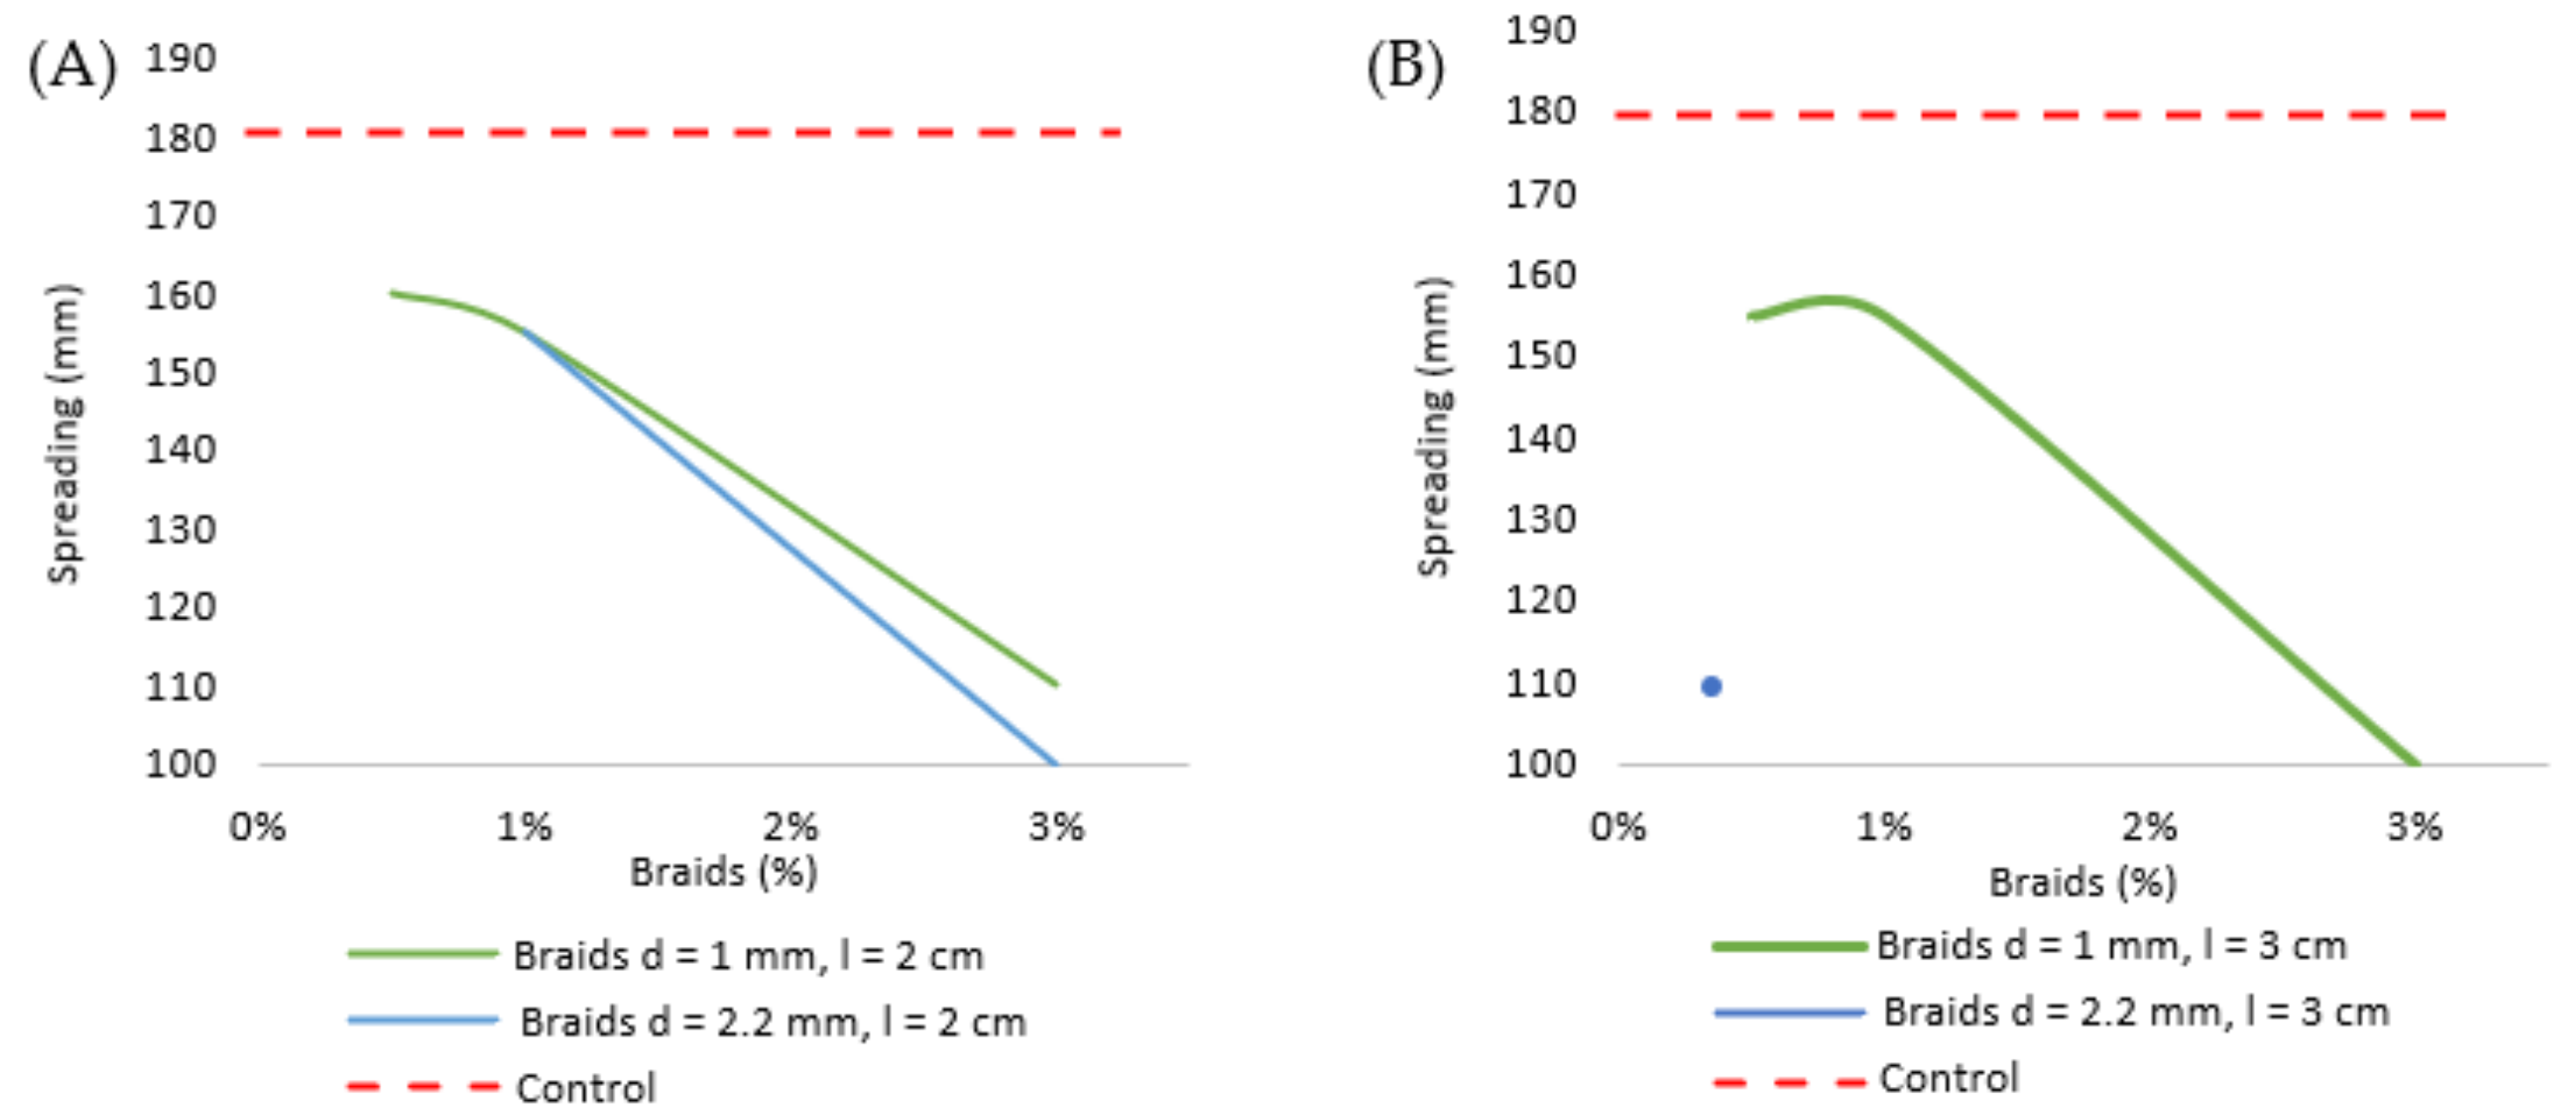
3.2. Workability Tests

Among the multiple available test methods, the workability of the mixture is herein measured with a shaking table. The purpose of the test is to verify the spread of mortar, as the material flows when vibration is applied. The spread is directly related to the mortar consistency. The laboratory tests are carried out according to the procedure reported in the UNI 7044 standard [33]: (I) The cone (upper diameter 70 mm, lower 100 mm) is positioned in the centre of the shaking table; (II) The cone is filled with mortar in three steps, each of which is tamped with a metal pestle, and the surface is then levelled; (III) The cone is removed and 15 vibrations, one per second, are applied to the mixture; (IV) The spreading of the mortar is given by measuring and averaging two orthogonal diameters. Table 3 and Figure 5 report the results of the workability tests on the analysed mixtures.
The spreading diameter of control specimens is equal to 180 mm and is negatively correlated to the percentage of fibres. Thus, as the percentage of fibres grows, the workability decreases. In particular, the trend lines highlight an abrupt reduction in workability with the addition of 3% hemp braids with a diameter of 2.2 mm. Thinner braids display a minor reduction, despite a decaying trend line. It is overall acceptable to obtain a workability reduction that does not fall below 140 mm of spread. Therefore, according to the obtained results, it is recommended to avoid more than 2% of hemp fibres.

3.3. Nomenclature and Characteristics of Specimens

Once the optimal water/lime ratio is established, before the components are weighted by mixing lime and after hemp fibres are gradually integrated in the mixture (Figure 6). Later on, prismatic specimens (40 × 40 × 160 mm, Figure 7) are prepared according to the procedures for cementitious mortars reported by the UNI EN 196-1:2016 guidelines [34].
A total of 27 specimens (Figure 7) with different fibre percentages were prepared: (I) 3 control specimens consisting of premixed mortar and water, which represent the standard reference of the study; (II) 18 specimens reinforced with 1 mm-diameter hemp braids. The percentage of fibre changes between 0.5%, 1% and 3%, whereas the length of the braid between 2 and 3 cm; (III) 9 specimens reinforced with 2.2 mm-diameter braids. The samples are abbreviated as follows: (I) CNTL, (II) SP and (III) CR. Three samples per combination of variables are prepared. The characteristics of the specimens are reported in Table 4 and Table 5.

3.4. Shrinkage

The specimens are measured with a gauge (Figure 8) to estimate any shrinkage phenomena after 28 days of mortar curing.
With the exception of isolated cases, no evident variations in the dimensions were observed. The results are listed in Table 6 and Table 7.

4. Mechanical Experimentation
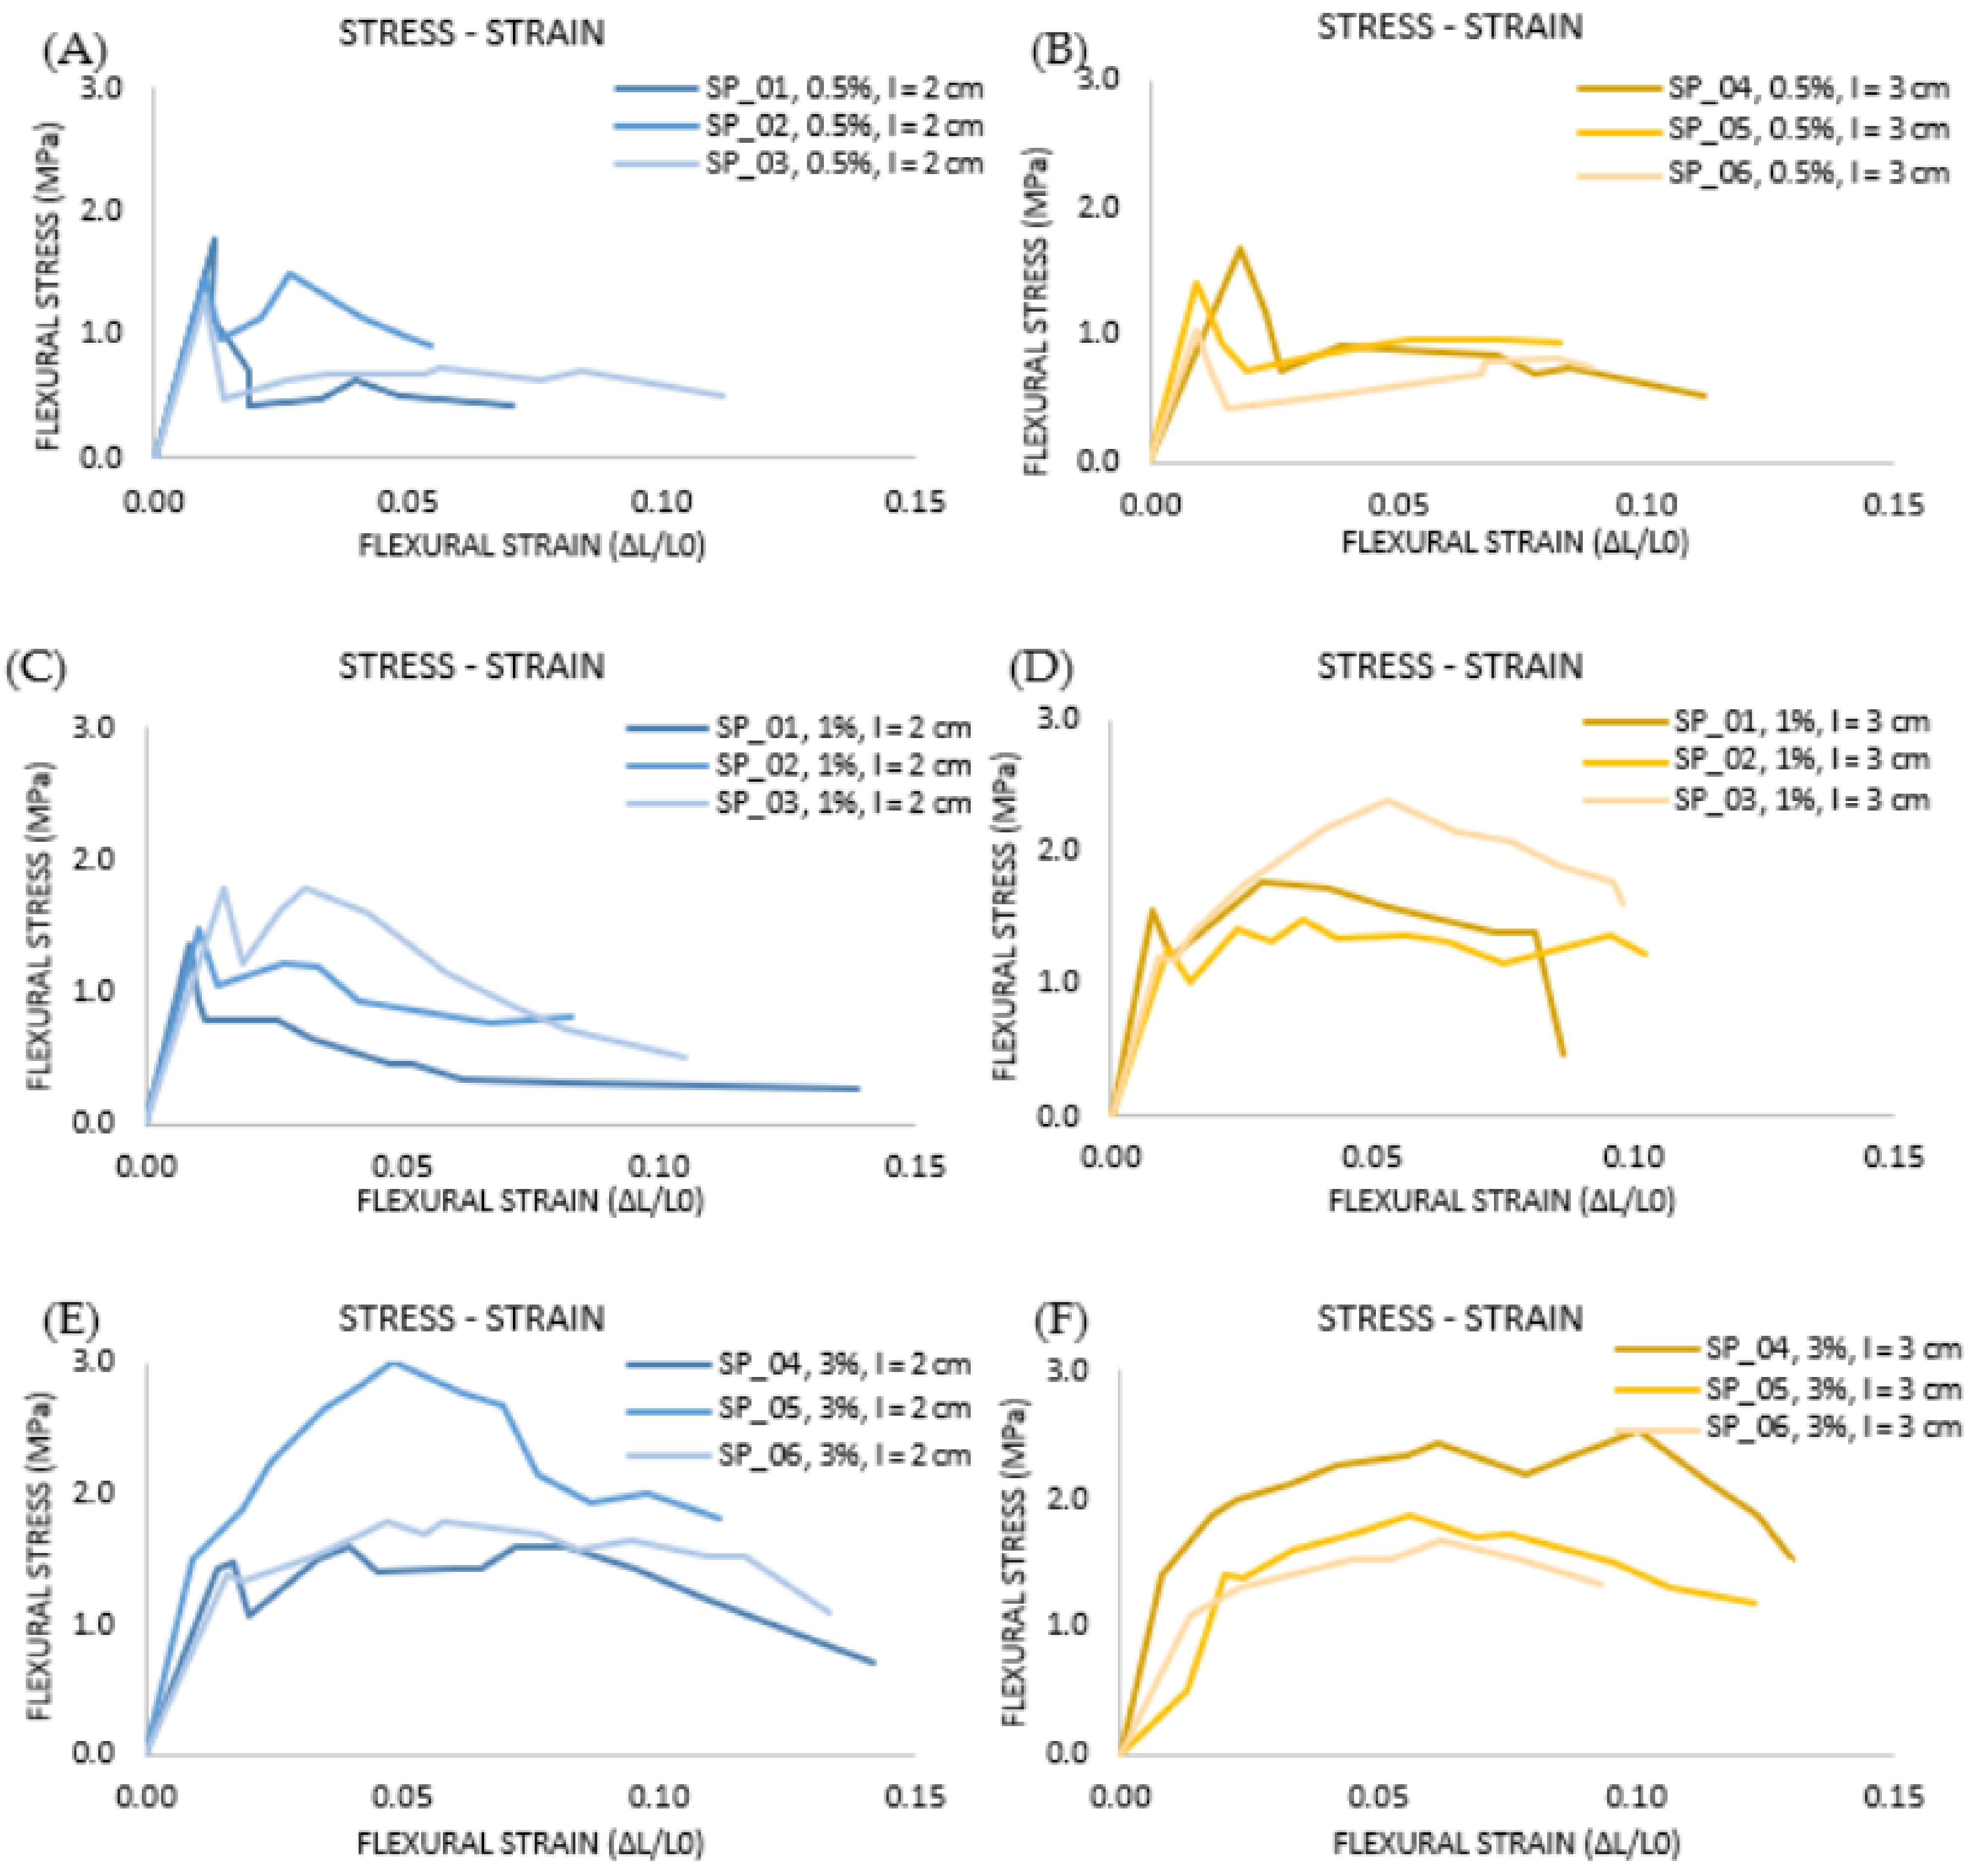
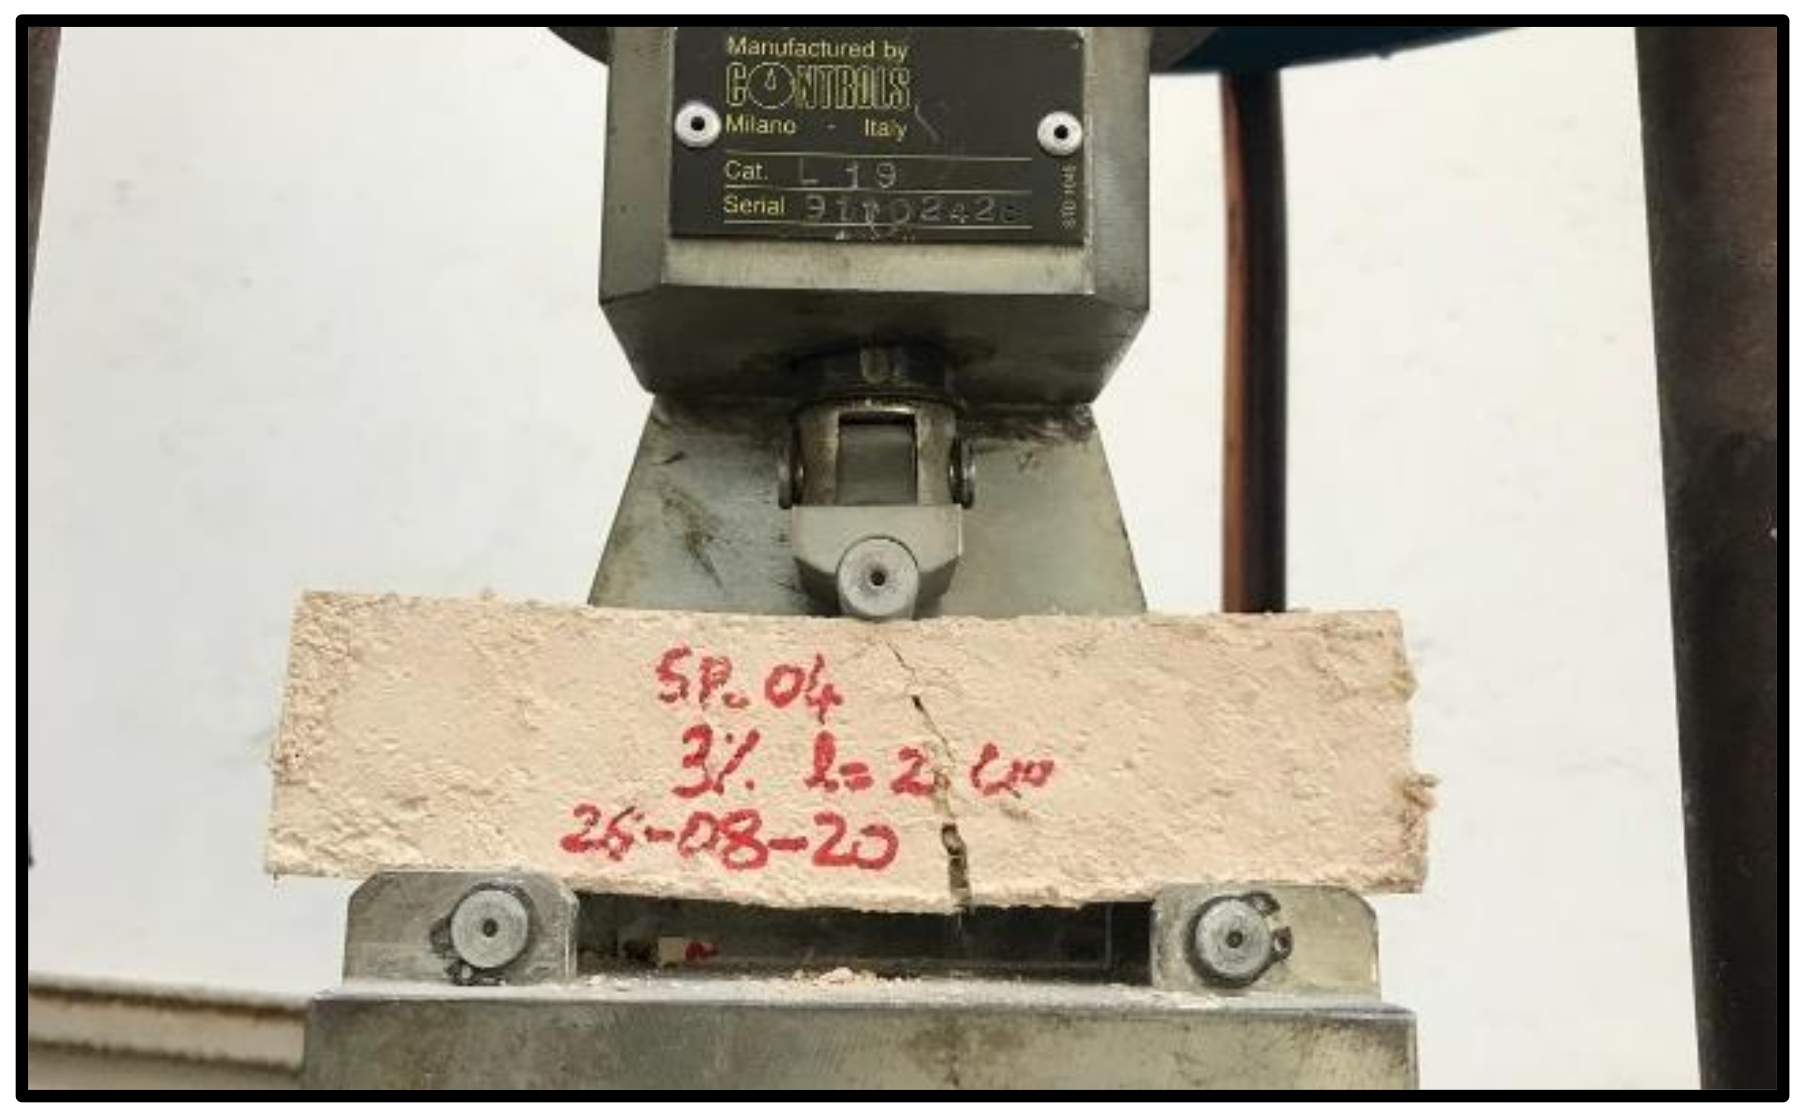
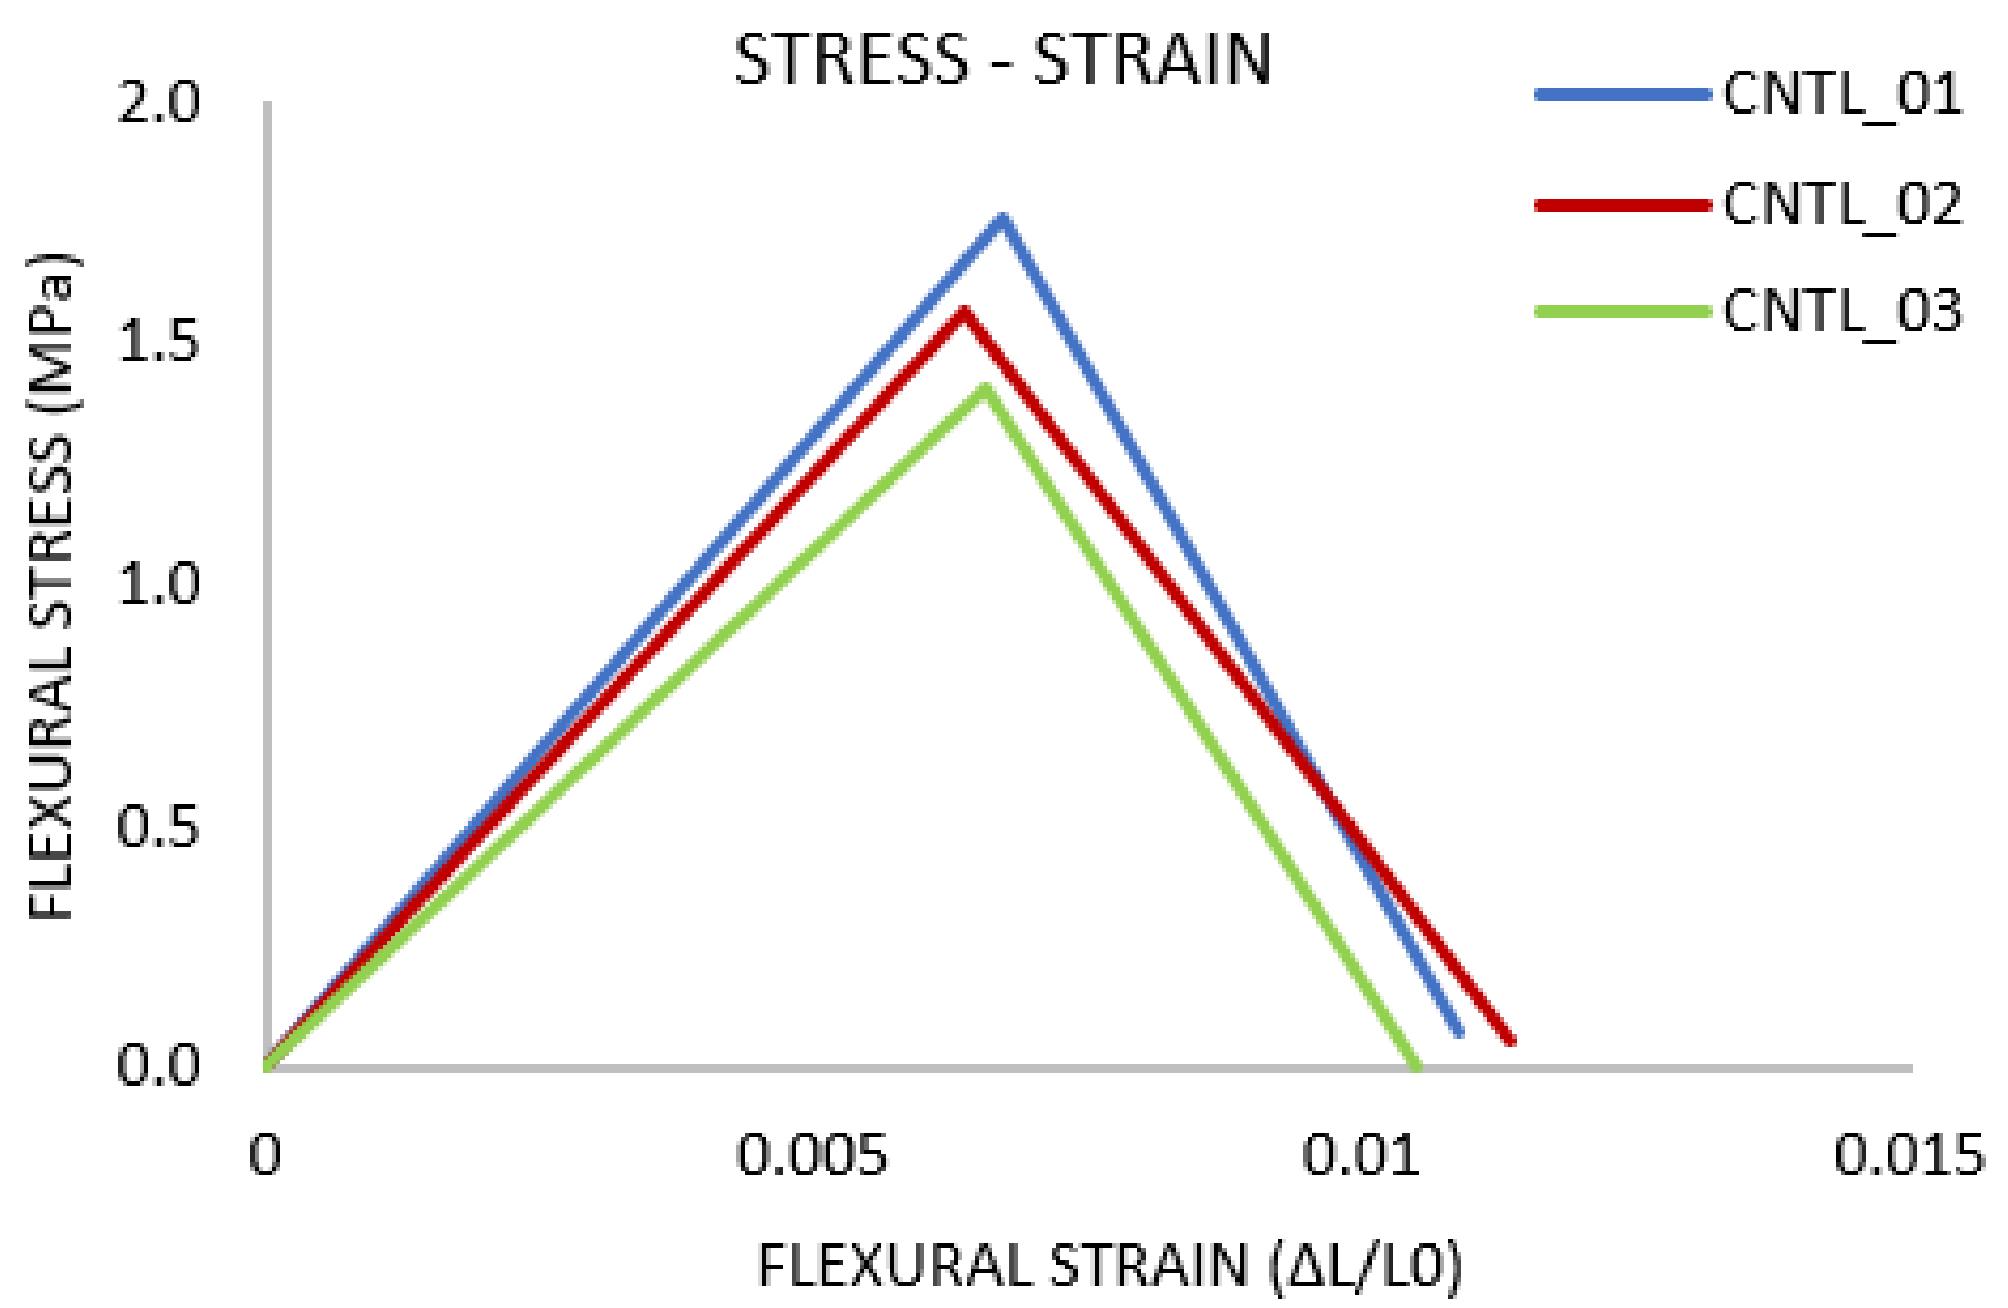
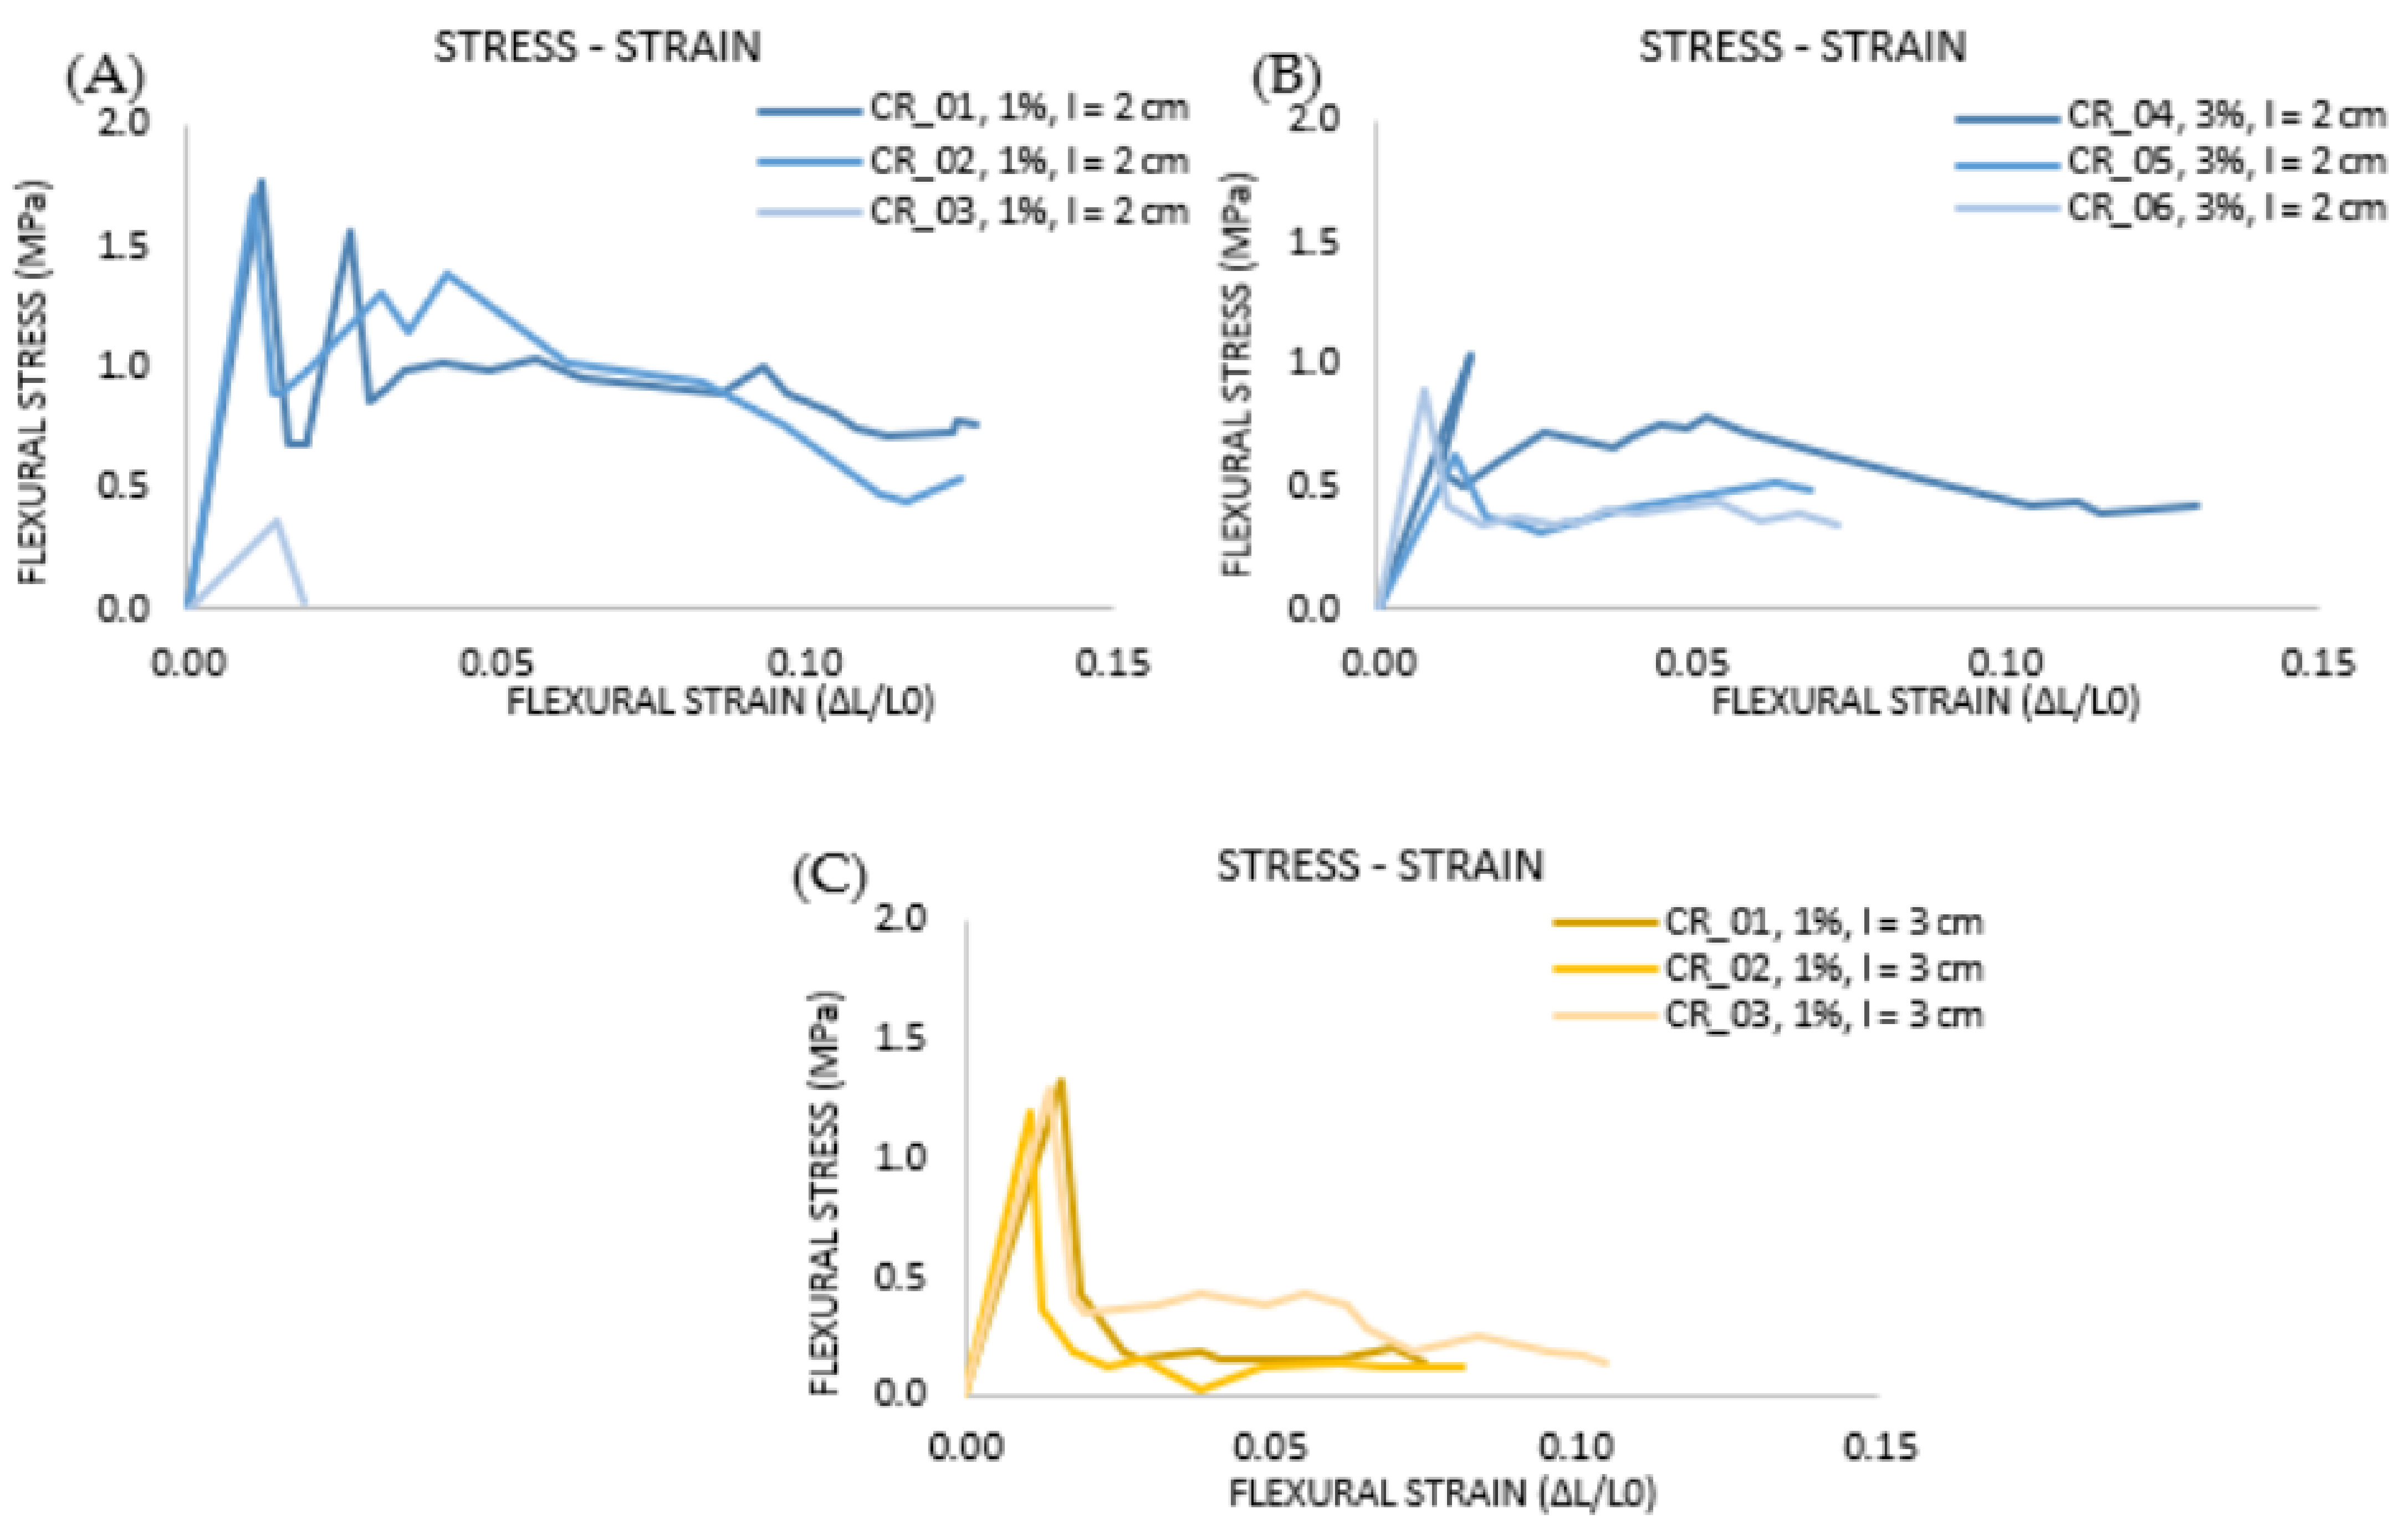
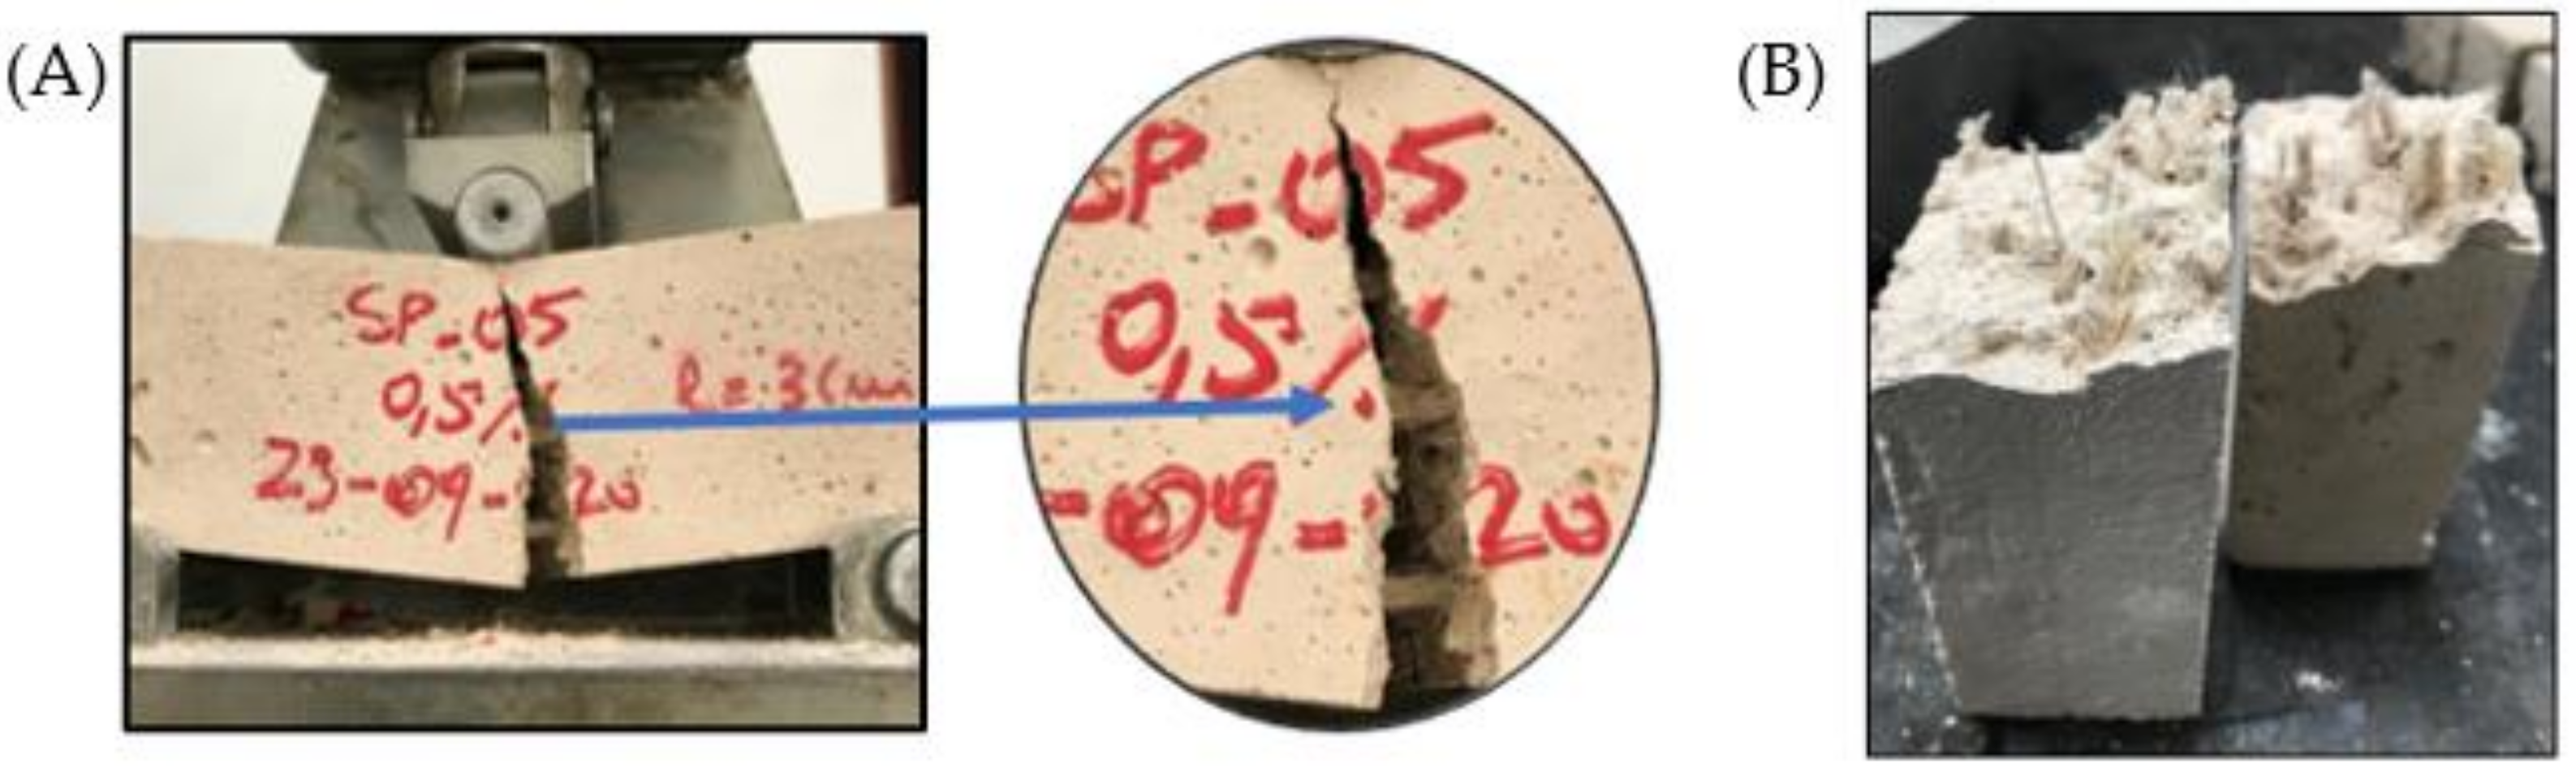
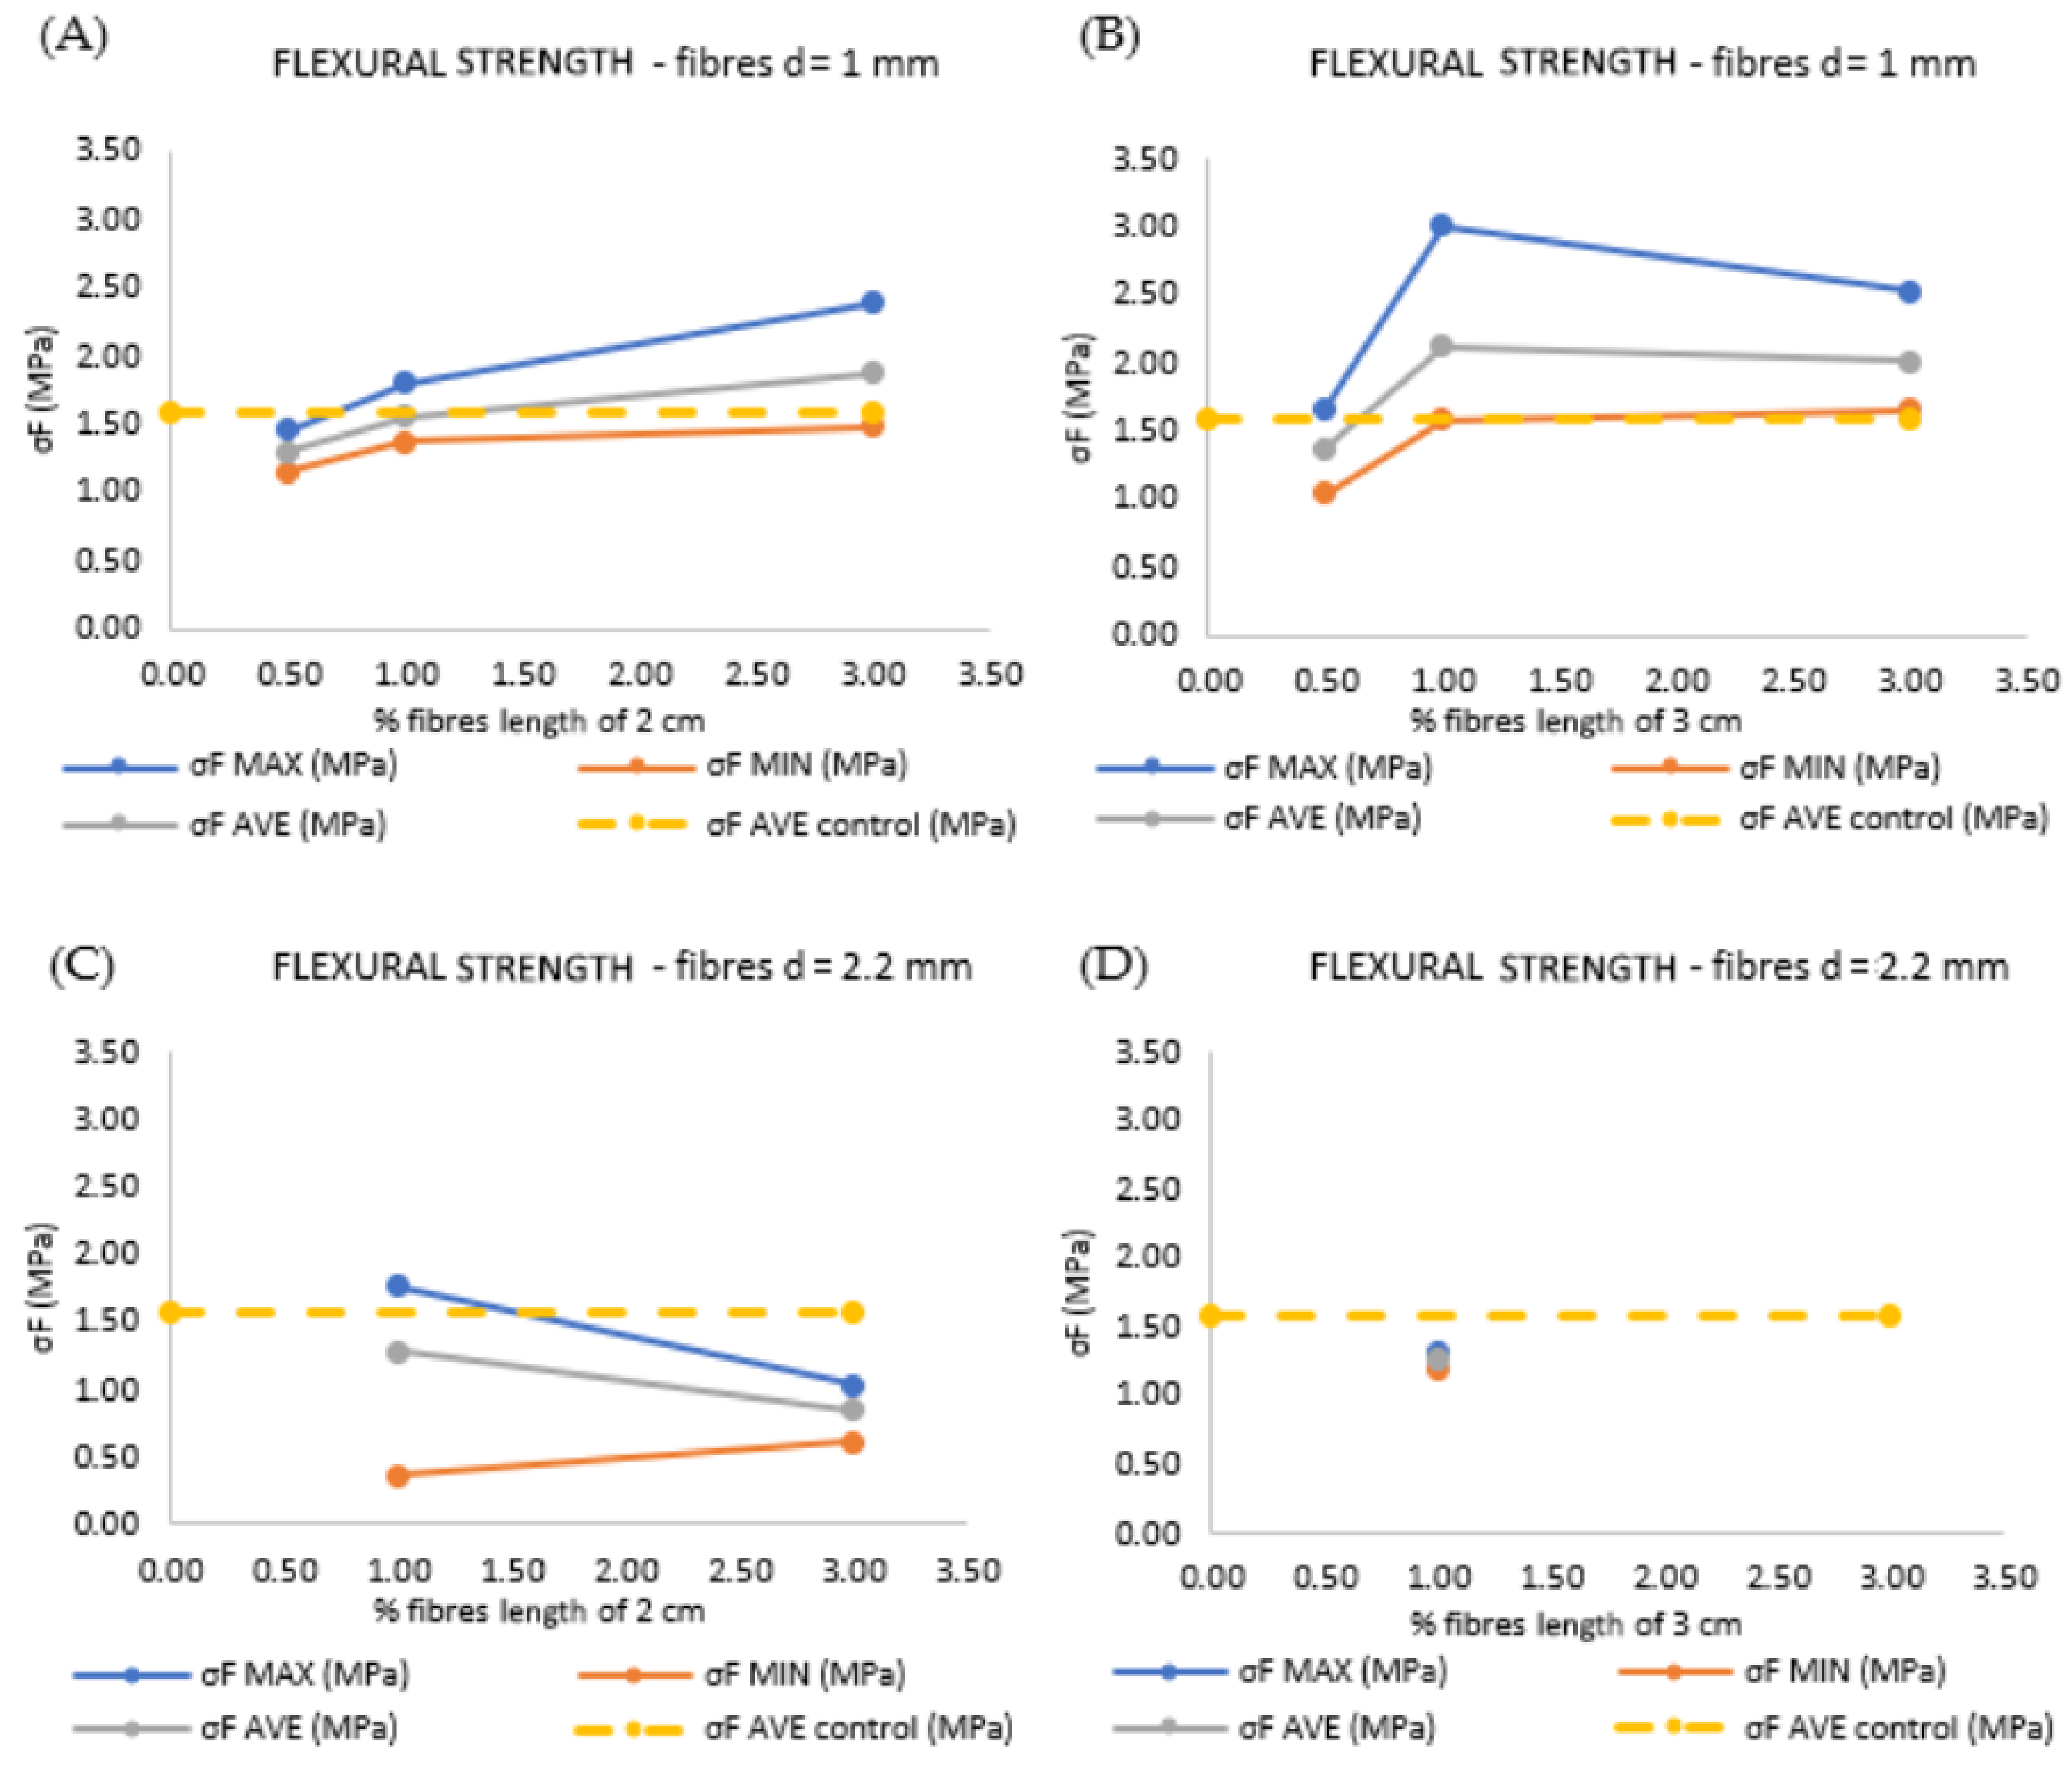
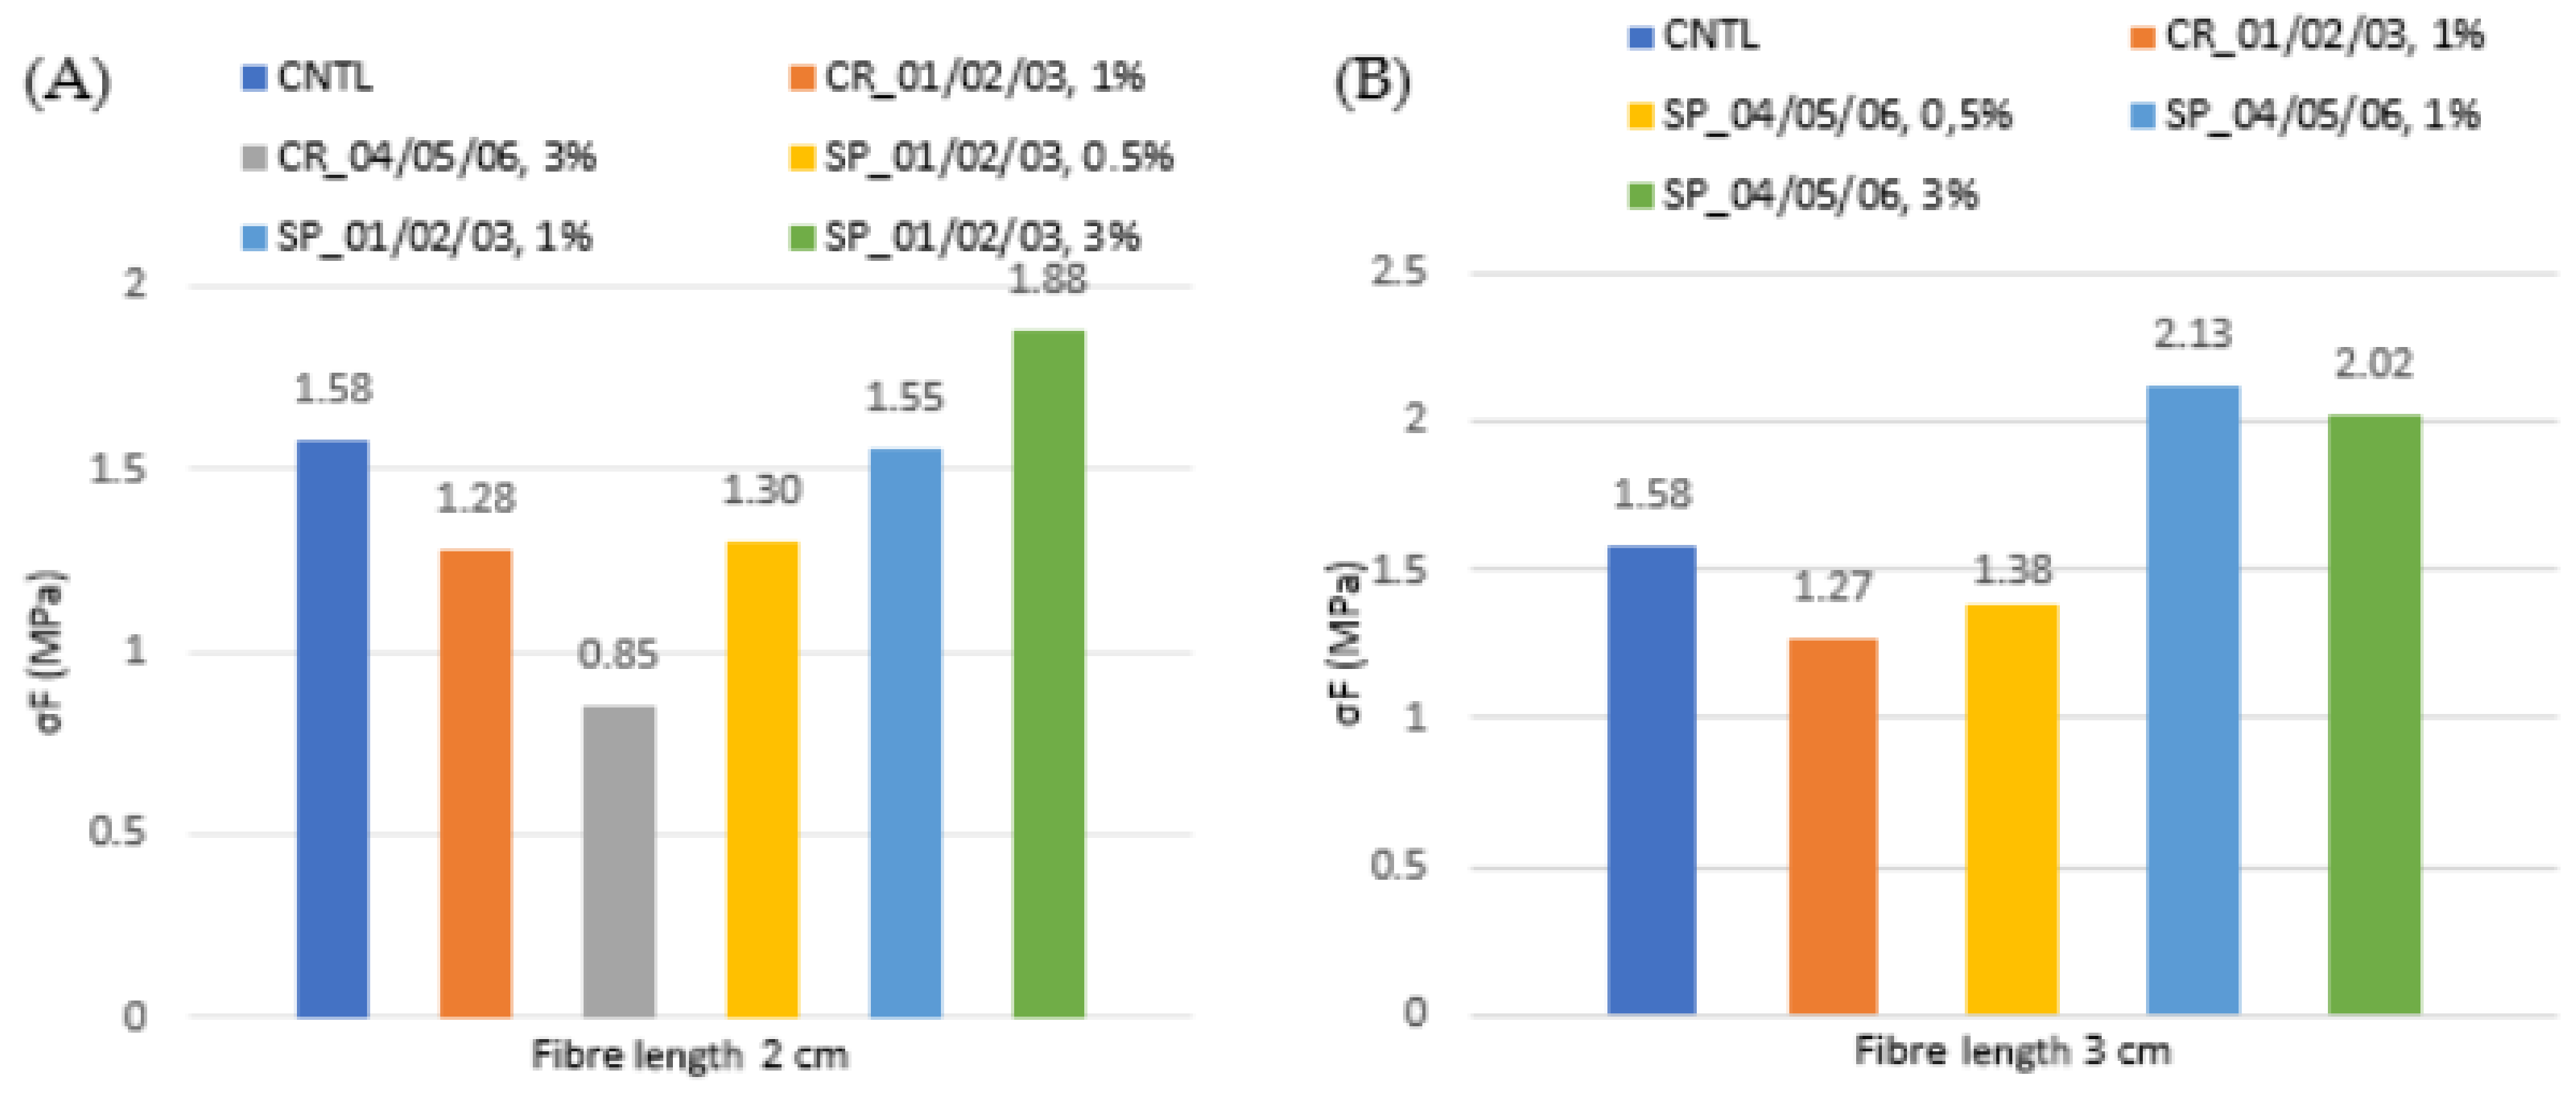
4.1. Bending Tests

After curing, the specimens are subjected to a three-points bending test, as regulated by the UNI-EN 772-1 [35] and UNI-EN 771-1 [36] standards for bricks. The test consists on the application of a concentrated load in the middle of the specimen, which is constrained at the extremities by two cylindrical supports (Figure 9). The distance between the support is equal to 100 mm and the specimen is perfectly centred inside the testing machine.
The mechanical tests are performed under displacement control using a 10 kN load cell with a speed of 0.05 mm/m. The test provides values for the load F and the relative displacement δ. The flexural strength, in accordance with the diagram showed in Figure 10, Figure 11 and Figure 12, is given by the following equation:
f cf = 3 · F · L 2 · d 1 · d 2 2
where: f cf = tensile failure strength due to bending, F   = maximum applied load, L   = distance between supports, d 1 = specimen base, d 2 = specimen height. The results for all the tested specimens are reported in Table 8 and Table 9.
The stress–strain diagrams (σ–ε) are reported for control samples and specimens supplemented with hemp fibres in Figure 10,Figure 11,Figure 12.
The specimens reinforced with hemp braids show response curves similar to those of control specimens, with the formation of an initial crack coinciding with the material breakage and, subsequently, with the drop of resistance (Figure 13). After the first crack in the fibre-reinforced specimens, a stitching effect is exerted by the braids arranged close to the crack. These counteract the lesion widening, resulting in the improvement of resistance values.
To compare the results of the bending tests on the fibre-reinforced lime mortar with those on the standard specimens, the trends of the maximum, minimum and average stresses of the reinforced specimens are reported for different fibre percentages, diameters and lengths of the analysed hemp braids (Figure 14).
In conclusion, the flexural strength increases with the addition of hemp braids with a diameter of 1 mm and a length between 20 and 30 mm, at percentages of 1% and 3%. Instead, when the braid diameter increases to 2.2 mm, there is a tension decay as the percentage of fibre increases, which is in any case lower than the flexural strength of the control samples. Histograms in Figure 15 show the average values of bending resistance for both investigated lengths of braids. From these results it is obtained that braids with length of 2 cm provide a mean bending stress decrease of about 13% in comparison to that of the control specimen. On the contrary, braids with length of 3 cm give an increase of the mean bending stress of about 8% with respect to the control specimen one.

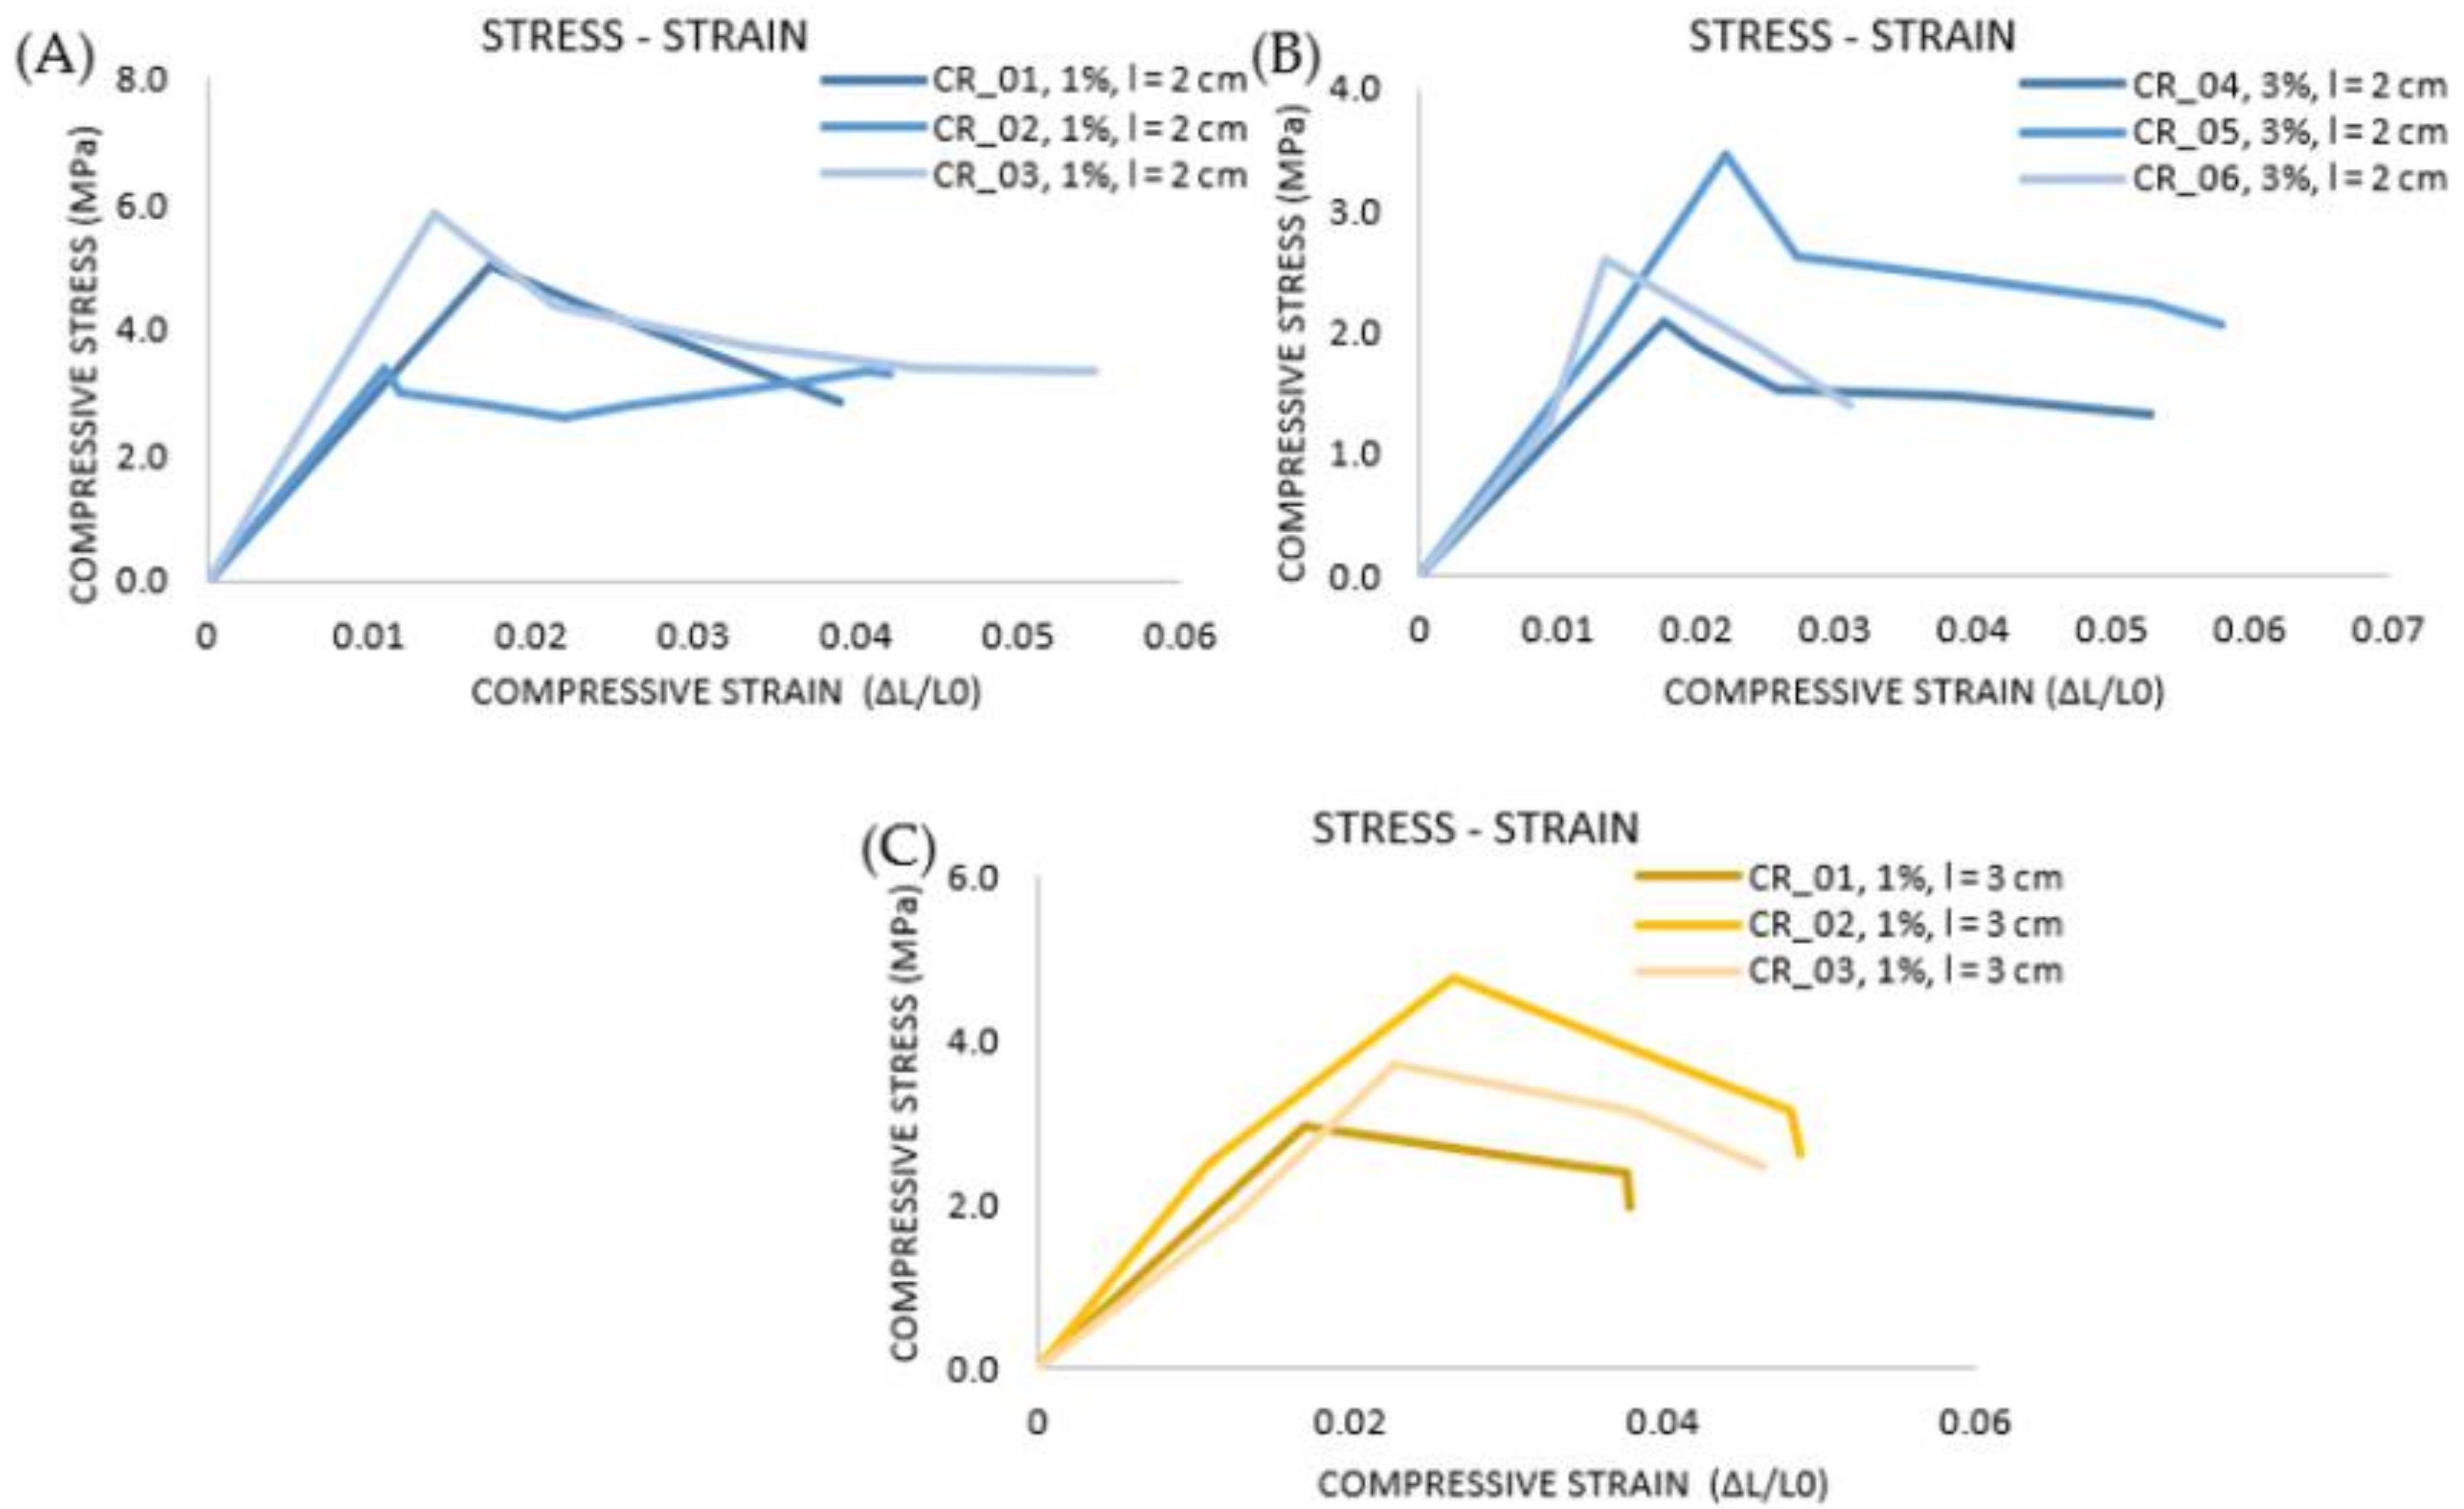
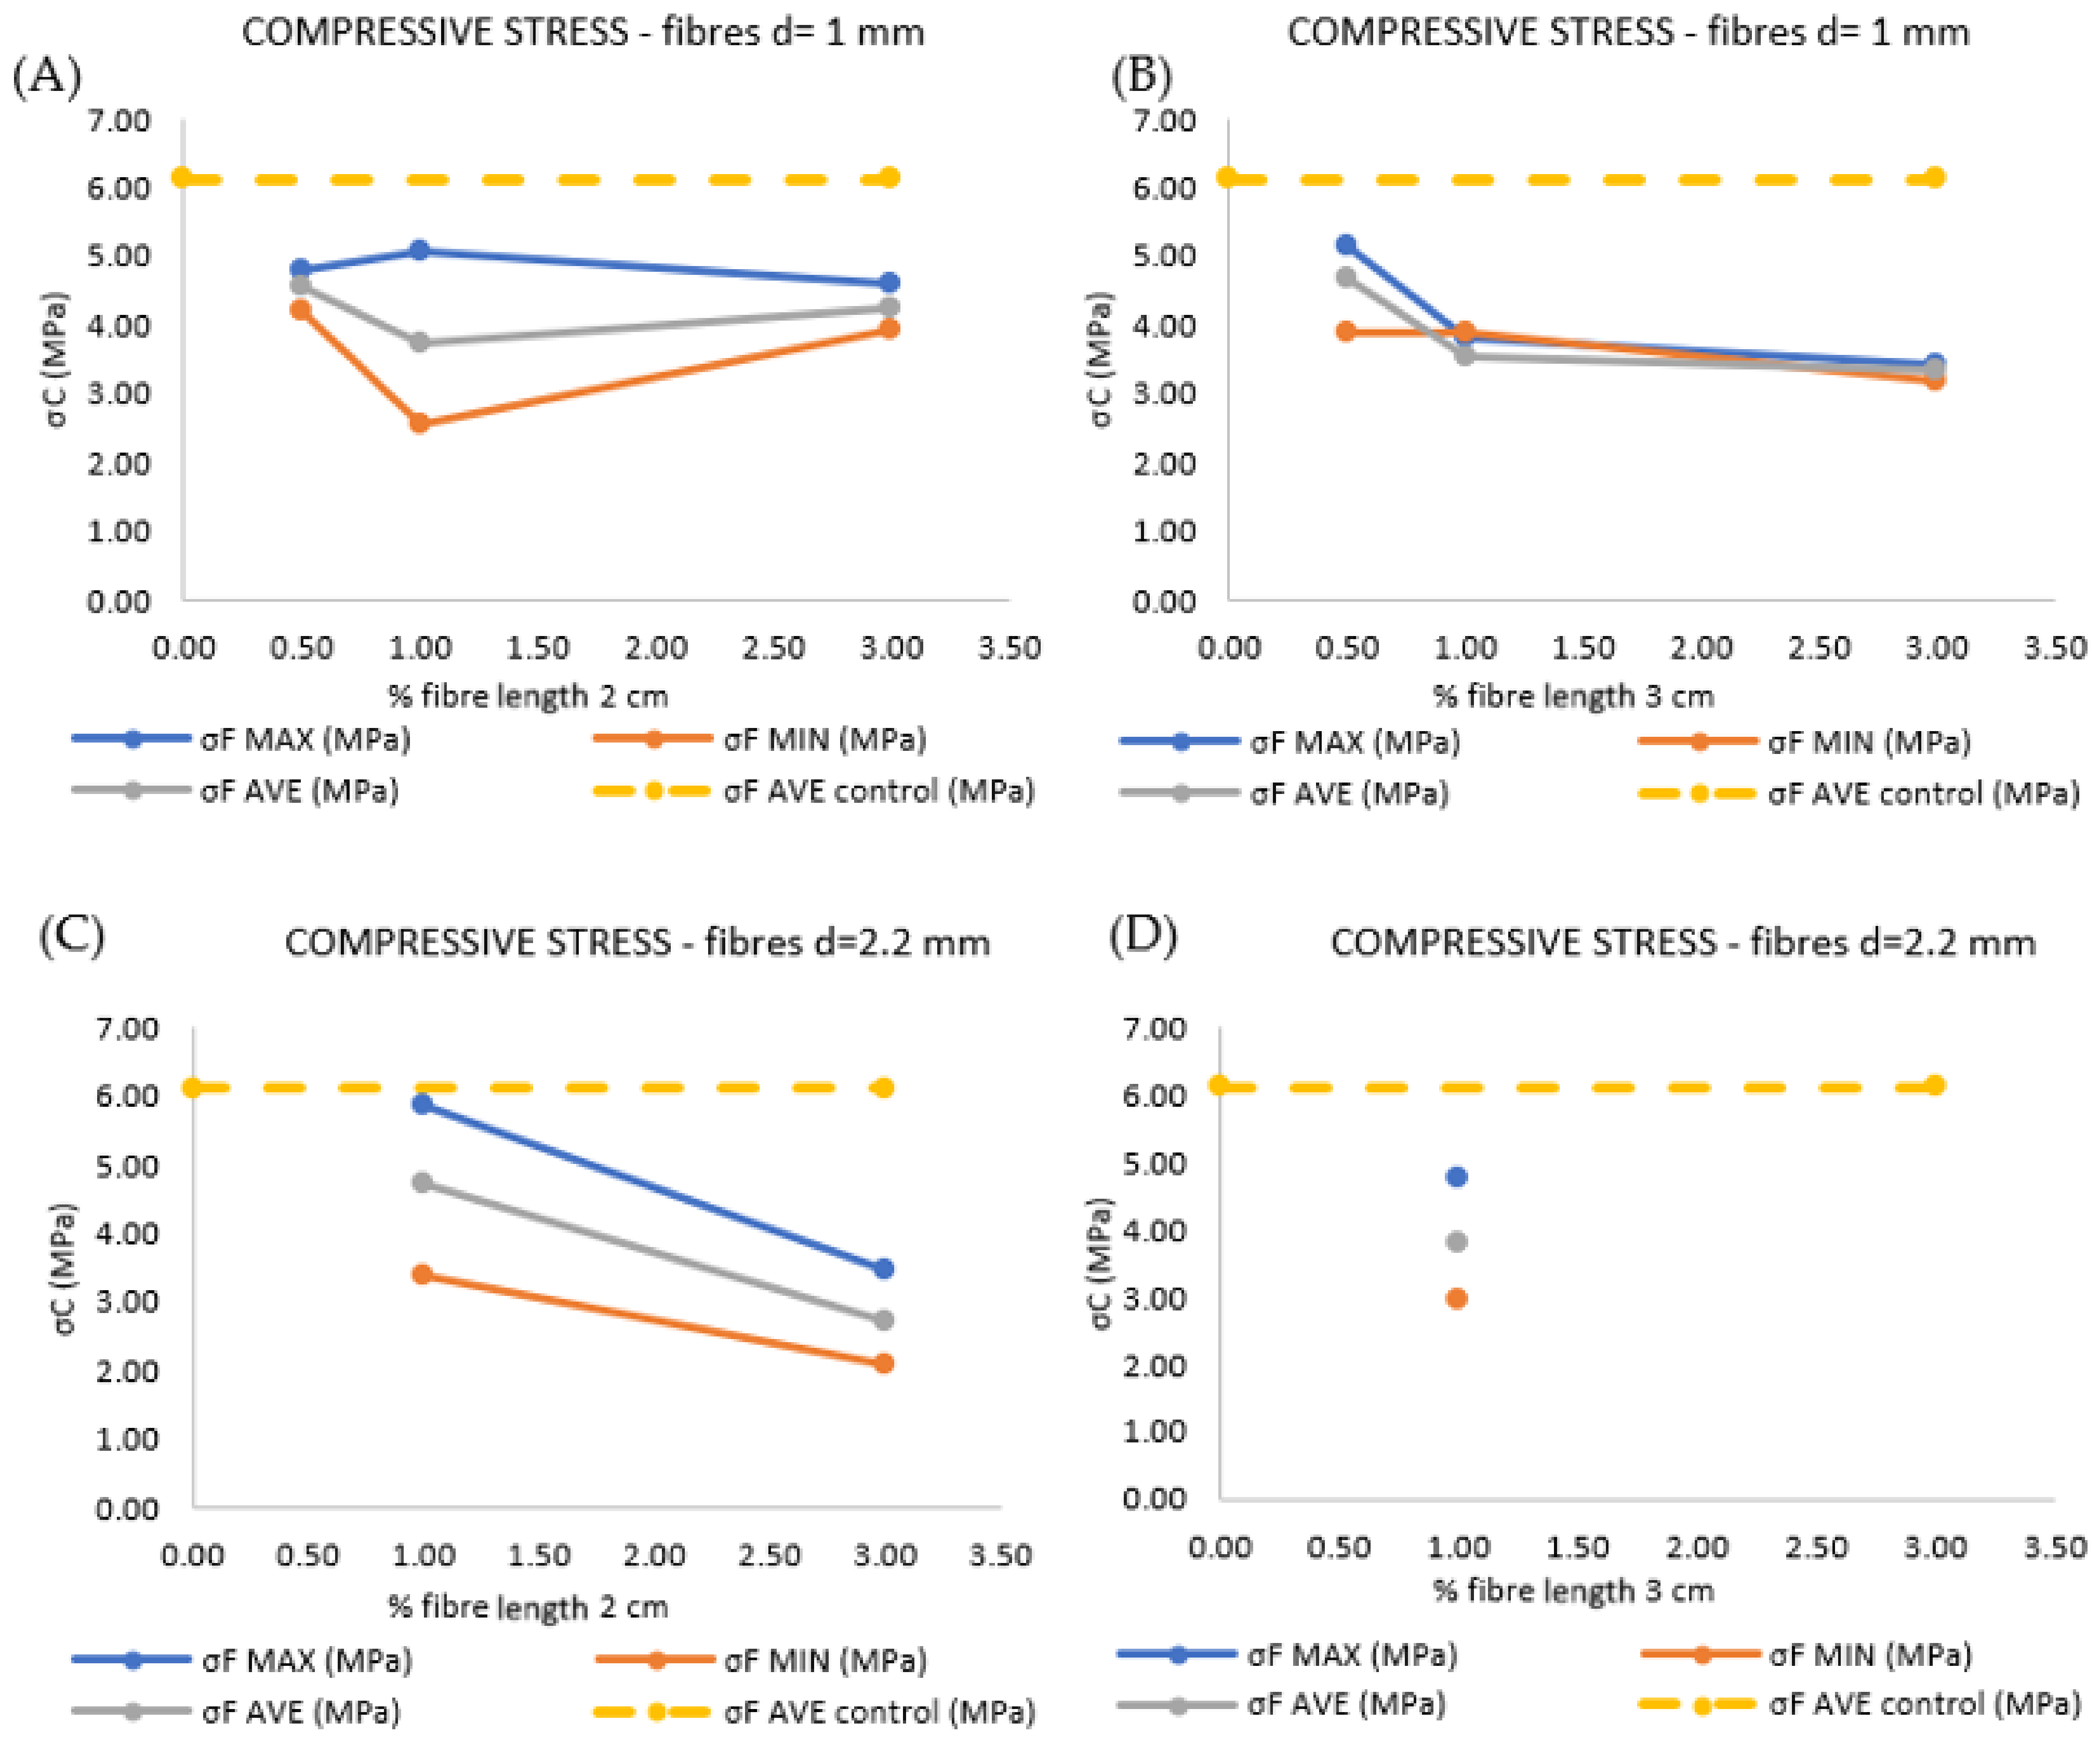
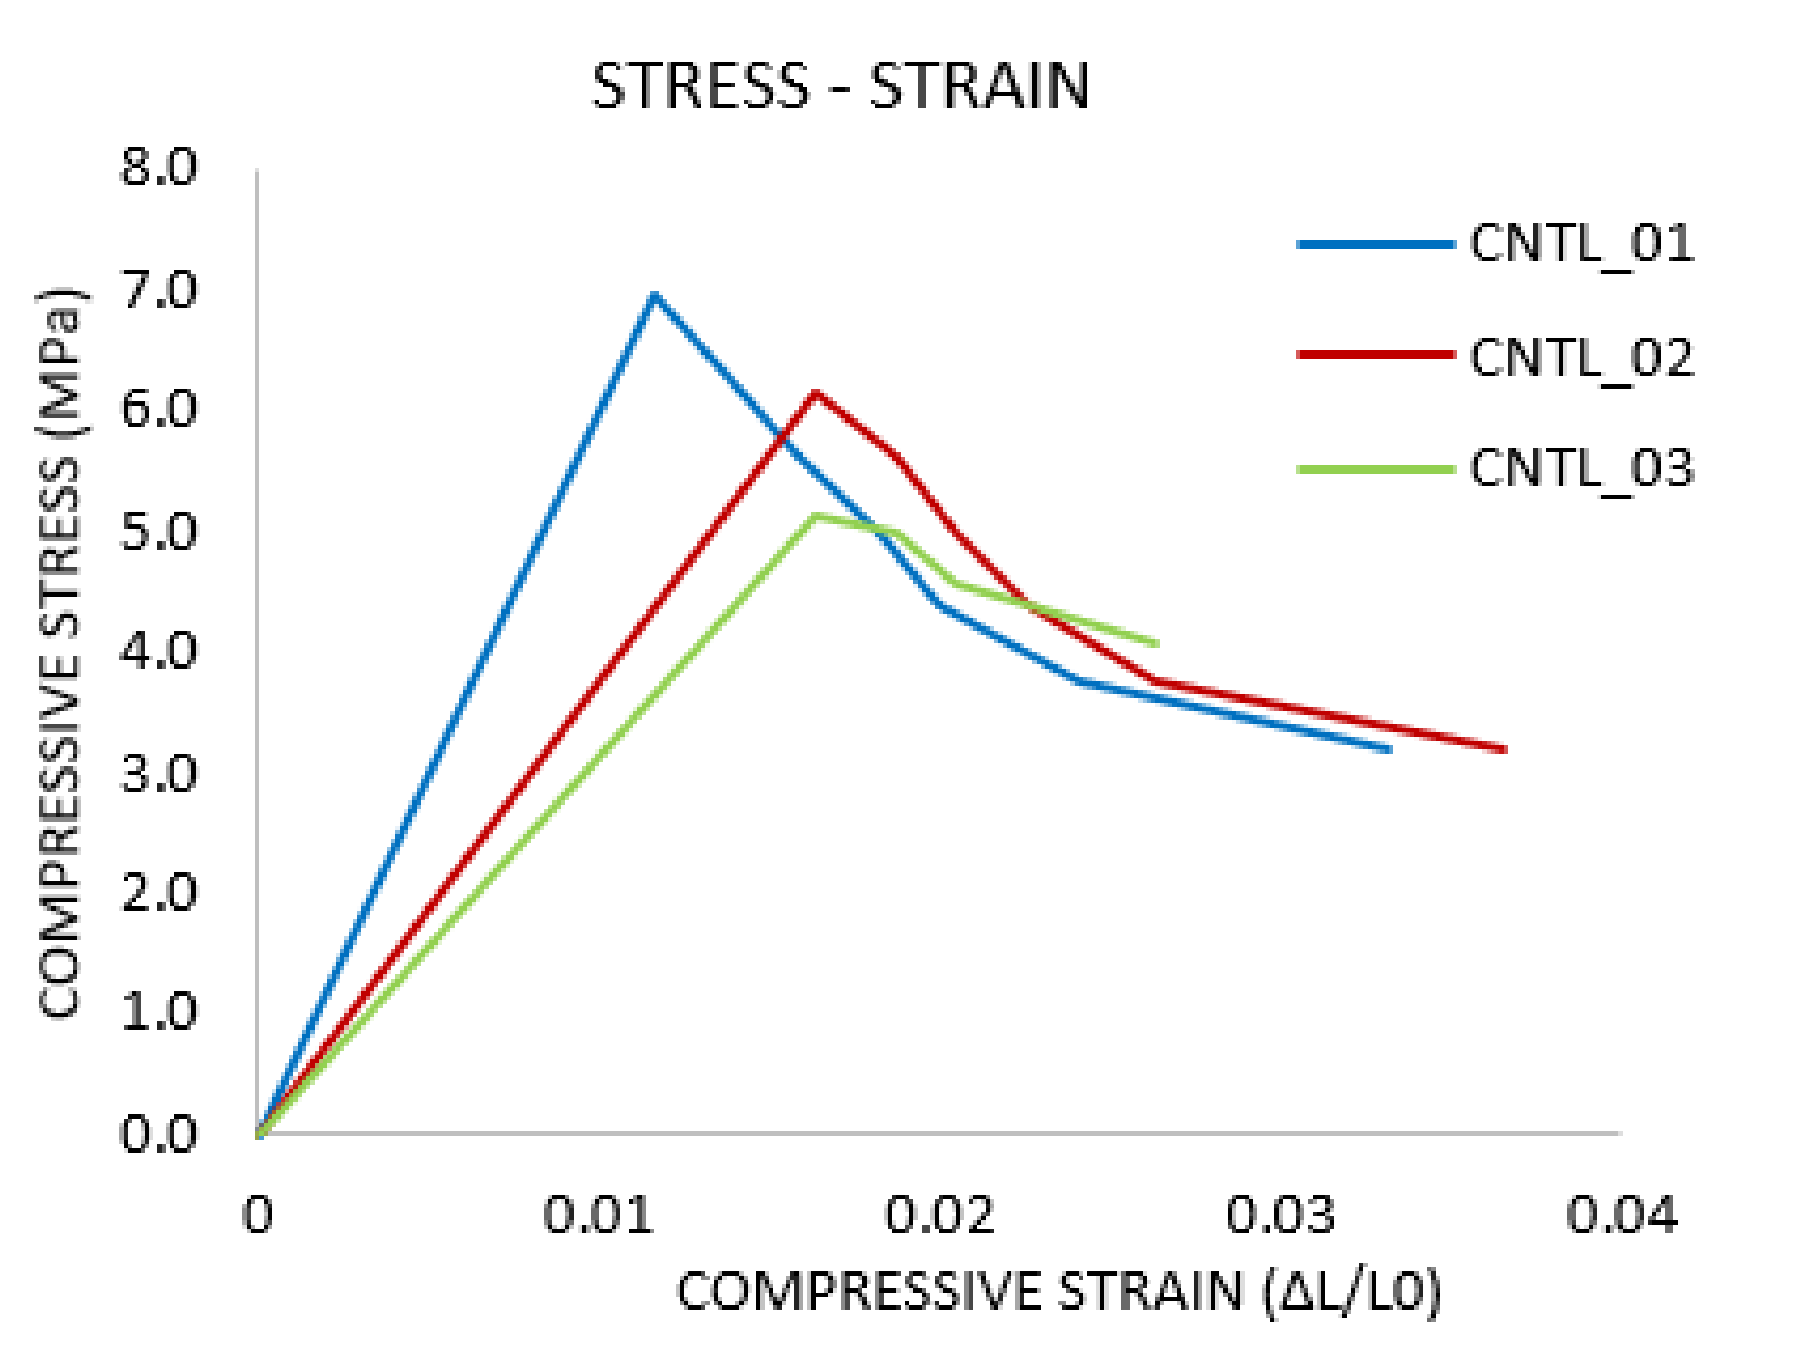
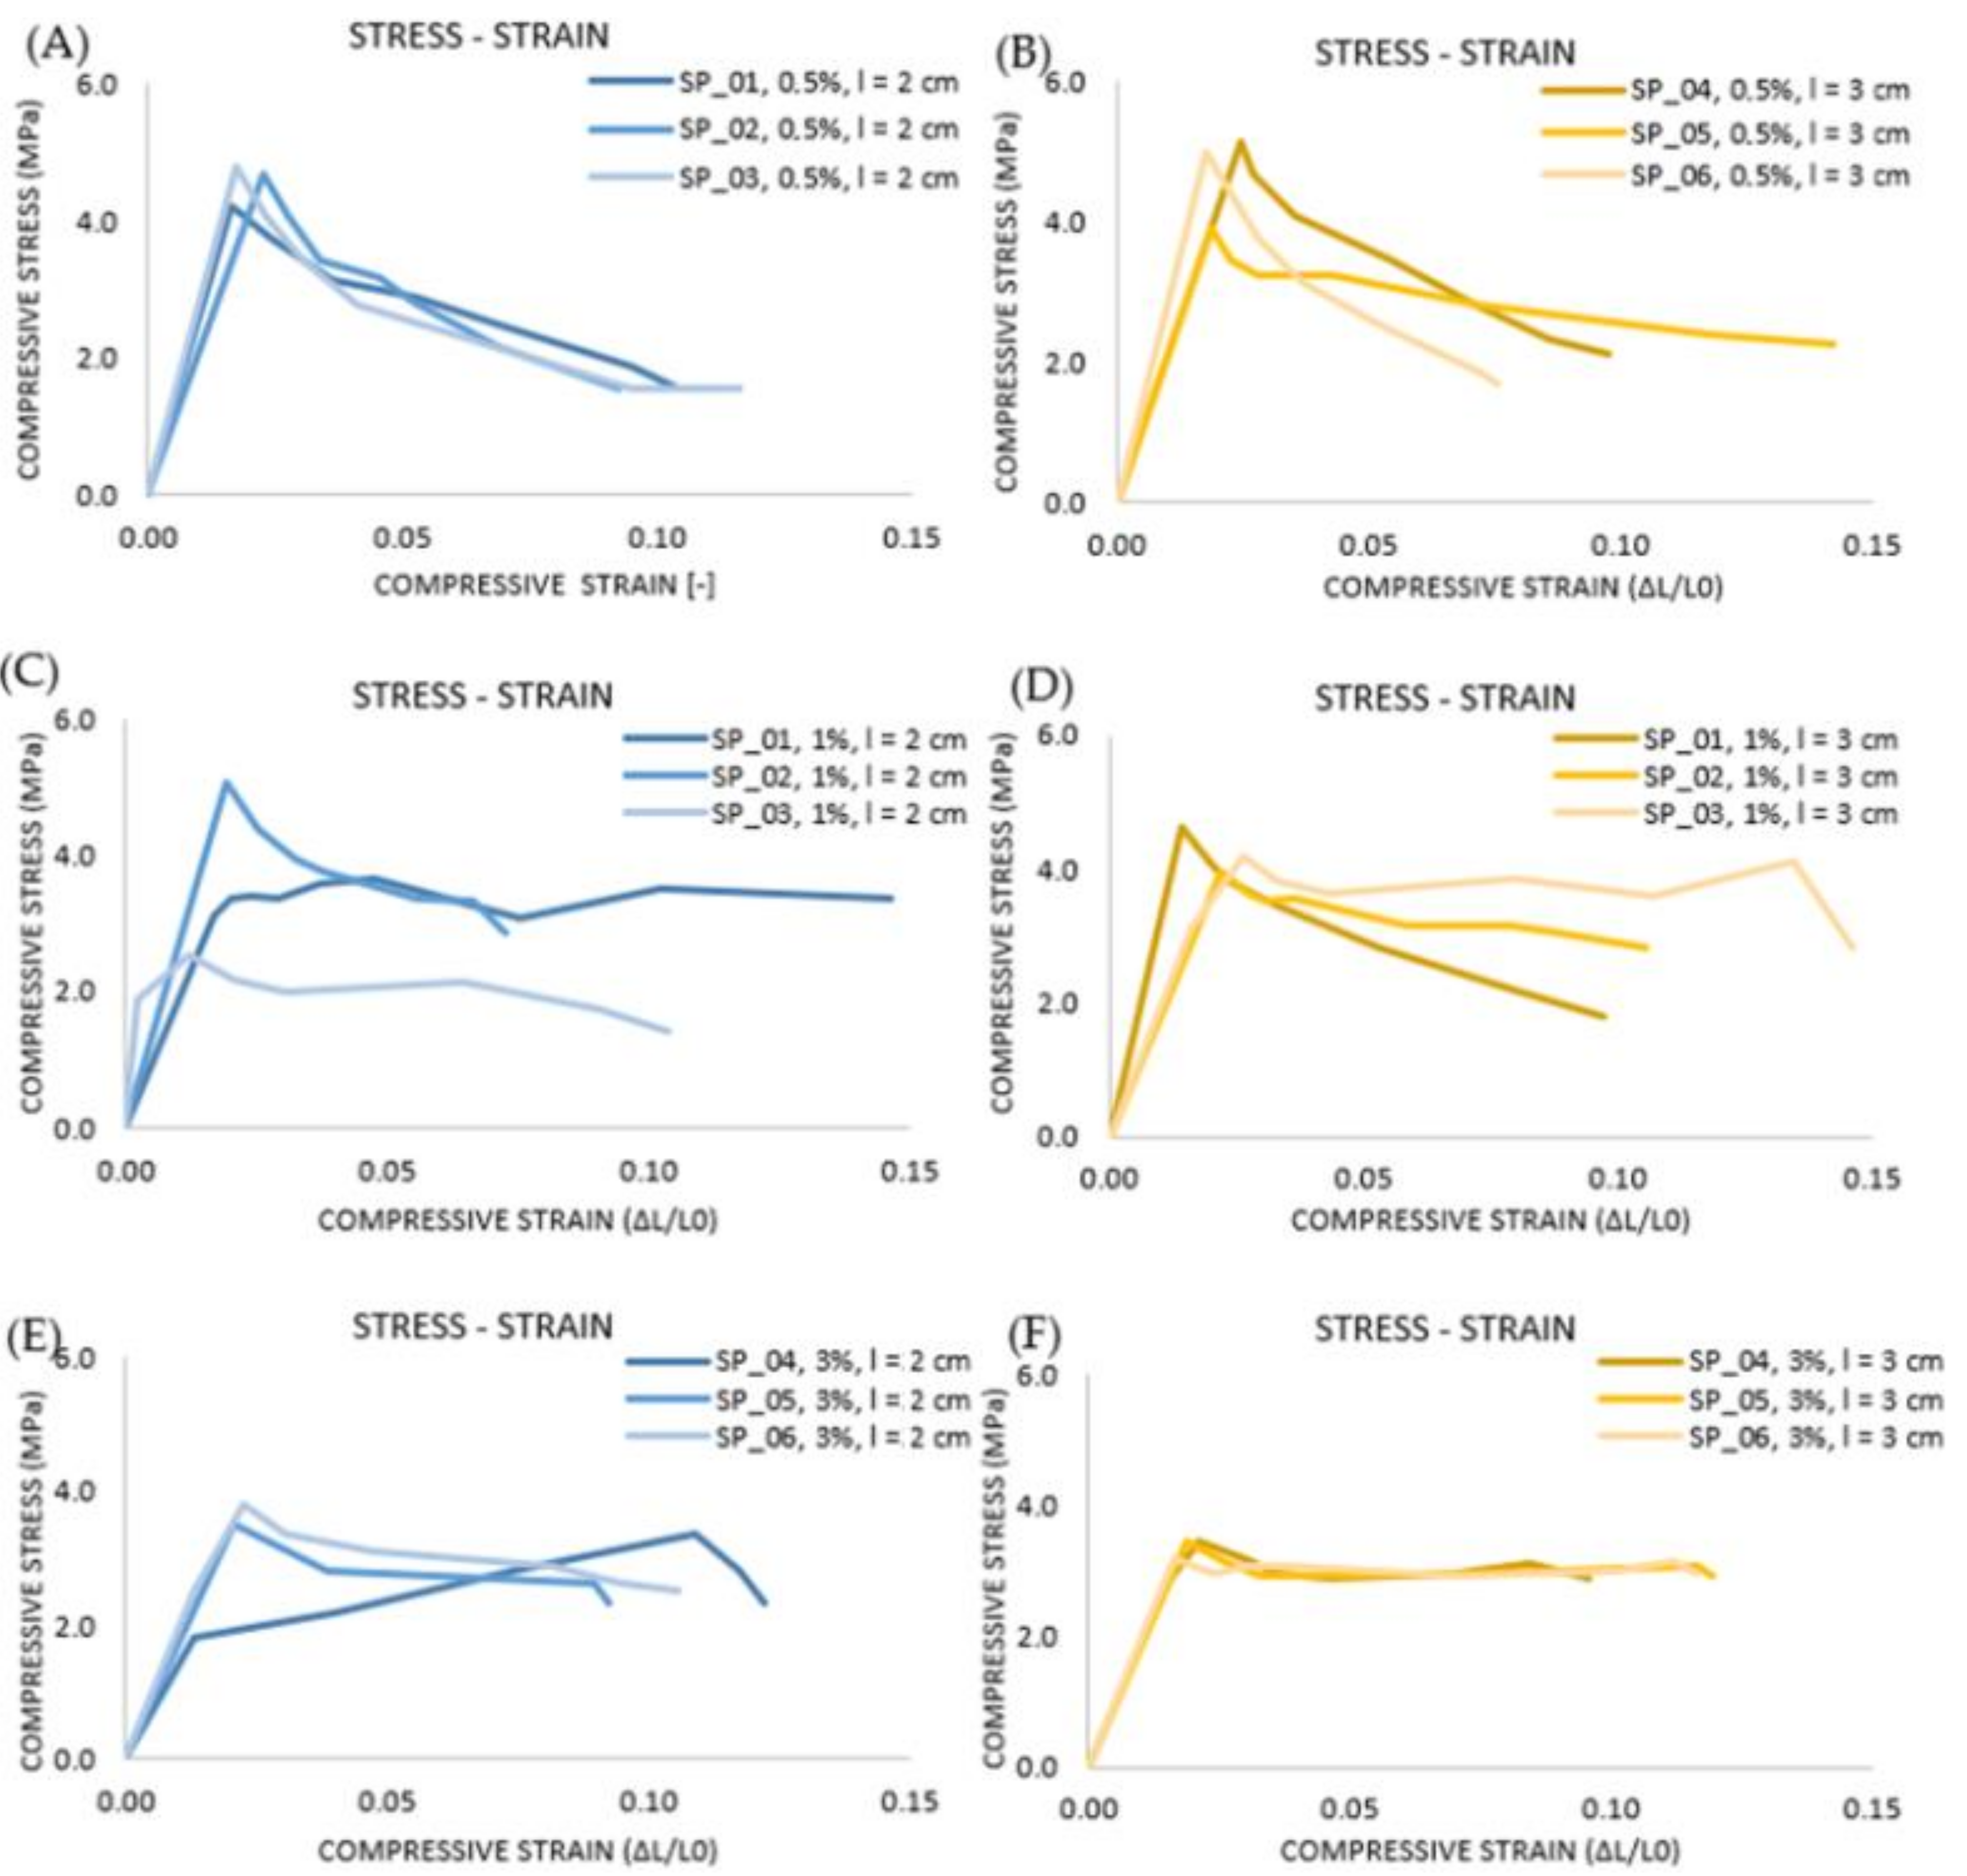
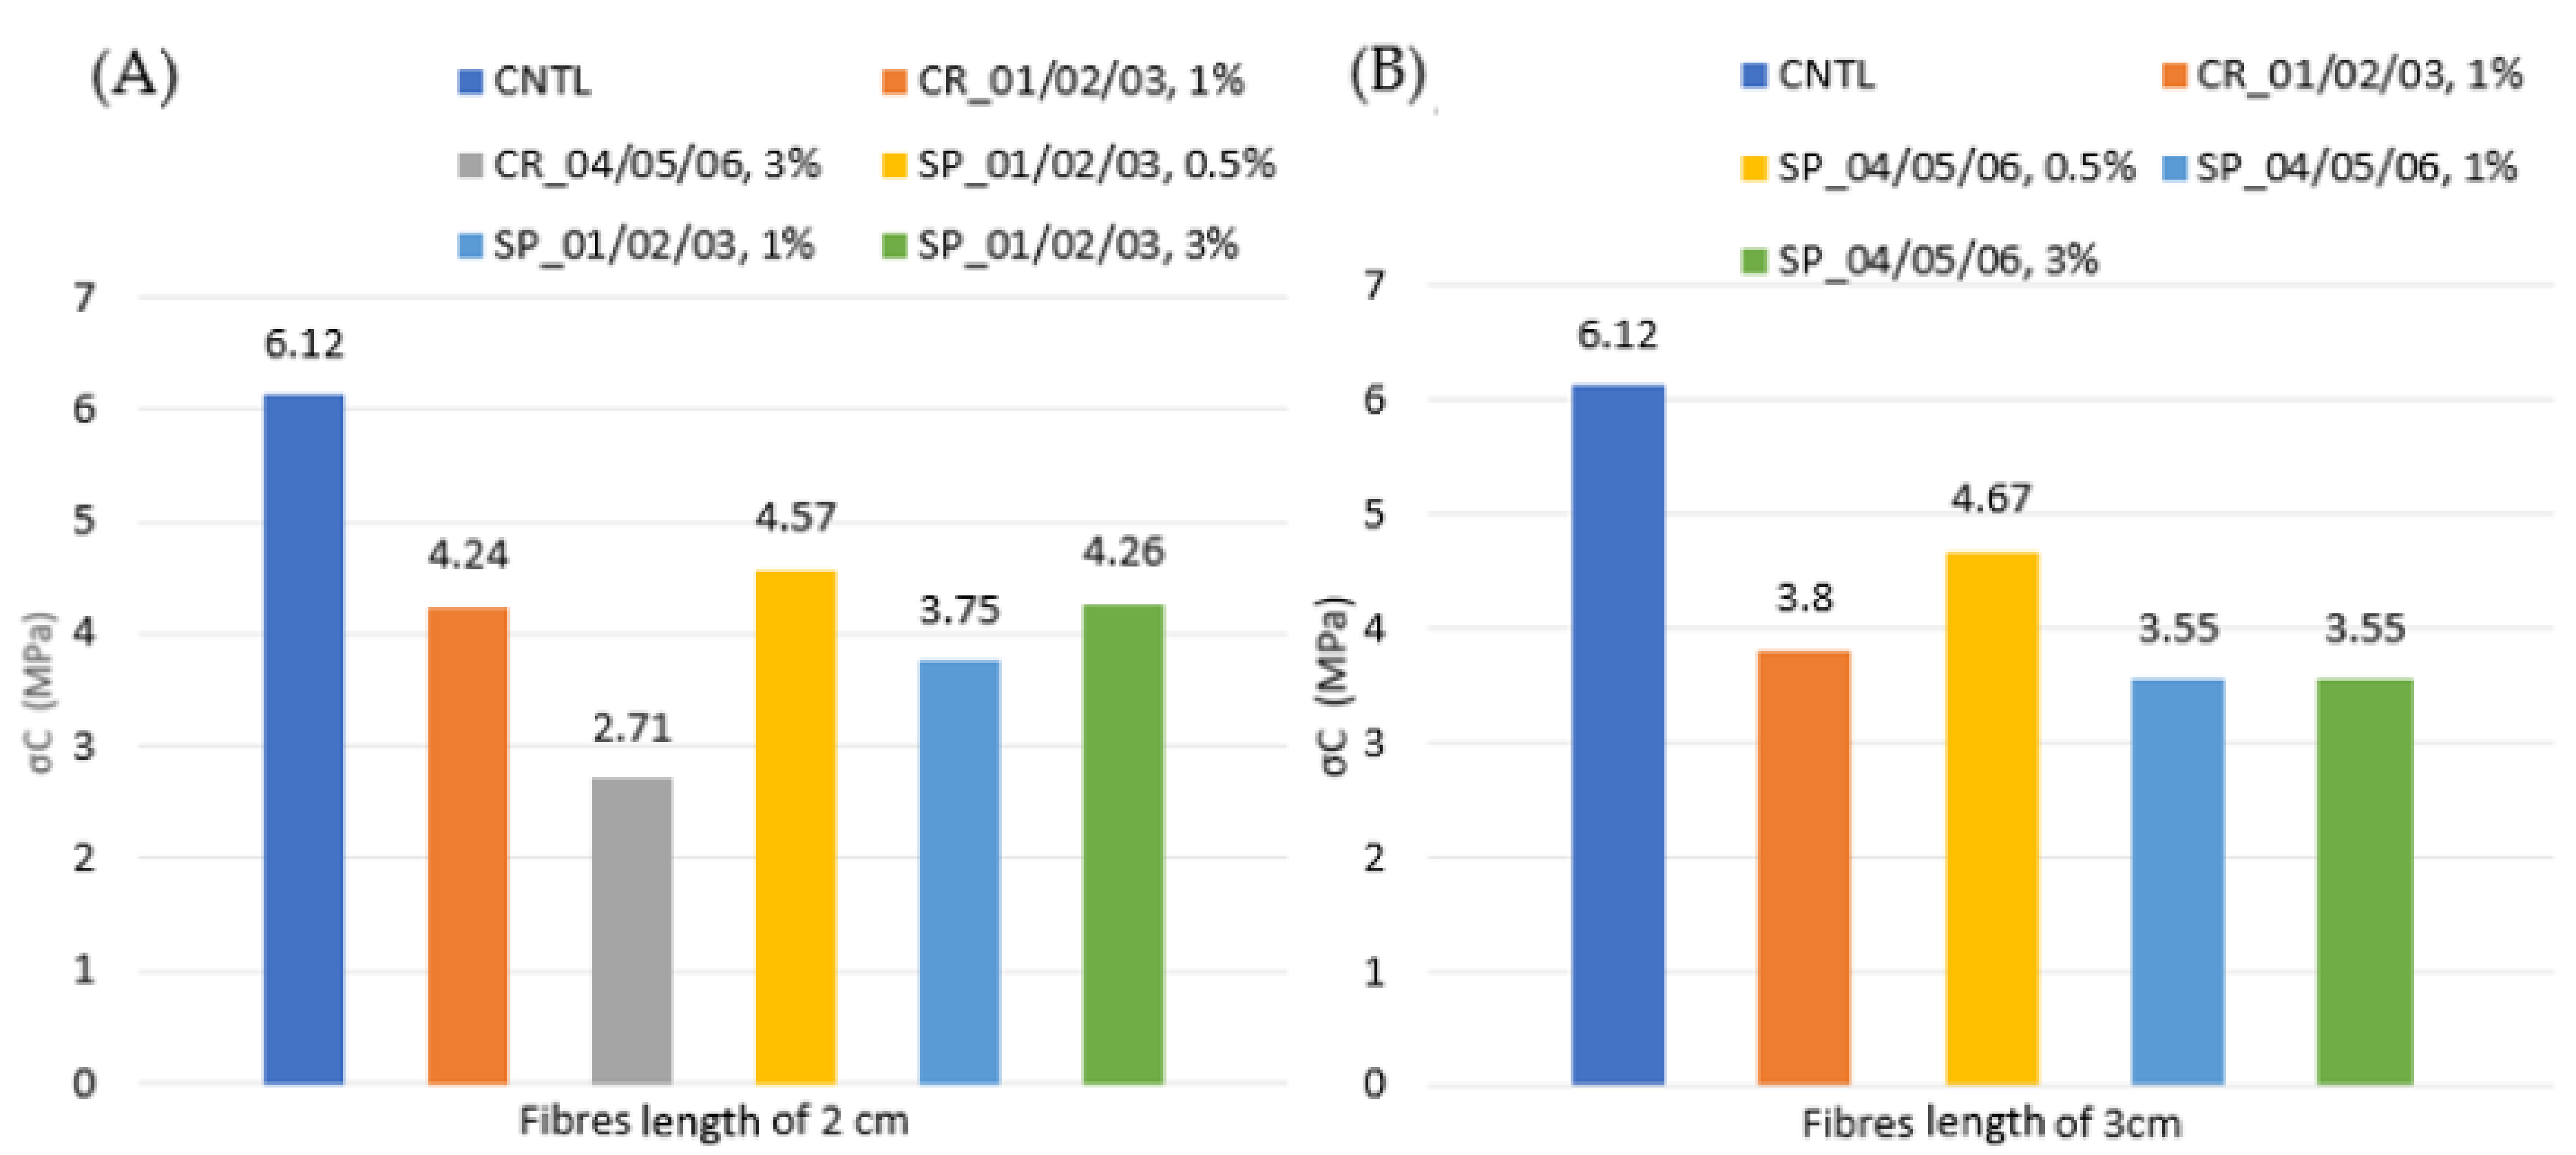
4.2. Compressive Tests

The compressive tests are performed on all the specimens, including the two halves resulting from the breaking of those subjected to bending tests. The results are illustrated in Table 10 and Table 11.
The stress strain diagrams for both for control and fibre-reinforced specimens are reported in Figure 16, Figure 17 and Figure 18.
The results of the compressive tests on the fibre-reinforced mortar are compared with those of the standard specimens. The graphs in Figure 19 show the trendsA of the maximum, minimum and average stresses of the reinforced specimens as the percentage of fibre increases for each diameter and length of analysed braids. The average compressive strength for both investigated braid lengths is compared considering the two different diameters (1 mm and 2.2 mm). It is apparent that for both fibre lengths and both diameters the compressive stress decreases as the fibre percentage increases. This trend is more marked for fibres with diameter of 2.2 mm and length of 3 cm. Therefore, the best performances are achieved with fibres having diameter of 1 mm and length of 2 cm. Histograms in Figure 20 show the average values of compressive strength for both investigated lengths of braids. From these pictures it is evident that with both lengths of fibres the reduction of the average compressive stress with respect to the control specimen one is almost the same (about 36%).

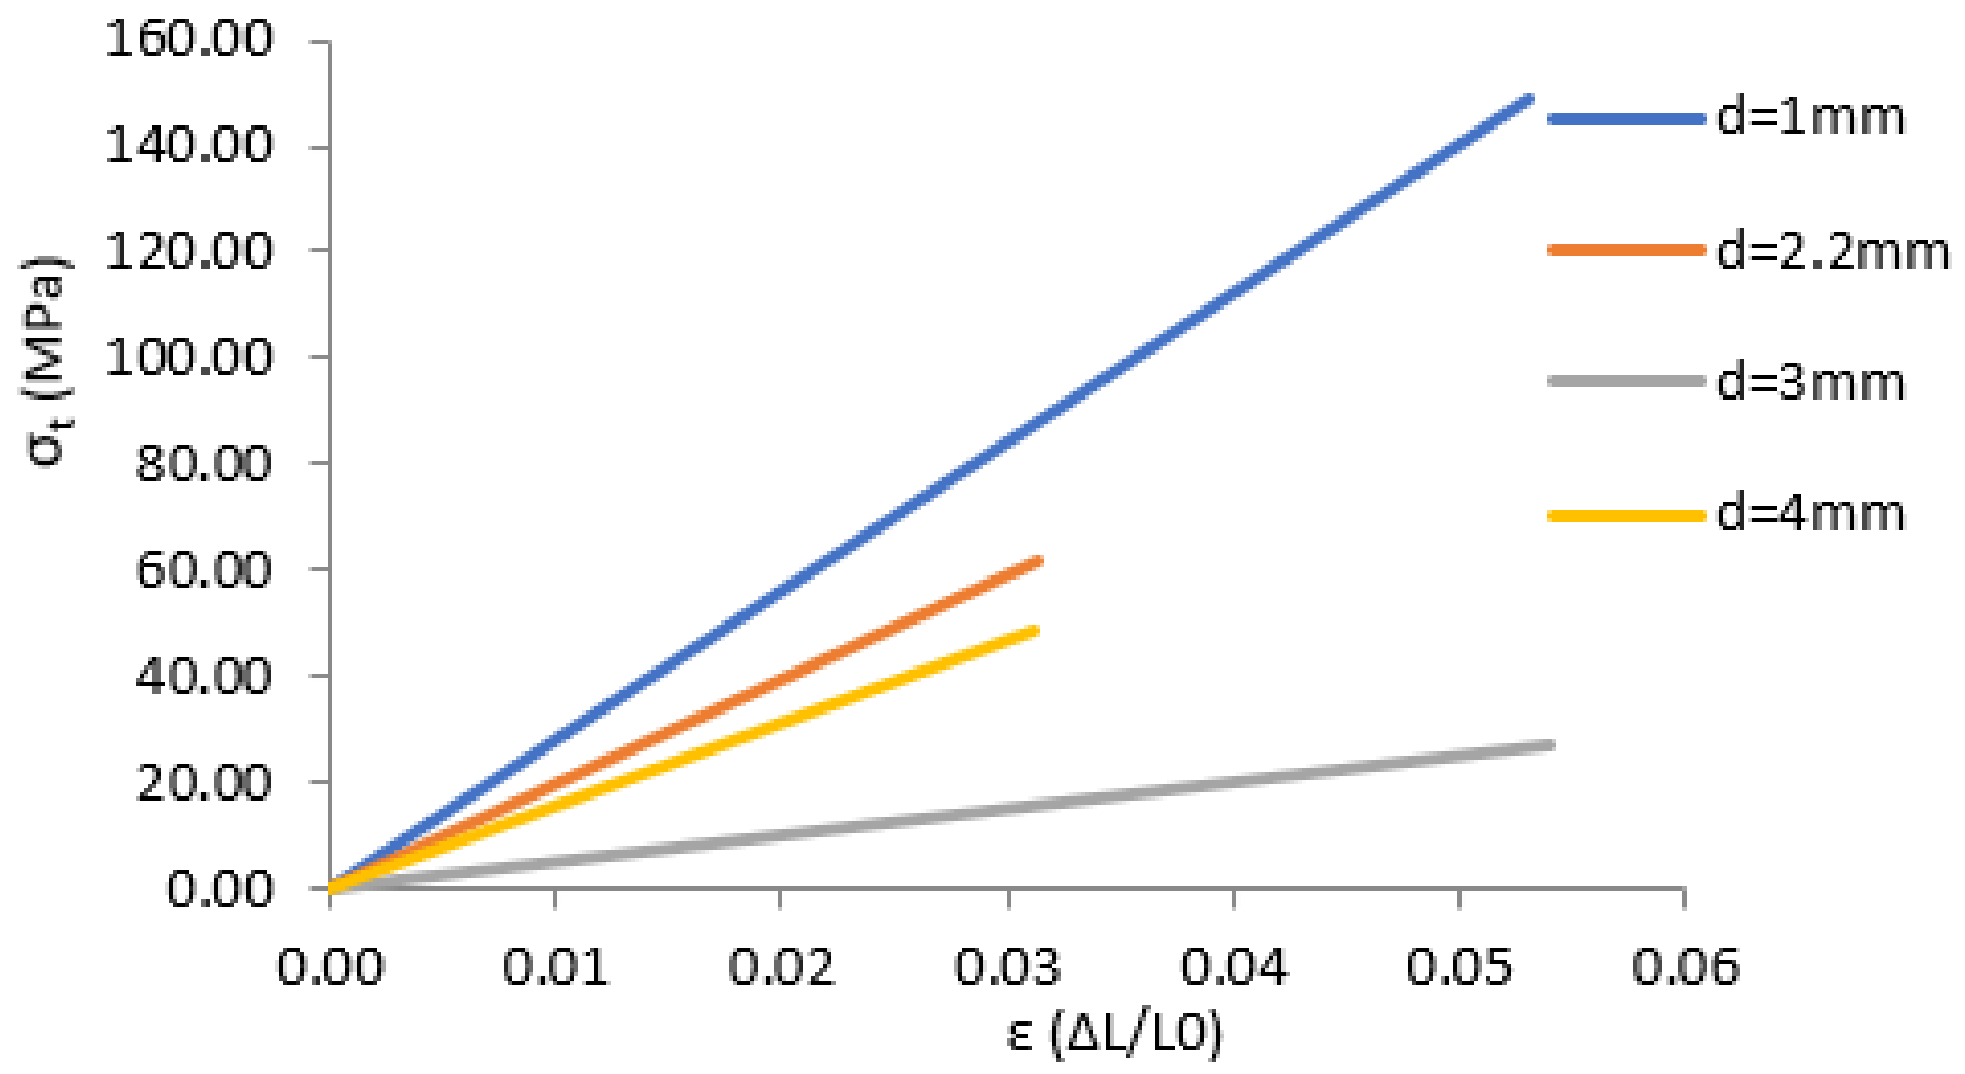
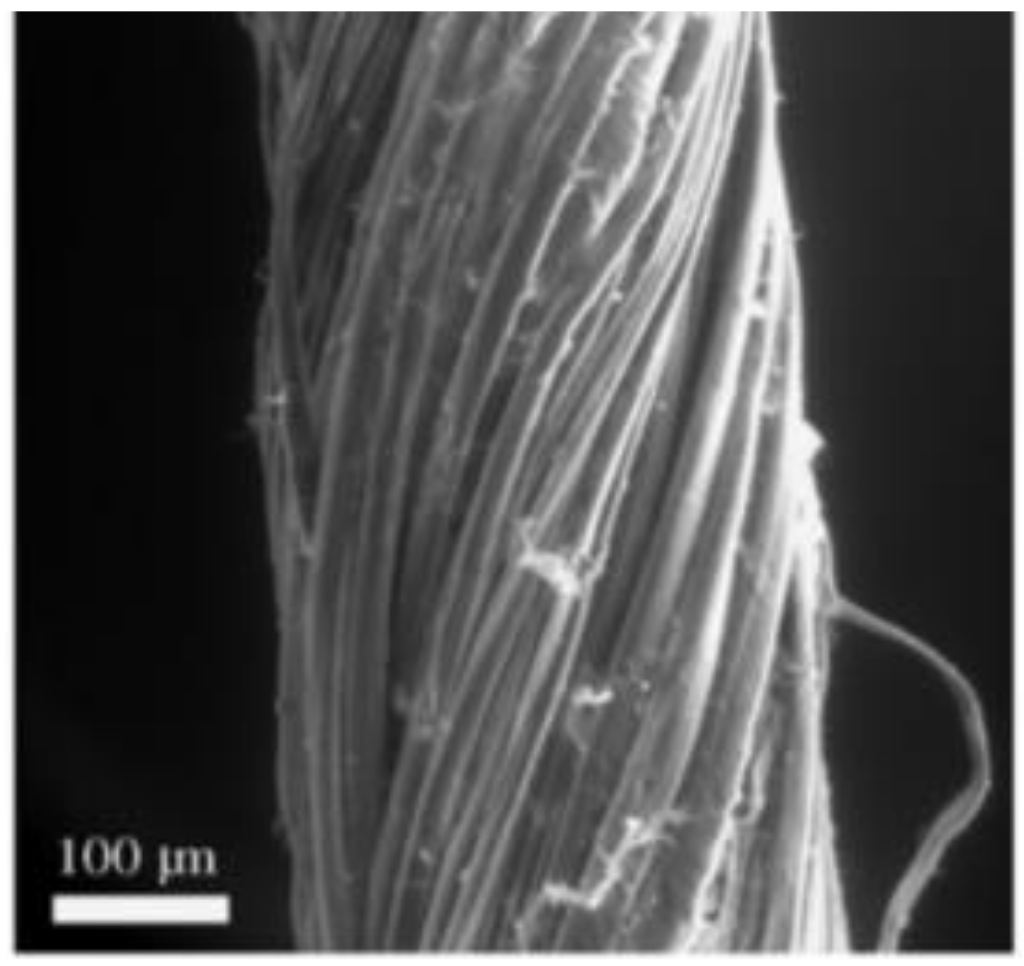
5. Tensile Tests on Hemp Braids

Braid filaments are made up of single fibres intertwined in a helical structure (Figure 21). This structure is a particular characteristic of hemp, which improves the resistance to shear compared to that of synthetic fibres, such as bundles of glass fibres.
A unidirectional tensile test is performed on braids with four different diameters (4 mm, 3 mm, 2.2 mm and 1 mm) for a total of 12 samples (3 for each diameter) by means of a universal machine with displacement control (Figure 22). The samples are made of braids with a length of 70 cm. Out of these, 50 cm represents the reference length, which is subjected to the elongation, and 10 cm at each extremity are necessary for anchoring to the testing machine.
Table 12 summarizes the tensile test results and Figure 23 represents the stress–strain diagram with reference to the four analysed diameters.

6. Conclusions

The building industry has a major environmental impact, so the current scientific research trend is focused on the development of sustainable and renewable resources to replace polluting and nonrecyclable materials. Within this scenario, this research aims at developing a lime mortar premixed and reinforced with hemp fibres to obtain a high-quality biocomposite with suitable mechanical properties. In the perspective of future applications, this compound could represent an effective solution for the retrofitting of existing buildings.
The first goal of the research was to define an ideal composition of the biocompound. Therefore, the water absorption of the hemp braids was calculated to maintain the optimal water/lime ratio of the mortar, as indicated by the manufacturer. According to the performed tests, the braids absorbed, on average, a quantity of water equal to 1.5 times their weight. An in-depth study of the soaking of braids could be useful to improve the workability of the mixture. Concerning this parameter, the spreading tests revealed significant variations in the workability of the mixture, as the percentage of fibres (in terms of weight and diameter of the braids) in the mixture increases. It was found that for thicker braids (diameter of 2 mm), 1% of fibres in terms of premixed weight represents the best percentage. However, for thinner strings (diameter of 1 mm), a fibre percentage of 1% provided an improvement of the mechanical performances.
A total of 30 samples were prepared and 10 combinations of parameters were investigated. Each combination was tested with three samples. The parameters were: fibre diameter (1 mm and 2.2 mm), percentage of hemp fibre in the mortar (0.5%, 1% and 3%), length of the hemp braid fragments (2 cm and 3 cm). After 28 days of curing, specimens prepared with three different percentages of hemp fibres (0.5%, 1% and 3%) did not undergo significant changes due to mortar shrinkage phenomena.
For the mechanical characterization of the material, bending and compressive tests were performed on all specimens. Compared to the control specimens, the flexural strength of the mortars obtained with the addition of hemp braids increased only for few specimens. For the specimens supplemented with d = 1 mm fibres, an increase in resistance was observed in following cases: (I) 3% hemp fibres with length of 2 cm (strength increase of + 18%); (II) 1% hemp fibres with length of 3 cm (strength increase of + 34%); (III) 3% hemp fibres with length of 3 cm (strength increase of + 27%). For the specimens supplemented with d = 2.2 mm hemp braids, the resistance was always lower than that of the reference samples. This occurred also for all fibre-reinforced specimens in the compressive tests. In particular, it was noted that as the percentage of braids increased the trend decreased, with reductions varying between 24% and 56%. On the other hand, there was an improvement of 74% of the average of the ultimate deformations, which denotes a greater ductility of the fibre-reinforced specimens.

Author Contributions

Conceptualization, A.F.; methodology, A.F.; validation, A.D., E.M. and A.F.; formal analysis, A.D. and E.M.; investigation, A.D., E.M. and A.F.; resources, A.F.; data curation, A.D. and A.F.; writing—original draft preparation, A.D. and E.M.; writing—review and editing, A.F.; visualization, A.D., E.M. and A.F.; supervision, A.F.; project administration, A.F.; funding acquisition, A.F. All authors have read and agreed to the published version of the manuscript.

Funding

This research received partial funding from the Parlato Costruzioni Srl company, having registered office in Castellammare di Stabia (district of Naples), in the framework of a research agreement with the Department of Structures for Engineering and Architecture of the University of Naples Federico II.

Institutional Review Board Statement

Not applicable.

Informed Consent Statement

Not applicable.

Data Availability Statement

The data presented in this study are available on request from the corresponding author with the permission of the Parlato Costruzioni Srl company, which partially financed the current research.

Acknowledgments

The authors would like to acknowledge the Kerakoll company, in the person of Fulvio Bruno, for the kind provision of the BIOCALCE® product used in the current research activity.

Conflicts of Interest

The authors declare no conflict of interest.

References

  1. Keeler, M.; Burke, B. Fundamentals of Integrated Design for Sustainable Building; John Wiley & Sons, Inc.: Hoboken, NJ, USA, 2009. [Google Scholar]
  2. Sanal, I.; Verma, D. Construction Materials Reinforced with Natural Products; EPA: Washington, DC, USA, 2019; pp. 2119–2142. [Google Scholar]
  3. Pickering, K.L.; Efendy, M.G.A.; Le, T.M. A review of recent developments in natural fibre composites and their mechanical performance. Compos. Part A Appl. Sci. Manuf. 2016, 83, 98–112. [Google Scholar] [CrossRef] [Green Version]
  4. Li, M.; Pu, Y.; Thomas, V.M.; Yoo, C.G.; Ozcan, S.; Deng, Y.; Nelson, K.; Ragauskas, A.J. Recent advancements of plant-based natural fiber–reinforced composites and their applications. Compos. Part B Eng. 2020, 200, 108254. [Google Scholar] [CrossRef]
  5. Zakaria, M.; Ahmed, M.; Hoque, M.M.; Islam, S. Scope of using jute fiber for the reinforcement of concrete material. Text. Cloth. Sustain. 2016, 2, 1–10. [Google Scholar] [CrossRef] [Green Version]
  6. Pickering, K.L.; Beckermann, G.W.; Alam, S.N.; Foreman, N.J. Optimising industrial hemp fibre for composites. Compos. Part A Appl. Sci. Manuf. 2007, 38, 461–468. [Google Scholar] [CrossRef]
  7. Aruan Efendy, M.G.; Pickering, K.L. Comparison of harakeke with hemp fibre as a potential reinforcement in composites. Compos. Part A Appl. Sci. Manuf. 2014, 67, 259–267. [Google Scholar] [CrossRef]
  8. Menna, C.; Asprone, D.; Durante, M.; Zinno, A.; Balsamo, A.; Prota, A. Structural behaviour of masonry panels strengthened with an innovative hemp fibre composite grid. Constr. Build. Mater. 2015, 100, 111–121. [Google Scholar] [CrossRef]
  9. De Rosa, I.M.; Kenny, J.M.; Puglia, D.; Santulli, C.; Sarasini, F. Tensile behavior of new zealand flax (phormium tenax) fibers. J. Reinf. Plast. Compos. 2010, 29, 3450–3454. [Google Scholar] [CrossRef]
  10. Cao, Y.; Wu, Y. Evaluation of statistical strength of bamboo fiber and mechanical properties of fiber reinforced green composites. J. Cent. South Univ. Technol. 2008, 15, 564–567. [Google Scholar] [CrossRef]
  11. Mustafa, A.E.; Abdollah, M.F.B.; Shuhimi, F.F.; Ismail, N.; Amiruddin, H.; Umehara, N. Selection and verification of kenaf fibres as an alternative friction material using weighted decision matrix method. Mater. Des. 2015, 67, 577–582. [Google Scholar] [CrossRef]
  12. Goda, K.; Sreekala, M.S.; Gomes, A.; Kaji, T.; Ohgi, J. Improvement of plant based natural fibers for toughening green composites—Effect of load application during mercerization of ramie fibers. Compos. Part A Appl. Sci. Manuf. 2006, 37, 2213–2220. [Google Scholar] [CrossRef]
  13. Prasad, B.M.; Sain, M.M. Mechanical properties of thermally treated hemp fibers in inert atmosphere for potential composite reinforcement. Mater. Res. Innov. 2016, 7, 231–238. [Google Scholar] [CrossRef]
  14. Fan, M. Characterization and performance of elementary hemp fibres: Factors influencing tensile strength. BioResources 2010, 5, 2307–2322. [Google Scholar] [CrossRef]
  15. Jones, D.; Brischke, C. Performance of Bio-Based Building Materials; Woodhead Publishing: Cambridge, UK, 2015. [Google Scholar]
  16. Walker, R.; Pavia, S.; Mitchell, R. Mechanical properties and durability of hemp-lime concretes. Constr. Build. Mater. 2014, 61, 340–348. [Google Scholar] [CrossRef]
  17. Asprone, D.; Durante, M.; Prota, A.; Manfredi, G. Potential of structural pozzolanic matrix–hemp fiber grid composites. Constr. Build. Mater. 2011, 25, 2867–2874. [Google Scholar] [CrossRef]
  18. Awwad, E.; Mabsout, M.; Hamad, B.; Farran, M.T.; Khatib, H. Studies on fiber-reinforced concrete using industrial hemp fibers. Constr. Build. Mater. 2012, 35, 710–717. [Google Scholar] [CrossRef]
  19. Le, A.T.; Gacoin, A.; Li, A.; Mai, T.H.; Rebay, M.; Delmas, Y. Experimental investigation on the mechanical performance of starch–hemp composite materials. Constr. Build. Mater. 2014, 61, 106–113. [Google Scholar] [CrossRef]
  20. Jami, T.; Karade, S.R.; Singh, L.P. A review of the properties of hemp concrete for green building applications. J. Clean. Prod. 2019, 239, 117852. [Google Scholar] [CrossRef]
  21. Piot, A.; Béjat, T.; Jay, A.; Bessette, L.; Wurtz, E.; Barnes-Davin, L. Study of a hempcrete wall exposed to outdoor climate: Effects of the coating. Constr. Build. Mater. 2017, 139, 540–550. [Google Scholar] [CrossRef]
  22. Wei, J.; Meyer, C. Degradation rate of natural fiber in cement composites exposed to various accelerated aging environment conditions. Corros. Sci. 2014, 88, 118–132. [Google Scholar] [CrossRef]
  23. Lee, B.-H.; Kim, H.-J.; Yu, W.-R. Fabrication of long and discontinuous natural fiber reinforced polypropylene biocomposites and their mechanical properties. Fibers Polym. 2009, 10, 83–90. [Google Scholar] [CrossRef]
  24. Silva, F.d.A.; Mobasher, B.; Filho, R.D.T. Cracking mechanisms in durable sisal fiber reinforced cement composites. Cem. Concr. Compos. 2009, 31, 721–730. [Google Scholar] [CrossRef]
  25. Savastano, H.; Santos, S.F.; Radonjic, M.; Soboyejo, W.O. Fracture and fatigue of natural fiber-reinforced cementitious composites. Cem. Concr. Compos. 2009, 31, 232–243. [Google Scholar] [CrossRef]
  26. Li, X.; Tabil, L.G.; Panigrahi, S. Chemical treatments of natural fiber for use in natural fiber-reinforced composites: A review. J. Polym. Environ. 2007, 15, 25–33. [Google Scholar] [CrossRef]
  27. Facca, A.G.; Kortschot, M.T.; Yan, N. Predicting the elastic modulus of natural fibre reinforced thermoplastics. Compos. Part A Appl. Sci. Manuf. 2006, 37, 1660–1671. [Google Scholar] [CrossRef]
  28. Thomason, J.L. Why are Natural Fibres Failing to Deliver on Composite Performance? University of Strathclyde: Glasgow, UK, 2016. [Google Scholar]
  29. Formisano, A.; Davino, A. Tensile testing on hemp stems. In International Conference of Numerical Analysis and Applied Mathematics; ICNAAM: Girne, Turkey, 2020. [Google Scholar]
  30. Walker, R. A Study of the Properties of Lime-Hemp Concrete with Pozzolans; Trinity College: Dublin, Ireland, 2013. [Google Scholar]
  31. Eurocodes: UNI EN 459-1 Building Lime. Part 1: Definitions, s.a.c.c; European Commission: Bruxelles, Belgium, 2015.
  32. Eurocodes: UNI EN 998-1 Specification for Mortar for Masonry. Part 1: Rendering and Plastering Mortar; European Commission: Bruxelles, Belgium, 2016.
  33. UNI 7044 Determination of the Consistency of Cement Mortars Using a Shaking Table; Italian National Unification Body (UNI): Rome, Italy, 1972.
  34. Eurocodes: UNI EN 196-1 Test Methods for Concretes. Part 1: Determination of Compressive Strength; European Commission: Bruxelles, Belgium, 2016.
  35. Eurocodes: UNI EN 771-1 Specification for Masonry Units. Part 1: Clay Masonry Units; European Commission: Bruxelles, Belgium, 2010.
  36. Eurocodes: UNI EN 772-1 Methods of test for Masonry Units. Part 1: Determination of Compressive Strength; European Commission: Bruxelles, Belgium, 2010.
Figure 1. Overview of the experimental setup.
Architecture 02 00008 g001
Figure 2. Characteristics of the BIOCALCE® product manufactured by the Kerakoll company.
Architecture 02 00008 g002
Figure 3. Hemp braids with diameter of 1 mm (A) and 2.2 mm (B).
Architecture 02 00008 g003
Figure 4. Saturation curves of hemp braids with diameter of 1 mm (A) and 2.2 mm (B).
Architecture 02 00008 g004
Figure 5. Workability curves for fibres with length of 20 mm (A) and 30 mm (B).
Architecture 02 00008 g005
Figure 6. Example of a 3% fibre-reinforced lime mortar before (A) and after (B) blending.
Architecture 02 00008 g006
Figure 7. Overview of the control, d = 2.2 mm braids (A) and d = 1 mm braids (B) samples.
Architecture 02 00008 g007
Figure 8. Measurement of the specimen’s dimensions.
Architecture 02 00008 g008
Figure 9. Testing machine used for bending test.
Architecture 02 00008 g009
Figure 10. Bending tests: stress σ/strain ε diagram for control samples.
Architecture 02 00008 g010
Figure 11. Bending test: stress σ/strain ε diagram for SP specimens supplemented with 1 mm fibres: 0.5% fibres with lengths of 2 cm (A) and 3 cm (B); 1% fibres with lengths of 2 cm (C) and 3 cm (D); 3% fibres with lengths of 2 cm (E) and 3 cm (F).
Architecture 02 00008 g011
Figure 12. Bending tests: stress σ/strain ε diagram for CR specimens supplemented with d = 2.2 mm fibres: 1% (A) and 3% (B) fibres with length of 2 cm; 1% fibres with length of 3 cm (C).
Architecture 02 00008 g012
Figure 13. Sewing effect of the crack due to hemp braids during the bending test (A) and fibre–reinforced specimen after flexural collapse (B).
Architecture 02 00008 g013
Figure 14. Variation of the flexural resistance along with increasing of fibre percentage: 1 mm fibres with lengths of 2 cm (A) and 3 cm (B) and 2.2 mm fibres with lengths of 2 cm (C) and 3 cm (D).
Architecture 02 00008 g014
Figure 15. Histograms of average values of bending resistance for braids with lengths of 2 cm (A) and 3 cm (B).
Architecture 02 00008 g015
Figure 16. Compressive test: stress σ/strain ε diagram for control specimens.
Architecture 02 00008 g016
Figure 17. Compressive test: stress σ/strain ε diagram for SP specimens supplemented with d = 1 mm fibres: 0.5% fibres with lengths of 2 cm (A) and 3 cm (B); 1% fibres with lengths of 2 cm (C) and 3 cm (D); 3% fibres with lengths of 2 cm (E) and 3 cm (F).
Architecture 02 00008 g017
Figure 18. Compressive test: stress σ/strain ε diagram for CR specimens supplemented with d = 2.2 mm fibres: 1% (A) and 3% (B) fibres length of 2 cm; 1% fibres length of 3 cm (C).
Architecture 02 00008 g018
Figure 19. Variation of compressive strength with increasing fibre percentage: d = 1 mm fibres with lengths of 2 cm (A) and 3 cm (B) and d = 2.2 mm fibres with lengths of 2 cm (C) and 3 cm (D).
Architecture 02 00008 g019
Figure 20. Histograms of medium values of compressive strengths for 2 cm (A) and 3 cm (B) braid lengths considered.
Architecture 02 00008 g020
Figure 21. Electron microscope photo of the hemp yarn with focus on the twist angle of the individual microfibres.
Architecture 02 00008 g021
Figure 22. Braids of different diameter subjected to tensile test (A) and machine used for tensile tests on the hemp braids (B).
Architecture 02 00008 g022
Figure 23. Stress–strain diagram of the four different diameters under tensile actions.
Architecture 02 00008 g023
Table 1. Water absorbed by 1 mm hemp braids.
DayInitial Weight (g)Fibre Length (cm)Fibre Diameter (mm)Final Weight (g)ΔWeight Fibre (g)ΔWeight H2O (%)
10.9211.700.888.89
20.9311.800.9100.00
30.9411.880.98108.89
40.9511.941.04115.56
50.9611.971.07118.89
60.9211.971.07118.89
Table 2. Water absorbed by 2.2 mm hemp braids.
DayInitial Weight (g)Fibre Length (cm)Fibre Diameter (mm)Final Weight (g)ΔWeight Fibre (g)ΔWeight H2O (%)
14.9222.210.355.43110.37
24.9222.210.665.74116.67
34.9222.210.855.93120.53
44.9222.210.956.03122.56
54.9222.210.986.06123.17
64.9222.210.986.06123.17
Table 3. Spread values of control specimens and specimens supplemented with fibres.
AcronymBraid Length (mm)Diameter (mm)Braid Amount (%)Spread (mm)
Control///180
SP_012010.5160
SP_022011155
SP_032013110
SP_043010.5155
SP_053011155
SP_063013100
CR_01202.21155
CR_02202.23100
CR_03302.21100
Table 4. Mix design of control samples (without fibres).
AcronymPremixed TypePremixed Weight (g)Water
= 20.4% of Premixed Weight
(g)
Water Absorbed by Fibres (g)Fibres (%)Fibre Length (mm)Fibre
Diameter (mm)
CNTL _01KERAKOLL CS II454.1492.65- ---
CNTL _02KERAKOLL CS II454.1492.65----
CNTL _03KERAKOLL CS II454.1492.65----
Table 5. Mix design of specimens.
AcronymFibre
Percentage (%)
Fibre Length (mm)Fibre
Diameter (mm)
Premixed Weight (g)Water = 20.4% of Premixed Weight
(g)
Water Absorbed by Fibres (g)
SP_01, 0.5%, l = 2 cm, d = 10.5201454.1492.652.70
SP_02, 0.5%, l = 2 cm, d = 10.5201454.1492.652.70
SP_03, 0.5%, l = 2 cm, d = 10.5201454.1492.652.70
SP_04, 0.5%, l = 3 cm, d = 10.5301454.1492.652.70
SP_05, 0.5%, l = 3 cm, d = 10.5301454.1492.652.70
SP_06, 0.5%, l = 3 cm, d = 10.5301454.1492.652.70
SP_01, 1%, l = 2 cm, d = 11201454.1492.655.40
SP_02, 1%, l = 2 cm, d = 11201454.1492.655.40
SP_03, 1%, l = 2 cm, d = 11201454.1492.655.40
SP_04, 3%, l = 2 cm, d = 13201454.1492.6516.20
SP_05, 3%, l = 2 cm, d = 13201454.1492.6516.20
SP_06, 3%, l = 2 cm, d = 13201454.1492.6516.20
SP_01, 1%, l = 3 cm, d = 11301454.1492.655.40
SP_02, 1%, l = 3 cm, d = 11301454.1492.655.40
SP_03, 1%, l = 3 cm, d = 11301454.1492.655.40
SP_04, 3%, l = 3 cm, d = 13301454.1492.6516.20
SP_05, 3%, l = 3 cm, d = 13301454.1492.6516.20
SP_06, 3%, l = 3 cm, d = 13301454.1492.6516.20
CR_01, 1%, l = 2 cm, d = 2.21202.2454.1492.655.59
CR_02, 1%, l = 2 cm, d = 2.21202.2454.1492.655.59
CR_03, 1%, l = 2 cm, d = 2.21202.2454.1492.655.59
CR_04, 3%, l = 2 cm, d = 2.23202.2454.1492.6516.78
CR_05, 3%, l = 2 cm, d = 2.23202.2454.1492.6516.78
CR_06, 3%, l = 2 cm, d = 2.23202.2454.1492.6516.78
CR_01 1%, l = 3 cm, d = 2.21302.2454.1492.655.59
CR_02, 1%, l = 3 cm, d = 2.21302.2454.1492.655.59
CR_03, 1%, l = 3 cm, d = 2.21302.2454.1492.655.59
Table 6. Measurement of control specimens after curing.
AcronymBase (mm)Height (mm)Depth (mm)
CNTL_014040160
CNTL_024040160
CNTL_034040160
Table 7. Measurement of specimens after curing.
AcronymBase (mm)Height (mm)Depth (mm)
SP_01, 0.5%, l = 2 cm, d = 14040160
SP_02, 0.5%, l = 2 cm, d = 14040159.5
SP_03, 0.5%, l = 2 cm, d = 14040160
SP_04, 0.5%, l = 3 cm, d = 14140160
SP_05, 0.5%, l = 3 cm, d = 14041160
SP_06, 0.5%, l = 3 cm, d = 14041160
SP_01, 1%, l = 2 cm, d = 14040160.5
SP_02, 1%, l = 2 cm, d = 14041160.6
SP_03, 1%, l = 2 cm, d = 14040.5160
SP_04, 3%, l = 2 cm, d = 14041160
SP_05, 3%, l = 2 cm, d = 14041160
SP_06, 3%, l = 2 cm, d = 14041160
SP_01, 1%, l = 3 cm, d = 14040.5160
SP_02, 1%, l = 3 cm, d = 14040.5159.5
SP_03, 1%, l = 3 cm, d = 14040159.5
SP_04, 3%, l = 3 cm, d = 14041160
SP_05, 3%, l = 3 cm, d = 14140159.5
SP_06, 3%, l = 3 cm, d = 141.540159.5
CR_01, 1%, l = 2 cm, d = 2.24040159.5
CR_02, 1%, l = 2 cm, d = 2.24040.5160
CR_03, 1%, l = 2 cm, d = 2.24040159.5
CR_04, 3%, l = 2 cm, d = 2.24041160
CR_05, 3%, l = 2 cm, d = 2.24040.5160
CR_06, 3%, l = 2 cm, d = 2.24041160
CR_01 1%, l = 3 cm, d = 2.24041160
CR_02, 1%, l = 3 cm, d = 2.24040.5160
CR_03, 1%, l = 3 cm, d = 2.24040.5160
Table 8. Bending test results for control specimens. The average values (AVE) are reported with the standard deviation (SD).
AcronymF (kN)σF (MPa)AVE
SD
(MPa)
δ (mm)AVE
SD
(mm)
Part 1 (g)Part 2 (g)Total Weight (g)ρ (kN/m3)AVE
SD
(kN/m3)
CNTL_010.7581.781.58
0.15
0.2810.27
0.01
208.0256.0464.017.7717.78
0.11
CNTL_020.6701.570.266231.0230.0461.017.65
CNTL_030.6001.410.274215.0253.0468.017.92
Table 9. Bending test results specimens. The average values (AVE) are reported with the standard deviation (SD).
AcronymF (kN)σF (MPa)AVE
± SD (MPa)
δ (mm)AVE
SD (mm)
Part 1 (g)Part 2
(g)
Total
weight (g)
ρ (kN/m3)AVE
± SD (kN/m3)
SP_01, 0.5%, l = 2 cm, d = 10.4911.1511.30
0.13
0.4910.45
0.03
197.0262.0459.017.5817.45
0.15
SP_02, 0.5%, l = 2 cm, d = 10.6221.4580.422201.0249.0450.017.23
SP_03, 0.5%, l = 2 cm, d = 10.5521.2940.437232.0226.0458.017.54
SP_04, 0.5%, l = 3 cm, d = 10.7141.6731.38
0.26
0.7640.51
0.18
246.0219.0465.017.8117.77
0.08
SP_05, 0.5%, l = 3 cm, d = 10.6001.4060.379239.0222.0461.017.65
SP_06, 0.5%, l = 3 cm, d = 10.4471.0480.377238.0228.0466.017.85
SP_01, 1%, l = 2 cm, d = 10.5851.3711.55
0.18
0.3490.48
0.13
224.0229.0453.017.3517.34
0.11
SP_02, 1%, l = 2 cm, d = 10.6341.4860.431208.0241.0449.017.20
SP_03, 1%, l = 2 cm, d = 10.7671.7980.647228.0228.0456.017.46
SP_04, 3%, l = 2 cm, d = 10.6751.5822.13
0.63
1.6531.88
0.16
244.0186.0430.016.4716.44
0.02
SP_05, 3%, l = 2 cm, d = 11.2833.0072.008206.0223.0429.016.43
SP_06, 3%, l = 2 cm, d = 10.7631.7881.974211.0218.0429.016.43
SP_01, 1%, l = 3 cm, d = 10.7451.7461.88
0.38
1.2091.66
0.42
212.0240.0452.017.3117.14
± 0.21
SP_02, 1%, l = 3 cm, d = 10.6351.4881.542232.0216.0448.017.16
SP_03, 1%, l = 3 cm, d = 11.0212.3932.220231.0212.0443.016.97
SP_04, 3%, l = 3 cm, d = 11.0782.5272.02
0.37
4.1853.04
0.82
183.0226.0409.015.6615.84
0.16
SP_05, 3%, l = 3 cm, d = 10.7931.8592.339207.0206.0413.015.82
SP_06, 3%, l = 3 cm, d = 10.7101.6642.600212.0207.0419.016.05
CR_01, 1%, l = 2 cm, d = 2.20.7531.761.28
0.64
0.4990.51
0.07
216.0231.0447.017.1217.39
0.21
CR_02, 1%, l = 2 cm, d = 2.20.7271.700.436196.0259.0455.017.42
CR_03, 1%, l = 2 cm, d = 2.20.1580.370.608230.0230.0460.017.62
CR_04, 3%, l = 2 cm, d = 2.20.4421.040.85
0.17
0.6210.48
0.14
192.0185.0377.014.4414.00
0.36
CR_05, 3%, l = 2 cm, d = 2.20.2630.620.513191.0163.0354.013.56
CR_06, 3%, l = 2 cm, d = 2.20.3850.900.296206.0160.0366.014.02
CR_01 1%, l = 3 cm, d = 2.20.5651.321.27
0.06
0.6470.56
0.08
212.0203.0415.015.8915.93
0.11
CR_02, 1%, l = 3 cm, d = 2.20.5081.190.448231.0189.0420.016.08
CR_03, 1%, l = 3 cm, d = 2.20.5481.280.591200.0213.0413.015.82
Table 10. Compressive test results on control specimens. The average values (AVE) are reported with the standard deviation (SD).
AcronymN (kN)σC (MPa)AVE
SD
(MPa)
δ (mm)AVE
SD
(mm)
CNTL _0111.146.966.04
0.70
0.4640.64
0.23
CNTL _029.836.140.652
CNTL _038.405.251.019
Table 11. Compressive test results on fibre-reinforced specimens. The average values (AVE) are reported with the standard deviation (SD).
AcronymN (kN)σC (MPa)AVE
SD
(MPa)
δ (mm)AVE
SD
(mm)
SP_01, 0.5%, l = 2 cm, d = 16.7244.2034.56
0.26
0.650.73
0.11
SP_02, 0.5%, l = 2 cm, d = 17.5474.7170.90
SP_03, 0.5%, l = 2 cm, d = 17.6784.7990.69
SP_04, 0.5%, l = 3 cm, d = 18.2135.1334.60
0.55
0.970.79
0.12
SP_05, 0.5%, l = 3 cm, d = 16.2243.8900.74
SP_06, 0.5%, l = 3 cm, d = 17.9724.9830.70
SP_01, 1%, l = 2 cm, d = 15.8403.6503.47
1.03
1.890.77
0.61
SP_02, 1%, l = 2 cm, d = 18.1035.0640.76
SP_03, 1%, l = 2 cm, d = 14.0742.5460.49
SP_04, 3%, l = 2 cm, d = 15.3613.3513.54
0.19
0.450.66
0.20
SP_05, 3%, l = 2 cm, d = 15.5853.4910.82
SP_06, 3%, l = 2 cm, d = 16.1053.8160.90
SP_01, 1%, l = 3 cm, d = 17.3814.6134.24
0.27
0.580.78
0.20
SP_02, 1%, l = 3 cm, d = 16.3073.9420.87
SP_03, 1%, l = 3 cm, d = 16.7674.2291.05
SP_04, 3%, l = 3 cm, d = 15.5023.4393.35
0.11
0.840.74
0.08
SP_05, 3%, l = 3 cm, d = 15.4843.4280.75
SP_06, 3%, l = 3 cm, d = 15.1123.1950.65
CR_01, 1%, l = 2 cm, d = 2.27.994.994.50
1.03
0.6980.55
0.11
CR_02, 1%, l = 2 cm, d = 2.25.413.380.438
CR_03, 1%, l = 2 cm, d = 2.29.375.860.560
CR_04, 3%, l = 2 cm, d = 2.23.332.082.60
0.57
0.7050.68
0.14
CR_05, 3%, l = 2 cm, d = 2.25.523.450.882
CR_06, 3%, l = 2 cm, d = 2.24.152.600.537
CR_01 1%, l = 3 cm, d = 2.24.732.963.66
0.75
0.6810.91
0.30
CR_02, 1%, l = 3 cm, d = 2.27.644.771.390
CR_03, 1%, l = 3 cm, d = 2.25.893.680.913
Table 12. Tensile resistance of specimens reinforced with braids. The average values (AVE) are reported with the standard deviation (SD).
Acronymd (mm)A (mm2)F
(N)
σt
(MPa)
AVE
SD
(MPa)
E
(MPa)
AVE
SD
(MPa)
D4_14.0012.57683.0054.448.7
4.1
1137.11950.5
937.1
D4_24.0012.57580.0046.21451.1
D4_34.0012.57570.0045.43263.2
D3_13.007.07197.0027.8727.2
1.0
656.4549.1
151.8
D3_23.007.07182.0025.7334.4
D3_33.007.07197.0027.9656.4
D2.2_12.203.80240.0063.161.7
1.1
1948.61969.7
60.3
D2.2_22.203.80230.0060.51908.7
D2.2_32.003.14234.0061.62051.9
D1_11.000.79121.00154.1149.0
4.2
2362.92894.8
487.3
D1_21.000.79113.00143.93540.3
D1_31.000.79117.00148.92781.3
Publisher’s Note: MDPI stays neutral with regard to jurisdictional claims in published maps and institutional affiliations.

