Article

Preclinical Development of Costimulatory Switch Protein (CSP)-Armored NY-ESO-1/LAGE-1a-Specific TCR-T Cells for Therapy of Hard-to-Treat PD-L1-Positive Solid Tumors

1
Medigene Immunotherapies GmbH, 82152 Planegg-Martinsried, Germany
2
Medigene AG, 82152 Planegg-Martinsried, Germany
*
Author to whom correspondence should be addressed.
Current address: Becker MVZ GmbH, 81671 Munich, Germany.
Current address: ITM, Isotope Technologies Munich SE, 85748 Garching, Germany.
Int. J. Transl. Med. 2025, 5(4), 45; https://doi.org/10.3390/ijtm5040045
Submission received: 28 July 2025 / Revised: 18 September 2025 / Accepted: 24 September 2025 / Published: 26 September 2025

Abstract

Background/Objectives: Whilst adoptive cell therapy (ACT) using chimeric antigen receptor-engineered T (CAR-T) cells represents an efficient approach for the treatment of patients suffering from several hematological malignancies, solid tumors have been shown to be far more challenging to tackle, mainly due to the hostile tumor microenvironment that inhibits optimal T cell functionality. As proven by the broad clinical success of immune checkpoint inhibitors, blocking the interaction of programmed cell death ligand 1 (PD-L1) expressed on tumor cells and the checkpoint receptor programmed cell death 1 (PD-1) expressed on activated T cells allows an intrinsic T cell-mediated anti-tumor response to be unleashed. We developed a cellular product (MDG1015) consisting of New York esophageal squamous cell carcinoma-1 (NY-ESO-1)/L antigen family member 1a (LAGE-1a)-specific CD8+ T cell receptor-transduced (TCR-)T cells co-expressing the costimulatory switch protein (CSP) PD1-41BB, which turns an inhibitory signal mediated by the PD-1:PD-L1 axis into positive T cell costimulation. Methods: In vitro co-cultures of MDG1015 and PD-L1-positive or -negative target cells were used to analyze TCR-T cell functionality, such as TCR-T (poly-)cytokine release, the killing of target cells, and TCR-T proliferation. The safety of MDG1015 was evaluated via different panels of antigen-negative cell lines or primary cells expressing or lacking PD-L1. Results: Preclinical analyses demonstrated TCR-gated activation of the CSP, leading to enhanced functionality of MDG1015 against antigen-expressing, PD-L1-positive tumor cells without any impact on antigen-negative target cells. Conclusions: The favorable, preclinical functionality and safety profile qualifies MDG1015 as a promising cellular therapy for explorative clinical testing in hard-to-treat solid tumor indications.

1. Introduction

Adoptive cell therapy (ACT) using chimeric antigen receptor-engineered T (CAR-T) cells shows broad clinical application and represents an effective approach for the treatment of B cell-driven hematological malignancies [1,2,3,4,5]. However, solid tumors, representing most human malignancies, are far more challenging to tackle, mainly due to a hostile tumor microenvironment (TME) that inhibits optimal T cell functionality. Various factors within the TME, such as immuno-suppressive cells or cytokines/chemokines as well as immune checkpoint ligands, contribute to the inhibition of a potent anti-tumor immune response [6]. The high clinical success achieved using immune checkpoint inhibitors that block the interaction of the programmed cell death ligand 1 (PD-L1) expressed on tumor cells and the programmed cell death 1 (PD-1) receptor expressed on activated T cells demonstrates the exceptional role of this axis for the suppression of multiple immune cell functions [7,8]. Whilst immune checkpoint inhibition shows a great capacity to unleash an intrinsic anti-tumor T cell response, leading to long-lasting tumor remission in certain blood cancers and solid tumors, immunotherapy based on anti-PD-L1 or anti-PD-1 antibodies can also trigger severe systemic immune-related toxicities that require additional medical interventions or even the discontinuation of treatment [9,10].
We developed a third generation T cell receptor-transduced (TCR-)T cell product, MDG1015, consisting of autologous CD8+ T cells co-expressing a human leukocyte antigen (HLA)-A*02:01-restricted, New York esophageal squamous cell carcinoma-1 (NY-ESO-1)/L antigen family member 1a (LAGE-1a)-specific TCR and the costimulatory switch protein (CSP) PD1-41BB. The NY-ESO-1/LAGE-1a-specific TCR used in MDG1015 was isolated from the non-tolerized TCR repertoire of a healthy donor, as described earlier [11,12], and displays favorable characteristics regarding specificity, sensitivity, and safety. The CSP expressed in MDG1015 consists of the extracellular and transmembrane domains of PD-1 and the intracellular domain of 4-1BB [13], turning an inhibitory signal mediated via a PD-L1:PD-1 interaction into a costimulatory signal. Thereby, TCR-T functionality is enhanced and the exhaustion of TCR-T cells induced by serial antigen stimulation is delayed. Importantly, costimulation via PD1-41BB is spatially constrained to the tumor site expressing the target antigen (here: NY-ESO-1/LAGE-1a), which limits the risk of severe toxicities due to CSP activation.
NY-ESO-1 and LAGE-1a are well-described cancer testis (C/T) antigens that show high homology and share the SLLMWITQC epitope (hereafter: NY-ESO-1/LAGE-1a SLL) presented at the tumor cell surface by HLA-A*02:01-encoded molecules, which form the antigen-specific peptide-HLA target of MDG1015. Expression of NY-ESO-1 and LAGE-1a in healthy tissues is mainly restricted to testis tissue, whereas the expression in malignant tissues is described for various solid tumor indications, such as synovial sarcoma, and gastric and ovarian cancers [14,15,16,17], making NY-ESO-1 and/or LAGE-1a suitable targets for TCR-guided immunotherapy. Previous clinical studies using NY-ESO-1/LAGE-1a-specific TCR-T cells showed the safety for NY-ESO-1/LAGE-1a-targeted therapies [18,19,20]; however, clinical efficacy remained limited [19].
In this study, we performed extensive preclinical analyses of MDG1015 functionality, mode-of-action, and safety, especially focusing on the recognition of PD-L1-positive target cells, including both tumor and healthy cells. Using a variety of different antigen-positive tumor cell lines expressing or lacking PD-L1 and applying different functional assays, we demonstrated the enhanced functionality of MDG1015 after activation of the CSP by PD-L1. Importantly, we showed the TCR-gated nature of CSP activation, which excludes the activation of MDG1015 in the absence of the peptide-HLA target antigen and represents an important safety characteristic.
Thereby, our in vitro analyses provide critical data on the functionality and safety of CSP-armored TCR-T cells and reveal the potential of MDG1015 to overcome some current limitations of TCR-guided therapies in hard-to-treat PD-L1-positive solid tumors.

2. Materials and Methods

2.1. Generation of NY-ESO-1/LAGE1a-Specific TCR-T Cells (MDG1015)

The study was approved by Ethics Committee of the Bavarian State Chamber of Medicine (approval code No. 18010, approval date 13 April 2018).
Fresh leukapheresis products collected from three healthy donors (obtained from the commercial supplier Cyto-care.eu GmbH, Vienna, Austria, with cell collection performed in accordance with applicable current local regulations and requirements) were cryopreserved at −150 °C upon delivery. After thawing, CD8+ cells were enriched from the leukapheresis products using positive immuno-magnetic separation and subsequently activated for two days with the stimulation reagent MACS® GMP T Cell TransAct™ (Miltenyi Biotec, Bergisch-Gladbach, Germany). Self-inactivating (SIN)-γ retroviral supernatant encoding the transgenic TCR T11.8-10-17 and the CSP PD1-41BB, manufactured at the contract development and manufacturing organization (CDMO) BioNTech IMFS (Idar-Oberstein, Germany), was used for transduction of CD8+ T cells at a multiplicity of infection (MOI) of 6. Cells were expanded until day 5, harvested, cryopreserved, and stored at 150 °C. MDG1015 batches generated from donors 1–3 were manufactured using the CliniMACS Prodigy® Instrument (Miltenyi Biotec), on which all steps from cell enrichment to harvest were performed automatically. Untransduced (UT) T cells derived from the same healthy donors were cultured in parallel as controls at a smaller scale in G-Rex6M flasks (WilsonWolf, St. Paul, MN, USA). NY-ESO-1/LAGE-1a TCR-T cells lacking or expressing the CSP used for earlier preclinical experiments were manufactured using fresh blood drawn from healthy donors after obtaining informed consent in accordance with governmental guidelines and approved by the Ethics Commission of the Bavarian State Chamber of Medicine. Transduction was performed using retroviral supernatants produced in house, encoding the transgenic TCR only or both the transgenic TCR and the CSP. Allo-HLA-A2-reactive TCR-T cells (Allo-A2 TCR-T cells) were generated from CD8+ T cells derived from one healthy donor using retroviral vector supernatant produced at Medigene Immunotherapies GmbH (Planegg-Martinsried, Germany), which encodes an allo-HLA-A2-reactive TCR T5.8-3-9 that recognizes HLA-A*02:01-positive target cells irrespective of specific peptide. This TCR contains a murine C beta region, which can be detected by flow cytometry (FC) using a specific antibody. Allo-A2 TCR-T cells were used in co-culture assays to confirm the expression of functional cell surface HLA-A2 molecules on target cells, required for activation of HLA-A*02:01-restricted MDG1015 cells.

2.2. Generation of Transduced Tumor Cell Lines and 3D Tumor Cell Spheroids

Tumor cell lines were obtained from in-house master and working cell banks and cultured in optimized medium (Table A1). Retroviral transduction was performed using virus supernatants generated in house, encoding HLA-A*02:01, PD-L1, or both. Tumor cell lines transduced to overexpress HLA-A*02:01, PD-L1, or both were named “_A2”, “_PD-L1”, “_A2_PD-L1”, or “_PD-L1_A2”, respectively. For fluorescent labeling, tumor cells were transduced with nuclear-restricted red fluorescent protein mKate2 (IncuCyte® NucLight Red Lentivirus® reagent, Sartorius, Göttingen, Germany). Transduction strategies included sequential or combined gene transfer of HLA-A*02:01 and PD-L1, enabling the generation of matched tumor cell-line pairs expressing or lacking PD-L1. Transgene expression was confirmed by FC, and double-positive cells were enriched by fluorescence-activated cell sorting using a Sony SH800 cell sorter (Sony Biotechnologies, San Jose, CA, USA). NucLight Red-positive cells were selected with puromycin, expanded, and cryopreserved at –150 °C. All cell lines were confirmed to be mycoplasma-free by PCR (Venor®GeM Classic, Minerva Biolabs, Berlin, Germany) prior to use in any experiment. Three-dimensional tumor cell spheroids were generated by seeding cell-type-specific suspensions (100 µL per well) into ultra-low attachment 96-well round-bottom plates (Corning Inc., Corning, NY, USA). Cells were centrifuged (196× g, 10 min, RT) and incubated for 72 h at 37 °C, 5% CO2, and under humidified conditions. Effective 3D spheroid formation was defined by rounded morphology, clear borders, and ≥300 µm diameter.

2.3. Quantitative Real-Time PCR (qPCR)

Expression levels of NY-ESO-1 and/or LAGE-1a mRNA in different cell lines were determined by qPCR. cDNA was generated from cell samples using the Transcriptor First Strand cDNA kit (Roche, Basel, Switzerland) and subsequently analyzed with the Real-Time PCR System Light Cycler 480 (Roche). The housekeeping gene β-Glucuronidase (GUSB) served as control.

2.4. IFN-γ/IL-2 Release Assay

IFN-γ/IL-2 secretion by CD8+ T cells upon encounter of different target cells or 3D tumor spheroids was assessed in co-culture supernatants after 24 h. Cytokine concentrations were determined using ELISA kits (both BD Biosciences, San Jose, CA, USA). Optical densities (OD) were measured using the Multiskan™ FC Microplate Photometer and data evaluated by the SkanIt™ Software version 3.1 (both Thermo Scientific™, Waltham, MA, USA). Background-corrected OD values were used for extrapolation using a third-degree polynomial.

2.5. Bulk Poly-Cytokine Analysis

Poly-cytokine (GM-CSF, IFN-γ, granzyme A, IL-2, IL-6, MIP-1β, TNF-α, and perforin) secretion by CD8+ T cells upon encounter of different target cells was assessed in co-culture supernatants after 24 h. Cytokines were quantified using the Milliplex® MAP Human CD8+ T Cell Magnetic Bead 8-Plex Panel (Merck KGaA, Darmstadt, Germany), following the manufacturer’s protocol. Fluorescence was measured with the MAGPIX® system and xPONENT® software (Bio-Rad Laboratories, Hercules, CA, USA). Data analysis was performed using the Belysa™ software version 1.2 (Merck KGaA, Darmstadt, Germany).

2.6. Single-Cell Poly-Cytokine Secretion Analysis

Poly-cytokine secretion by CD8+ T cells at the single-cell level was analyzed in co-culture assays in vitro using the IsoLight® secretomics technology (Bruker Cellular Analysis, Emeryville, CA, USA). The IsoLight® technology is based on barcoded imaging of cytokine secretion. TCR-T cells were labeled with a cell membrane stain (Bruker Cellular Analysis) and added to target cells for 20 h co-culture, followed by magnetic bead-based anti-CD8 enrichment (Anti-human CD8 magnetic micro beads, LS MACS® Columns, both Miltenyi Biotec). Enriched CD8+ T cells were loaded onto single-cell-secretome Adaptive Immune IsoCode Chips, and cytokine secretion was monitored for 23 h in the IsoLight® device (both Bruker Cellular Analysis).

2.7. Live-Cell Imaging Cytotoxicity Assay

Real-time target cell killing in co-cultures with TCR-T cells was assessed using the live-cell imaging IncuCyte S3® device (Sartorius, Göttingen, Germany), following manufacturer’s recommendations. Target cells were seeded into 96-well flat-bottom plates or ultra-low attachment round-bottom plates prior to addition of TCR-T cells, and target cell lysis was monitored by plate scanning every 4 h. Tumor cell lines were transduced to express the nuclear-restricted red fluorescent protein mKate2 for easier visualization of tumor cell killing through detection of decreases in red fluorescence over time. For analysis of healthy cells (not fluorescently labeled), IncuCyte® phase contrast images obtained after 72 h of co-culture of MDG1015 and healthy cells were evaluated qualitatively by an internal panel of four independent experienced scientists. The panel evaluated changes in target cell morphology and confluency, as well as induction of T cell proliferation, as indicators of target cell killing. Furthermore, IncuCyte® phase contrast images obtained during up to 120 h of co-culture of MDG1015 and healthy cells were evaluated quantitatively, applying the artificial intelligence (AI)-driven confluence mask of the 2023A rev2 IncuCyte® software (Essen Bioscience, Sartorius, Göttingen, Germany). Confluency of healthy target cells co-cultured with MDG1015 and UT T cells were compared, and a threshold in relative confluency of 20% was set, based on the variation observed in the co-cultures of healthy target cells with control UT T cells. Therefore, a decrease in relative confluency >20% between co-cultures with MDG1015 and UT T cells was considered significant and reported as MDG1015-mediated killing.

2.8. Cell Surface Staining and Flow Cytometry

TCR-T cells were analyzed for cell surface marker expression by staining with fluorochrome-labeled antibodies, including anti-CD45 (clone HI30), anti-CD3 (clone UCHT1), and anti-CD8 (clone RPA-T8, all BD Biosciences, San Jose, CA, USA). The expression of the transgenic TCR and the CSP was analyzed by anti-TRBV12 (T Cell Receptor Beta Variable 12)-specific antibodies (clone 56C5.2, Beckman Coulter, Brea, CA, USA) and anti-PD1 antibodies (clone EH12.1, BD Biosciences), respectively. Gates were set using corresponding isotype controls.
T cell memory subpopulations were identified using antibodies anti-CD27 (clone M-T271) and anti-CD95 (clone DX2), both purchased from BD Biosciences, anti-CCR7 (clone G043H7, Biolegend, San Diego, CA, USA), and anti-CD45-RA (clone HI100, Invitrogen, Carlsbad, USA). For analysis of memory CD8+ T cells, CD45RA+/CCR7+/CD27+/CD95+ T cells were defined as stem cell-like memory T cells (TSCM), CD45RA−/CCR7+/CD27+/CD95+ T cells as central memory T cells (TCM), CD45RA−/CCR7−/CD27+/CD95+ T cells as transitional memory T cells (TTM), CD45RA−/CCR7−/CD27−/CD95+ T cells as effector memory T cells (TEM), CD45RA+/CCR7−/CD27+/CD95+ T cells as effector memory early T cells RA-positive (TEMRA early), and CD45RA+/CCR7−/CD27−/CD95+ T cells as effector memory late T cells RA-positive (TEMRA late).
Cell surface expression of HLA-A2 and PD-L1 in target cells was determined via cell surface staining using specific fluorochrome-labeled antibodies (clone BB7.2 and MIH1, both BD Biosciences). All samples were measured using an LSR Fortessa™ flow cytometer (BD Biosciences) and data was analyzed using FlowJo software (v10.8.1, BD Biosciences).

2.9. Proliferation and TCR-T Cell Expansion Analysis

TCR-T cells were labeled using the CellTraceTM Violet Cell Proliferation Kit (Invitrogen, Carlsbad, CA, USA), according to manufacturer’s instructions, prior to cultivation in proliferation assays. Proliferation of MDG1015 in co-cultures with NY-ESO-1/LAGE-1a-positive or -negative tumor cell lines was analyzed in co-culture assays in vitro and measured by CellTraceTM dilution and quantification of MDG1015 or UT T cells. TCR-T cells stimulated with T Cell TransAct™ (Miltenyi Biotec) served as positive controls for T cell functionality. T cells were quantified using CountBrightTM Absolute Counting Beads (Invitrogen). All samples were acquired using an LSR Fortessa™ flow cytometer (BD Biosciences) and data was analyzed using FlowJo software (v10.8.1, BD Biosciences).

3. Results

3.1. Phenotype Characteristics of MDG1015

Transgene expression and T memory subpopulations were determined from MDG1015 batches used for preclinical evaluation and manufactured from three healthy donors (donors 1, 2, and 3) using the intended clinical manufacturing process established on the CliniMACS Prodigy® Instrument. All three batches demonstrated a high purity of ≥97% of CD3+CD8+ T cells after harvest on process day 5 (Supplementary Table S1).
Cell surface co-expression of the transgenic TCR and CSP PD1-41BB in MDG1015 (Figure 1a) was assessed by FC, using antibodies specific for CD3, CD8, PD-1, and TRBV12. Notably, the anti-PD-1 and anti-TRBV12 antibodies do not discriminate between the endogenous and transgenic forms of their respective targets. Therefore, the transduction rate for the transgenic TCR or PD1-41BB was determined as TRBV12 or PD-1 expression levels above the endogenous expression levels detected in UT T cells. Calculated transduction efficiencies for the transgenic TCR and PD1-41BB were in the range of 57–71% (TCR) and 49–64% (PD1-41BB), with the endogenous expression of TRBV12 and PD-1 in UT cells ≤6% (Supplementary Figure S1). Importantly, a high proportion of T cells co-expressed both transgenes, with double-positive populations ranging from 50 to 64%. Data from a representative donor are given in Figure 1b. The frequency of CD3+/CD8+ cells expressing the TCR or PD-1 only was comparatively low, underscoring the efficiency of co-expression in the engineered product (Supplementary Figure S1). The transduction rate of Allo-HLA-A2-reactive TCR-T cells, representing a positive control for the detection of cell surface HLA-A2 expression in the target cells, was 85% of CD3+/CD8+ T cells (Supplementary Figure S2).
T memory subpopulations in MDG1015 were characterized as different subsets and showed different capacities for long-term survival, self-renewal, and effector functions. The memory phenotype of CD3+/CD8+ T cells was identified by the differential expression of the cell surface markers CD45RA, CCR7, CD27, and CD95 [21] by FC. Stem cell-like memory T cells (TSCM) and central memory T cells (TCM) were identified as the main subpopulations in the three MDG1015 batches tested, ranging from 26–47% to 32–53%, respectively (Figure 1c). The TSCM and TCM subpopulations taken together accounted for approximately 80% of all the CD3+/CD8+ cells analyzed within one batch. Generally, only low percentages of other more differentiated T cell memory subsets were present in the MDG1015 batches.

3.2. Functionality of MDG1015

Functionality of MDG1015 in Response to PD-L1-Expressing Tumor Cell Lines

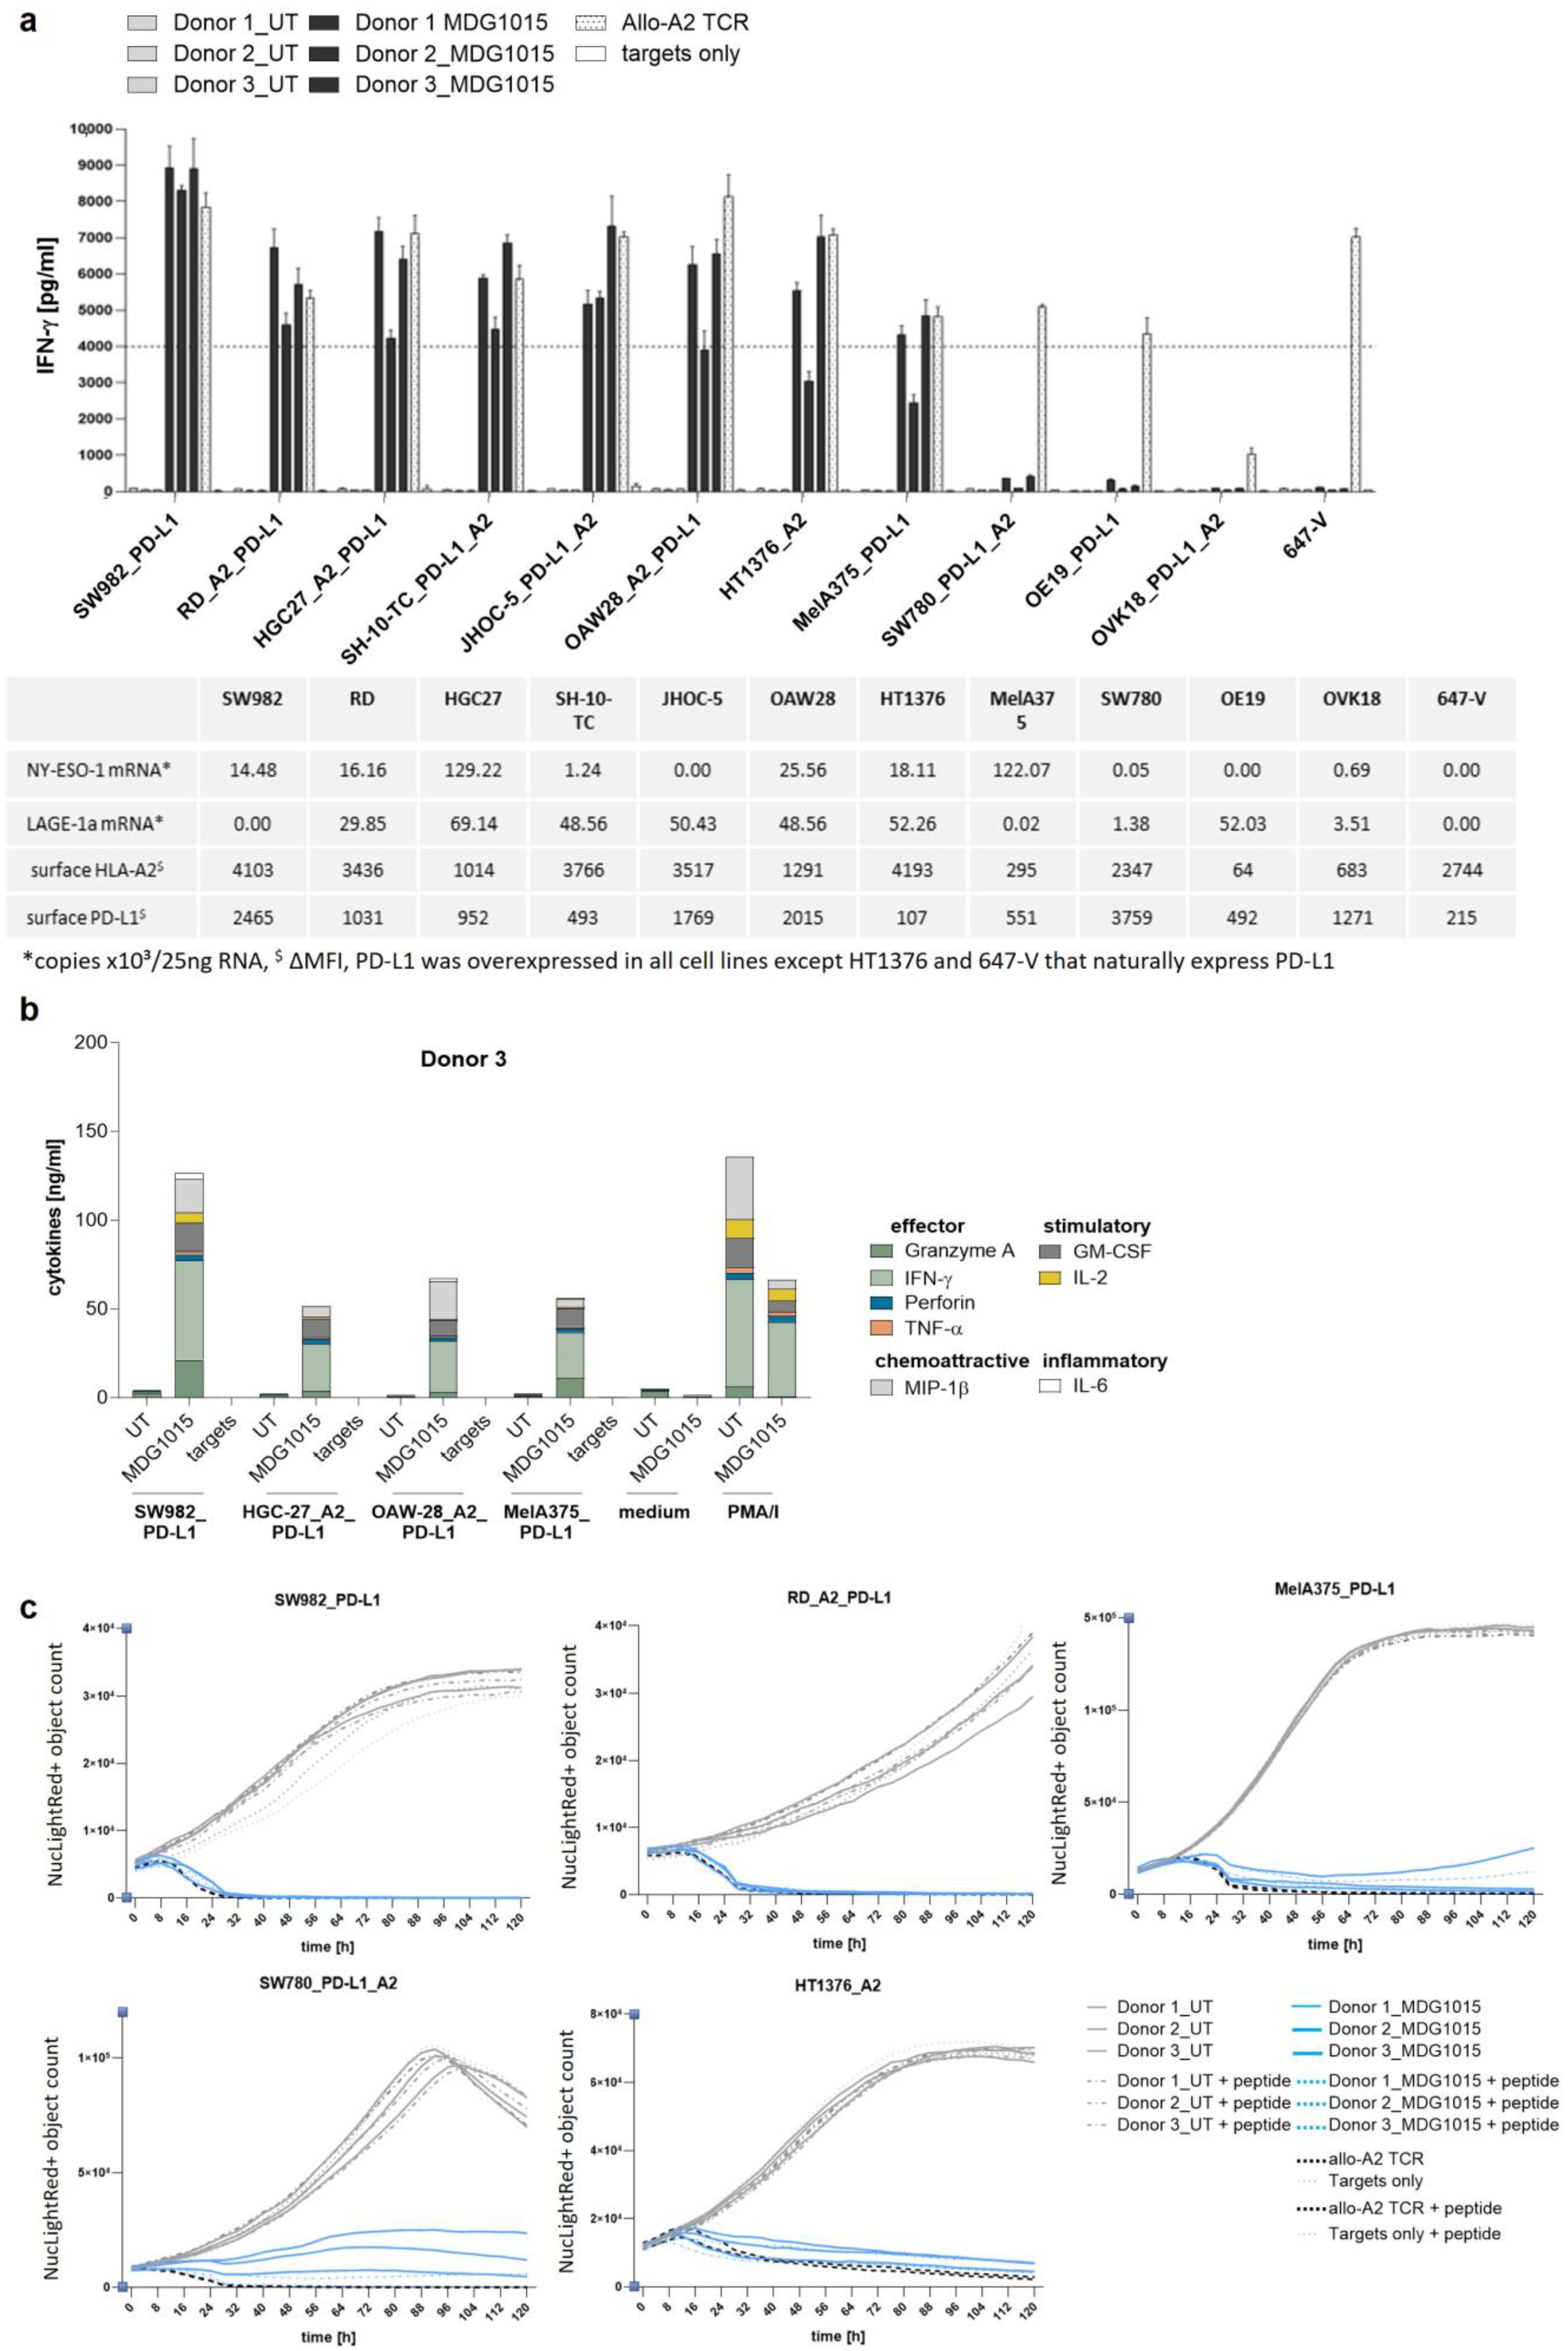
The functional activation of MDG1015 was evaluated by measuring the IFN-γ secretion following 24 h of co-culture with antigen-positive tumor cell lines expressing PD-L1. Tumor cell lines used in co-culture experiments were analyzed for cell surface HLA-A2 and PD-L1 expression via FC and showed different expression levels of the two molecules (Supplementary Figure S3a,b). In 10 of the 11 cell lines tested, MDG1015 exhibited a clear IFN-γ response, demonstrating effective antigen recognition (Figure 2a). The levels of cytokine release varied among donors, highlighting donor-dependent differences in TCR-T cell activation. Among the tested targets, SW780_PD-L1_A2 and OE19_PD-L1 only induced a low IFN-γ secretion by MDG1015 cells, while OVK18_PD-L1_A2 failed to trigger any response. qPCR analysis showed reduced antigen expression levels in SW780_PD-L1_A2 and OVK18_PD-L1_A2, and FC analyses revealed lower cell surface HLA-A2 levels in OE19_PD-L1 (Supplementary Figure S3a), potentially preventing the efficient activation of MDG1015. All tumor cell lines triggered IFN-γ release in Allo-A2-TCR-T cells, except for OVK18_PD-L1_A2, confirming insufficient cell surface HLA-A2 expression in this tumor cell line. UT T cells were neither activated by these tumor cell lines nor by the antigen-negative 647-V cell line, as shown by the lack of IFN-γ release in co-cultures with these tumor cells lines, demonstrating the specificity of MDG1015 for its cognate antigen.
To assess the polyfunctionality of MDG1015, bulk cytokine profiling was performed using the Milliplex® MAP kit after 24 h of co-culture with antigen-positive, PD-L1-expressing tumor cell lines. MDG1015, but not UT T cells, secreted multiple cytokines upon interaction with the target cells (Figure 2b), including granzyme A, IFN-γ, GM-CSF, IL-2, and MIP-1β. Only low levels of IL-6 were detected in co-cultures with SW982_PD-L1 and OAW28_A2_PD-L1, whereas IL-6 was absent after HGC27_A2_PD-L1 or PMA/I stimulation. Negative controls showed only minimal cytokine secretion. PMA/I-stimulated T cells released effector, stimulatory, and chemotactic, but not inflammatory, cytokines. Cytokine profiles across various MDG1015 batches were comparable, with batch-dependent quantitative variations.
Both MDG1015 and Allo-A2 TCR-T cells induced efficient lysis across antigen-positive, PD-L1-expressing tumor cell lines, as measured by live-cell imaging, irrespective of SLL peptide loading (Figure 2c). In contrast, tumor cells co-cultured with UT T cells showed continued outgrowth, indicating a lack of tumor cell killing.
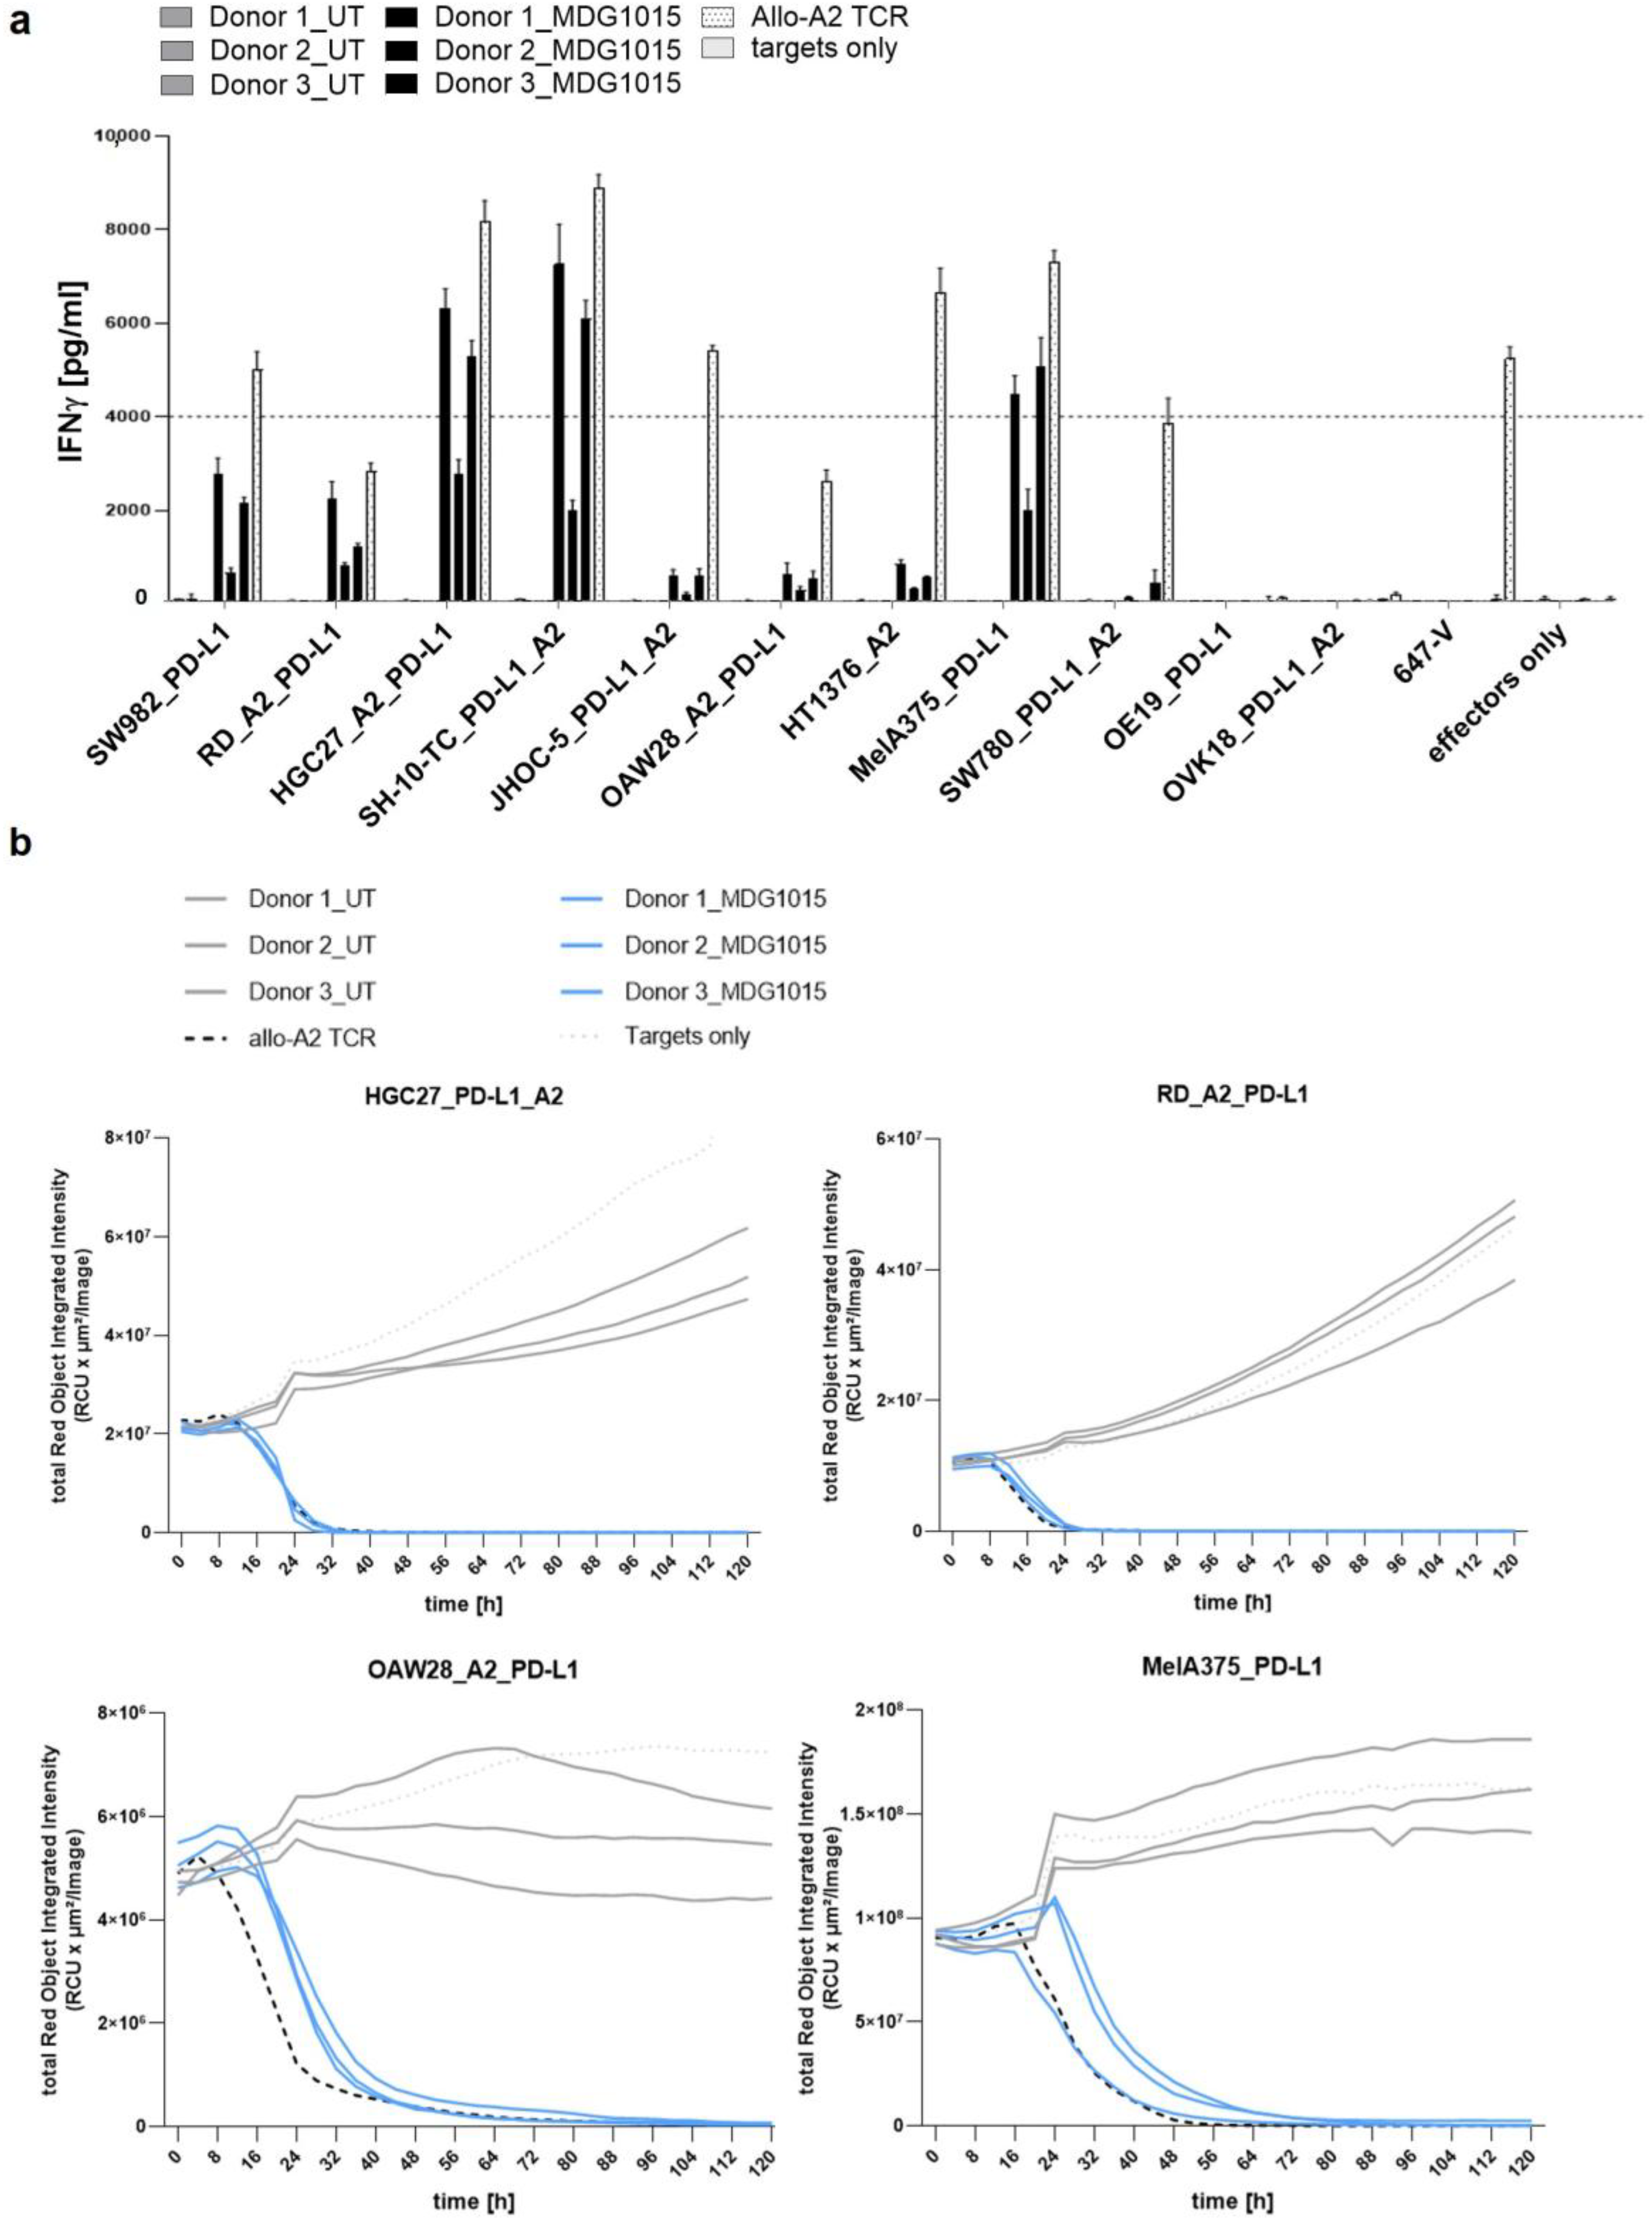
In addition to two-dimensional (2D) monolayer co-culture assays, MDG1015-mediated tumor cell recognition and lysis was assessed using three-dimensional (3D) spheroid models resembling solid tumor masses. Three-dimensional tumor spheroids with a defined morphology and diameters between 300 and 500 µm were successfully generated by optimizing the initial tumor cell numbers used for 3D spheroid generation. Co-cultures with 3D tumor spheroids triggered the IFN-γ secretion in MDG1015, albeit at lower levels compared to 2D co-cultures (Figure 2a and Figure 3a). Three-dimensional tumor spheroids derived from SW780_PD-L1_A2 only induced a weak IFN-γ secretion, while those from OE19_PD-L1 and OVK18_PD-L1_A2 failed to activate MDG1015. As already noted above, SW780_PD-L1_A2 and OVK18_PD-L1_A2 expressed only low levels of NY-ESO-1/LAGE-1a mRNA (Figure 2c), and OE19_PD-L1 showed a reduced cell surface HLA-A2 expression, providing a potential explanation for the reduced or lacking activation of MDG1015. All four antigen-positive, PD-L1-expressing 3D tumor spheroids tested were efficiently lysed by MDG1015, whereas the antigen-negative 647-V spheroids and those cultured with UT T cell batches were not affected (Figure 3b, 647-V unpublished observation). Robust and consistent killing was observed across all tumor spheroids co-cultured with Allo-A2-TCR-T cells, demonstrating sufficient cell surface HLA-A2 expression in the tumor spheroids tested.

3.3. Enhanced Functionality of MDG1015 upon PD-L1:CSP Interaction

3.3.1. Increased IFN-γ Secretion and Tumor Cell Killing

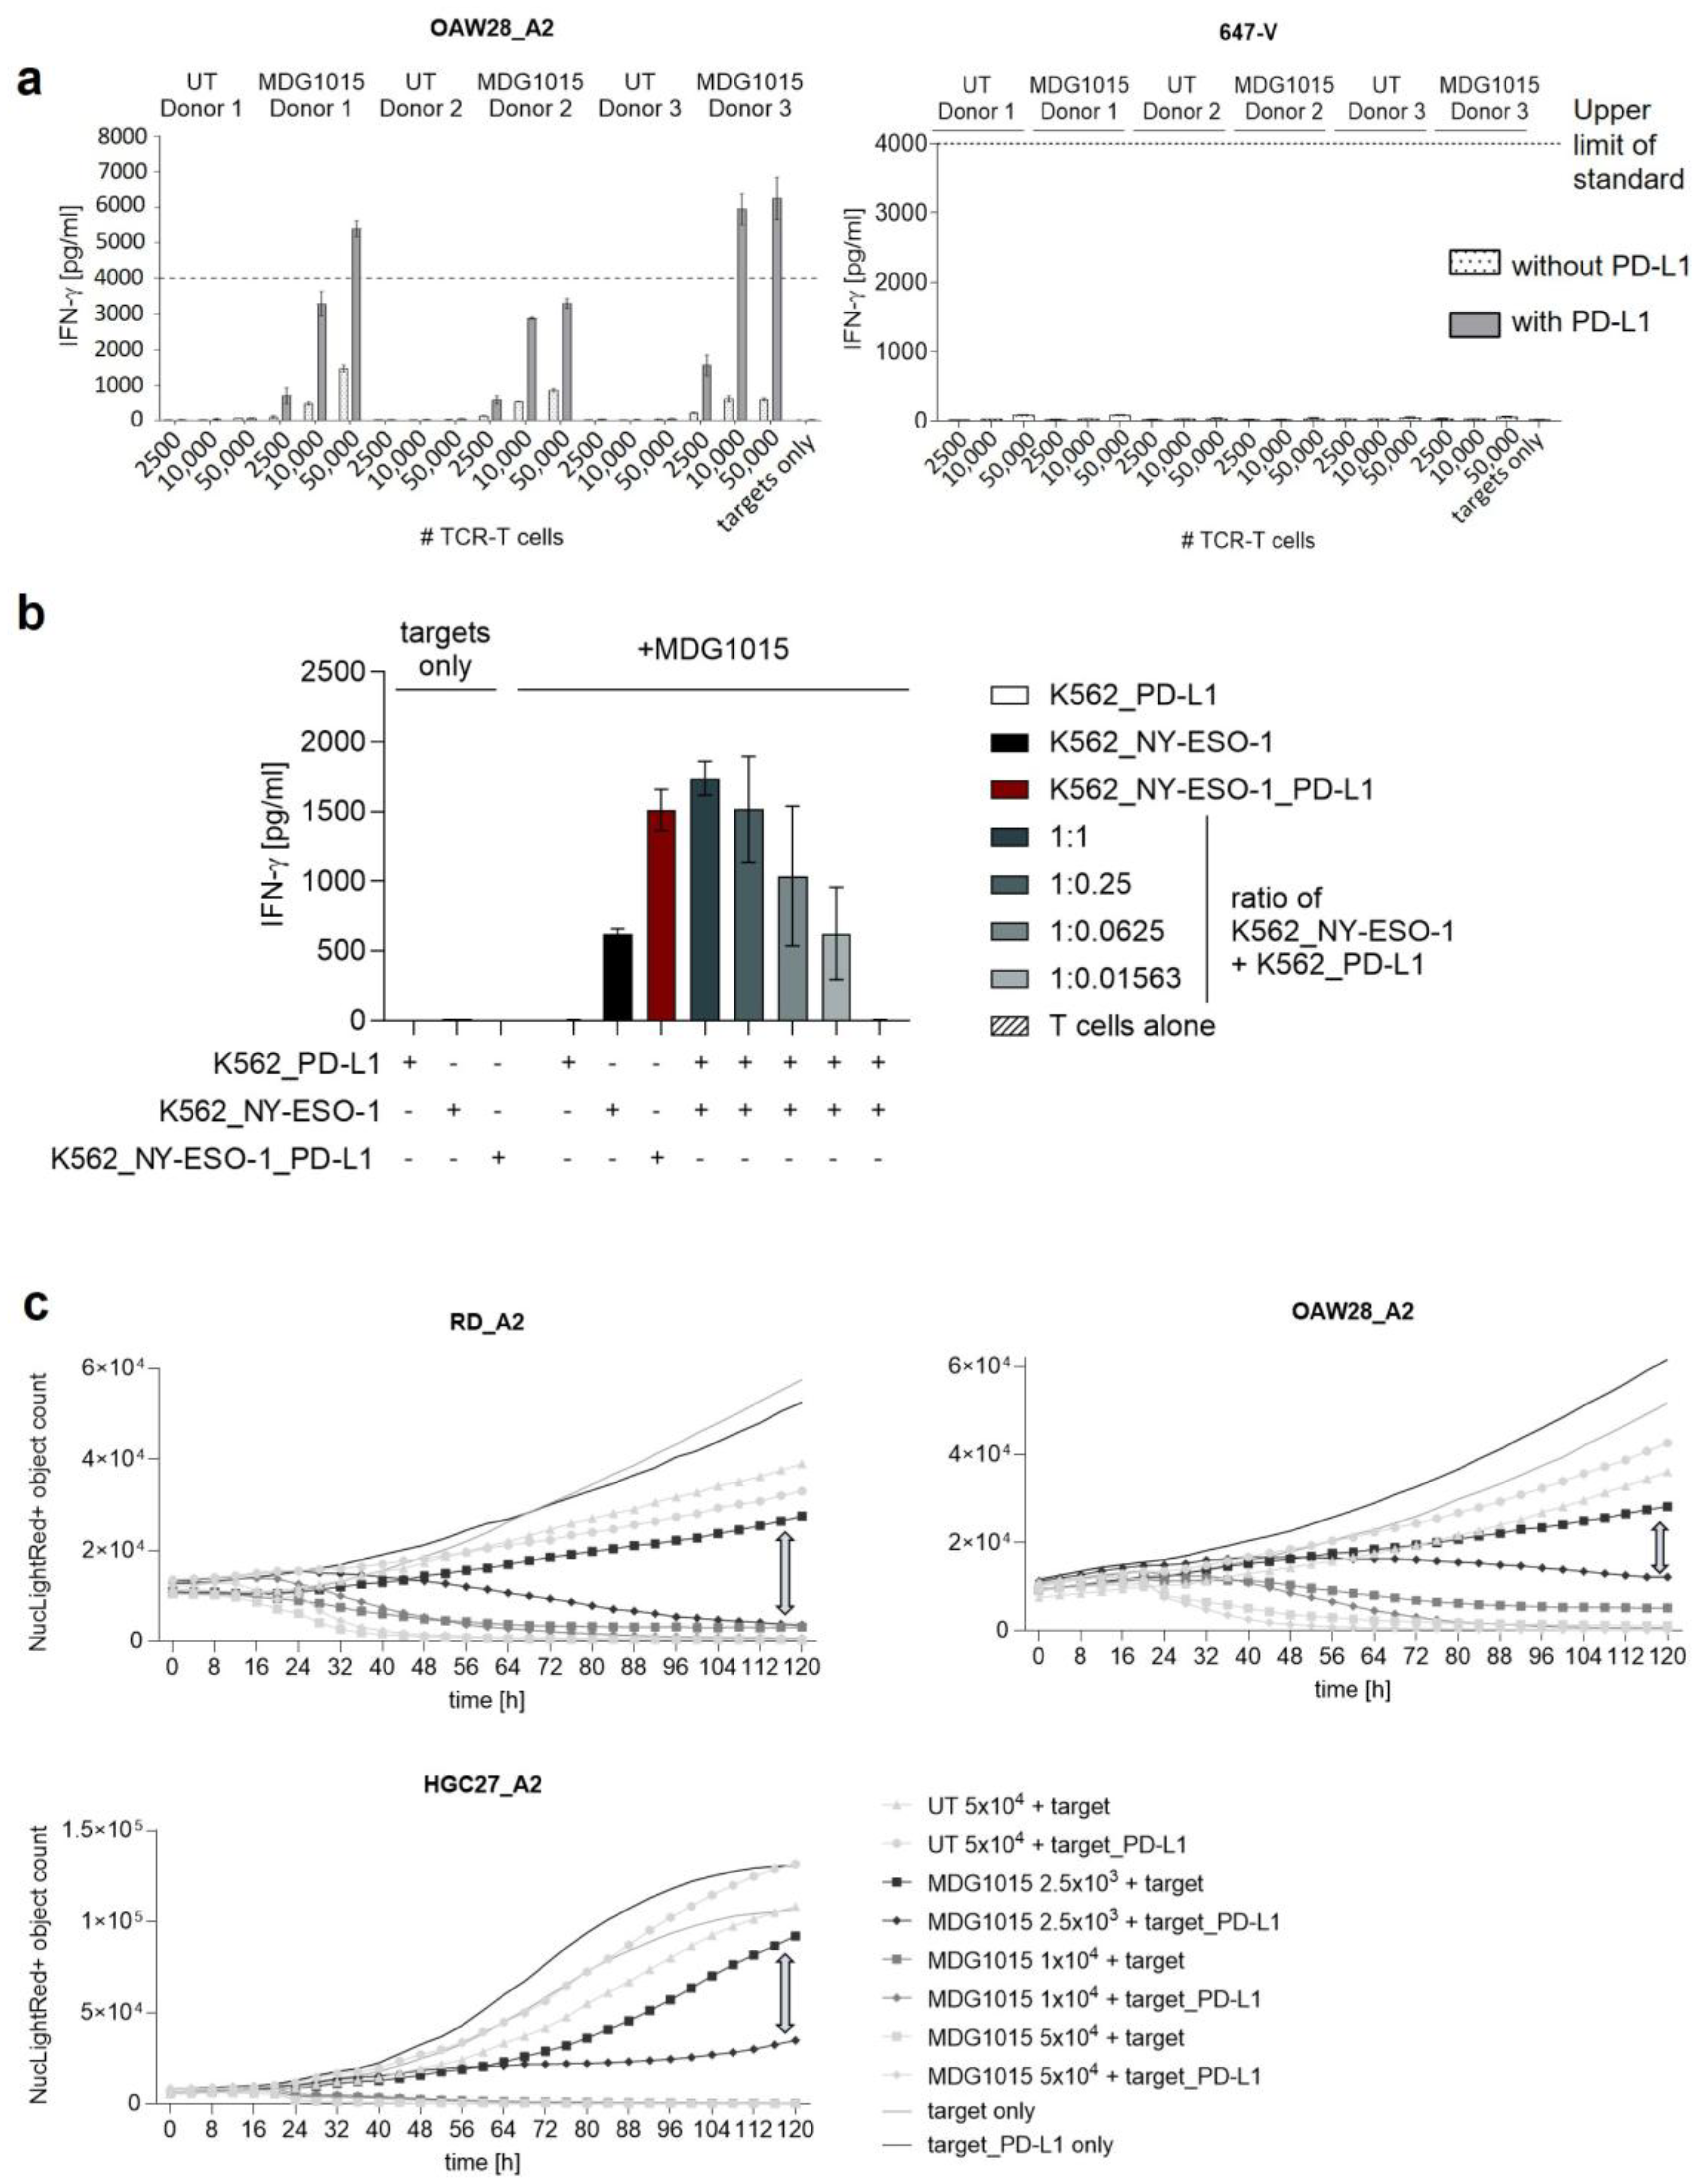
Enhanced functionality of MDG1015 upon activation of the CSP was assessed in co-cultures with PD-L1-positive and -negative tumor cell lines. IFN-γ release by MDG1015 upon encounter of tumor cells overexpressing the CSP ligand PD-L1 was compared to the parental tumor cell line lacking PD-L1 expression (Figure 4a). MDG1015, but not UT T cells, released higher amounts of IFN-γ when target cells expressed PD-L1. Importantly, the PD-L1:CSP interaction triggered the stronger release of IFN-γ at all effector-to-target cell ratios tested. The IFN-γ release was not detected in co-cultures with antigen-negative tumor cells, demonstrating the antigen-dependent activation of MDG1015. Earlier preclinical experiments using NY-ESO-1/LAGE-1a TCR-T cells expressing or lacking CSP showed a stronger IFN-γ release in CSP-armored TCR-T cells upon the encounter of antigen-positive, PD-L1-positive tumor cell lines, indicating the increased functionality of CSP-armored TCR-T cells compared to TCR-T cells lacking CSP expression (Supplementary Figure S4a). To analyze whether PD-L1 stimulation needs to be provided by the antigen-positive tumor cell itself (cis engagement) or whether PD-L1 could be provided by another cell in close proximity (trans engagement), three target cell lines were generated to dissect stimulation via the CSP and the TCR, namely K562 cells overexpressing PD-L1 only, NY-ESO-1 only, or both NY-ESO-1 and PD-L1. As demonstrated above, MDG1015 released higher concentrations of IFN-γ upon encountering K562_NY-ESO-1_PD-L1 cells compared to K562_NY-ESO-1 cells lacking PD-L1 (Figure 4b). Strikingly, higher functionality upon the PD-L1:CSP interaction was also observed when PD-L1 and SLL peptide-HLA were provided on separate target cells at various ratios. Of note, IFN-γ release by MDG1015 was only observed in the presence of antigens.
Having proven a clear CSP-mediated enhancement in the IFN-γ release, the impact of CSP activation on target cell killing was evaluated. A real-time killing assay was performed using live-cell imaging via the IncuCyte® S3 and NucLight Red®-labeled antigen-positive tumor cell monolayers overexpressing or lacking PD-L1. MDG1015 eliminated tumor cell lines most efficiently when PD-L1 was expressed on the respective target cells (Figure 4c). The differences were most pronounced when effector cell counts were lower, a setup that might reflect the in vivo situation when lower dose levels of TCR-T cells are applied.

3.3.2. Increased Polyfunctionality and Proliferation

As shown above for target cell killing and MDG1015-mediated IFN-γ release, MDG1015 functionality is clearly increased upon the PD-L1:CSP interaction. To better understand the mode-of-action of MDG1015, we additionally analyzed MDG1015 polyfunctionality, defined by the secretion of multiple cytokines and chemokines, on both the bulk and single-cell levels.
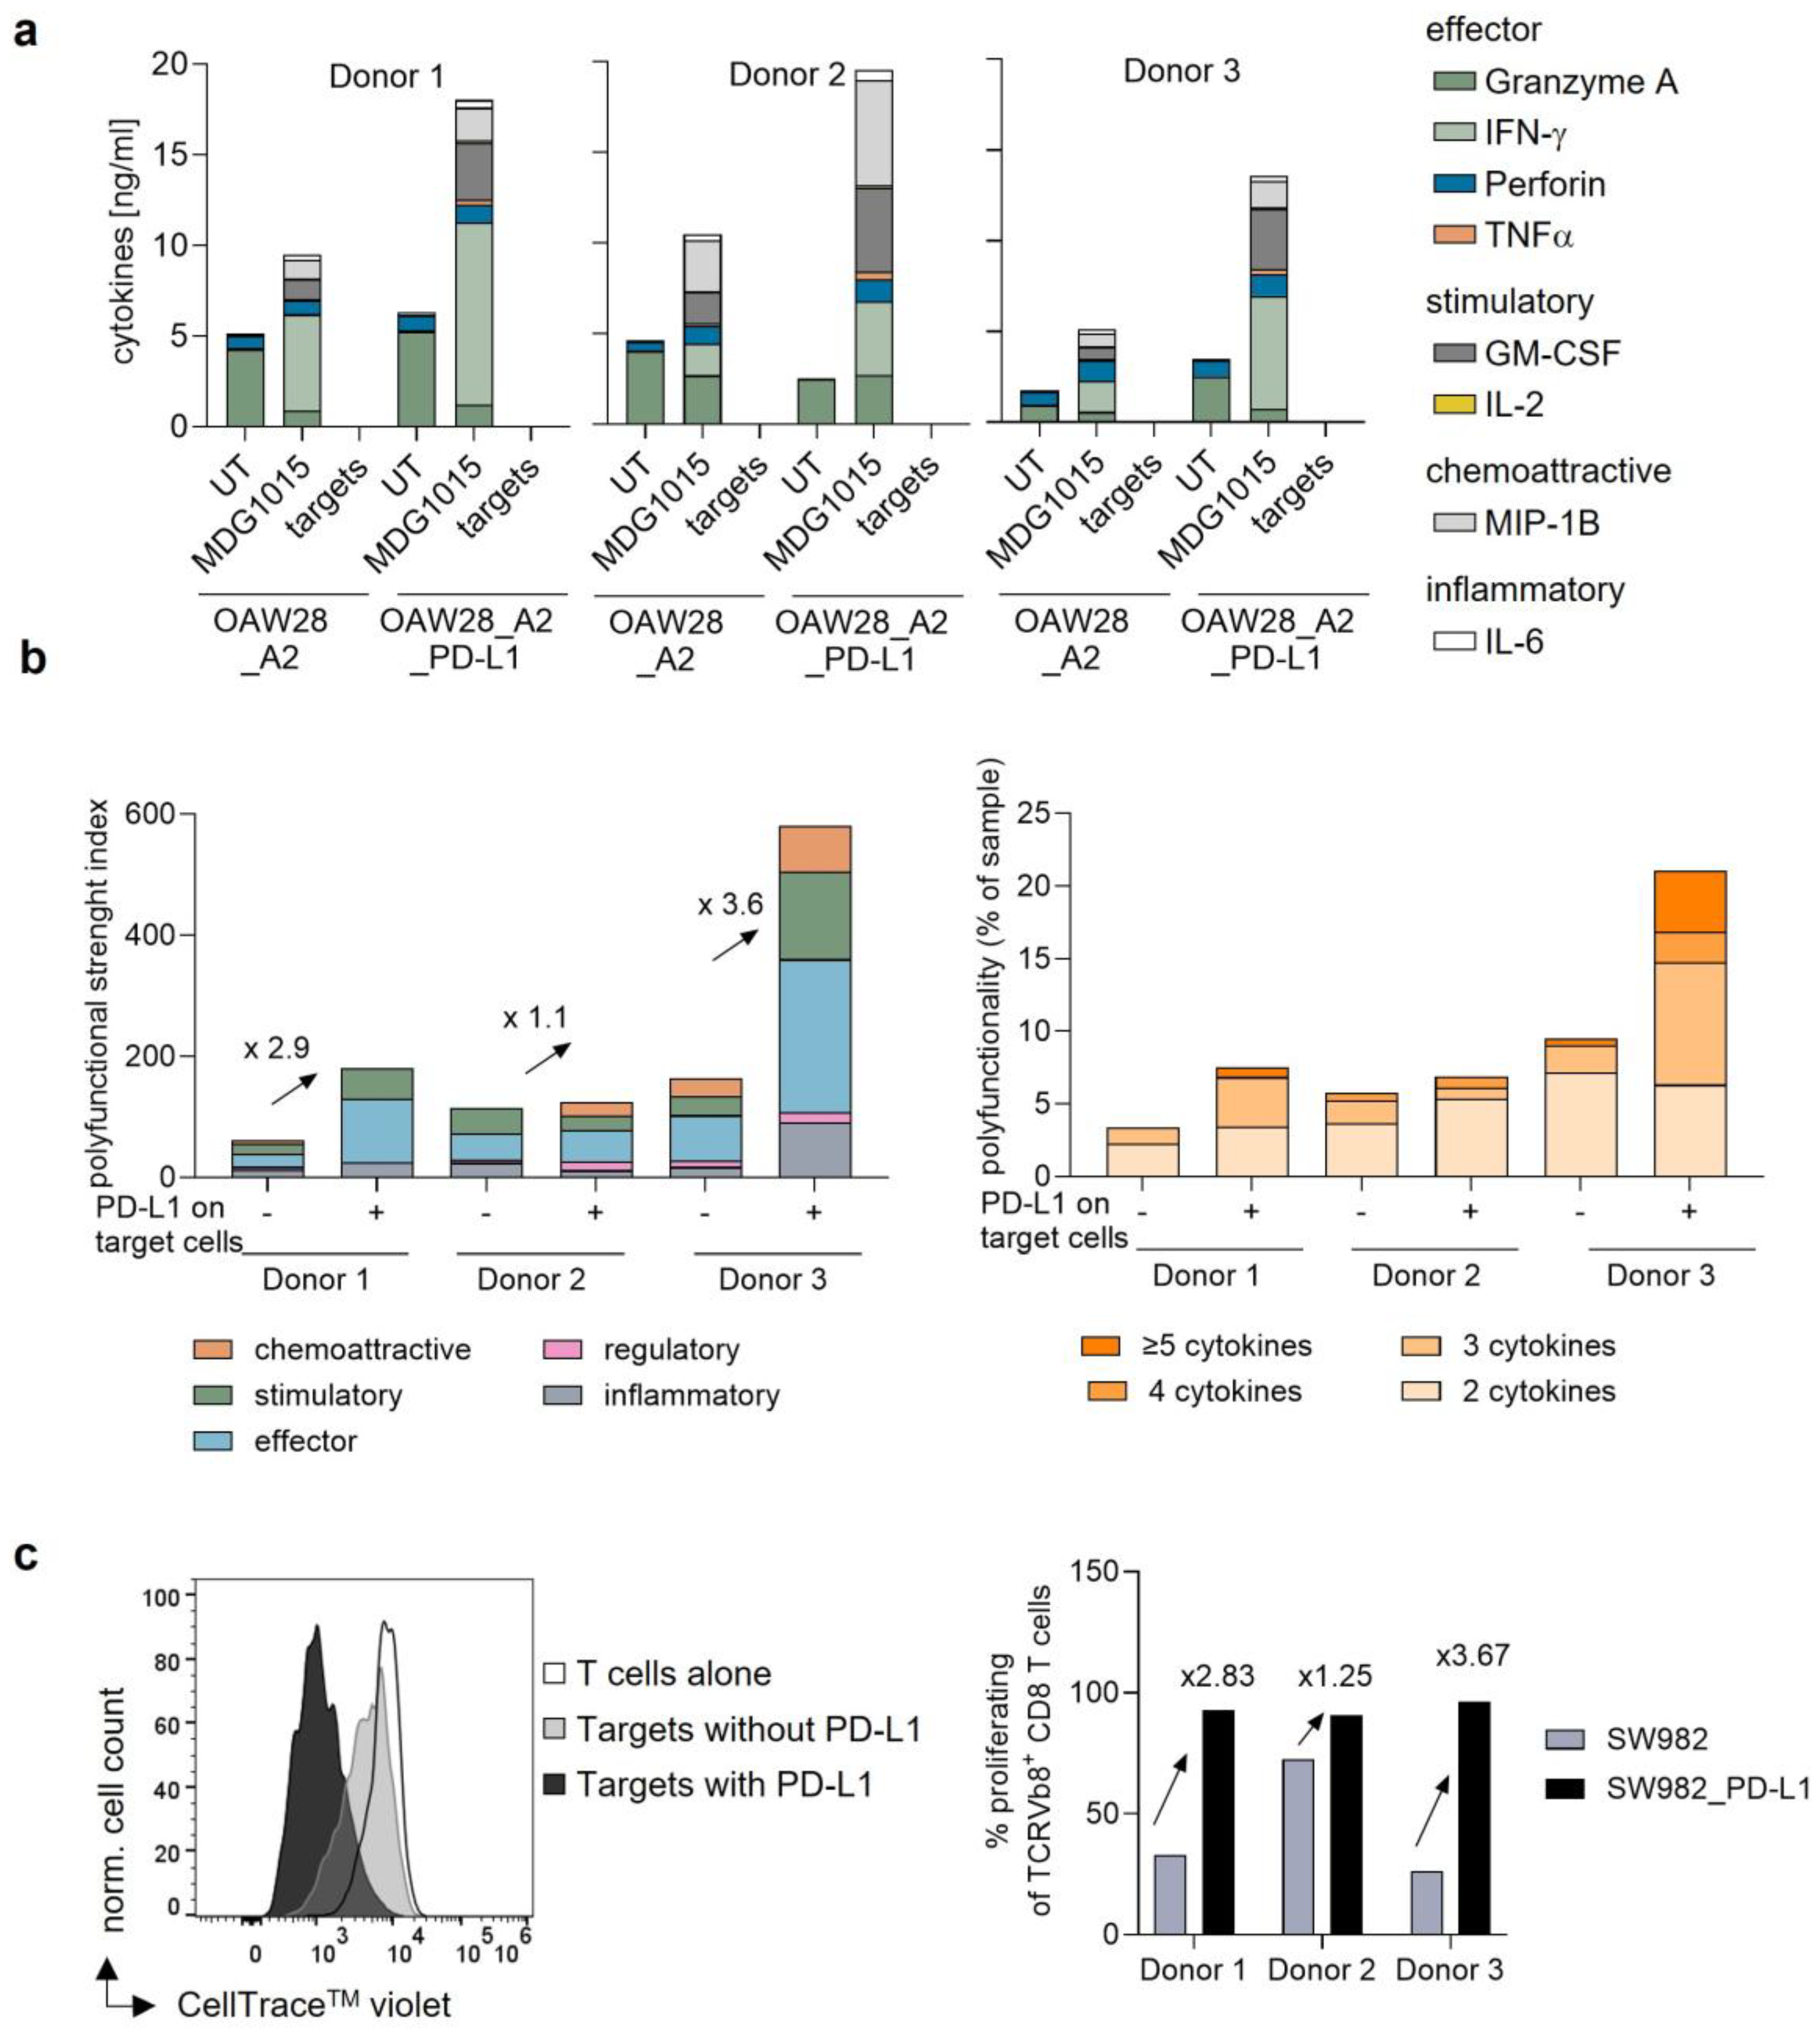
At the bulk level, poly-cytokine secretion by MDG1015 increased in co-cultures with tumor cell lines expressing PD-L1 compared to tumor cell lines lacking PD-L1 (Figure 5a). The increase was mainly driven by increased levels of IFN-γ, GM-CSF, and MIP-1β. Additionally, a minor increase in TNF-α secretion was observed in the presence of PD-L1. Importantly, the IL-6 secretion by MDG1015 was not increased upon co-culture with PD-L1-positive target cells compared to PD-L1-negative target cells. In summary, costimulation through the CSP resulted in an increase in effector, stimulatory, and chemo-attractive, but not inflammatory, cytokine release.
Since the analysis of poly-cytokine release at the bulk level does not demonstrate the polyfunctionality of individual TCR-T cells, poly-cytokine release was also determined at the single-cell level. The polyfunctional strength index visualizes the frequency of cells secreting cytokines as well as the intensities of cytokine secretion. The cytokines analyzed belong to five distinct groups of proteins, i.e., chemo-attractive, stimulatory, effector, regulatory, and inflammatory cytokines. MDG1015 secreted mainly effector as well as stimulatory cytokines (Figure 5b). Increased poly-cytokine secretion was observed in two of three MDG1015 batches tested in co-cultures with tumor cell lines expressing PD-L1. This increase was observed for chemo-attractive, stimulatory, and inflammatory cytokines. As already observed in the bulk poly-cytokine secretion analysis described above, levels of secreted inflammatory cytokines, especially IL-6, were very low. Polyfunctionality visualizes the frequency of T cells secreting two or more cytokines simultaneously (Figure 5b). MDG1015 showed an increased poly-cytokine secretion after co-culture with SW982_PD-L1 compared to SW982 lacking PD-L1 expression. This increase was most pronounced in MDG1015 derived from donors 1 and 3 and was due to an increased percentage of MDG1015 secreting three or more cytokines.
In addition to cytokine secretion, MDG1015 proliferation was analyzed as part of the performed set of mode-of-action studies. Tumor cell-induced proliferation of MG1015 was analyzed by FC after stimulation with the sarcoma cell line SW982 expressing or lacking PD-L1 after three days of co-culture via dilution of the CellTrace™ dye. A higher frequency of MDG1015 showed proliferation upon contact with SW982 compared to MDG1015 in the absence of tumor cells, indicated by the reduced CellTrace™ fluorescence intensity (Figure 5c). Interestingly, an increase in proliferating cells was observed after the co-culture with PD-L1-positive SW982 compared to PD-L1-negative SW982 cells, indicating the enhanced proliferation of MDG1015 upon the PD-L1:CSP interaction. Notably, increased proliferation and single-cell poly-cytokine release of CSP-armored TCR-T cells induced upon the PD-L1:CSP interaction was already observed in earlier preclinical experiments comparing NY_ESO-1/LAGE-1a TCR-T cells expressing or lacking the CSP (Supplementary Figure S4b,c).

3.4. Safety of MDG1015

The safety of MDG1015 was analyzed using various panels of antigen-negative cell lines and healthy cell types, as well as in response to a selection of mismatched peptides identified via the computational tool Expitope® 2.0 [22], which showed high sequence homologies to the target peptide epitope SLLMWITQC (Table 1). As outlined above, MDG1015 showed superior functional properties upon the encounter of antigen-positive, PD-L1-expressing target cells mediated by the CSP. Increased functionality via the CSP, however, might compromise the safety of MDG1015 in the presence of PD-L1. Therefore, various functional characteristics of MDG1015, such as functional avidity, antigen-specificity, and cytokine- and antigen-independent proliferation in the presence of PD-L1, were thoroughly analyzed.
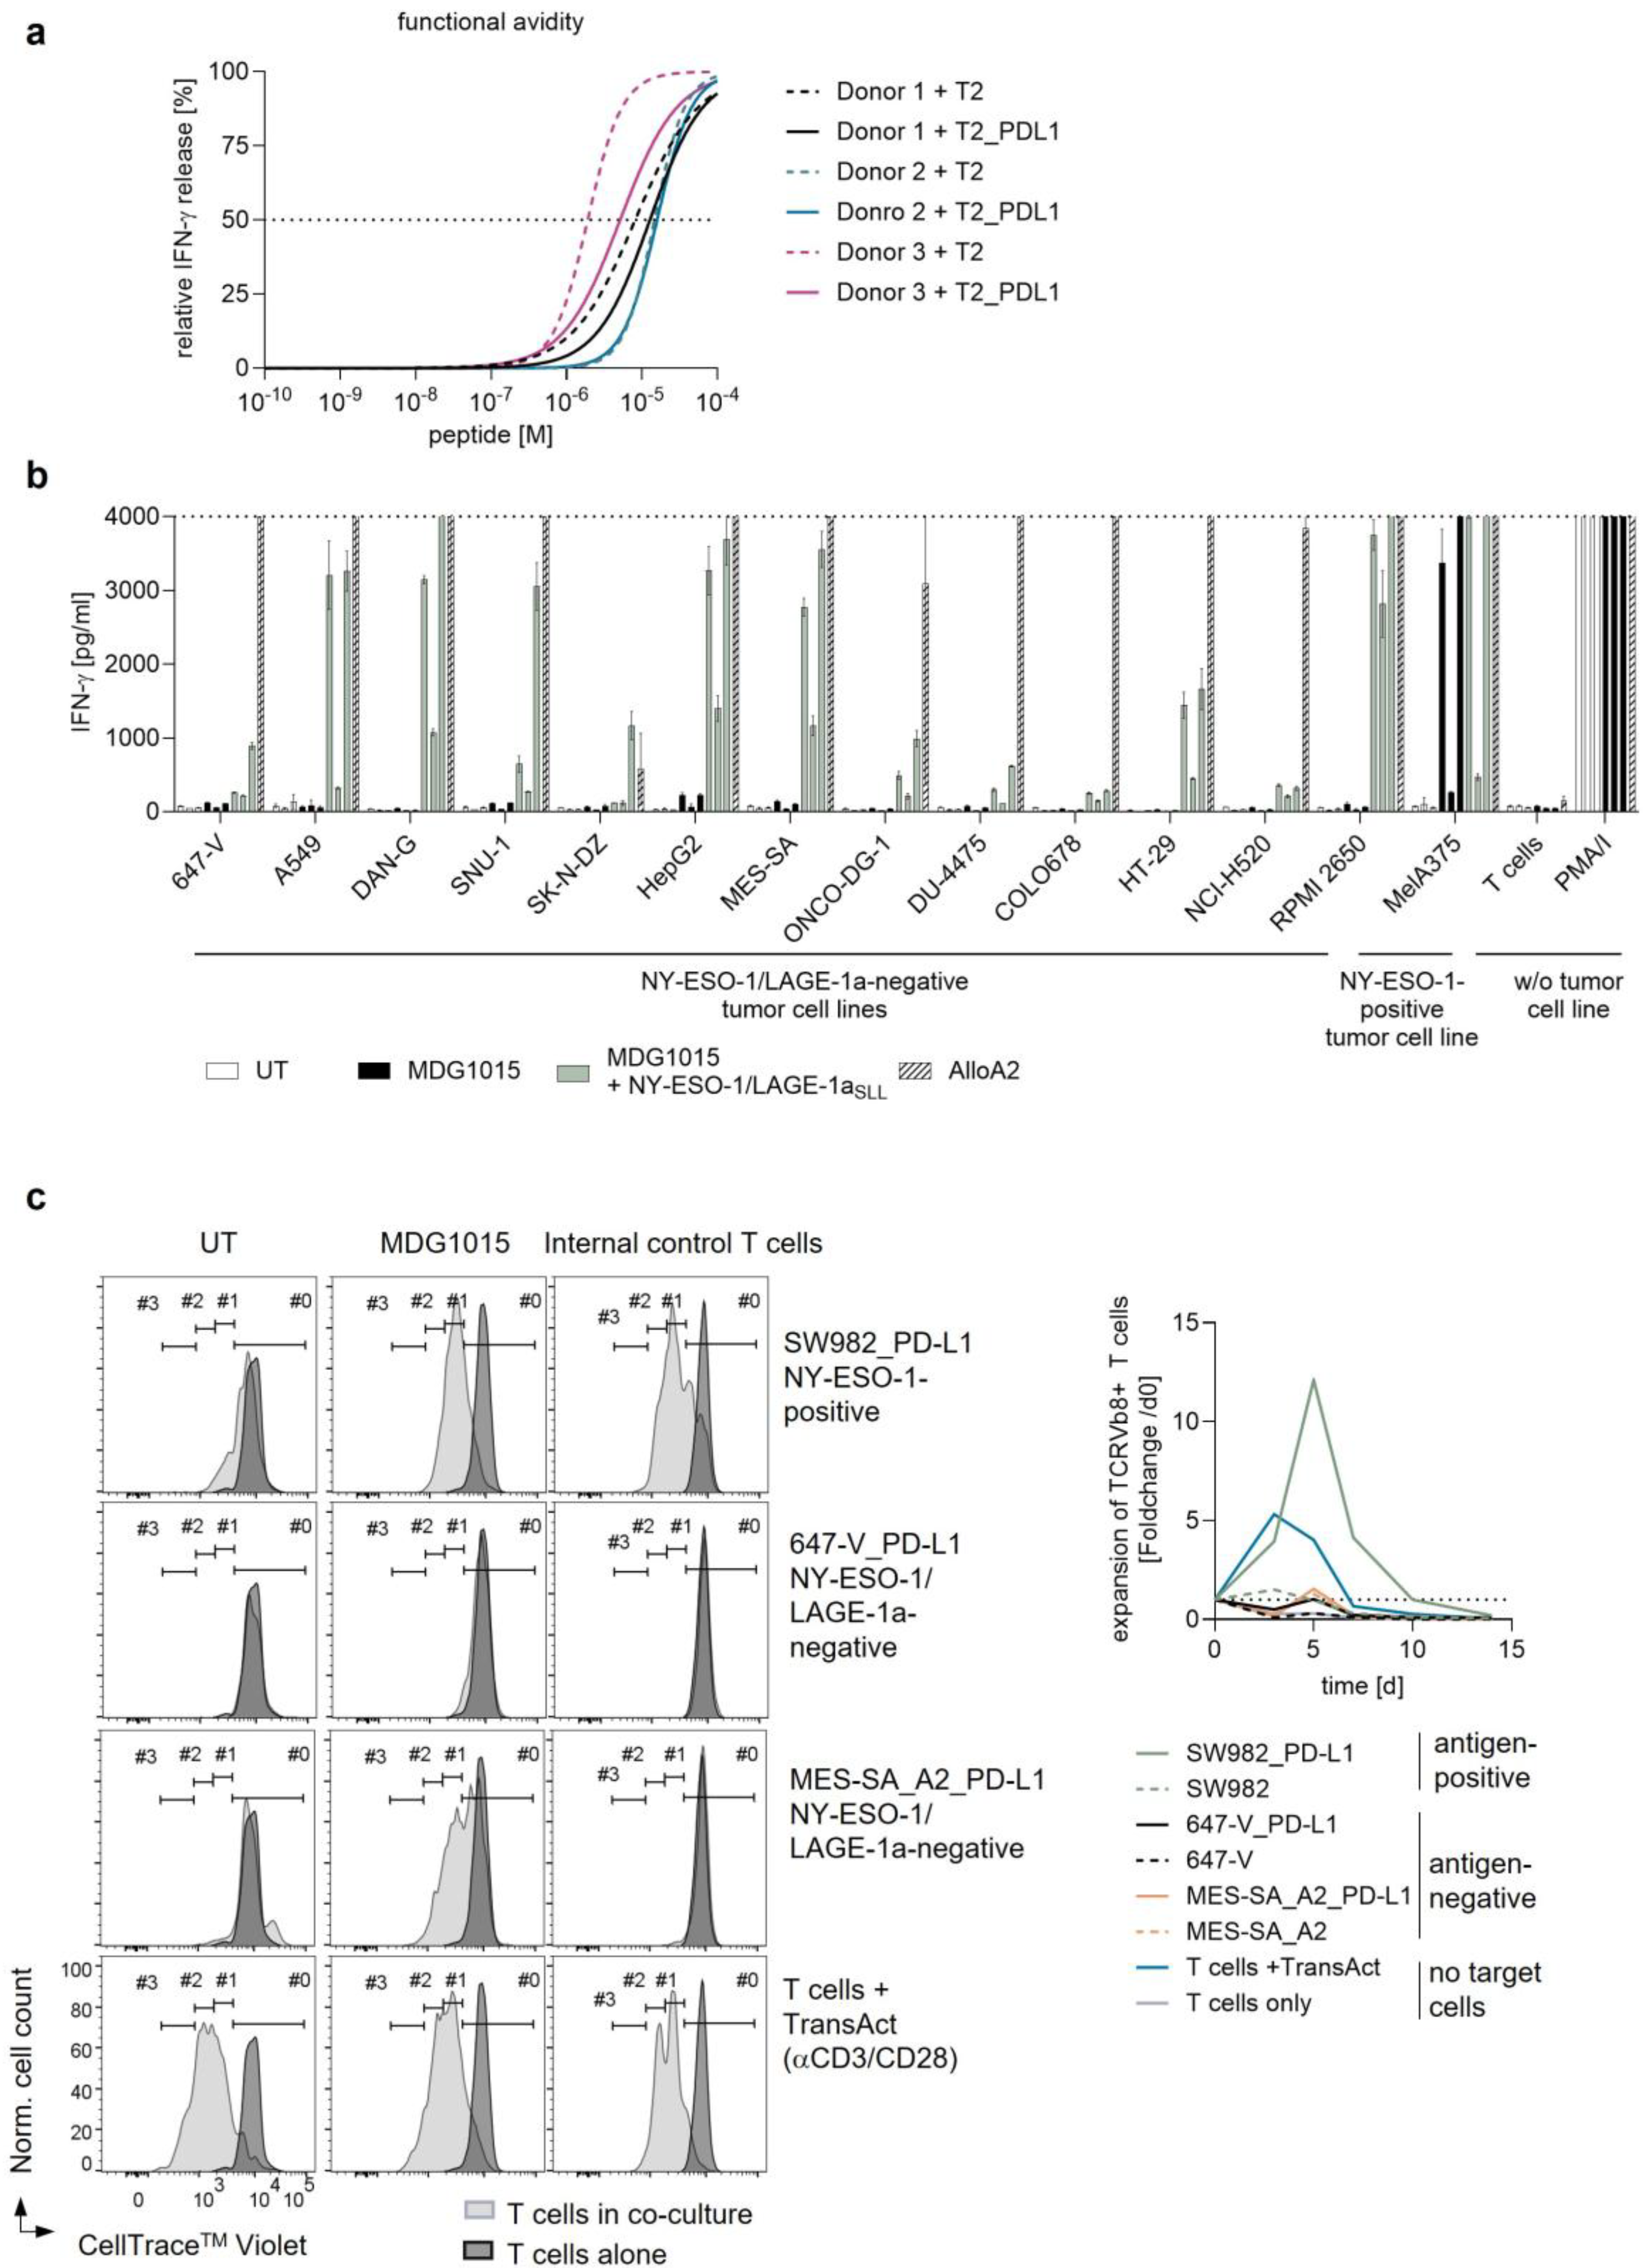
Functional avidity of MDG1015, representing the sum of affinities of single molecular interactions between MDG1015 and target cells, was analyzed using the transporter associated with the antigen processing (TAP)-deficient HLA-A*02:01-expressing B-lymphoblastoid cell line T2, lacking or overexpressing PD-L1. T2 and T2_PD-L1 were externally loaded with the 10−4 M to 10−11 M NY-ESO-1/LAGE-1a SLL peptide, and recognition by MDG1015 was analyzed via IFN-γ release. Therefore, the potential impact of PD-L1:CSP interaction on the functional avidity of MDG1015 was evaluated. For MDG1015 co-cultured with T2 cells, EC50 values ranged from 1.46 × 10⁻⁵ M (donor 2)–1.91 × 10⁻⁶ M (donor 3) (Figure 6a), which were comparable to T2_PD-L1 target cells, where EC50 values of 1.59 × 10⁻⁵ M (donor 2) to 5.13 × 10⁻⁶ M (donor 3) were detected.
The safety of MDG1015 against antigen-negative targets was evaluated using a panel of antigen-negative tumor cell lines comprising 13 NY-ESO-1/LAGE-1a-negative, PD-L1-positive tumor cell lines. Therefore, potential MDG1015-mediated off-target/off-tumor toxicities, i.e., cross-recognition of epitopes showing high sequence homologies to the target epitope NY-ESO-1/LAGE-1a SLL, were evaluated. Additionally, this approach allowed for the detection of a potential TCR-independent activation of MDG1015 via the CSP alone. IFN-γ release of MDG1015 was used as a surrogate read-out for tumor cell killing, since multiple in vitro co-culture analyses using MDG1015 have consistently shown a clear correlation of target cell killing and IFN-γ release. Importantly, none of the NY-ESO-1/LAGE-1a-negative tumor cell lines were cross-recognized by MDG1015, as seen with the UT T cells (Figure 6b). Only the positive controls, i.e., the NY-ESO-1/LAGE-1a-positive, PD-L1-overexpressing tumor cell line MelA375_PD-L1, as well as NY-ESO-1/LAGE-1a SLL peptide-loaded target cells, were recognized by MDG1015. In addition, earlier preclinical experiments using NY-ESO-1/LAGE-1a TCR-T cells co-expressing the CSP showed that antigen-negative, PD-L1-positive 3D tumor spheroids were not cross-recognized in the presence of antigen-positive, PD-L1-positive 3D tumor spheroids, indicating that, even in an activated state, CSP-equipped TCR-T cells do not show the cross-recognition of innocent bystander cells (Supplementary Figure S5).
Antigen-independent proliferation by MDG1015 was evaluated using co-cultures of antigen-positive or -negative, PD-L1-positive tumor cell lines. Importantly, MDG1015 cultured in the absence of tumor cell lines or in co-cultures with the NY-ESO-1/LAGE-1a-negative cell lines 647 V or 647-V_PD-L1 did not proliferate within three days, as indicated by the CellTrace dilution in FC (Figure 6c). In co-cultures with the NY-ESO-1/LAGE-1a-negative cell lines MES SA_A2 or MES-SA-A2_PD-L1, only a very weak proliferation of MDG1015 was observed on day three. As already shown above, MDG1015 proliferated after three days of co-culture with the NY-ESO-1/LAGE-1a-positive cell lines SW982 or SW982_PD-L1. Activation with the stimulation reagent TransAct triggered the proliferation of MDG1015 and UT T cells, verifying the general functionality and viability of the T cell batches tested.
In addition to cell proliferation, the expansion of MDG1015 was analyzed. MDG1015 expanded upon the encounter of the NY-ESO-1/LAGE-1a-positive tumor cell line SW982 expressing or lacking PD-L1 and peaked on day 5 or day 7 (Figure 6c). All TCR-T cell batches tested did not expand further after day 5 (donors 2 and 3) or day 7 (donor 1). A slight and only transient re-expansion after an initial decline of MDG1015 cell counts was observed on day 5 of the co-culture with NY-ESO-1/LAGE-1a-negative MES-SA_A2_PD L1 cells. The MDG1015 did not expand from day 5 in co-cultures with NY-ESO-1/LAGE-1a SLL-negative cell lines but rapidly declined in cell numbers, demonstrating a robust expansion upon antigen encounter as well as the favorable safety profile of MDG1015.
To evaluate the potential for unexpected “off-target/off-tumor” toxicities, a panel of 16 healthy human cell types (Figure 7a) comprising primary cells as well as induced pluripotent stem cell (iPSC)-derived cells representing various vital tissues or organs, such as heart, lungs, brain, and liver, were tested in co-cultures with MDG1015. The analyzed panel of healthy cells tested negative for the expression of NY-ESO-1 and LAGE-1a mRNA via qPCR (Supplementary Figure S6a), whereas the cell surface protein expression of PD-L1 was detected in renal cortical epithelial cells (HRCEpC) and mature dendritic cells (mDC), with a weak expression in HRCEpC and an increased expression in mDC (Supplementary Figure S6b). The potential activation of MDG1015 was measured by the detection of T cell-derived IFN-γ (or IL-2 for neurons [GABANeuro]) in co-culture supernatants, as well as the analysis of changes in healthy cell morphology and cell layer confluency, indicating the induction of apoptosis in target cells.
13 out of 16 healthy human cell types (cardiomyocytes (iCardio), cardiac artery epithelial cells (HCAEC), coronary fibroblasts (HCF), bronchial epithelial cells (NHBE), lung fibroblasts (NHLF), HRCEpC, renal proximal tubular epithelial cells (RPTEC), neurons (iGABANeuro), Hepatocytes (iHep), endothelial cells (iEC), dermal fibroblasts (NHDF), monocytes (Mono), and B cells) were not cross-recognized by MDG1015, shown by the lack of IFN-γ (or IL-2 for iGABANeuro) release by MDG1015 in co-cultures with the respective cell types. Target cells loaded with NY-ESO-1-/LAGE-1a SLL peptide served as positive controls and were recognized, as indicated by the IFN-γ or IL-2 release. (Figure 7b).
Astrocytes (iAstro) were cross-recognized by one of the three MDG1015 batches tested, inducing low levels of IFN-γ (3.4-fold above UT control). Osteoblasts (HOB) were recognized at very low levels by two of three MDG1015 batches (IFN-γ 2-fold above the UT control in donor 1 and 7.8-fold above the UT control in donor 3). However, the cross-recognition of Astrocytes and osteoblasts could not be confirmed in a second experiment including additional healthy cell batches (unpublished observations). For hematopoietic target cell types, target cells of different donors were used for co-cultures with MDG1015, including donors matching the donors used for the preparation of the MDG1015 batches. Monocyte-derived mDC derived from donor A (=T cell donor 2) did not trigger IFN-γ release; however, mDC derived from donor B (=T cell donor 3) triggered a 9-fold increase in IFN-γ release when co-cultured with autologous MDG1015. The cross-recognition of mDC could not be entirely de-risked using additional mDC preparations and even showed recognition of an LAGE-1a mRNA-positive mDC batch, which was deemed to represent an exception, since all other mDC batches analyzed did not exhibit the expression of either NY-ESO-1 or LAGE-1a mRNA (unpublished observations).
Importantly, none of the 16 healthy target cell types tested were lysed by MDG1015. In contrast, NY-ESO-1/LAGE-1a SLL peptide-loaded target cells used as positive controls induced MDG1015 activation and were ultimately lysed by MDG1015. Exposing target cells, with or without the NY-ESO-1/LAGE-1a SLL peptide, to Allo-A2 TCR-T cells led to the killing of target cells. Real-time imaging did not show the killing of iAstro or HOB, the cell types that were weakly cross-recognized by MDG1015, as indicated by low levels of IFN-γ release. Phase contrast imaging as well as AI-driven confluency analysis using the IncuCyte S3 system is shown with exemplary data for iCell Hepatocytes in Supplementary Figure S6c,d. The killing of monocytes, mDCs, and B cells could not be properly evaluated via the IncuCyte S3® imaging system due to the difficulty of evaluating the lysis of suspension target cells using this assay setup. However, since monocytes and B cells were not cross-recognized by MDG1015, as shown by the lack of IFN-γ release, they are not expected to be lysed by MDG1015.

4. Discussion

Adoptive cell therapy using engineered T cells represents a promising therapeutic approach for the treatment of various tumor indications [23]. The application of CAR-T cells has shown a promising clinical efficacy in patients suffering from B cell-driven hematological malignancies [1,2,3,4,5]; however, this therapeutic approach remains limited to only a few suitable and safe cell surface target antigens that mainly target hematological malignancies [2]. In contrast, TCR-T cells show the capacity to recognize peptides derived from intracellular proteins, which represent the majority of antigens, thereby rendering TCR-guided immunotherapy as an approach with much a broader potential application, especially for solid tumor indications.
Despite the success of engineered T cell therapy in hematological malignancies, clinical efficacy in solid tumors, representing most malignancies, still remains limited [24]. A major limitation for clinical efficacy is the presence of a hostile TME in solid tumors, which inhibits T cell function, thereby preventing effective anti-tumor responses. Multiple factors in the TME contribute to immune cell inhibition, including inhibitory cytokines or chemokines, immuno-suppressive cells, and the expression of inhibitory immune checkpoint ligands on tumors and other cells [6]. The immune checkpoint PD-1 receptor is upregulated on activated T cells and binds to PD-L1, which can be upregulated on healthy tissues under pro-inflammatory conditions, thereby preventing autoimmunity [25]. However, PD-L1 is also expressed in diverse tumor indications, leading to the inhibition of tumor-specific T cells [26,27,28,29].
The broad clinical success of immune checkpoint inhibitors targeting PD-1 or PD-L1 demonstrating long-lasting tumor remission in certain blood cancers and solid tumors showed the exceptional role of the PD-1:PD-L1 axis for the activation or inhibition of an effective T cell-driven anti-tumor response [30,31]. However, systemic treatment with checkpoint inhibitors can also trigger severe immune-related adverse events that heavily compromise the quality of life of patients and often require additional medical interventions or even the termination of treatment [32]). Furthermore, some patients do not benefit from treatment with immune checkpoint inhibitors, since their efficacy depends on various intrinsic characteristics of the tumor and TME, such as the presence of tumor-infiltrating lymphocytes, a high tumor mutational burden, or the expression of PD-L1 [33]. Actually, combining immunomodulatory antibodies and the adoptive transfer of engineered T cells has been shown to represent a promising therapeutic approach for tumors that show a lack of T cell infiltration [34].
To overcome some of the current limitations of adoptive T cell therapy in solid tumors and avoid additional systemic antibody treatment, we developed a third generation TCR-T cell product consisting of autologous CD8+ T cells co-expressing a NY-ESO-1/LAGE-1a-specific TCR and the CSP PD1-41BB (MDG1015). NY-ESO-1 and LAGE-1a are well-described C/T antigens that have already been safely targeted by TCR-guided immunotherapies in various clinical studies, but clinical efficacy has been limited so far [18,19]. The NY-ESO-1/LAGE-1a-specific TCR used in MDG1015 was thoroughly analyzed for specificity, sensitivity, and safety and has shown favorable preclinical characteristics to allow its use for adoptive T cell therapy. By introducing the PD1-41BB CSP into MDG1015, the inhibitory signal provided by the engagement of PD-1 with PD-L1 can be turned into a costimulatory one, thereby leading to less TCR-T cell exhaustion after multiple rounds of antigen stimulation and enhanced TCR-T cell functionality [13]. We have previously shown the co-expression of this CSP-enhanced TCR-T cell functionality against antigen-positive, PD-L1-expressing tumor cells using PRAME TCR-T cells [13]. The mode-of-action analyses described in this previous publication focused on the differential activation of TCR-T cells lacking or expressing the CSP, whereas the current experiments presented here focus on the differential activation of CSP-armored TCR-T cells by different target cell types, expressing or lacking varying levels of PD-L1. Importantly, our previous studies using PRAME TCR-T cells clearly demonstrated that TCR-T cells carrying the CSP showed superior tumor cell killing after serial challenges using 3D tumor spheroids, indicating a lower degree of TCR-T cell exhaustion after serial antigen encounter in the presence of the CSP. Furthermore, in vivo studies in xenograft mouse models using PRAME TCR-T cells showed the superior clearance of antigen-positive, PD-L1-positive tumor cells by CSP-equipped TCR-T cells compared to TCR-T cells lacking CSP expression, indicating less T cell exhaustion and superior T cell functionality mediated via CSP costimulation [13]. In addition, these preclinical studies confirmed the capability of CSP-equipped TCR-T cells to travel through the blood stream, persist, and penetrate solid tumor lesions. These analyses additionally included the extensive assessment of potential CSP-mediated toxicities as well as further elucidation of the mode-of-action of MDG1015 activation and costimulation.
MDG1015 functionality and toxicity was analyzed using three individual TCR-T cell batches manufactured from healthy donor material. Notably, previous unpublished experiments using additional batches of MDG1015 have shown comparable results as the analyses displayed above, enlarging the number of MDG1015 batches tested and broadening our conclusions to a greater number of individual healthy donors.
MDG1015 showed the efficient recognition of antigen-positive, PD-L1-positive tumor cells lines, as determined by the cytokine release and killing of tumor cells. Importantly, by comparing tumor cell lines expressing or lacking PD-L1, the MDG1015 functional enhancement in the presence of the PD-L1:CSP interaction was demonstrated for multiple properties of the TCR-T cells, including (poly-)cytokine release, tumor cell killing, and antigen-driven proliferation. Differences in inflammatory cytokine induction observed in multiple co-culture assays were likely due to assay-specific parameters. The single-cell secretomics assay showed a higher sensitivity in general and enabled the detection of cytokines released within a time period of 23 h after 20 h of co-culture, whereas the bulk poly-cytokine release assay measured cytokines released after 24 h of co-culture. Additionally, distinct tumor cell lines used for in vitro co-cultures assays may have influenced the TCR-T cell poly-cytokine pattern. Importantly, the release of inflammatory cytokines in the co-culture assays performed remained markedly lower than the release of effector or stimulatory cytokines, showing the favorable anti-tumor signature of poly-cytokine release mediated by CSP-equipped TCR-T cells. The observed higher functionality of MDG1015 in the presence of PD-L1 was in line with earlier preclinical studies comparing NY-ESO-1/LAGE-1a TCR-T cells expressing or lacking the CSP. CSP-armored NY-ESO-1/LAGE-1a TCR-T cells showed an increased IFN-γ release and poly-cytokine secretion as well as proliferation upon the encounter of antigen-positive, PD-L1-positive target cells, indicating that stronger functionality of CSP-armored TCR-T cells is mediated by the CSP:PD-L1 interaction.
Interestingly, the enhancement of TCR-T cell functionality was observed not only in cis engagement when PD-L1 and the targeted pHLA complex HLA-A*02:01/NY-ESO-1/LAGE-1a SLL were present on the same target cell, but it was also seen in a trans engagement when the target antigen and PD-L1 were separately expressed by neighboring cells. Since the PD-L1 expression required for CSP activation might be lacking on some tumor cells within a tumor lesion or absent in particular tumor indications [35,36,37], the trans engagement leading to optimal MDG1015 activation could be provided by other PD-L1-positive cell types present within the TME, such as tumor-associated macrophages or dendritic cells [38,39], thereby potentially boosting the MDG1015-mediated anti-tumor response in such situations. Importantly, enhanced target cell killing in the presence of CSP trans costimulation is not deemed to compromise the safety of MDG1015, since the studies described above displayed the TCR-gated activation of MDG1015 and lack of MDG1015 activation in the absence of the antigen. Additionally, previous preclinical studies using CSP-armored PRAME TCR-T cells in co-cultures with antigen-positive, PD-L1-positive tumor cell lines and antigen-negative, PD-L1-positive target cells have shown the exquisite spatial restriction of TCR-T cell-mediated target cell killing to antigen-positive target cells only [13]. The lack of innocent bystander killing by CSP-armored TCR-T cells was also shown in co-cultures using NY-ESO-1/LAGE-1a TCR-T cells, confirming the favorable safety profile of CSP-equipped TCR-T cells.
To evaluate whether the enhanced MDG1015 functionality mediated via CSP activation might trigger off-target/off-tumor toxicities, a panel of antigen-negative, PD-L1-expressing cell types was analyzed for cross-recognition by MDG1015. As already highlighted above, the activation of MDG1015 was found to be TCR-gated and did not occur in the absence of the antigen, as shown via cytokine release, killing, and proliferation upon the encounter of antigen-negative, PD-L1-positive target cells. Only some of the healthy cell types studied showed a low PD-L1 expression, with mDC representing the healthy cell type showing higher cell surface PD-L1 levels. All mDC batches tested were antigen-negative except for one that showed low levels of NY-ESO-1/LAGE-1a mRNA expression. Due to the additionally high cell surface expression of HLA-A2 and PD-L1, this antigen-positive mDC batch triggered cytokine release in MDG1015. However, the potential cross-recognition of mDC by MDG1015 is not deemed to be a safety concern because monocytes, representing precursor cells of mDCs capable of replenishing the pool of mDCs in vivo, were not (cross-)recognized by MDG1015, and the long-term clinical safety with DC vaccines using total RNA, also introducing self-antigens, showed no toxicity [40].

5. Conclusions

The third generation TCR-T cell product MDG1015 showed favorable preclinical characteristics, which qualify its use for the treatment of HLA-A*02:01-positive patients suffering from NY-ESO-1/LAGE-1a-positive solid tumors. Recognition of antigen-positive tumor cells is enhanced in the presence of PD-L1, whilst safety against antigen-negative target cells is not compromised. MDG1015 thereby represents a promising TCR-T cell product for the therapy of hard-to-treat, PD-L1-positive solid tumor indications with the potential to overcome some of the existing limitations of adoptive T cell therapy.

6. Patents

The NY-ESO-1/LAGE-1a TCR is covered by the patent WO2019/162043A1.

Supplementary Materials

The following supporting information can be downloaded at: https://www.mdpi.com/article/10.3390/ijtm5040045/s1, Table S1: Purity of MDG1015 batches after harvest; Figure S1: Cell surface expression of TRBV12 and PD-1 in MDG1015 and UT T cells; Figure S2: Cell surface expression of CD8 and murine TCR C beta region (mTCR) in TCR-T cells generated from healthy donor-derived CD8+ T cells expressing the allo-HLA-A2-reactive TCR T5.8-3-9 (Allo-A2 TCR-T cells) and UT controls; Figure S3: HLA-A2 and PD-L1 cell surface expression in tumor cell lines. Figure S4: Functionality of NY-ESO-1/LAGE-1a TCR-T cells expressing or lacking the CSP; Figure S5: Bystander killing of antigen-negative, PD-L1-positive target cells by activated NY-ESO-1/LAGE-1a TCR-T cells expressing the CSP; and Figure S6: Cross-recognition of antigen-negative healthy cells by MDG1015.

Author Contributions

Conceptualization, M.B. (Maja Bürdek), P.U.P., K.M., M.B. (Miriam Bosch), S.T., and C.G.; methodology, M.B. (Maja Bürdek), P.U.P., K.M., M.B. (Miriam Bosch), S.T., A.C., and C.G.; formal analysis, K.M., M.B. (Miriam Bosch), S.T., A.C., and S.M.; investigation, M.B. (Maja Bürdek), P.U.P., K.M., M.B. (Miriam Bosch), S.T., A.C., C.G., S.M., and G.L.; writing—original draft preparation, M.B. (Maja Bürdek), P.U.P., K.M., M.B. (Miriam Bosch), and C.G.; writing—review and editing, M.B. (Maja Bürdek), P.U.P., K.M., and D.J.S.; visualization, P.U.P., K.M., M.B. (Miriam Bosch), and C.G.; supervision, M.B. (Maja Bürdek), P.U.P., K.M., A.C., C.G., and D.J.S.; project administration, M.B. (Maja Bürdek) and D.J.S. All authors have read and agreed to the published version of the manuscript.

Funding

This research received no external funding.

Institutional Review Board Statement

The study was approved by Ethics Committee of the Bavarian State Chamber of Medicine (approval code No. 18010, approval date 13 April 2018).

Informed Consent Statement

Leukapheresis products obtained from healthy donors were provided by the commercial supplier Cyto-care.eu GmbH, Vienna, Austria, with cell collection performed in accordance with applicable current local regulations and requirements Leukapheresis from healthy donors was only performed after informed consent.

Data Availability Statement

The original contributions presented in this study are included in the article/Supplementary Material. Further inquiries can be directed to the corresponding author. Data will be available upon reasonable request by D.J.S.

Acknowledgments

We thank the current and former Translational Medicine team members Christiane Fingerhut, Angelika Helmbrecht, Isabel Römer, Isabel Schiedewitz and Andrea Nudlbichler and current and former Cell Therapy Process Development team members Sabine Eichenlaub and Magdalena Lippert for excellent technical assistance and the TCR discovery platform for technical and scientific contributions.

Conflicts of Interest

M.B. (Maja Bürdek), P.U.P., K.M., M.B. (Miriam Bosch), S.T., A.C., C.G., S.M., and G.L. were employees of Medigene Immunotherapies GmbH, a subsidiary of Medigene AG. D.J.S. served as Managing Director of Medigene Immunotherapies GmbH.

Appendix A

Table A1. Optimized tumor cell line media.
Tumor Cell LineCulture Medium
MelA375_NucLightRed_PD-L1RPMI 1640 + 2 mM L-glutamine + 1 mM sodium pyruvate + 1% MEM NEAA (all Thermo Scientific™, Waltham, MA, USA) + 10% FCS (Sigma-Aldrich, St. Louis, MO, USA) + 0.5 µg/mL Puromycin (invivogen, San Diego, CA, USA)
SW982_PD-L1_NucLightRedDMEM 1 g/l glucose + 2 mM L-glutamine + 1% MEM NEAA (all Thermo Scientific™, Waltham, MA, USA)+ 10% FCS + 0.5 µg/mL Puromycin
RD_HLA-A*02:01_NucLightRed_PD-L1DMEM 1 g/l glucose + 10% FCS + 2 mM L-glutamine + 1% MEM NEAA + 0.5 µg/mL Puromycin
HGC27_HLA-A*02:01_NucLightRed_PD-L1EMEM (ATCC, Manassas, VA, USA)+ 10% FCS + 2 mM L-glutamine + 1% MEM NEAA + 0.5 µg/mL Puromycin
SW780_ PD-L1_HLA-A*02:01_NucLightRedDMEM 1 g/l glucose + 10% FCS + 2 mM L-glutamine + 1% MEM NEAA + 0.5 µg/mL Puromycin
OE19_PD-L1_NucLightRedRPMI 1640 + 10% FCS + 2 mM L-glutamine + 1 mM sodium pyruvate + 1% MEM NEAA + 0.5 µg/mL Puromycin
HT1376_HLA-A*02:01_NucLightRedDMEM 4.5 g/l glucose (Thermo Scientific™, Waltham, MA, USA)+ 15% FCS + 2 mM L-glutamine + 1% MEM NEAA + 0.5 µg/mL Puromycin
OVK18_PD-L1_HLA-A*02:01_NucLightRedEMEM + 10% FCS + 2 mM L-glutamine + 1% MEM NEAA + 0.5 µg/mL Puromycin
JHOC-5_PD-L1_HLA-A*02:01_NucLightRedDMEM/Ham’s F12 + 10% FCS + 1% MEM NEAA + 0.5 µg/mL Puromycin
SH-10-TC_PD-L1_HLA-A*02:01_NucLightRedRPMI 1640 + 10% FCS + 2 mM L-glutamine + 1 mM sodium pyruvate + 1% MEM NEAA + 0.25 µg/mL Puromycin
OAW28_HLA-A*02:01_NucLightRed_PD-L1DMEM 1 g/l glucose + 2 mM L-Glutamine + 1 mM pyruvate + 10% FCS + 20 IU/mL insulin + 0.5 µg/mL Puromycin
647-V_NucLightRedDMEM 4.5 g/l glucose + 15% FCS + 2 mM L-glutamine + 1% MEM NEAA + 0.5 µg/mL Puromycin

References

  1. Neelapu, S.S.; Locke, F.L.; Bartlett, N.L.; Lekakis, L.J.; Miklos, D.B.; Jacobson, C.A.; Braunschweig, I.; Oluwole, O.O.; Siddiqi, T.; Lin, Y.; et al. Axicabtagene Ciloleucel CAR T-Cell Therapy in Refractory Large B-Cell Lymphoma. N. Engl. J. Med. 2017, 377, 2531–2544. [Google Scholar] [CrossRef]
  2. Cappell, K.M.; Kochenderfer, J.N. Long-term outcomes following CAR T cell therapy: What we know so far. Nat. Rev. Clin. Oncol. 2023, 20, 359–371. [Google Scholar] [CrossRef] [PubMed]
  3. Schuster, S.J.; Bishop, M.R.; Tam, C.S.; Waller, E.K.; Borchmann, P.; McGuirk, J.P.; Jäger, U.; Jaglowski, S.; Andreadis, C.; Westin, J.R.; et al. Tisagenlecleucel in Adult Relapsed or Refractory Diffuse Large B-Cell Lymphoma. N. Engl. J. Med. 2019, 380, 45–56. [Google Scholar] [CrossRef]
  4. Abramson, J.S.; Palomba, M.L.; Gordon, L.I.; Lunning, M.A.; Wang, M.; Arnason, J.; Mehta, A.; Purev, E.; Maloney, D.G.; Andreadis, C.; et al. Lisocabtagene maraleucel for patients with relapsed or refractory large B-cell lymphomas (TRANSCEND NHL 001): A multicentre seamless design study. Lancet 2020, 396, 839–852. [Google Scholar] [CrossRef] [PubMed]
  5. Berdeja, J.G.; Madduri, D.; Usmani, S.Z.; Jakubowiak, A.; Agha, M.; Cohen, A.D.; Stewart, A.K.; Hari, P.; Htut, M.; Lesokhin, A.; et al. Ciltacabtagene autoleucel, a B-cell maturation antigen-directed chimeric antigen receptor T-cell therapy in patients with relapsed or refractory multiple myeloma (CARTITUDE-1): A phase 1b/2 open-label study. Lancet 2021, 398, 314–324. [Google Scholar] [CrossRef]
  6. Park, K.; Veena, M.S.; Shin, D.S. Key Players of the Immunosuppressive Tumor Microenvironment and Emerging Therapeutic Strategies. Front. Cell Dev. Biol. 2022, 10, 830208. [Google Scholar] [CrossRef] [PubMed]
  7. Callahan, M.K.; Postow, M.A.; Wolchok, J.D. CTLA-4 and PD-1 Pathway Blockade: Combinations in the Clinic. Front. Oncol. 2015, 4, 385. [Google Scholar] [CrossRef]
  8. Sharma, P.; Allison, J.P. Immune Checkpoint Targeting in Cancer Therapy: Toward Combination Strategies with Curative Potential. Cell 2015, 161, 205–214. [Google Scholar] [CrossRef]
  9. Berman, D.; Korman, A.; Peck, R.; Feltquate, D.; Lonberg, N.; Canetta, R. The development of immunomodulatory monoclonal antibodies as a new therapeutic modality for cancer: The Bristol-Myers Squibb experience. Pharmacol. Ther. 2015, 148, 132–153. [Google Scholar] [CrossRef]
  10. Su, C.; Wang, H.; Liu, Y.; Guo, Q.; Zhang, L.; Li, J.; Zhou, W.; Yan, Y.; Zhou, X.; Zhang, J. Adverse Effects of Anti-PD-1/PD-L1 Therapy in Non-Small Cell Lung Cancer. Front. Oncol. 2020, 10, 554313. [Google Scholar] [CrossRef]
  11. Davari, K.; Holland, T.; Prassmayer, L.; Longinotti, G.; Ganley, K.P.; Pechilis, L.J.; Diaconu, I.; Nambiar, P.R.; Magee, M.S.; Schendel, D.J.; et al. Development of a CD8 co-receptor independent T-cell receptor specific for tumor-associated antigen MAGE-A4 for next generation T-cell-based immunotherapy. J. Immunother. Cancer 2021, 9, e002035. [Google Scholar] [CrossRef]
  12. Wilde, S.; Sommermeyer, D.; Frankenberger, B.; Schiemann, M.; Milosevic, S.; Spranger, S.; Pohla, H.; Uckert, W.; Busch, D.H.; Schendel, D.J. Dendritic cells pulsed with RNA encoding allogeneic MHC and antigen induce T cells with superior anti-tumor activity and higher TCR functional avidity. Blood 2009, 114, 2131–2139. [Google Scholar] [CrossRef]
  13. Sailer, N.; Fetzer, I.; Salvermoser, M.; Braun, M.; Brechtefeld, D.; Krendl, C.; Geiger, C.; Mutze, K.; Noessner, E.; Schendel, D.; et al. T-Cells Expressing a Highly Potent PRAME-Specific T-Cell Receptor in Combination with a Chimeric PD1-41BB Co-Stimulatory Receptor Show a Favorable Preclinical Safety Profile and Strong Anti-Tumor Reactivity. Cancers 2022, 14, 1998. [Google Scholar] [CrossRef]
  14. Lai, J.-P.; Robbins, P.F.; Raffeld, M.; Aung, P.P.; Tsokos, M.; Rosenberg, S.A.; Miettinen, M.M.; Lee, C.-C.R. NY-ESO-1 expression in synovial sarcoma and other mesenchymal tumors: Significance for NY-ESO-1-based targeted therapy and differential diagnosis. Mod. Pathol. 2012, 25, 854–858. [Google Scholar] [CrossRef] [PubMed]
  15. Lai, J.-P.; Rosenberg, A.Z.; Miettinen, M.M.; Lee, C.-C.R. NY-ESO-1 expression in sarcomas A diagnostic marker and immunotherpy target. Oncoimmunology 2012, 1, 1409–1410. [Google Scholar] [CrossRef] [PubMed]
  16. Odunsi, K.; Jungbluth, A.A.; Stockert, E.; Qian, F.; Gnjatic, S.; Tammela, J.; Intengan, M.; Beck, A.; Keitz, B.; Santiago, D.; et al. NY-ESO-1 and LAGE-1 cancer-testis antigens are potential targets for immunotherapy in epithelial ovarian cancer. Cancer Res. 2003, 63, 6076–6083. [Google Scholar] [PubMed]
  17. Resnick, M.B.; Sabo, E.; Kondratev, S.; Kerner, H.; Spagnoli, G.C.; Yakirevich, E. Cancer-testis antigen expression in uterine malignancies with an emphasis on carcinosarcomas and papillary serous carcinomas. Int. J. Cancer 2002, 101, 190–195. [Google Scholar] [CrossRef]
  18. D’Angelo, S.P.; Araujo, D.M.; Abdul Razak, A.R.; Agulnik, M.; Attia, S.; Blay, J.-Y.; Carrasco Garcia, I.; Charlson, J.A.; Choy, E.; Demetri, G.D.; et al. Afamitresgene autoleucel for advanced synovial sarcoma and myxoid round cell liposarcoma (SPEARHEAD-1): An international, open-label, phase 2 trial. Lancet 2024, 403, 1460–1471. [Google Scholar] [CrossRef]
  19. D’angelo, S.P.; Melchiori, L.; Merchant, M.S.; Bernstein, D.; Glod, J.; Kaplan, R.; Grupp, S.; Tap, W.D.; Chagin, K.; Binder, G.K.; et al. Antitumor activity associated with prolonged persistence of adoptively transferred NY-ESO-1c259T cells in synovial sarcoma. Cancer Discov. 2018, 8, 944–957. [Google Scholar] [CrossRef]
  20. Ishihara, M.; Kitano, S.; Kageyama, S.; Miyahara, Y.; Yamamoto, N.; Kato, H.; Mishima, H.; Hattori, H.; Funakoshi, T.; Kojima, T.; et al. NY-ESO-1-specific redirected T cells with endogenous TCR knockdown mediate tumor response and cytokine release syndrome. J. Immunother. Cancer 2022, 10, e003811. [Google Scholar] [CrossRef]
  21. Mahnke, Y.D.; Brodie, T.M.; Sallusto, F.; Roederer, M.; Lugli, E. The who s who of T-cell differentiation Human memory T-cell subsets. Eur. J. Immunol. 2013, 43, 2797–2809. [Google Scholar] [CrossRef] [PubMed]
  22. Jaravine, V.; Mösch, A.; Raffegerst, S.; Schendel, D.J.; Frishman, D. Expitope 2.0: A tool to assess immunotherapeutic antigens for their potential cross-reactivity against naturally expressed proteins in human tissues. BMC Cancer 2017, 17, 892. [Google Scholar] [CrossRef] [PubMed]
  23. Rosenberg, S.A.; Restifo, N.P. Adoptive cell transfer as personalized immunotherapy for human cancer. Science 2015, 348, 62–68. [Google Scholar] [CrossRef] [PubMed]
  24. Sanomachi, T.; Katsuya, Y.; Nakatsura, T.; Koyama, T. Next-Generation CAR-T and TCR-T Cell Therapies for Solid Tumors: Innovations, Challenges, and Global Development Trends. Cancers 2025, 17, 1945. [Google Scholar] [CrossRef]
  25. Beenen, A.C.; Sauerer, T.; Schaft, N.; Dörrie, J. Beyond Cancer: Regulation and Function of PD-L1 in Health and Immune-Related Diseases. Int. J. Mol. Sci. 2022, 23, 8599. [Google Scholar] [CrossRef]
  26. Ishida, Y.; Agata, Y.; Shibahara, K.; Honjo, T. Induced expression of PD-1, a novel member of the immunoglobulin gene superfamily, upon programmed cell death. EMBO J. 1992, 11, 3887–3895. [Google Scholar] [CrossRef]
  27. Simon, S.; Labarriere, N. PD-1 expression on tumor-specific T cells: Friend or foe for immunotherapy? Oncoimmunology 2018, 7, e1364828. [Google Scholar] [CrossRef]
  28. Baumeister, S.H.; Freeman, G.J.; Dranoff, G.; Sharpe, A.H. Coinhibitory Pathways in Immunotherapy for Cancer. Annu. Rev. Immunol. 2016, 34, 539–573. [Google Scholar] [CrossRef]
  29. Boussiotis, V.A. Molecular and Biochemical Aspects of the PD-1 Checkpoint Pathway Immune Checkpoint Blockade as Cancer Therapy. N. Engl. J. Med. 2017, 375, 1767–1778. [Google Scholar] [CrossRef]
  30. LaFleur, M.W.; Muroyama, Y.; Drake, C.G.; Sharpe, A.H. Inhibitors of the PD-1 Pathway in Tumor Therapy. J. Immunol. 2018, 200, 375–383. [Google Scholar] [CrossRef]
  31. Topalian, S.L.; Drake, C.G.; Pardoll, D.M. Immune checkpoint blockade: A common denominator approach to cancer therapy. Cancer Cell 2015, 27, 450–461. [Google Scholar] [CrossRef]
  32. Yin, Q.; Wu, L.; Han, L.; Zheng, X.; Tong, R.; Li, L.; Bai, L.; Bian, Y. Immune-related adverse events of immune checkpoint inhibitors: A review. Front. Immunol. 2023, 14, 1167975. [Google Scholar] [CrossRef] [PubMed]
  33. Schoenfeld, A.J.; Hellmann, M.D. Acquired Resistance to Immune Checkpoint Inhibitors. Cancer Cell 2020, 37, 443–455. [Google Scholar] [CrossRef]
  34. Mardiana, S.; Solomon, B.J.; Darcy, P.K.; Beavis, P.A. Supercharging adoptive T cell therapy to overcome solid tumor–induced immunosuppression. Sci. Transl. Med. 2019, 11, eaaw2293. [Google Scholar] [CrossRef]
  35. Rasmussen, J.H.; Lelkaitis, G.; Håkansson, K.; Vogelius, I.R.; Johannesen, H.H.; Fischer, B.M.; Bentzen, S.M.; Specht, L.; Kristensen, C.A.; von Buchwald, C.; et al. Intratumor heterogeneity of PD-L1 expression in head and neck squamous cell carcinoma. Br. J. Cancer 2019, 120, 1003–1006. [Google Scholar] [CrossRef]
  36. Nicoś, M.; Krawczyk, P.; Crosetto, N.; Milanowski, J. The Role of Intratumor Heterogeneity in the Response of Metastatic Non-Small Cell Lung Cancer to Immune Checkpoint Inhibitors. Front. Oncol. 2020, 10, 569202. [Google Scholar] [CrossRef]
  37. Palicelli, A.; Croci, S.; Bisagni, A.; Zanetti, E.; De Biase, D.; Melli, B.; Sanguedolce, F.; Ragazzi, M.; Zanelli, M.; Chaux, A.; et al. What Do We Have to Know About PD-L1 Expression in Prostate Cancer? A Systematic Literature Review (Part 6): Correlation of PD-L1 Expression with the Status of Mismatch Repair System, BRCA, PTEN, and Other Genes. Biomedicines 2022, 10, 236. [Google Scholar] [CrossRef] [PubMed]
  38. Jiang, X.; Wang, J.; Deng, X.; Xiong, F.; Ge, J.; Xiang, B.; Wu, X.; Ma, J. Tumor microenvironment in PD1/PD-1-mediated tumor immune escape. Mol. Cancer 2019, 18, 10. [Google Scholar] [CrossRef] [PubMed]
  39. Herbst, R.S.; Soria, J.C.; Kowanetz, M.; Fine, G.D.; Hamid, O.; Gordon, M.S.; Sosman, J.A.; McDermott, D.F.; Powderly, J.D.; Gettinger, S.N.; et al. Predictive correlates of response to the anti-PD-L1 antibody MPDL3280A in cancer patients. Nature 2014, 515, 563–567. [Google Scholar] [CrossRef] [PubMed]
  40. Filin, I.Y.; Kitaeva, K.V.; Rutland, C.S.; Rizvanov, A.A.; Solovyeva, V.V. Recent Advances in Experimental Dendritic Cell Vaccines for Cancer. Front. Oncol. 2021, 11, 730824. [Google Scholar] [CrossRef]
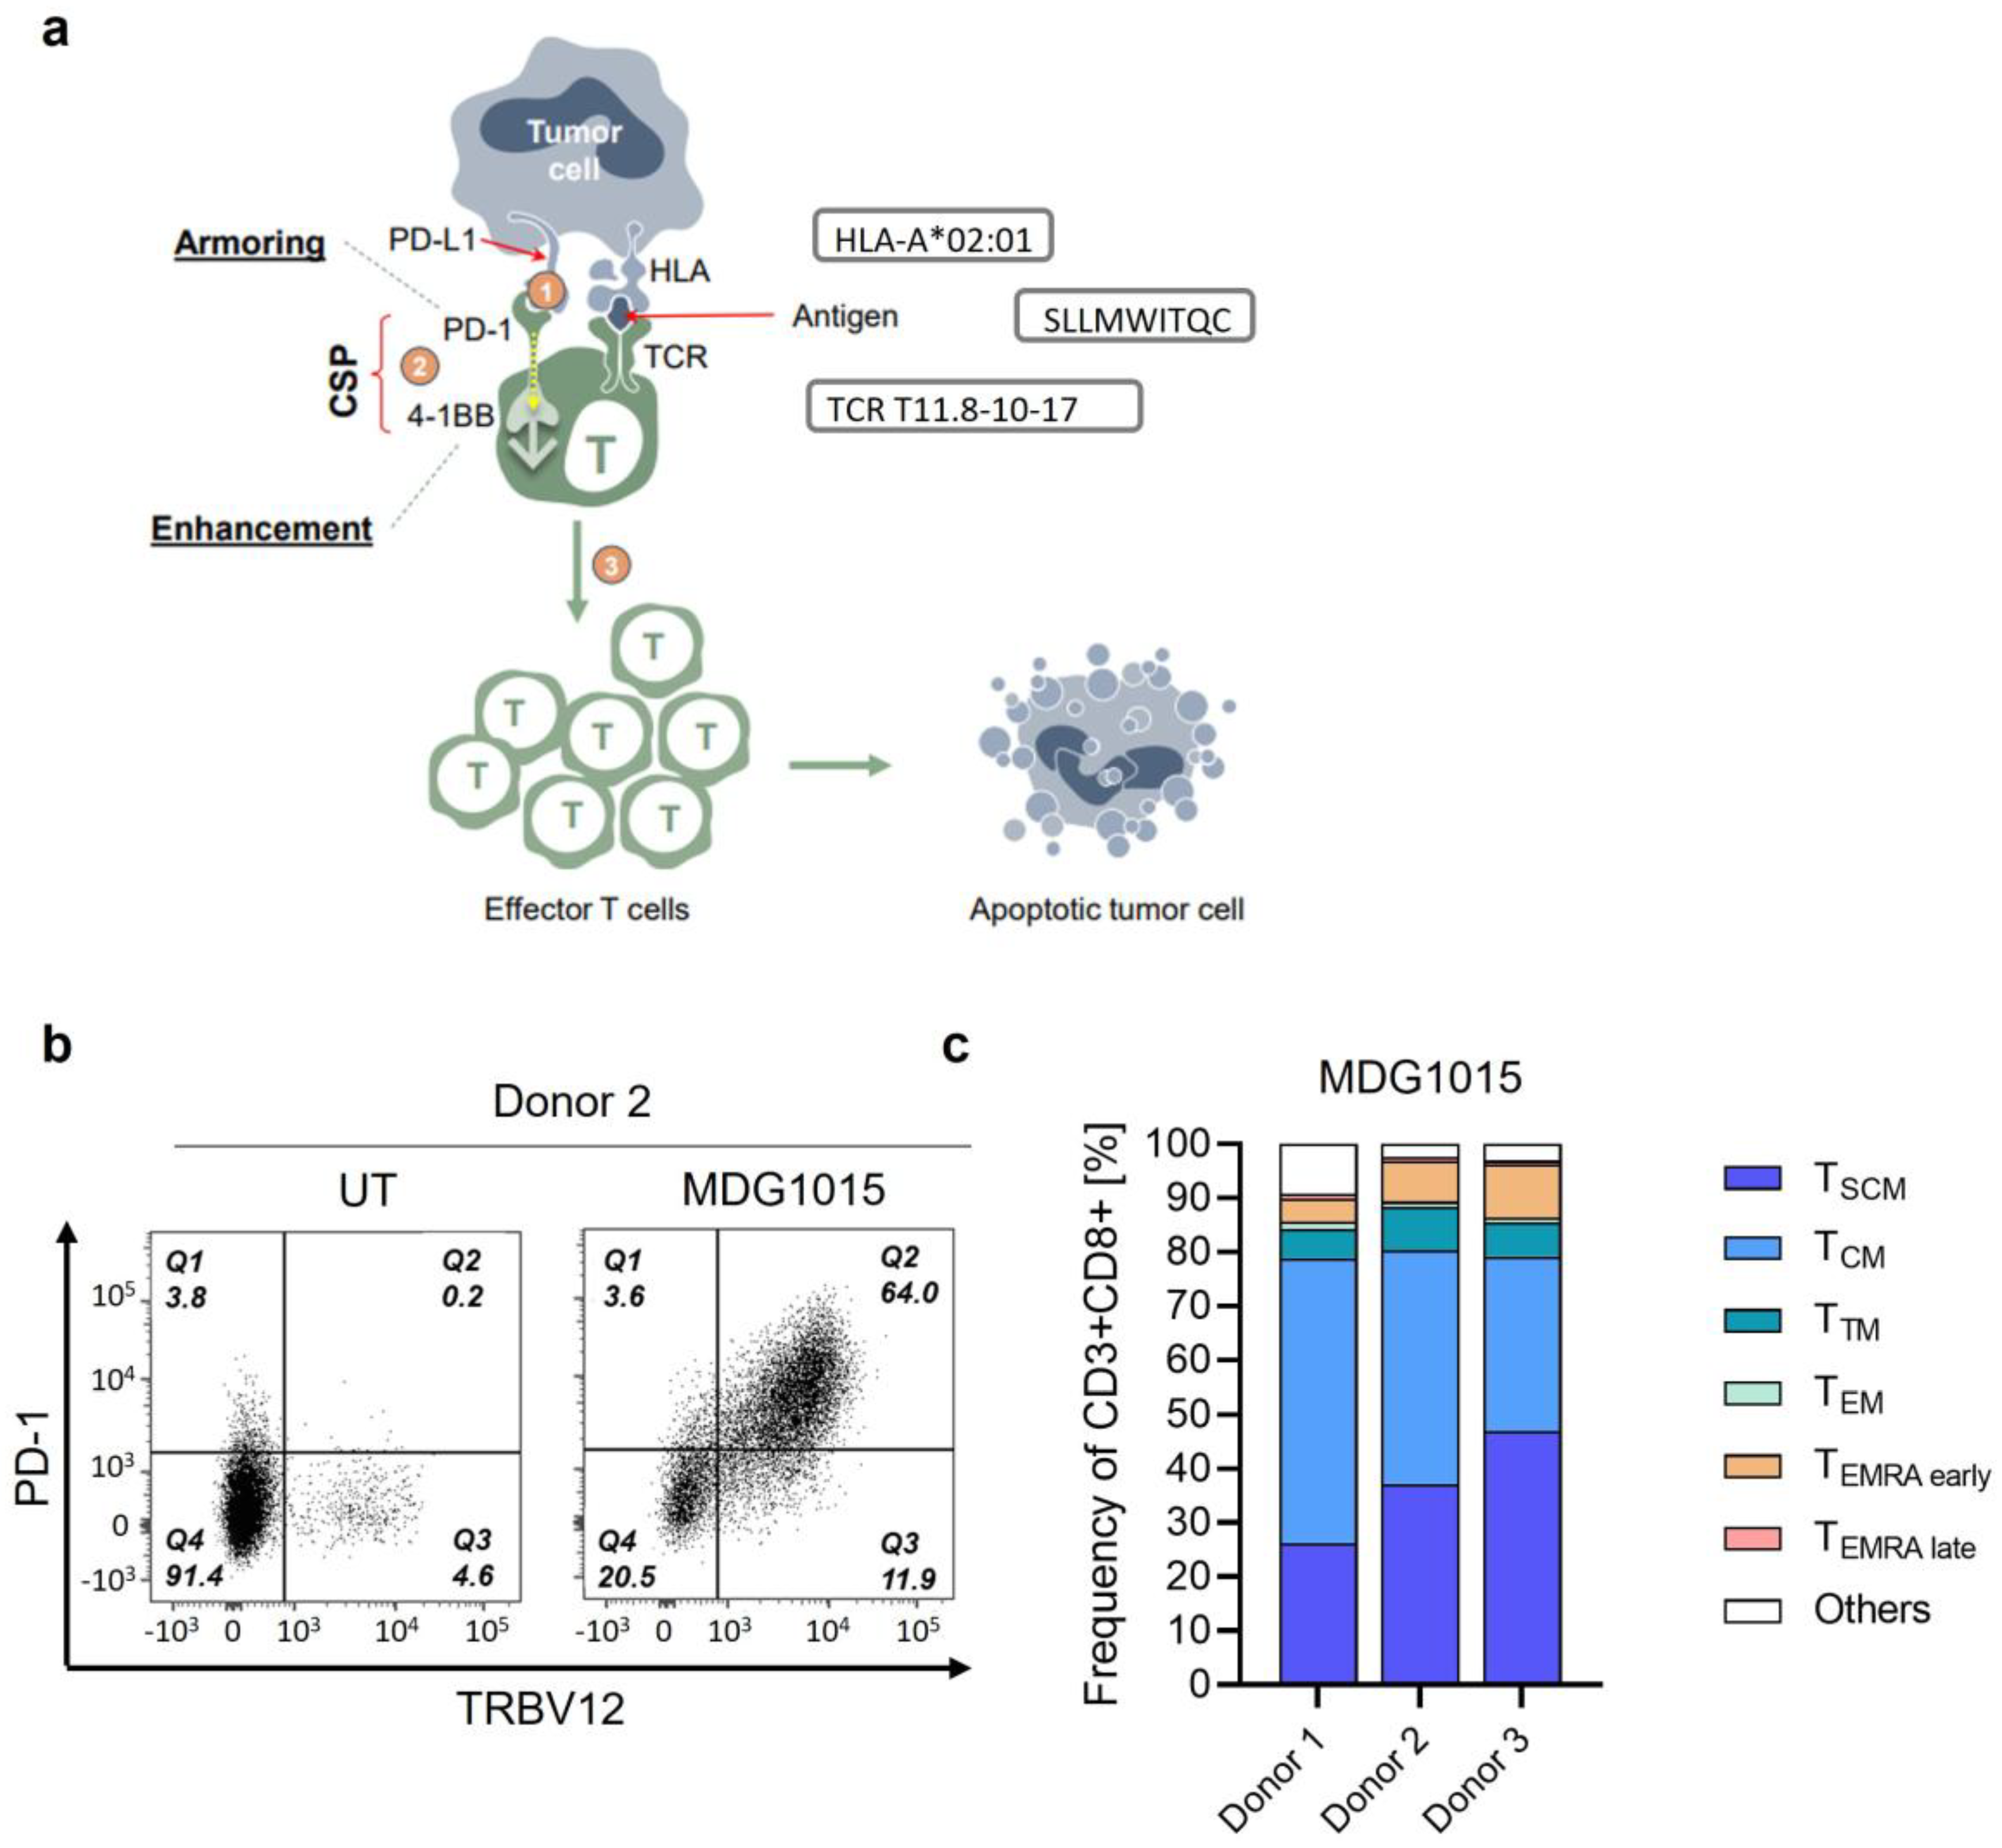
Figure 1. Phenotype of MDG1015. (a) MDG1015 consists of autologous, CD8+ T cells transduced with the NY-ESO-1/LAGE-1a-specific, HLA-A*02:01-restricted TCR (TCR T11.8-10-17), and the costimulatory switch protein (CSP) PD1-41BB. MDG1015 recognizes NY-ESO-1- and/or LAGE-1a-positive target cells, while the CSP translates an inhibitory signal mediated via PD-1 upon interaction with PD-L1, expressed on tumor cells, into a costimulatory signal. (b) Cell surface expression of TCR (TRBV12) and PD-1 in CD3+/CD8+ T cells (MDG1015) was determined by flow cytometry using anti-TRBV12 (clone 56C5.2, Beckman Coulter) and anti-PD-1 antibodies (clone EH12.1, BD Biosciences). Cells were pre-gated on singlet, viable, CD45+/CD3+/CD8+ T cells. Untransduced CD3+/CD8+ T cells (UT) generated from the same donor were used as negative controls for determination of endogenous TRBV12 and PD-1 cell surface expression. Q1: CD3+CD8+ cells expressing only PD-1, Q2: CD3+CD8+ cells double-positive for PD-1 and TCR, Q3: CD3+CD8+ cells expressing only TCR, and Q4: CD3+CD8+ cells negative for PD-1 and TCR. Numbers given in each quadrant represent % of positive cells. One representative donor is shown. (c) MDG1015 T memory cell composition was determined by FC using specific fluorochrome-conjugated antibodies. In the bar diagram, the different T memory subsets within viable CD3+/CD8+ cells are displayed as follows: dark blue: TSCM (CD45RA+CCR7+CD27+CD95+), light blue: TCM (CD45RA−CCR7+CD27+CD95+), dark green: TTM (CD45RA−CCR7−CD27+CD95+), light green: TEM (CD45RA−CCR7−CD27−CD95+), orange: TEMRA early (CD45RA+CCR7−CD27+CD95+), red: TEMRA late (CD45RA+CCR7−CD27−CD95+), and white: others.
Ijtm 05 00045 g001
Figure 2. Strong functionality of MDG1015 after recognition of antigen-positive, PD-L1-positive tumor cell lines. (a) IFN-γ was quantified after 24 h of co-culture of MDG1015 (3 donors) and tumor cell lines expressing NY-ESO-1 and/or LAGE-1a. The 1 × 10⁵ MDG1015 or control T cells were co-cultured with 2 × 10⁴ tumor cells in 96-well flat-bottom plates. Tumor cell lines overexpressed PD-L1, except for endogenous expression by HT1376 and 647-V. Untransduced (UT) T cells and antigen-negative 647-V cells served as negative controls, Allo-A2 T cells as positive controls. Dashed line: highest standard. Mean ± SD of triplicates are shown. NY-ESO-1 and LAGE-1a mRNA expression levels were determined via qPCR and are given as copies × 103 per 25 ng RNA. Cell surface expression of HLA-A2 and PD-L1 was detected by cell surface staining using specific anti-HLA-A2 and anti-PD-L1 antibodies and is given as delta mean fluorescence intensity (ΔMFI). (b) Poly-cytokine secretion measured by MAGPIX multiplex assay after 24 h of co-culture of MDG1015 (one representative donor) and tumor cell lines expressing NY-ESO-1 and/or LAGE-1a and overexpressing PD-L1; 1 × 10⁵ MDG1015 or control T cells per 96-well were co-cultured with 2 × 10⁴ tumor cells. Negative control: medium, positive control: PMA/ionomycin. (c) Killing of tumor cell lines expressing NY-ESO-1 and/or LAGE-1a and overexpressing PD-L1 (except endogenous PD-L1 expression in HT1376) and NucLight Red; positive control: NY-ESO-1/LAGE-1a SLL peptide-pulsed tumor cells. The 1 × 10⁵ TCR-T cells were co-cultured with 6 × 10³–8 × 10³ tumor cells, and red fluorescent object counts were quantified every 4 h for up to 120 h using the IncuCyte S3 live-cell imaging system. Kinetics of tumor cell killing ire shown as reduction in NucLightRed+ object count over time.
Ijtm 05 00045 g002
Figure 3. Recognition of PD-L1-positive 3D tumor spheroids by MDG1015. (a) IFN-γ was quantified after 24 h of co-culture of 1 × 10⁵ MDG1015 (3 donors) and tumor spheroids expressing NY-ESO-1 and/or LAGE-1a after 72 h of spheroid formation in ultra-low-attachment plates. Tumor cell lines overexpressed PD-L1, except for endogenous expression by HT1376 and 647-V. UT T cells, effectors only, and antigen-negative 647-V cells served as negative controls and Allo-A2 T cells as positive controls. Dashed line: highest standard. Mean ± SD of triplicates are shown. (b) Killing of tumor spheroids expressing NY-ESO-1 and/or LAGE-1a and overexpressing PD-L1 and NucLight Red; NY-ESO-1/LAGE-1a SLL peptide-pulsed tumor cells served as positive controls. The 1 × 10⁵ MDG1015 were co-cultured with tumor spheroids, and total Red Object Integrated Intensity was quantified every 4 h for up to 120 h using the IncuCyte S3 system. Kinetics of tumor cell killing are shown as reduction in total Red Object Integrated Intensity over time.
Ijtm 05 00045 g003
Figure 4. CSP-mediated increase in TCR-T cell functionality and mode of action analysis. (a) IFN-γ release by MDG1015 after encounter of the NY-ESO-1/LAGE-1a-positive tumor cell line OAW28_A2 expressing or lacking PD-L1. Tumor cells expressing or lacking PD-L1 were co-cultured with decreasing numbers of MDG1015 or UT T cells for 24 h. NY-ESO-1/LAGE-1a-negative 647-V cells served as negative control. Mean values of technical triplicates with standard deviations of one representative donor are shown. Dashed line: highest standard. (b) IFN-γ release by MDG1015 after 24 h of co-culture with K562 cell lines overexpressing either NY-ESO-1 or PD-L1 only or both NY-ESO-1 and PD-L1. To test trans engagement of the CSP, MDG1015 was co-cultured with K562_NY-ESO-1 and K562_PD-L1 cells at different ratios. Technical triplicates and standard deviations of one representative donor are shown. (c) Real-time imaging of NucLight Red®-transduced tumor cell lines to determine tumor cell killing by decreasing numbers of MDG1015 for 120 h in the IncuCyte® S3. Differences in red object counts of tumor cells expressing or lacking PD-L1 after co-culture with 2.5 × 10³ MDG1015 are highlighted by arrows. Only curves obtained with 5 × 10⁴ UT T cells are shown. Mean values of triplicates of one representative donor are shown.
Ijtm 05 00045 g004
Figure 5. CSP-increased poly-cytokine secretion and proliferation of MDG1015. (a) Poly-cytokine secretion by MDG1015 (three donors) after co-culture with the tumor cell line OAW28_A2 expressing or lacking PD-L1. Poly-cytokine secretion was measured after 24 h of co-culture. UT T cells (UT) and target cells only (targets) served as negative controls. (b) Poly-cytokine secretion by MDG1015 (three donors) detected at the single-cell level after co-culture with SW982 tumor cells expressing or lacking PD-L1. Poly-cytokine secretion was monitored for 23 h after 20 h of co-culture. Polyfunctional strength index (left) considers the percentage of T cells secreting ≥2 cytokines and intensity of cytokine secretion; arrows indicate fold-change. Polyfunctionality (right) shows frequencies of MDG1015 secreting ≥2 cytokines. (c) Proliferation of MDG1015 after 3 days of co-culture with SW982 tumor cells expressing or lacking PD-L1. MDG1015 alone served as negative control. Histograms of CellTraceTM fluorescent intensities (left) and frequencies of proliferating MDG1015 (right) are shown. Cells were pre-gated on singlet, living CD3+CD8+TRBV12+ T cells.
Ijtm 05 00045 g005
Figure 6. TCR-gated activation and proliferation of MDG1015. (a) Functional avidities of three different MDG1015 batches (donors 1, 2, and 3) were measured after 24 h of co-culture with T2 or T2_PD-L1 cells loaded with titrated amounts of NY-ESO-1/LAGE-1a SLL peptide. IFN-γ concentrations detected in co-culture supernatants were normalized and log-transformed; peptide concentrations were log-transformed as well, followed by non-linear regression curve fitting displaying relative IFN-γ release at the corresponding NY-ESO-1/LAGE-1a SLL peptide concentration. (b) Cross-recognition of antigen-negative tumor cells by MDG1015 (three donors) indicated by IFN-γ release after 24 h co-culture. UT T cells served as negative control; Allo-A2 TCR-T cells and PMA/Ionomycin stimulation as positive controls. Tumor cells loaded with 10−5 M NY-ESO-1/LAGE-1a SLL peptide served as additional positive controls. Mean values of triplicates with standard deviations are shown. The dashed line indicates the highest IFN-γ standard of 4000 pg/mL, and values above this standard are displayed as IFN-γ concentration of 4000 pg/mL. (c) Proliferation and expansion kinetics of MDG1015 in contact with antigen-positive or -negative tumor cell lines expressing or lacking PD-L1. Histograms (left) show T cells after three days that underwent zero (#0), one (#1), two (#2), or three divisions (#3), respectively. Internal control T cells were used as gating controls to define cell divisions. Cells were pre-gated on singlet, living CD3+CD8+TRBV12+ T cells. For kinetics of MDG1015 expansion (right), T cell numbers were quantified via flow cytometry on d0, d3, d5, d7, d10, and d14, respectively. Expansion of TRBV12+ CD8+ T cells was calculated by dividing the cell count of each assay day >0 by d0. One of three donors is shown.
Ijtm 05 00045 g006
Figure 7. MDG1015-mediated cross-recognition of NY-ESO-1/LAGE-1a-negative healthy cells. (a) Schematic representation of healthy cell types and their respective tissue origin analyzed for MDG1015-mediated cross-recognition (b) IFN-γ or IL-2 release by MDG1015 after 24 h of co-culture with healthy cells. Co-culture supernatants of indicated healthy cell types and MDG1015 were analyzed for IFN-γ (or IL 2 for iGABANeuro) by ELISA. The 1 × 10⁵ MDG1015 or control T cells per 96-well were co-cultured for 24 h with target cells (w/o peptide; upper panel). Ass positive controls target cells were loaded with 10 µM of NY-ESO-1/LAGE-1a SLL peptide (+SLL; lower panel). The number of target cells seeded per well was adapted for each cell type based on cell size, morphology, and growth kinetics. iGABANeuro were pre-treated with IFN-γ for induction of HLA A2 cell surface expression for 72 h. Healthy cells were co-cultured with Allo-A2 TCR T cells as positive controls. Target cells without T cells (targets only) were included as negative controls. Depicted are mean values of triplicates with standard deviations. The dashed line indicates the highest IFN-γ standard of 4000 pg/mL, and values above this standard are displayed as IFN-γ concentration of 4000 pg/mL. (UT: untransduced T cells; MDG1015: HLA-A*02:01-restricted, NY-ESO-1/LAGE 1a SLL-specific, TCR-T cells co-expressing the CSP; and Allo-A2: Allo-A2 TCR-T cells. iCell Cardiomyocytes (iCardio), human coronary artery endothelial cells (HCAEC), human cardiac fibroblasts (HCF), normal human bronchial epithelial cells (NHBE), normal human lung fibroblasts (NHLF), human renal cortical epithelial cells (HRCEpC), proximal tubule epithelial cells (RPTEC), iCell GABANeurons (iGABANeuro), iCell Astrocytes (iAstro), iCell Hepatocytes (iHep), iCell endothelial cells (iEC), human osteoblasts (HOB), normal human dermal fibroblasts (NHDF), monocytes (Mono), and mature dendritic cells (mDC)).
Ijtm 05 00045 g007
Table 1. Test systems and cell panels to assess safety of MDG1015.
AssessmentTest SystemMethodResults
On-target/off-tumor toxicityNY-ESO-1/LAGE-1a mRNA-positive healthy cells, with or without NY-ESO-1/LAGE-1a SLL peptideCo-cultures of MDG1015 and healthy test cells: IFN-γ secretion at 24 h; live-cell imaging assay 0–120 h Recognition of one batch of NY-ESO-1/LAGE-1a mRNA-positive mDC
Off-target/off-tumor toxicity Antigen-negative tumor cell lines (9 PD-L1-positive) derived from various tissues; unloaded or loaded with NY-ESO-1/LAGE-1a SLL peptideCo-cultures of MDG1015 and tumor cells: IFN-γ secretion at 24 h; proliferation over 15 dNo cross-recognition of antigen-negative, PD-L1-positive tumor cell lines; no cytokine-independent expansion of MDG1015 in the absence of NY-ESO-1/LAGE-1a-positive target cells
Human LCL panel with common HLA allotypes; unloaded or loaded with
NY-ESO-1/LAGE-1a SLL peptide
Co-cultures of MDG1015 and LCL panel cells: IFN-γ secretion at 24 hCross-recognition of 3 unloaded LCL; relevant cross-recognized HLA allotypes: HLA-A*02:02 and HLA-A*02:03; NY-ESO-1/LAGE-1a SLL-loaded LCL were recognized that expressed HLA-A*02:04 and HLA-A*02:09
Mismatched peptide test
panel identified using Expitope® 2.0 database: 318 peptides loaded on T2_PD-L1 cells; 5 peptides were expressed as ivtRNA in tumor cell lines
Co-cultures of MDG1015 and mismatched peptide-pulsed T2_PD-L1 cells or ivtRNA-transfected tumor cell lines: IFN-γ secretion at 24 h27 mismatched peptides cross-recognized on peptide- loaded T2_PD-L1 cells; recognition of 1 mismatched peptide-encoding ivtRNA in tumor cell lines; and no recognition of full-length gene-encoding ivtRNA in tumor cell lines
NY-ESO-1/LAGE-1a mRNA-negative panel of primary human healthy cell types; unloaded or loaded with SLL peptide Co-cultures of MDG1015 and healthy test cells: IFN-γ secretion at 24 h; live-cell imaging assay 0–120 hNo cross-recognition of NY-ESO-1/LAGE-1a mRNA-negative test cells of the healthy cell panel
Disclaimer/Publisher’s Note: The statements, opinions and data contained in all publications are solely those of the individual author(s) and contributor(s) and not of MDPI and/or the editor(s). MDPI and/or the editor(s) disclaim responsibility for any injury to people or property resulting from any ideas, methods, instructions or products referred to in the content.