Article

Crosstalk of Endothelial and Mesenchymal Stromal Cells under Tissue-Related O2

Institute of Biomedical Problems, Russian Academy of Sciences, Khoroshevskoye Shosse, 76a, 123007 Moscow, Russia
*
Authors to whom correspondence should be addressed.
Int. J. Transl. Med. 2021, 1(2), 116-136; https://doi.org/10.3390/ijtm1020009
Submission received: 9 August 2021 / Revised: 27 August 2021 / Accepted: 31 August 2021 / Published: 7 September 2021
(This article belongs to the Special Issue Advances in the Angiogenic Field)

Abstract

:
Mesenchymal stromal cells (MSCs) are considered a valuable tool for cell therapy. After systemic administration, the outcome of MSCs and endothelial cells (ECs) interactions strongly depend on the local microenvironment and tissue O2 levels in particular. In vitro analysis of EC effects on MSC regenerative potential in co-culture was performed after short-term interaction at “physiological” hypoxia (5% O2) and acute hypoxic stress (0.1% O2). At 5% O2, MSCs retained stromal phenotype and CFU-f numbers, osteogenic RUNX2 was upregulated. A shift in the expression of adhesion molecules, and an increase in transcription/synthesis of IL-6, IL-8 contributed to facilitation of directed migration of MSCs. In the presence of MSCs, manifestations of oxidative stress in ECs were attenuated, and a decrease in adhesion of PBMCs to TNF-α-activated ECs was observed. Under 0.1% O2, reciprocal effects of ECs and MSCs were similar to those at 5% O2. Meanwhile, upregulation of RUNX2 was canceled, IL-6 decreased, and IL-8 significantly increased. “Protective” effects of MSCs on TNF-α-ECs were less pronounced, manifested as NOS3 downregulation and intracellular NO elevation. Therefore, interaction with ECs at “physiological” hypoxia enhanced pro-regenerative capacities of MSCs including migration and anti-inflammatory modulation of ECs. Under acute hypoxic stress, the stimulating effects of ECs on MSCs and the “protective” potential of MSCs towards TNF-α-ECs were attenuated.

1. Introduction

Multipotent mesenchymal stromal cells (MSCs) are localized in a number of tissues and can be isolated and cultured in vitro. MSCs demonstrate a “trophic activity” due to the secretion of growth factors, cytokines, and other soluble mediators, including those with immunomodulatory properties, and have multilineage potential as well [1,2,3,4]. The above features determine the interest in MSCs as a perspective tool for additional therapy of various diseases [5,6,7,8]. Due to their immune evasiveness, not only autologous but also allogeneic MSCs can be used in clinical practice after in vitro processing. Currently, systemic administration is one of the most commonly used methods for the MSC delivery to target tissues [9,10]. It is assumed that upon entering the circulation, MSCs can follow the chemoattractant gradients and, reaching the area of damage, transmigrate through the vascular wall endothelium to the periendothelial space. It is this phenomenon that underlies the intravascular delivery of MSCs in cell therapy protocols [11,12,13]. It is obvious that interaction with endothelial cells (ECs) is one of the important factors that determine the fate of injected MSCs.
Upon systemic administration into circulation, the time of MSC interaction with the endothelial monolayer was shown to be several hours [9,14,15]. The data on the effects of ECs on MSCs during this time is limited. After short-term (24–72 h) interaction with ECs, it was demonstrated the formation of EC clusters surrounded by MSCs, upregulation of genes encoding proteins of myogenic differentiation (SMA-actin, calponin, myocardin) [16,17], and elevation of IL-6 production [18]. These findings indicate changes in the functional activity of MSCs, which may affect their subsequent involvement in reparation in vivo.
The outcome of MSC–EC communications significantly depends on the local microenvironment, including those caused by low O2 (tissue-related levels). The terms “physioxia” [19] or “physiological” hypoxia [20] were proposed to refer to such O2 conditions. In vitro, the different features of MSCs at tissue-related O2 (“physiological” hypoxia) vs. standard laboratory level (20% O2) were clearly demonstrated. At 5% O2, MSCs proliferated more actively, had more CFU-f, and susceptibility to osteo- and adipogenic differentiation stimuli was attenuated, which contributed to the maintenance of their low committed state [21,22,23,24,25,26,27]. Accordingly, interplay with ECs may affect the above MSC properties.
MSC administration was successfully applied in pre-clinical and clinical studies to cure ischemic disorders with impaired tissue oxygenation [28,29,30,31]. In this case, transplanted MSCs were affected by a number of factors: deprivation of growth factors, elevated inflammatory cytokines, and an acute decrease in O2—hypoxic stress [32,33]. Short-term hypoxic exposures (1–72 h, <1% O2) are known to induce certain functional changes in MSCs, such as an increased contribution of glycolysis to the ATP metabolism [24,34,35,36,37]. The above has an effect on the MSC regenerative potential, resulting in cytoskeletal reorganization and alteration of their migratory activity [38,39]. In vitro studies have shown that short-term hypoxic stress activates HIF-1α-dependent signaling pathways responsible for MSC adaptation and survival [35,36,40,41,42]. Activation of signaling cascades stimulates the secretion of various paracrine factors that have a “trophic” effect on damaged tissues [43,44,45]. Therefore, acute O2 deprivation, typical of damaged tissues, can have an ambiguous effect on MSCs and their communication with ECs as well.
The purpose of this study was to determine how a short-term interaction under “physiological” hypoxia (5% O2) and short-term hypoxic stress (0.1% O2) affect the functional activity of ECs and MSCs, in particular, the MSC functions requested for their reparative potential implementation, as well as on the MSC ability to regulate inflammatory response of ECs.

2. Materials and Methods

2.1. Isolation and Expansion of Multipotent Mesenchymal Stromal Cells (MSCs)

Samples of a stromal-vascular fraction of adipose tissue were obtained from multidisciplinary clinic “Soyuz” (Moscow, Russia) in the frames of Scientific Agreement. Tissue samples were processed using a standard protocol described by Zuk et al. [46] in modification of Buravkova et al. [47]. MSCs were expanded in α-MEM (Gibco, Life Technologies, Carlsbad, CA, USA) with 50 U/mL penicillin-streptomycin (PanEco, MoscowRussia), and 10% fetal bovine serum (FBS) (HyClone, Logan, UT, USA) under hypoxic conditions (5% O2, 5% CO2, 37 °C). MSCs were subcultured upon reaching 80–90% confluence. MSCs of 3–6th passages were used in experiments. All experimental procedures were specifically approved by the Biomedicine Ethics Committee of the Institute of Biomedical Problems, Russian Academy of Sciences (Permit #550/MCK/22/07/2020).

2.2. Human Peripheral Blood Mononuclear Cells’ (PBMCs) Isolation

Human PBMCs were isolated from blood samples that were collected from healthy volunteers with written informed consent. A density gradient centrifugation with Histopaque®-1077 (Sigma-Aldrich, St. Louis, MO, USA) was used for separation of PBMCs [48]. Cells were maintained in RPMI 1640 (Gibco, Life Technologies, Carlsbad, CA, USA) supplemented with heat-inactivated 5% FBS, 50 U/mL penicillin, and 50 μg/mL streptomycin.

2.3. Cultivation of Human Umbilical Vein Endothelial Cells (ECs)

Cryopreserved EC samples were provided by the Cryocenter Cord Blood Bank (Moscow, Russia), as part of a Scientific Agreement. After thawing, ECs were cultured in medium 199 with 2 mM glutamine, 1 mM sodium pyruvate, 50 U/mL penicillin, 50 μg/mL streptomycin, 25 mM HEPES (all Gibco, Life Technologies, Carlsbad, CA, USA) supplemented with 10% FBS (Hyclone, Logan, UT, USA), 200 μg/mL endothelial cell growth factor (Sigma-Aldrich, St. Louis, MO, USA) under 20% O2 in a CO2-incubator (Sanyo, Osaka, Japan). ECs of 2–4th passages were used in experiments. Inflammatory activation of ECs was induced by TNF-α (10 ng/mL) (Abcam, Waltham, MA, USA) for 24 hrs. All experimental procedures were approved by the Biomedicine Ethics Committee of the Institute of Biomedical Problems, Russian Academy of Sciences (Permit #549/END/22/07/2020).

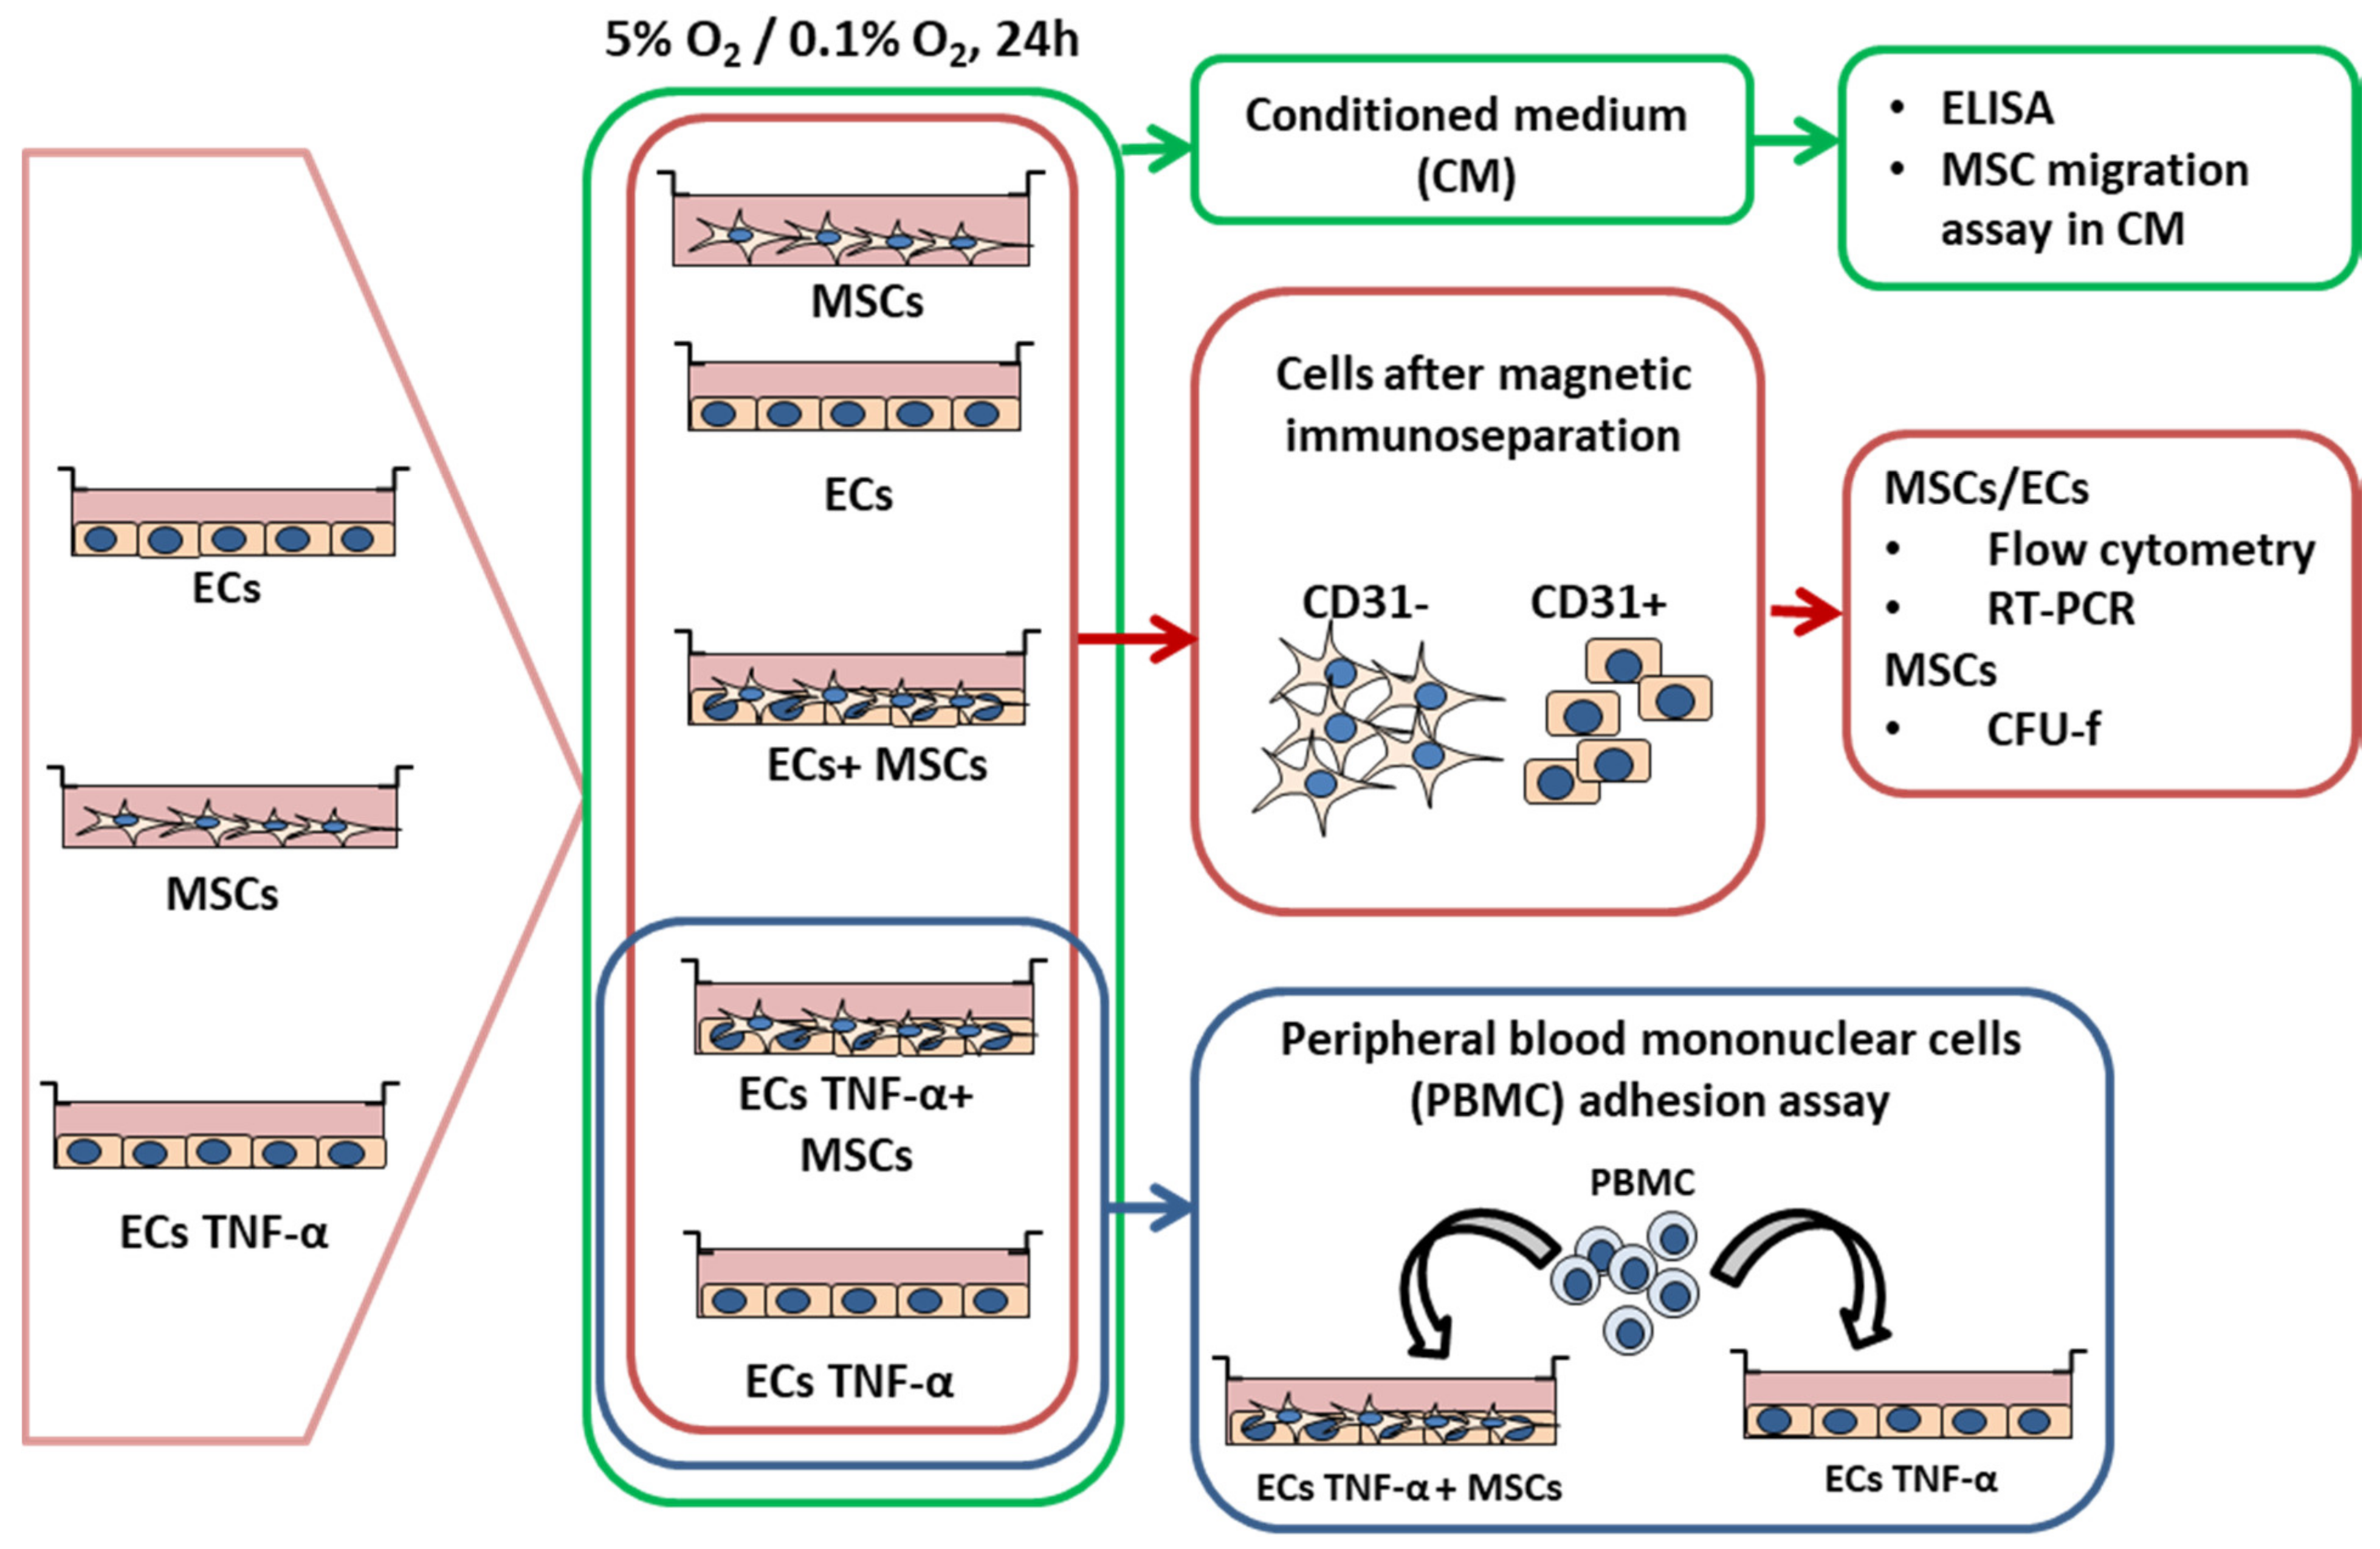
2.4. Experimental Design

The experimental procedures are illustrated in Figure 1. MSCs and ECs were cultured to a confluence of 80–90%. For co-culture experiments, MSCs were trypsinized and added to the EC monolayer in a 1:1 ratio. The culture medium was replaced in all cell cultures with a fresh one containing α-MEM and 199 (1:1 ratio). Then, EC or MSC monocultures and their co-cultures were exposed to hypoxic conditions for 24 h. Hypoxic chambers (StemCell Technology, Seattle, WA, USA), with the O2 level controlled by an O2 sensor, were used to maintain cells at 5% or 0.1% O2. After hypoxic exposure, the samples of conditioned medium (CM) were collected, centrifuged at 2500× g to remove cell debris, and stored at −80 °C (low-temperature freezer, Sanyo, Osaka, Japan) for ELISA.
Cells were washed with PBS (PanEco, Moscow, Russia), trypsinized, and separated by magnetic immunoseparation (Miltenyi Biotec, Auburn, CA, USA). For this, cell suspensions were mixed with magnetic microparticles bearing antibodies against endothelial marker PECAM (CD31) (Miltenyi Biotec, Auburn, CA, USA), and incubated for 15 min at +4 °C. After incubation, the cell suspensions were washed from unbound particles, resuspended in fresh culture medium without FBS, and placed on a column fixed in a magnet. Microparticles were retained in a magnetic field, while a suspension of unbound cells (MSCs, CD31-) came out through the pores of the column. The column was removed from the magnet and washed with 199 medium to collect ECs (ECs, CD31+). After magnetic separation, cells were harvested by centrifugation at 1500× g and analyzed by flow cytometry, real-time (RT) PCR, and MSCs were seeded in limiting density for CFU-f evaluation.
To examine the effects of MSCs on the TNF-α-induced activation of ECs, the experiments were executed as follows (Figure 1). ECs in a monolayer were exposed to TNF-α for 24 h. The ECs were washed with PBS and a suspension of MSCs was added as described above. After 24 h of hypoxic exposure at 5% or 0.1% O2, the conditioned medium was collected; cells were immunoseparated and then processed as above. Besides, a part of TNF-α primed ECs in monoculture and co-culture with MSCs was used in the PBMC adhesion assay.

2.5. Flow Cytometry

Cell surface antigens were analyzed by flow cytometry using BD Accuri™ C6 cytometer (BD Biosciences, San Jose, CA, USA). MSCs or ECs, collected after magnetic immunoseparation, were resuspended in PBS, aliquoted into 105 cells per test, and incubated with mouse monoclonal primary antibodies (dilution 1:50) for 20 min. After incubation, each probe was additionally diluted with 400 μL of PBS. The choice of antibodies to characterize MSCs was based on the minimal surface marker panel (CD45, CD73, CD90, and CD105) proposed by a joint statement of IFATS and ISCT [49]. In addition, MSCs were stained with antibodies against cell-to-cell and cell–matrix adhesion molecules: integrin α1 (CD49a), integrin α4 (CD49d), integrin α5 (CD49e), ICAM-1 (CD54), N-cadherin (CD325) (all Beckman Coulter, France). The EC adhesion molecule profile was also characterized with antibodies against PECAM (CD31), VE-cadherin (CD144), ICAM-1 (CD54), E-selectin (CD62E), VCAM-1 (CD106), integrin α1 (CD49a)) (Beckman Coulter, Marseille, France). To evaluate fluorochrome unspecific staining, isotype controls for anti-IgG1 and anti-IgG2a were applied (BD Biosciences, San Jose, CA, USA).
NO was detected using DAF-FM diacetate (Molecular Probes Inc., Eugene, OR, USA) according to the manufacturer’s instructions. Briefly, mono- and co-cultures were washed with PBS and incubated with 5 μM DAF-FM diacetate for 20 min at 37 °C. After washing with PBS, fresh medium was added; cells were incubated for an additional 30 min. After this, cells were trypsinized, stained with anti-CD90-APC antibodies, and analyzed by flow cytometry (Ex/Em = 490/530 nm for NO). The NO level in ECs was estimated as the mean fluorescence intensity (MFI) of CD90 negative cells.

2.6. CFU-f Assay

For CFU-f evaluation, MSCs were plated at a limiting density—100 cells per 35 mm cell culture dish (Corning, NY, USA). After 14 days, the dishes were stained with 0.5% crystal violet solution for 5 min (Sigma-Aldrich, Saint Louis, MO, USA), and colonies with ≥50 cells were counted. The data are presented as an average number of colonies per 1000 seeded cells.

2.7. In Vitro Cell Migration Assays

Non-targeted MSC migration was evaluated using the in vitro “scratch” assay [50]. A confluent monolayer was scratched with a sterile pipette tip to create a “wound” approximately 0.8–1.0 mm wide. Then, the culture medium was changed with CM from EC monocultures, diluted with α-MEM (supplemented with 10% FBS) in a 1:1 ratio. All scratch assays were performed in five replicates. To estimate the wound closure, digital images of five randomly selected view fields along the scratch were captured using Nikon Eclipse Ti-U microscope (Nikon, Tokyo, Japan) before and 24 h after the scratch. The images were analyzed using NIS-Elements software (Nikon, Tokyo, Japan) to measure the square of the scratch at marked points. The migration area was calculated as the difference between the initial and final wound squares (um2).

2.8. In Vitro Assay to Measure PBMC Adhesion to Activated Human ECs

PBMCs (106 cells/mL) in complete RPMI 1640 medium were added to monocultures of quiescent or TNF-α-activated ECs, as well as to co-cultures of MSCs and TNF-α-activated ECs. These co-cultures were exposed under “physiological” hypoxia and acute hypoxic stress for 30 min. Non-adherent PBMCs were removed, the cells were washed twice for 5 min with PBS, and stained with Giemsa azure–eosin 0.02% aqueous solution (Sigma-Aldrich, St. Louis, MO, USA) for 20 min at room temperature. Stained cells were washed twice with PBS followed by deionized water, air-dried, and photographed using a Nikon Eclipse Ti-U microscope. The number of adhered PBMCs was counted in at least 10 randomly selected view fields.

2.9. Enzyme Linked Immunosorbent Assay (ELISA)

Samples of conditioned medium (CM) from mono- and co-cultures were collected in accordance with the experimental protocols. Deep frozen probes were thawed at room temperature, centrifuged, and an ELISA was performed according to the manufacturer’s instructions using kits for determining IL-6 (Human IL-6 ELISA set) and IL-8 (Human IL-8 ELISA set), (BD OptEIA, San Diego, CA, USA). Optical density was measured using a BioRad PR2100 microplate reader (BioRad, Redmond, WA, USA) at a wavelength of 450/620 nm. The concentration of soluble mediators was evaluated using a calibration curve. IL-6 and IL-8 secretion is presented as ng/105 cells.

2.10. Quantitative RT-PCR Analysis

To evaluate gene expression, total RNA was extracted using the QIAzol reagent (Qiagen, Hilden, Germany) and purified by the phenol/chloroform technique. The quality and concentration of RNA samples were estimated using a Nanodrop ND-2000c (Thermo Fisher Scientific, Waltham, MA, USA). Ambion DNase I (RNase-free) (Thermo Fisher Scientific, Waltham, MA, USA) was used for genomic DNA degradation. Reverse transcription was performed using the MMLV RT Kit (Eurogene, Moscow, Russia) according to the manufacturer’s protocol. The cDNA was mixed with qPCR mix-HS SYBR (Eurogene, Moscow, Russia) and added to 96-well plates. Expression of the genes (OCT4, NANOG, SOX2, RUNX2, PPARγ, SOX9, IL6, IL8) was analyzed using Qiagen primers (Qiagen, Hilden, Germany). The expression levels of three housekeeping genes (ACTB, GAPDH, and HPRT) were used as a reference. The polymerase chain reaction was performed using the Mx300P system (Stratagene, San Diego, CA, USA). Normalized gene expression was calculated with the 2−ΔΔCt method [51].

2.11. Statistical Analysis

All data were calculated from 3–5 independent experiments and expressed as the mean ± standard deviation. Analysis of group differences was performed by the Mann–Whitney U-test for independent samples using STATISTICA 10 software (Statsoft, Tulsa, OK, USA). Statistical significance was considered at p < 0.05.

3. Results

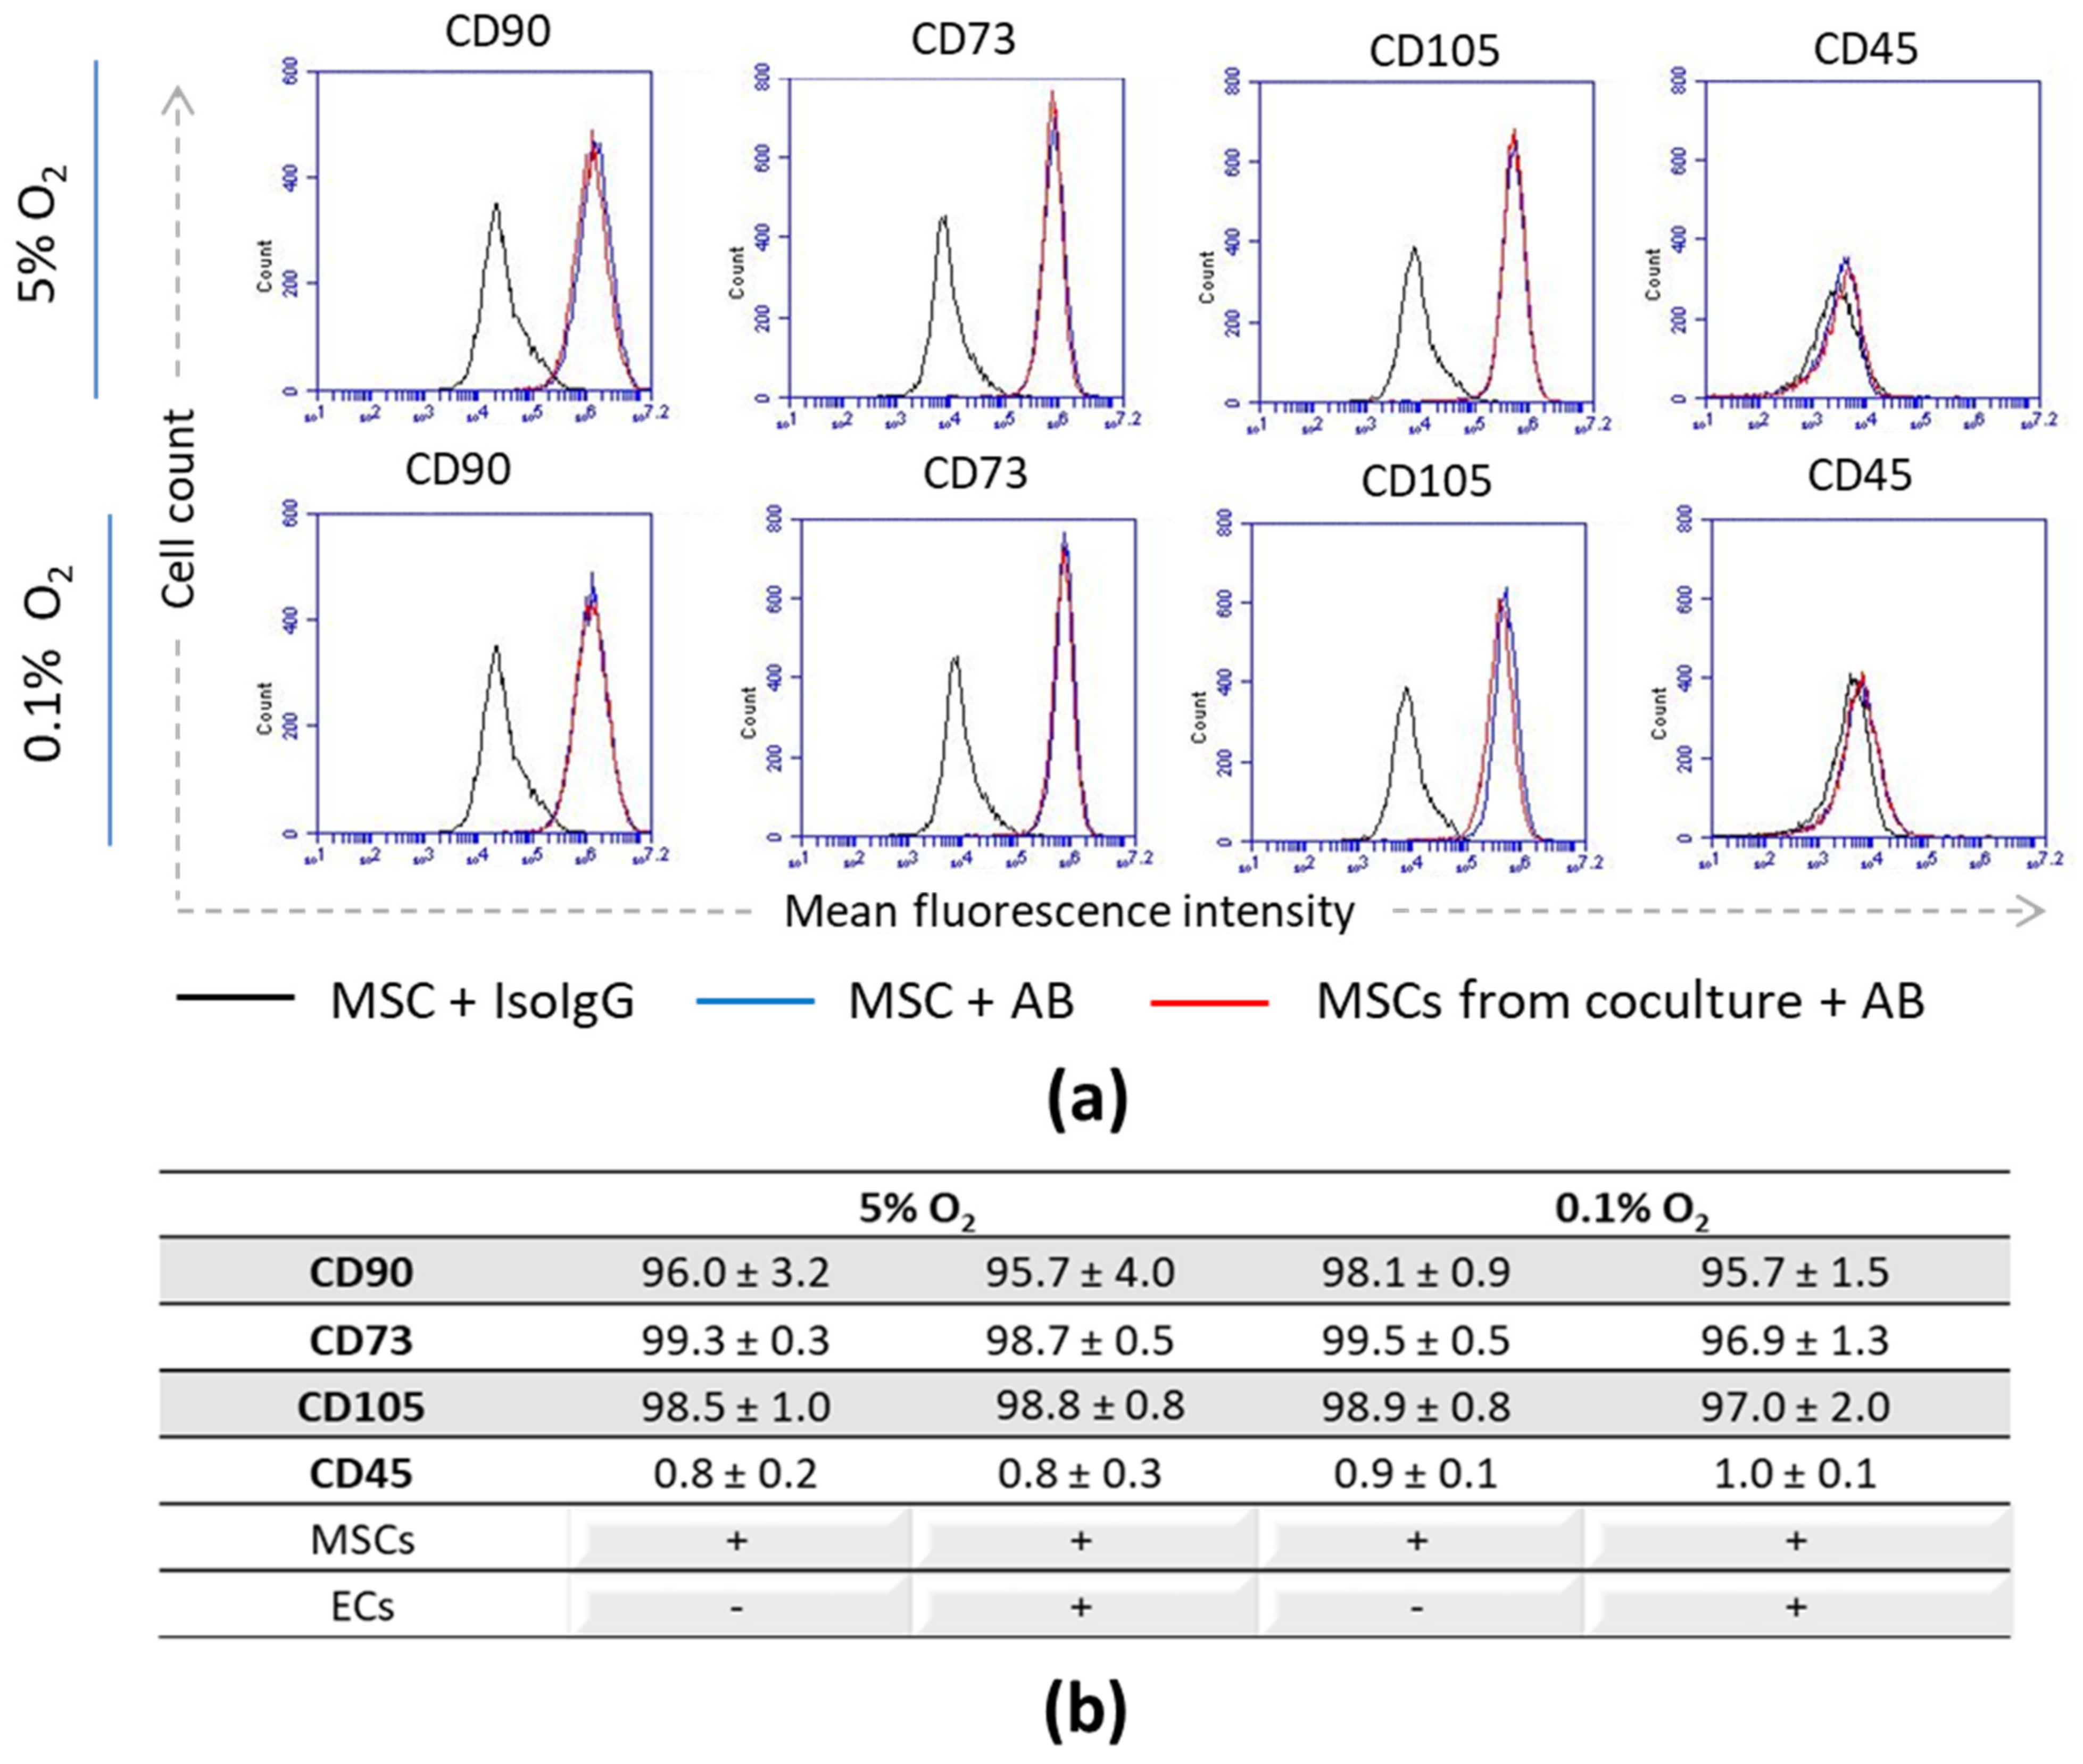
3.1. Stromal Phenotype and Progenitor State of MSCs upon Interaction with ECs

MSCs, as stromal precursors, exhibit a number of activities that determine their relevance in regenerative medicine. There is, first of all, a low-committed state that determines the ability to multilineage differentiation, high proliferative and paracrine potential, and the ability to migrate.
The stromal phenotype of MSCs implies the expression of CD90, CD73, and CD105 surface molecules [52]. Adipose tissue-derived MSCs used in the experiments met the minimal criteria of the International Society for Cellular Therapy: they rapidly attached to plastic, had a fibroblast-like shape, and proliferated for a long time in the culture, differentiated into adipo- and osteo-directions, expressed stromal markers CD90, CD73, and CD105 and did not bear hematopoietic pan-leukocyte CD45 antigen (Figure 2a).
It was demonstrated that a high CD90 expression was typical of all MSCs, regardless of the source of their isolation, and correlated with the undifferentiated cell state, while the proportion of CD90+ cells decreased with an increase in commitment [53,54]. In our study, MSCs showed a similar level of stromal marker expression in monoculture and in co-culture with ECs, regardless of the O2 levels (Figure 2a,b).
After 24 h of co-culture, specific patterns of MSC and EC distribution were observed. The ECs were organized in clusters surrounded by MSCs. The modes of MSC and EC distribution were similar under both O2 levels (Figure 3a).
Short-term interaction with ECs also had no effect on the number of CFU-f among MSCs (Figure 3b), which may indicate their preserved proliferative ability.
To assess the potential of self-maintenance/differentiation, the expression of genes responsible for the “stemness” properties (OCT4, SOX2, NANOG) and the expression of genes that regulate the osteogenic (RUNX2), adipogenic (PPARγ), and chondrogenic (SOX9) differentiation were analyzed in MSCs (Figure 3c).
After co-culture with ECs at 5% O2, the level of NANOG was 2-fold downregulated, and OCT4 was 1,6-fold upregulated. The transcription of osteodifferentiation master gene RUNX2 was more than 2-fold elevated, while chondrodifferentiation master gene SOX9—almost 2-fold decreased. Under hypoxic stress (0.1% O2), interaction with ECs had no significant effect on the transcription of “stemness” OCT4 and NANOG, the transcription of SOX2 was significantly reduced. SOX9 downregulation was more pronounced, while the expression of RUNX2 had no significant changes. Therefore, the profile of genes whose products are involved in MSC self-maintenance/differentiation changed differentially after short-term contact with ECs under hypoxic stress or “physiological” hypoxia.

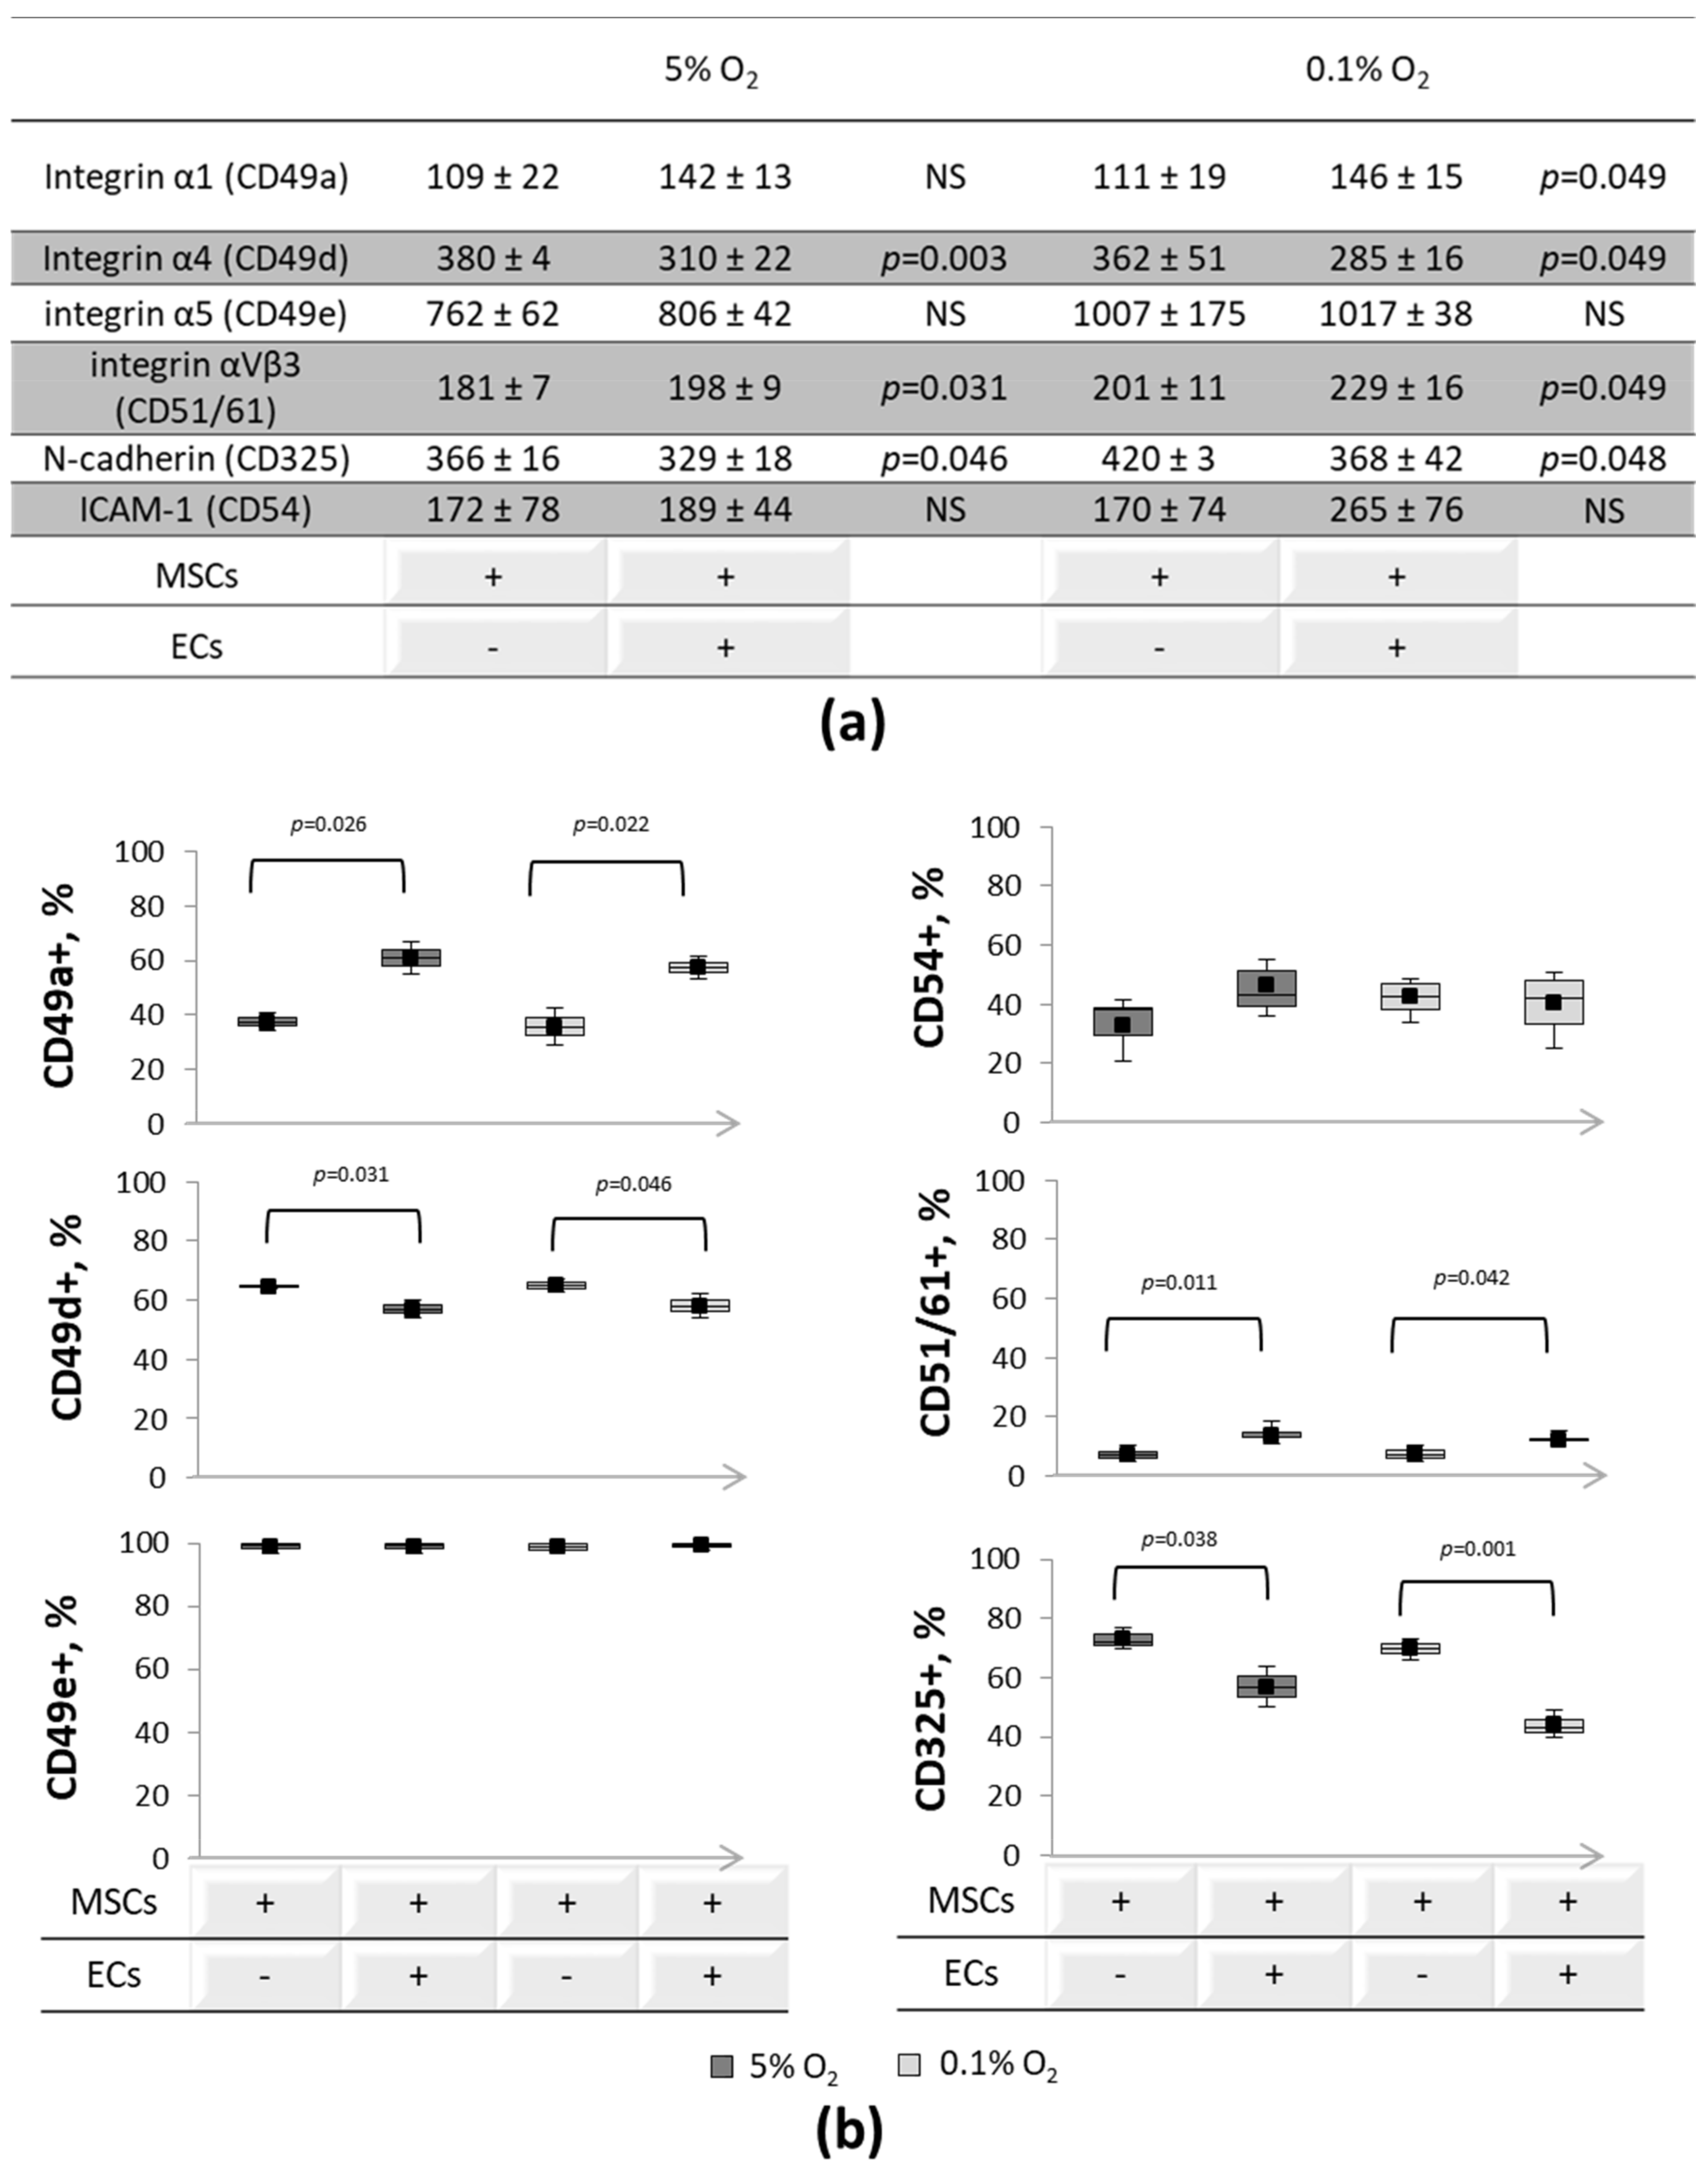
3.2. Expression of Cell-to-Cell and Cell-Matrix Adhesion Molecules

After a short-term interaction with ECs, the proportions of MSCs expressing integrin α1 and integrin αVβ3 were increased, whereas the percentages of MSCs carrying integrin α4 and N-cadherin were decreased both at 5% and 0.1% O2 (Figure 4a).
These changes were accompanied by corresponding alterations in the number of adhesion molecules calculated as mean fluorescence intensity (MFI) (Figure 4b). MFI of integrin α1 and integrin αVβ3 were elevated, while integrin α4 and N-cadherin were stained less intensively. The interaction had no effect on the proportions and MFI of ICAM-1-positive MSCs. Upon short-term hypoxic stress, the MSC integrin α5 MFI increased significantly in both monoculture and co-culture (p = 0.047) (Figure 4b). MSCs in monocultures were exposed at the same O2 levels as co-cultures (at 5% or 0.1%, accordingly).
Thus, the interaction with ECs at different O2 (5%, 0.1% O2) resulted in a changed expression of MSC adhesion molecules involved in the formation of hetero- and homotypic intercellular contacts as well as contacts with the extracellular matrix.

3.3. Interleukin’s Profiles upon EC-MSC Interactions

After short-term hypoxic exposures (5% O2 vs. 0.1% O2), the levels of IL-6 or IL-8 were quite close in MSC monocultures. Similar effects were observed in EC monocultures (Figure 5a).
At “physiological” hypoxia, The MSC-EC interactions resulted in a substantial increase in IL-6 and IL-8, significantly exceeding the levels of these cytokines in MSC and EC monocultures, accordingly. At 0.1% O2, the concentration of IL-6 after the MSC-EC co-cultures was notably lower, while the IL-8 level was remarkably higher compared to that at 5% O2 (Figure 5a). RT-PCR data were consistent with the results of the ELISA. At 5% O2, IL6 and IL8 were upregulated in ECs and MSCs after cocultivation. Under hypoxic stress, this effect was less pronounced for IL6 in contrast to IL8 which was significantly upregulated in both cell types (Figure 5b).

3.4. EC Paracrine Influence on MSC Migratory Potential

The paracrine effects of ECs on MSC migration were assessed in non-targeted (“scratch”) (Figure 6a) and targeted (Transwell® culture plates) (Figure 6b) assays.
After “scratch”, the motility of MSCs in MSC culture medium or EC conditioned medium was similar at 5% and 0.1% O2 (Figure 6c). Meanwhile, the number of migrating MSCs in Transwell® culture plates was significantly higher in EC conditioned medium under both O2 conditions. EC paracrine regulation significantly stimulated targeted migration of MSCs enhancing its response to chemotactic stimuli (Figure 6d).

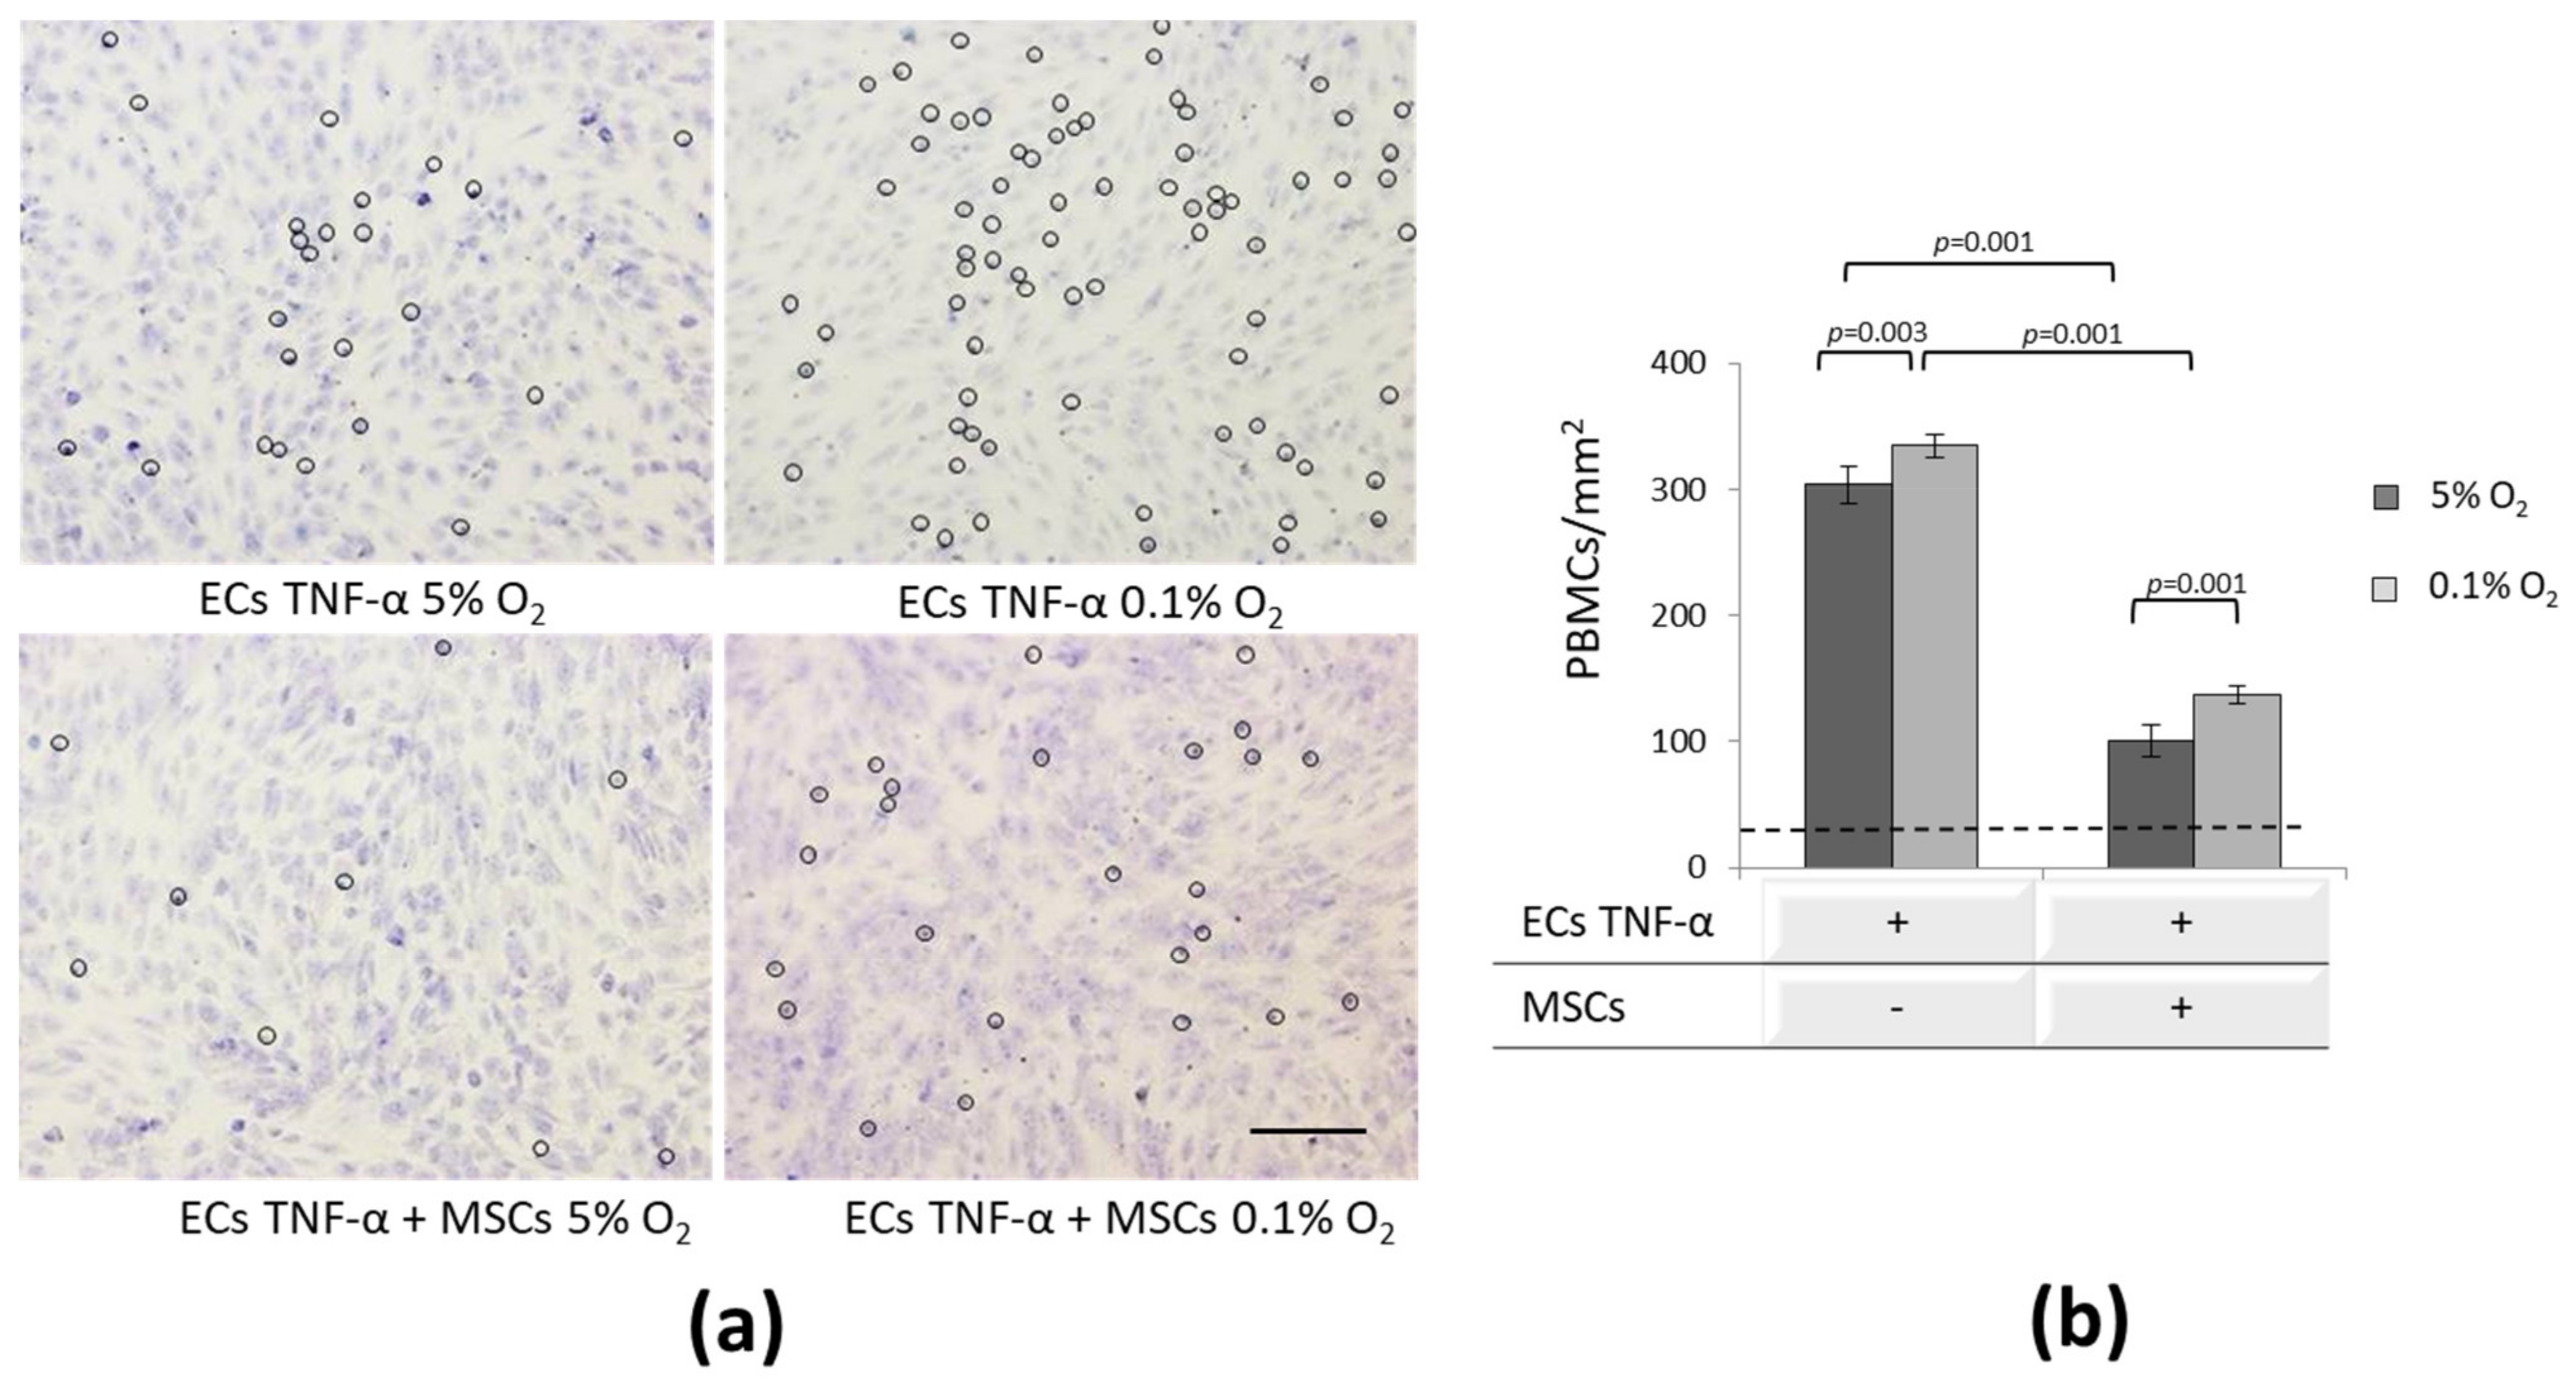
3.5. Effect of MSCs on Inflammatory-Activated ECs

The above data have shown that a short-term interaction with EC led to an alteration in the functional activity of MSCs. It is reasonable to suppose that during the contact, MSCs can affect the EC properties in physiological and pathological conditions. Inflammatory mediators in the sites of injury are known to provoke endothelial dysfunction negatively affecting regenerative processes [55,56,57,58]. Increased adhesion of circulating immune cells to inflammatory-activated ECs and elevated oxidative stress in ECs are the most marked manifestations of endothelial dysfunction [59,60,61,62].
We analyzed the effects of MSCs on quiescent and TNF-α activated ECs at different O2 levels.
Both quiescent and TNF-α primed ECs in monoculture expressed a high level of endothelial markers PECAM and VE-cadherin (Figure 7a). After interaction with MSCs, no changes were detected in the surface presentation of the above adhesion molecules (Figure 7b,c).
The expression of molecules involved in the adhesion of immune cells to the ECs VCAM-1 (CD106), E-selectin (CD62E), ICAM-1 (CD54)), and integrin α1 (CD49a) were analyzed in EC monocultures. As a result of TNF-α activation, MFI of ICAM-1 and integrin α1 expression was increased. Foreseen elevation of these molecules was retained in co-culture with MSCs at both O2 levels.
The increased adhesion of PBMCs to inflammatory-activated ECs is one of the marked manifestations of endothelial dysfunction. To find out how MSCs can govern this process, we examined the attachment of PBMCs to quiescent and TNF-α primed ECs (Figure 8a).
The surface of quiescent ECs was non-adhesive for PBMCs both in monoculture and in co-culture with MSCs (Figure 8b, dotted line). TNF-α primed ECs in monoculture supported a significantly higher level of PBMC adhesion at both O2 levels (Figure 8b). Compared to “physiological” hypoxia, acute hypoxic stress potentiated the adhesion of immune cells to TNF-α ECs (Figure 8b). In the presence of MSCs, a substantial reduction in the adhesion of PBMCs was observed. The effect was more pronounced at 5% O2: 3-fold elevation vs. 2.3-fold at 0.1% O2. These results may indicate the negative effect of hypoxic stress on the MSC’s ability to support the EC barrier function (Figure 8b).
Noteworthy, the decreased number of adhered PBMCs in EC-MSC co-cultures was not associated with a change in the expression of adhesion molecules integrin α1, VE-cadherin, ICAM-1, VCAM-1, and E-selectin on ECs (Figure 7). This suggests the existence of some additional mechanisms that reduce TNF-α EC-adhesivity in the presence of MSCs.
In addition to the adhesion molecules, NO synthase that regulates the production of nitric oxide (NO) plays an important role in the EC physiological maintenance. The activity of NO-synthase may be changed under stress conditions, which will be reflected on the level of its metabolite—NO [63]. NO levels in quiescent and TNF-α ECs in monocultures and co-cultures with MSCs were determined using flow cytometry (Figure 9a).
Under hypoxic stress (0.1% O2), NO level in monocultured ECs was 6–7 times higher vs. 5% O2. Inflammatory activation resulted in a slight but significant increase in NO in ECs at 5% O2 but had no effect at 0.1% O2. In the co-culture with MSCs, NO levels were partially decreased both in quiescent and TNF-α ECs under hypoxic stress only (Figure 9a).
Using RT-PCR, the transcription of NOS3 (endothelial NO synthase) in ECs before and after interaction with MSCs was characterized. NOS3 expression did not differ in quiescent and TNF-α ECs in monoculture and co-culture with MSCs. Hypoxic stress (0.1% O2) provoked substantial upregulation of NOS3 in ECs vs. 5% O2. In the presence of MSCs, a partial downregulation of NOS3 under hypoxic stress was observed. These data are in good agreement with the cytometry data on NO levels (Figure 9b).
Therefore, during short-term interaction under “physiological” hypoxia, MSCs attenuated the ability of inflammatory-activated ECs to support PBMC adhesion. Under hypoxic stress, this effect was attenuated, which may be associated with an increased NO production and inhibition of NO-synthase transcription in ECs.

4. Discussion

The aim of this study was to determine how the functional activity of MSCs changes after a short-term interaction with ECs under “physiological” hypoxia (tissue-related O2) and under a critical O2 reduction (acute hypoxic stress).
In addition, we were interested in how MSCs can affect the properties of inflammatory-activated ECs at different levels of hypoxia. For these goals, we used the model of short-term EC-MSC contact co-cultures at 5% and 0.1% O2, respectively.
Firstly, we will consider changes in MSCs after interaction with ECs under “physiological” hypoxia.
The progenitor state of MSCs before and after interaction with ECs was characterized by expression of stromal markers, the number of CFU-f, transcription of differentiation master genes (osteogenic—RUNX2, adipogenic—PPARγ, and chondrogenic—SOX9), as well as of the “stemness” genes (OCT4, NANOG, SOX2). The short-term contact with ECs was found to be sufficient to induce changes in MSCs at the transcriptional level. The observed SOX9 downregulation and RUNX2 upregulation may be related to the reciprocal regulation of these transcription factors during osteodifferentiation [64] and indicate the osteogenic commitment of MSCs. Meanwhile, earlier it was demonstrated that the upregulation of differentiation-related genes in MSCs after contact with ECs was not sufficient for initiation of functionally competent progeny [17,65]. Moreover, even after a long-term interaction with ECs, MSCs retained multilineage potential despite the changes in the transcriptomic profile [17]. Our data on the preserved stromal phenotype and clonally active stromal progenitor pool under tissue-related O2 clearly support the above assumptions.
It is well established that the migration, proliferation, and differentiation of MSCs are regulated by communications with various cell types and extracellular matrix through intercellular adhesion molecules and integrin receptors [66,67]. In our study, the expression of homotypic intercellular contact protein (N-cadherin) and integrin α4 on MSCs was decreased after interaction with ECs. Simultaneously, the expression of proteins involved in migration and the formation of heterocellular MSC-EC contacts (integrin α1, integrin αVβ3) was increased.
Cadherin–cadherin contacts are known to provide a connection between the cytoskeleton components of neighboring cells [68,69,70,71]. A high level of N-cadherin expression is assumed to be characteristic of low committed stromal progenitors [72,73,74]. A decrease of N-cadherin expression was detected in osteodifferentiated MSCs [75,76]. Attenuation of N-cadherin expression observed here can be interpreted as a sign of MSC commitment, which is consistent with our data on downregulation of chondroregulator SOX9 and upregulation of osteoregulator RUNX2.
Integrin α1 is involved in the MSC adhesion to ECs [77]. Its elevation in our experiments confirms the formation of heterocellular contacts during an interaction. Along with other receptors, integrin αVβ3 mediates homing and migration of stromal cells [77]. Elevation of integrin αVβ3 expression in myofibroblasts was observed as a consequence of the increase in fibronectin synthesis [78]. In our case, this path of integrin αVβ3 regulation apparently can be involved, since both ECs and MSCs produce fibronectin. On the whole, alteration of adhesion molecule profile after interaction with ECs may indicate the formation of the migratory phenotype of MSCs. This assumption is supported by our findings on the enhanced targeted migration of MSCs in vitro.
MSCs are able to secrete a number of soluble mediators that are important for reparative process. Transcriptional changes of certain cytokines and growth factors in MSCs following interaction with ECs have been described earlier [79,80]. For the first time, in the present study, we not only analyzed the amount of IL-6 and IL-8 in a conditioned medium but estimated the transcriptional activity of these interleukins in both cell types. We managed to demonstrate that the significant increase in IL-6 and IL-8 after co-culture can be a result of the up-regulation of relevant genes in ECs and MSCs. As a potential explanation of the above effects, the VEGF production by MSCs can be considered. VEGF has been shown to upregulate IL6 and IL8 in ECs through binding to the VEGFR2 receptor and activation of interleukin gene’ transcription via protein kinase D1 [81]. On the other hand, ECs can synthesize IL-1α, and its secretion was shown to increase under hypoxia [82]. IL-1α possesses IL-1β-like activity resulted in elevated production of IL-6 and IL-8 [83]. Based on the above, it can be supposed that VEGF and IL-1α—mediated signaling pathways—favored upregulation of IL6 and IL8 genes in communicated MSCs and ECs supporting increased production of these interleukins.
Therefore, at “physiological” hypoxia, interaction with ECs can positively modulate the MSC activities requested in cell therapy. The “stemness”/differentiation gene shift, which consists of the increased activity of the latter, was found in MSCs. Changes in the expression of surface molecules responsible for MSC migration and homo- and hetero-cellular contacts, as well as an increase in the transcription/translation of the main proinflammatory cytokines IL-6 and IL-8, may facilitate MSC migration to target tissues.
Another issue raised in this study was how a critical decrease in O2, as a component of ischemia in tissue damage, can affect the EC-MSC interaction.
The effects of ECs on MSCs under hypoxic stress (0.1% O2, 24 h) were similar to those at “physiological” hypoxia (5% O2). MSCs retained their stromal phenotype and clonogenic activity and showed signs of commitment at the transcriptional level. Under hypoxic stress, “physiological” hypoxia-induced upregulation of RUNX2 was canceled and an additional SOX2 downregulation occurred in MSCs. Co-culture caused similar changes in the expression of adhesion molecules, interleukins’ production, and MSC migratory activity. At the same time, hypoxic stress partially eliminated the increase in IL-6 production and stimulated a significant increase in IL-8 in the MSC-EC co-cultures. Similar patterns of IL-6 and IL-8 expression were described in co-cultures of MSC and hematopoietic cells at 1% O2 [84]. Although the mechanisms of hypoxic effects on the paracrine activity of MSCs in co-culture with other cells are not fully understood, the involvement of the HIF, Notch, Wnt/β-catenin, and Hedgehog signaling pathways is assumed [84,85]. As mentioned above, VEGF and IL-1α may be involved in the regulation of cytokine production in MSCs and ECs. Considering the stimulating effect of hypoxia on the production of IL-1α in ECs [82], its role in the induction of IL-8 expression under hypoxic stress may be supposed. Integrin α5 elevation was observed in MSCs in monoculture as well as in co-culture with ECs, which may indicate a potentiating effect of oxygen deprivation on the expression of this molecule, as suggested by Saller et al. [86] and Choi et al. [87].
It is obvious that upon MSC-EC interaction the EC activity could be altered as well. In this study, we evaluated the effect of MSCs on functions of inflammatory-activated ECs.
In the body, ECs form a barrier—the main role of which is the regulation of permeability of the vascular wall for different substances and cells including immune ones [61]. The surface of quiescent ECs is non-adhesive for PBMCs. Increased endothelial permeability as a result of inflammatory activation is an important mechanism in the response to damage. Various inflammatory cytokines (TNF-α, IL-1β, IFN-γ) activate ECs provoking the expression of adhesion molecules mediating further interaction with PBMCs [14,55,88]. Activated ECs do not restrict but enhance transendothelial migration of immune cells into the tissues, which indicates an important role of EC activation in the immune response [58]. All the above factors, along with the inflammatory induction of oxidative stress in ECs, interfere with successful tissue regeneration [56,57].
In animal models of inflammatory diseases, a decreased systemic inflammatory response was found after MSC administration, but the exact mechanisms remain unknown [89,90,91]. Apparently, MSCs may be involved in the regulation of the endothelial monolayer permeability [92]. To understand the possible mechanisms of MSC effects on EC activation under “physiological” hypoxia (5% O2) and acute O2 deprivation (0.1%), we analyzed the effect of co-culture with MSCs on the expression of adhesion molecules, PBMCs’ adhesion, and on the oxidative stress level (NO production and NOS3 activity) in ECs.
Under “physiological” hypoxia in monoculture, inflammatory activation of ECs resulted in integrin α1 and ICAM-1 elevation, increased NO production, and enhanced ability to adhere PBMCs. Interaction with MSCs had no effect on the expression of adhesion molecules and partially eliminated the manifestations of oxidative stress in ECs. Meanwhile, a significant decrease in the adhesiveness of activated ECs for PBMCs was observed, which confirms the ability of MSCs to attenuate the inflammatory state of ECs. Actually, in the animal hemorrhagic shock model, the therapeutic effect of MSCs was shown to reduce leukocyte infiltration [61]. A decreased EC ability to attract and support the adhesion of immune cells was demonstrated in the presence of MSCs in vitro, which authors associated with MSC-produced cytokines, IL-6 and TGFβ [79,93]. As shown in the present study, EC–MSC interaction under “physiological” hypoxia was followed by a multifold increase in IL-6 level in the conditioned medium, which was associated with an increase in IL-6 transcription in both cell types. Apparently, this had a positive effect on the reduction of EC adhesiveness for PBMCs. It can be concluded that under “physiological” hypoxia, MSCs had a protective effect on activated ECs, thus reducing the manifestation of inflammatory activation.
Under hypoxic stress, the protective effects of MSCs were less pronounced. The above effect may be related to the fact that under hypoxic conditions (1% O2), ECs produce the HAL1/13 adhesion molecule, which contributes to an increase in their adhesiveness for PBMCs [94], and also are characterized by ICAM-1 elevation [95]. Apparently, a higher basal expression of ICAM-1 and other molecules involved in the EC–PBMC interaction under hypoxic stress may cause the attenuated MSC effects on the adhesiveness of ECs.
Therefore, as a result of short-term interaction with ECs under “physiological” hypoxia, the functional activity of MSCs was modified, which may be relevant for the process of reparative tissue remodeling. In the presence of MSCs, signs of EC activation, such as NO production and increased PBMC adhesion, are partially eliminated. Compared to “physiological“ hypoxia, acute hypoxic stress may attenuate the stimulating effect of ECs on MSCs as well as partially cancel the “protective” effect of MSCs on activated ECs.

Author Contributions

Conceptualization, E.A. and L.B.; supervision, project administration, E.A.; methodology, E.A., O.Z. and M.E.; investigation, validation, formal analysis, visualization, O.Z. and M.E.; writing—original draft preparation, E.A. and O.Z.; writing—review and editing, L.B. All authors have read and agreed to the published version of the manuscript.

Funding

This research was supported in part by Russian Science Foundation (grant number 14-15-00693), Program of Basic Research of IBMP RAS (project 65.3); Grant from President of Russian Federation MK-808.2020.4.

Institutional Review Board Statement

The study was conducted according to the guidelines of the Declaration of Helsinki, and approved by Biomedicine Ethics Committee of the Institute of Biomedical Problems, Russian Academy of Sciences (Protocol #483, 30/09/2018, Protocol t #550/MCK/22/07/2020, Protocol #549/END/22/07/2020).

Informed Consent Statement

Informed consent was obtained from all subjects involved in the study.

Data Availability Statement

Data are available to colleagues upon reasonable request.

Conflicts of Interest

The authors declare no conflict of interest. The funders had no role in the design of the study; in the collection, analyses, or interpretation of data; in the writing of the manuscript, or in the decision to publish the results.

Abbreviations

MSCsMesenchymal stem cells
IFATSInternational Federation for Adipose Therapeutics and Science
ISCTInternational Society for Cell and Gene Therapy
CDCluster of differentiation
CMConditioned medium
ECsEndothelial cells
FBSFetal bovine serum
PBMCPeripheral blood mononuclear cells

References

  1. Caplan, A.I.; Correa, D. The MSC: An injury drugstore. Cell Stem Cell 2011, 9, 11–15. [Google Scholar] [CrossRef] [PubMed] [Green Version]
  2. Squillaro, T.; Peluso, G.; Galderisi, U. Clinical trials with mesenchymal stem cells: An Update. Cell Transplant. 2016, 25, 829–848. [Google Scholar] [CrossRef] [PubMed] [Green Version]
  3. Perez, J.R.; Kouroupis, D.; Li, D.J.; Best, T.M.; Kaplan, L.; Correa, D. Tissue engineering and cell-based therapies for fractures and bone defects. Front. Bioeng. Biotechnol. 2018, 6, 105. [Google Scholar] [CrossRef] [PubMed] [Green Version]
  4. Cuesta-Gomez, N.; Graham, G.J.; Campbell, J.D.M. Chemokines and their receptors: Predictors of the therapeutic potential of mesenchymal stromal cells. J. Transl. Med. 2021, 19, 156. [Google Scholar] [CrossRef] [PubMed]
  5. Dimarino, A.M.; Caplan, A.I.; Bonfield, T.L. Mesenchymal stem cells in tissue repair. Front. Immunol. 2013, 4, 201. [Google Scholar] [CrossRef] [PubMed] [Green Version]
  6. Marquez-Curtis, L.A.; Janowska-Wieczorek, A.; McGann, L.E.; Elliott, J.A. Mesenchymal stromal cells derived from various tissues: Biological, clinical and cryopreservation aspects. Cryobiology 2015, 71, 181–197. [Google Scholar] [CrossRef] [Green Version]
  7. Luo, R.; Lu, Y.; Liu, J.; Cheng, J.; Chen, Y. Enhancement of the efficacy of mesenchymal stem cells in the treatment of ischemic diseases. Biomed. Pharmacother. 2019, 109, 2022–2034. [Google Scholar] [CrossRef]
  8. Galipeau, J.; Sensébé, L. Mesenchymal Stromal Cells: Clinical challenges and therapeutic opportunities. Cell Stem Cell 2018, 2, 824–833. [Google Scholar] [CrossRef] [Green Version]
  9. Sanchez-Diaz, M.; Quiñones-Vico, M.I.; Sanabria de la Torre, R.; Montero-Vílchez, T.; Sierra-Sánchez, A.; Molina-Leyva, A.; Arias-Santiago, S. Biodistribution of mesenchymal stromal cells after administration in animal models and humans: A systematic review. J. Clin. Med. 2021, 10, 2925. [Google Scholar] [CrossRef] [PubMed]
  10. Lu, J.; Shen, S.M.; Ling, Q.; Wang, B.; Li, L.R.; Zhang, W.; Qu, D.D.; Bi, Y.; Zhu, D.L. One repeated transplantation of allogeneic umbilical cord mesenchymal stromal cells in type 1 diabetes: An open parallel controlled clinical study. Stem Cell. Res. Ther. 2021, 12, 340. [Google Scholar] [CrossRef]
  11. Leibacher, J.; Henschler, R. Biodistribution, migration and homing of systemically applied mesenchymal stem/stromal cells. Stem Cell Res. Ther. 2016, 7, 7. [Google Scholar] [CrossRef] [PubMed] [Green Version]
  12. Zachar, L.; Bačenková, D.; Rosocha, J. Activation, homing, and role of the mesenchymal stem cells in the inflammatory environment. J. Inflamm. Res. 2016, 9, 231–240. [Google Scholar] [CrossRef] [Green Version]
  13. Nitzsche, F.; Müller, C.; Lukomska, B.; Jolkkonen, J.; Deten, A.; Boltze, J. Concise review: MSC adhesion cascade-insights into homing and transendothelial migration. Stem Cells 2017, 35, 1446–1460. [Google Scholar] [CrossRef] [PubMed] [Green Version]
  14. Teo, G.S.; Ankrum, J.A.; Martinelli, R.; Boetto, S.E.; Simms, K.; Sciuto, T.E.; Dvorak, A.M.; Karp, J.M.; Carman, C.V. Mesenchymal stem cells transmigrate between and directly through tumor necrosis factor-α-activated endothelial cells via both leukocyte-like and novel mechanisms. Stem Cells 2012, 30, 2472–2486. [Google Scholar] [CrossRef] [PubMed] [Green Version]
  15. Guo, Y.C.; Chiu, Y.H.; Chen, C.P.; Wang, H.S. Interleukin-1β induces CXCR3-mediated chemotaxis to promote umbilical cord mesenchymal stem cell transendothelial migration. Stem Cell Res. Ther. 2018, 9, 281. [Google Scholar] [CrossRef]
  16. Li, J.; Ma, Y.; Teng, R.; Guan, Q.; Lang, J.; Fang, J.; Long, H.; Tian, G.; Wu, Q. Transcriptional profiling reveals crosstalk between mesenchymal stem cells and endothelial cells promoting prevascularization by reciprocal mechanisms. Stem Cells Dev. 2015, 24, 610–623. [Google Scholar] [CrossRef] [Green Version]
  17. Lin, C.H.; Lilly, B. Endothelial cells direct mesenchymal stem cells toward a smooth muscle cell fate. Stem Cells Dev. 2014, 23, 2581–2590. [Google Scholar] [CrossRef] [Green Version]
  18. Merfeld-Clauss, S.; Gollahalli, N.; March, K.L.; Traktuev, D.O. Adipose tissue progenitor cells directly interact with endothelial cells to induce vascular network formation. Tissue Eng. Part A 2010, 16, 2953–2966. [Google Scholar] [CrossRef] [PubMed] [Green Version]
  19. Carreau, A.; El Hafny-Rahbi, B.; Matejuk, A.; Grillon, C.; Kieda, C. Why is the partial oxygen pressure of human tissues a crucial parameter? Small molecules and hypoxia. J. Cell. Mol. Med. 2011, 15, 1239–1253. [Google Scholar] [CrossRef] [PubMed] [Green Version]
  20. Ivanovic, D.M.; Rodríguez Mdel, P.; Pérez, H.T.; Alvear, J.A.; Almagià, A.F.; Toro, T.D.; Urrutia, M.S.; Cruz, A.L.; Ivanovic, R.M. Impact of nutritional status at the onset of elementary school on academic aptitude test achievement at the end of high school in a multicausal approach. Br. J. Nutr. 2009, 102, 142–154. [Google Scholar] [CrossRef] [PubMed] [Green Version]
  21. Fehrer, C.; Brunauer, R.; Laschober, G.; Unterluggauer, H.; Reitinger, S.; Kloss, F.; Gülly, C.; Gassner, R.; Lepperdinger, G. Reduced oxygen tension attenuates differentiation capacity of human mesenchymal stem cells and prolongs their lifespan. Aging Cell 2007, 6, 745–757. [Google Scholar] [CrossRef] [PubMed]
  22. Dos Santos, F.; Andrade, P.Z.; Boura, J.S.; Abecasis, M.M.; da Silva, C.L.; Cabral, J.M. Ex vivo expansion of human mesenchymal stem cells: A more effective cell proliferation kinetics and metabolism under hypoxia. J. Cell. Physiol. 2010, 223, 27–35. [Google Scholar] [CrossRef]
  23. Buravkova, L.B.; Rylova, Y.V.; Andreeva, E.R.; Kulikov, A.V.; Pogodina, M.V.; Zhivotovsky, B.; Gogvadze, V. Low ATP level is sufficient to maintain the uncommitted state of multipotent mesenchymal stem cells. Biochim. Biophys. Acta 2013, 1830, 4418–4425. [Google Scholar] [CrossRef] [PubMed]
  24. Buravkova, L.B.; Andreeva, E.R.; Gogvadze, V.; Zhivotovsky, B. Mesenchymal stem cells and hypoxia: Where are we? Mitochondrion 2014, 19, 105–112. [Google Scholar] [CrossRef]
  25. Choi, J.R.; Pingguan-Murphy, B.A. In situ normoxia enhances survival and proliferation rate of human adipose tissue-derived stromal cells without increasing the risk of tumourigenesis. PLoS ONE 2015, 10, e0115034. [Google Scholar] [CrossRef]
  26. Ali, N.M.; Boo, L.; Yeap, S.K.; Ky, H.; Satharasinghe, D.A.; Liew, W.C.; Ong, H.K.; Cheong, S.K.; Kamarul, T. Probable impact of age and hypoxia on proliferation and microRNA expression profile of bone marrow-derived human mesenchymal stem cells. PeerJ 2016, 2016, e1536. [Google Scholar] [CrossRef]
  27. Ratushnyy, A.Y.; Rudimova, Y.V.; Buravkova, L.B. Alteration of hypoxia-associated gene expression in replicatively senescent mesenchymal stromal cells under physiological oxygen level. Biochemistry 2019, 84, 263–271. [Google Scholar] [CrossRef] [PubMed]
  28. Huang, Y.C.; Parolini, O.; Deng, L.; Yu, B.S. Should hypoxia preconditioning become the standardized procedure for bone marrow MSCs preparation for clinical use? Stem Cells 2016, 34, 1992–1993. [Google Scholar] [CrossRef] [Green Version]
  29. Han, K.H.; Kim, A.K.; Kim, D.I. Therapeutic potential of human mesenchymal stem cells for treating ischemic limb diseases. Int. J. Stem Cells 2016, 9, 163–168. [Google Scholar] [CrossRef] [Green Version]
  30. Ward, M.R.; Abadeh, A.; Connelly, K.A. Concise Review: Rational use of mesenchymal stem cells in the treatment of ischemic heart disease. Stem Cells Transl. Med. 2018, 7, 543–550. [Google Scholar] [CrossRef] [PubMed]
  31. Yan, J.; Liang, J.; Cao, Y.; El Akkawi, M.M.; Liao, X.; Chen, X.; Li, C.; Li, K.; Xie, G.; Liu, H. Efficacy of topical and systemic transplantation of mesenchymal stem cells in a rat model of diabetic ischemic wounds. Stem Cell Res. Ther. 2021, 12, 220. [Google Scholar] [CrossRef] [PubMed]
  32. Majumdar, D.; Bhonde, R.; Datta, I. Influence of ischemic microenvironment on human Wharton’s Jelly mesenchymal stromal cells. Placenta 2013, 34, 642–649. [Google Scholar] [CrossRef] [PubMed]
  33. Hu, M.; Guo, G.; Huang, Q.; Cheng, C.; Xu, R.; Li, A.; Liu, N.; Liu, S. The harsh microenvironment in infarcted heart accelerates transplanted bone marrow mesenchymal stem cells injury: The role of injured cardiomyocytes-derived exosomes. Cell Death Dis. 2018, 9, 357. [Google Scholar] [CrossRef] [Green Version]
  34. Zhang, W.; Su, X.; Gao, Y.; Sun, B.; Yu, Y.; Wang, X.; Zhang, F. Berberine protects mesenchymal stem cells against hypoxia-induced apoptosis in vitro. Biol. Pharm. Bull. 2009, 32, 1335–1342. [Google Scholar] [CrossRef] [Green Version]
  35. Peterson, K.M.; Aly, A.; Lerman, A.; Lerman, L.O.; Rodriguez-Porcel, M. Improved survival of mesenchymal stromal cell after hypoxia preconditioning: Role of oxidative stress. Life Sci. 2011, 88, 65–73. [Google Scholar] [CrossRef] [Green Version]
  36. Lavrentieva, A.; Majore, I.; Kasper, C.; Hass, R. Effects of hypoxic culture conditions on umbilical cord-derived human mesenchymal stem cells. Cell Commun. Signal. 2010, 8, 18. [Google Scholar] [CrossRef] [Green Version]
  37. Deschepper, M.; Oudina, K.; David, B.; Myrtil, V.; Collet, C.; Bensidhoum, M.; Logeart-Avramoglou, D.; Petite, H. Survival and function of mesenchymal stem cells (MSCs) depend on glucose to overcome exposure to long-term, severe and continuous hypoxia. J. Cell. Mol. Med. 2011, 15, 1505–1514. [Google Scholar] [CrossRef] [PubMed]
  38. Raheja, L.F.; Genetos, D.C.; Wong, A.; Yellowley, C.E. Hypoxic regulation of mesenchymal stem cell migration: The role of RhoA and HIF-1α. Cell Biol. Int. 2011, 35, 981–999. [Google Scholar] [CrossRef]
  39. Udartseva, O.O.; Lobanova, M.V.; Andreeva, E.R.; Buravkov, S.V.; Ogneva, I.V.; Buravkova, L.B. Acute hypoxic stress affects migration machinery of tissue O2-adapted adipose stromal cells. Stem Cells Int. 2016, 2016, 7260562. [Google Scholar] [CrossRef]
  40. Lee, J.A.; Kim, B.I.; Jo, C.H.; Choi, C.W.; Kim, E.K.; Kim, H.S.; Yoon, K.S.; Choi, J.H. Mesenchymal stem-cell transplantation for hypoxic-ischemic brain injury in neonatal rat model. Pediatr. Res. 2010, 67, 42–46. [Google Scholar] [CrossRef] [PubMed] [Green Version]
  41. Andreeva, E.R.; Lobanova, M.V.; Udartseva, O.O.; Buravkova, L.B. Response of adipose tissue-derived stromal cells in tissue-related O2 microenvironment to short-term hypoxic stress. Cells Tiss Org. 2015, 200, 307–315. [Google Scholar] [CrossRef]
  42. Pogodina, M.V.; Buravkova, L.B. Expression of HIF-1α in multipotent mesenchymal stromal cells under hypoxic conditions. Bull. Exp. Biol. Med. 2015, 159, 355–357. [Google Scholar] [CrossRef] [PubMed]
  43. Crisostomo, P.R.; Wang, Y.; Markel, T.A.; Wang, M.; Lahm, T.; Meldrum, D.R. Human mesenchymal stem cells stimulated by TNF-alpha, LPS, or hypoxia produce growth factors by an NF kappa B- but not JNK-dependent mechanism. Am. J. Physiol. Cell. Physiol. 2008, 294, 675–682. [Google Scholar] [CrossRef]
  44. Rosová, I.; Dao, M.; Capoccia, B.; Link, D.; Nolta, J.A. Hypoxic preconditioning results in increased motility and improved therapeutic potential of human mesenchymal stem cells. Stem Cells 2008, 26, 2173–2182. [Google Scholar] [CrossRef] [PubMed] [Green Version]
  45. Busletta, C.; Novo, E.; Valfrè Di Bonzo, L.; Povero, D.; Paternostro, C.; Ievolella, M.; Mareschi, K.; Ferrero, I.; Cannito, S.; Compagnone, A.; et al. Dissection of the biphasic nature of hypoxia-induced motogenic action in bone marrow-derived human mesenchymal stem cells. Stem Cells 2011, 29, 952–963. [Google Scholar] [CrossRef] [PubMed]
  46. Zuk, P.A.; Zhu, M.; Mizuno, H.; Huang, J.; Futrell, J.W.; Katz, A.J.; Benhaim, P.; Lorenz, H.P.; Hedrick, M.H. Multilineage cells from human adipose tissue: Implications for cell-based therapies. Tissue Eng. 2001, 7, 211–228. [Google Scholar] [CrossRef] [Green Version]
  47. Buravkova, L.B.; Grinakovskaia, O.S.; Andreeva, E.R.; Zhambalova, A.P.; Kozionova, M.P. Characteristics of human lipoaspirate-isolated mesenchymal stromal cells cultivated under a lower oxygen tension. Cell Tissue Biol. 2009, 3, 23–28. [Google Scholar] [CrossRef]
  48. Feldman, D.L.; Mogelesky, T.C. Use of Histopaque for isolating mononuclear cells from rabbit blood. J. Immunol. Methods 1987, 102, 243–249. [Google Scholar] [CrossRef]
  49. Bourin, P.; Bunnell, B.A.; Casteilla, L.; Dominici, M.; Katz, A.J.; March, K.L.; Redl, H.; Rubin, J.P.; Yoshimura, K.; Gimble, J.M. Stromal cells from the adipose tissue-derived stromal vascular fraction and culture expanded adipose tissue-derived stromal/stem cells: A joint statement of the International Federation for Adipose Therapeutics and Science (IFATS) and the International Society for Cellular Therapy (ISCT). Cytotherapy 2013, 15, 641–648. [Google Scholar] [CrossRef] [PubMed] [Green Version]
  50. Liang, C.-C.; Park, A.Y.; Guan, J.-L. In vitro scratch assay: A convenient and inexpensive method for analysis of cell migration in vitro. Nat. Protoc. 2007, 2, 329–333. [Google Scholar] [CrossRef] [Green Version]
  51. Livak, K.J.; Schmittgen, T.D. Analysis of relative gene expression data using real-time quantitative PCR and the 2(-Delta Delta C(T)). Methods 2001, 25, 402–408. [Google Scholar] [CrossRef] [PubMed]
  52. Dominici, M.; Le Blanc, K.; Mueller, I.; Slaper-Cortenbach, I.; Marini, F.; Krause, D.; Deans, R.; Keating, A.; Prockop, D.J.; Horwitz, E. Minimal criteria for defining multipotent mesenchymal stromal cells. The International Society for Cellular Therapy position statement. Cytotherapy 2006, 8, 315–317. [Google Scholar] [CrossRef]
  53. Bradley, J.E.; Ramirez, G.; Hagood, J.S. Roles and regulation of Thy-1, a context-dependent modulator of cell phenotype. BioFactors 2009, 35, 258–265. [Google Scholar] [CrossRef] [Green Version]
  54. Moraes, D.A.; Sibov, T.T.; Pavon, L.F.; Alvim, P.Q.; Bonadio, R.S.; Da Silva, J.R.; Pic-Taylor, A.; Toledo, O.A.; Marti, L.C.; Azevedo, R.B.; et al. A reduction in CD90 (THY-1) expression results in increased differentiation of mesenchymal stromal cells. Stem Cell Res. Ther. 2016, 7, 97. [Google Scholar] [CrossRef] [PubMed] [Green Version]
  55. Min, J.K.; Kim, Y.M.; Kim, S.W.; Kwon, M.C.; Kong, Y.Y.; Hwang, I.K.; Won, M.H.; Rho, J.; Kwon, Y.G. TNF-related activation-induced cytokine enhances leukocyte adhesiveness: Induction of ICAM-1 and VCAM-1 via TNF receptor-associated factor and protein kinase C-dependent NF-kappaB activation in endothelial cells. J. Immunol. 2005, 175, 531–540. [Google Scholar] [CrossRef] [PubMed] [Green Version]
  56. Kryczka, J.; Boncela, J. Leukocytes: The Double-Edged Sword in Fibrosis. Mediat. Inflamm. 2015, 2015, 652035. [Google Scholar] [CrossRef] [Green Version]
  57. de Oliveira, S.; Rosowski, E.E.; Huttenlocher, A. Neutrophil migration in infection and wound repair: Going forward in reverse. Nat. Rev. Immunol. 2016, 16, 378–391. [Google Scholar] [CrossRef]
  58. Al-Soudi, A.; Kaaij, M.H.; Tas, S.W. Endothelial cells: From innocent bystanders to active participants in immune responses. Autoimmun. Rev. 2017, 16, 951–962. [Google Scholar] [CrossRef] [PubMed]
  59. Muller, W.A. Leukocyte-endothelial-cell interactions in leukocyte transmigration and the inflammatory response. Trends Immunol. 2003, 24, 327–334. [Google Scholar] [CrossRef]
  60. Muller, W.A. Mechanisms of leukocyte transendothelial migration. Annu. Rev. Pathol. 2011, 6, 323–344. [Google Scholar] [CrossRef] [Green Version]
  61. Pati, S.; Gerber, M.H.; Menge, T.D.; Wataha, K.A.; Zhao, Y.; Baumgartner, J.A.; Zhao, J.; Letourneau, P.A.; Huby, M.P.; Baer, L.A.; et al. Bone marrow derived mesenchymal stem cells inhibit inflammation and preserve vascular endothelial integrity in the lungs after hemorrhagic shock. PLoS ONE 2011, 6, e25171. [Google Scholar] [CrossRef] [Green Version]
  62. Förstermann, U.; Münzel, T. Endothelial nitric oxide synthase in vascular disease: From marvel to menace. Circulation 2006, 113, 1708–1714. [Google Scholar] [CrossRef] [PubMed] [Green Version]
  63. Förstermann, U.; Sessa, W.C. Nitric oxide synthases: Regulation and function. Eur. Heart J. 2012, 33, 829–837. [Google Scholar] [CrossRef] [Green Version]
  64. Cheng, A.; Genever, P.G. SOX9 determines RUNX2 transactivity by directing intracellular degradationn. J. Bone Miner. Res. 2010, 25, 2680–2689. [Google Scholar] [CrossRef] [PubMed]
  65. Bidarra, S.J.; Barrias, C.C.; Barbosa, M.A.; Soares, R.; Amédée, J.; Granja, P.L. Phenotypic and proliferative modulation of human mesenchymal stem cells via crosstalk with endothelial cells. Stem Cell Res. 2011, 7, 186–197. [Google Scholar] [CrossRef] [Green Version]
  66. Prowse, A.B.; Chong, F.; Gray, P.P.; Munro, T.P. Stem cell integrins: Implications for ex-vivo culture and cellular therapies. Stem Cell Res. 2011, 6, 1–12. [Google Scholar] [CrossRef] [PubMed] [Green Version]
  67. Frith, J.E.; Mills, R.J.; Hudson, J.E.; Cooper-White, J.J. Tailored integrin-extracellular matrix interactions to direct human mesenchymal stem cell differentiation. Stem Cells Dev. 2012, 21, 2442–2456. [Google Scholar] [CrossRef] [PubMed] [Green Version]
  68. Oberlender, S.A.; Tuan, R.S. Expression and functional involvement of N-cadherin in embryonic limb chondrogenesis. Development 1994, 120, 177–187. [Google Scholar] [CrossRef]
  69. Overduin, M.; Harvey, T.S.; Bagby, S.; Tong, K.I.; Yau, P.; Takeichi, M.; Ikura, M. Solution structure of the epithelial cadherin domain responsible for selective cell adhesion. Science 1995, 267, 386–389. [Google Scholar] [CrossRef]
  70. Shapiro, L.; Fannon, A.M.; Kwong, P.D.; Thompson, A.; Lehmann, M.S.; Grübel, G.; Legrand, J.F.; Als-Nielsen, J.; Colman, D.R.; Hendrickson, W.A. Structural basis of cell-cell adhesion by cadherins. Nature 1995, 374, 327–337. [Google Scholar] [CrossRef]
  71. Stains, J.P.; Civitelli, R. Cell-to-cell interactions in bone. Biochem. Biophys. Res. Commun. 2005, 328, 721–727. [Google Scholar] [CrossRef]
  72. Xu, L.; Meng, F.; Ni, M.; Lee, Y.; Li, G. N-cadherin regulates osteogenesis and migration of bone marrow-derived mesenchymal stem cells. Mol. Biol. Rep. 2013, 40, 2533–2539. [Google Scholar] [CrossRef]
  73. Theveneau, E.; Marchant, L.; Kuriyama, S.; Gull, M.; Moepps, B.; Parsons, M.; Mayor, R. Collective chemotaxis requires contact-dependent cell polarity. Dev. Cell 2010, 19, 39–53. [Google Scholar] [CrossRef] [PubMed] [Green Version]
  74. Dubon, M.J.; Yu, J.; Choi, S.; Park, K.S. Transforming growth factor β induces bone marrow mesenchymal stem cell migration via noncanonical signals and N-cadherin. J. Cell. Physiol. 2018, 233, 201–213. [Google Scholar] [CrossRef] [PubMed]
  75. Kawaguchi, J.; Kii, I.; Sugiyama, Y.; Takeshita, S.; Kudo, A. The transition of cadherin expression in osteoblast differentiation from mesenchymal cells: Consistent expression of cadherin-11 in osteoblast lineage. J. Bone Miner. Res. 2001, 16, 260–269. [Google Scholar] [CrossRef] [PubMed]
  76. Hsu, S.H.; Huang, G.S. Substrate-dependent Wnt signaling in MSC differentiation within biomaterial-derived 3D spheroids. Biomaterials 2013, 34, 4725–4738. [Google Scholar] [CrossRef] [PubMed]
  77. Nassiri, S.M.; Rahbarghazi, R. Interactions of mesenchymal stem cells with endothelial cells. Stem Cells Dev. 2014, 23, 319–332. [Google Scholar] [CrossRef]
  78. Honda, E.; Yoshida, K.; Munakata, H. Transforming growth factor-beta upregulates the expression of integrin and related proteins in MRC-5 human myofibroblasts. Tohoku J. Exp. Med. 2010, 220, 319–327. [Google Scholar] [CrossRef] [Green Version]
  79. Luu, N.T.; McGettrick, H.M.; Buckley, C.D.; Newsome, P.N.; Rainger, G.E.; Frampton, J.; Nash, G.B. Crosstalk between mesenchymal stem cells and endothelial cells leads to downregulation of cytokine-induced leukocyte recruitment. Stem Cells 2013, 31, 2690–2702. [Google Scholar] [CrossRef]
  80. Bartaula-Brevik, S.; Bolstad, A.I.; Mustafa, K.; Pedersen, T.O. Secretome of Mesenchymal Stem Cells Grown in Hypoxia Accelerates Wound Healing and Vessel Formation In Vitro. Int. J. Stem Cell Res. Ther. 2017, 3, 045. [Google Scholar] [CrossRef]
  81. Hao, Q.; Wang, L.; Tang, H. Vascular endothelial growth factor induces protein kinase D-dependent production of proinflammatory cytokines in endothelial cells. Am. J. Physiol. Cell Physiol. 2009, 296, 821–827. [Google Scholar] [CrossRef]
  82. Mai, J.; Virtue, A.; Shen, J.; Wang, H.; Yang, X.F. An evolving new paradigm: Endothelial cells-conditional innate immune cells. J. Hematol. Oncol. 2013, 6, 61. [Google Scholar] [CrossRef] [Green Version]
  83. Di Paolo, N.C.; Shayakhmetov, D.M. Interleukin 1α and the inflammatory process. Nat. Immunol. 2016, 17, 906–913. [Google Scholar] [CrossRef] [PubMed] [Green Version]
  84. Zhao, D.; Liu, L.; Chen, Q.; Wang, F.; Li, Q.; Zeng, Q.; Huang, J.; Luo, M.; Li, W.; Zheng, Y.; et al. Hypoxia with Wharton’s jelly mesenchymal stem cell co-culture maintains stemness of umbilical cord blood-derived CD34+ cells. Stem Cell Res. Ther. 2018, 9, 158. [Google Scholar] [CrossRef] [PubMed] [Green Version]
  85. Borggrefe, T.; Lauth, M.; Zwijsen, A.; Huylebroeck, D.; Oswald, F.; Giaimo, B.D. The Notch intracellular domain integrates signals from Wnt, Hedgehog, TGFβ/BMP and hypoxia pathways. Biochim. Biophys. Acta 2016, 1863, 303–313. [Google Scholar] [CrossRef] [PubMed]
  86. Saller, M.M.; Prall, W.C.; Docheva, D.; Schönitzer, V.; Popov, T.; Anz, D.; Clausen-Schaumann, H.; Mutschler, W.; Volkmer, E.; Schieker, M.; et al. Increased stemness and migration of human mesenchymal stem cells in hypoxia is associated with altered integrin expression. Biochem. Biophys. Res. Commun. 2012, 423, 379–385. [Google Scholar] [CrossRef]
  87. Choi, J.H.; Lim, S.M.; Yoo, Y.I.; Jung, J.; Park, J.W.; Kim, G.J. Microenvironmental interaction between hypoxia and endothelial cells controls the migration ability of placenta-derived mesenchymal stem cells via α4 integrin and Rho signaling. J. Cell. Biochem. 2016, 117, 1145–1157. [Google Scholar] [CrossRef]
  88. Danese, S.; Dejana, E.; Fiocchi, C. Immune regulation by microvascular endothelial cells: Directing innate and adaptive immunity, coagulation, and inflammation. J. Immunol. 2007, 178, 6017–6022. [Google Scholar] [CrossRef]
  89. Li, J.; Li, D.; Liu, X.; Tang, S.; Wei, F. Human umbilical cord mesenchymal stem cells reduce systemic inflammation and attenuate LPS-induced acute lung injury in rats. J. Inflamm. 2012, 9, 33. [Google Scholar] [CrossRef] [PubMed] [Green Version]
  90. Voswinkel, J.; Francois, S.; Simon, J.M.; Benderitter, M.; Gorin, N.C.; Mohty, M.; Fouillard, L.; Chapel, A. Use of mesenchymal stem cells (MSC) in chronic inflammatory fistulizing and fibrotic diseases: A comprehensive review. Clin. Rev. Allergy Immunol. 2013, 45, 180–192. [Google Scholar] [CrossRef] [PubMed]
  91. Khedoe, P.; De Kleijn, S.; Van Oeveren-Rietdijk, A.M.; Plomp, J.J.; De Boer, H.C.; Van Pel, M.; Rensen, P.C.N.; Berbée, J.F.P.; Hiemstra, P.S. Acute and chronic effects of treatment with mesenchymal stromal cells on LPS-induced pulmonary inflammation, emphysema and atherosclerosis development. PLoS ONE 2017, 12, e0183741. [Google Scholar] [CrossRef] [PubMed] [Green Version]
  92. Goolaerts, A.; Pellan-Randrianarison, N.; Larghero, J.; Vanneaux, V.; Uzunhan, Y.; Gille, T.; Dard, N.; Planès, C.; Matthay, M.A.; Clerici, C. Conditioned media from mesenchymal stromal cells restore sodium transport and preserve epithelial permeability in an in vitro model of acute alveolar injury. Am. J. Physiol. Lung. Cell. Mol. Physiol. 2014, 306, L975–L985. [Google Scholar] [CrossRef] [PubMed] [Green Version]
  93. Munir, H.; Luu, N.T.; Clarke, L.S.; Nash, G.B.; McGettrick, H.M. Comparative Ability of Mesenchymal Stromal Cells from Different Tissues to Limit Neutrophil Recruitment to Inflamed Endothelium. PLoS ONE 2016, 11, e0155161. [Google Scholar] [CrossRef] [PubMed]
  94. Ginis, I.; Mentzer, S.J.; Li, X.; Faller, D.V. Characterization of a hypoxia-responsive adhesion molecule for leukocytes on human endothelial cells. J. Immunol. 1995, 155, 802–810. [Google Scholar]
  95. Zünd, G.; Uezono, S.; Stahl, G.L.; Dzus, A.L.; McGowan, F.X.; Hickey, P.R.; Colgan, S.P. Hypoxia enhances induction of endothelial ICAM-1: Role for metabolic acidosis and proteasomes. Am. J. Physiol. 1997, 273, C1571–C1580. [Google Scholar] [CrossRef]
Figure 1. MSCs and ECs were grown as monocultures till the confluence of 80–90%. For co-culture experiments, MSCs were harvested by trypsinization and added to the EC monolayer in a 1:1 ratio. EC or MSC monocultures and their co-cultures were exposed to hypoxic conditions (5% or 0.1% O2). After 24 h, the samples of conditioned medium (CM) were collected for ELISA, cells were separated using an immunomagnetic protocol and analyzed with flow cytometry, RT-PCR, and MSCs were seeded in limiting density for CFU-f evaluation. To examine the effects of MSCs on inflammatory activation of ECs, ECs were treated with TNF-α for 24 h, and then a suspension of MSCs was added to the EC monolayer. After 24 h of hypoxic exposures at 5% or 0.1% O2, conditioned medium was collected; cells were immunoseparated and then processed as above. Besides, a part of TNF-α primed ECs in monoculture and co-culture with MSCs was used in the PBMC adhesion assay.
Ijtm 01 00009 g001
Figure 2. Immunophenotype of MSCs in monoculture and co-culture with ECs. (a) Representative flow cytometry histograms. MSCs were positive for CD90, CD73, and CD105 but negative for CD45. (b) The proportion of MSCs, expressing CD90, CD73, CD105, and CD45 in mono- and co-cultures. The data are presented as the mean ± SD (n = 3).
Ijtm 01 00009 g002
Figure 3. Stromal phenotype and progenitor state of MSCs upon interaction with ECs. (a) EC clusters (dotted lines) are surrounded by MSCs (white arrows). ECs were stained with PKH27 (green fluorescence). Combined phase contrast/fluorescent representative images, scale bar—100 um. (b) Colony-forming units of fibroblasts (CFU-f) among MSCs in monocultures and co-cultures with ECs. The data are presented as an average number of colonies per 1000 seeded cells (mean ± SD, n = 3). (c) Heatmap analysis of the expression levels of “stemness” genes and “commitment” master-genes in MSCs. Genes with higher expression are depicted in red, genes with lower expression are depicted in green. The data are presented as fold changes of transcription levels of co-cultured MSCs vs. monocultured MSCs, n = 3. p-values indicate the significance of differences between MSCs in monocultures vs. MSCs from co-cultures with ECs. MSCs in monocultures were exposed to the same O2 levels as co-cultures (at 5% or 0.1%, accordingly).
Ijtm 01 00009 g003
Figure 4. Adhesion molecules’ profiles of MSCs upon interaction with ECs. (a) The intensity of adhesion molecules’ expression is presented as MFI. Flow cytometry, n = 4. (b) The ratio of positively stained cells. Flow cytometry, n = 3. p-values indicate the significance of differences between MSCs in monocultures vs. MSCs from co-cultures with ECs. MSCs in monocultures were exposed to the same O2 levels as co-cultures (at 5% or 0.1%, accordingly).
Ijtm 01 00009 g004
Figure 5. IL-6 and IL-8 transcription/synthesis in ECs, MSCs, and EC/MSC co-cultures. (a) Production of IL-6 and IL-8. Levels of cytokines measured by ELISA are shown, n = 4. (b) Differential expression of IL6 and IL8. The data for ECs or MSCs after co-cultures are normalized to the data for ECs or MSCs in monocultures and presented as fold changes, n = 4. p-values indicate the significance of differences between MSCs in monocultures vs. MSCs from co-cultures with ECs. MSCs in monocultures were exposed to the same O2 levels as co-cultures (at 5% or 0.1%, accordingly).
Ijtm 01 00009 g005
Figure 6. The paracrine effects of ECs on MSC migratory potential. (a) Non-targeted migration of MSCs in EC conditioned medium. “Scratch” assay. Representative images of MSCs directly after scratching (0 h) and after 24 h. Phase-contrast microscopy, magn. 100×. (b) Transwell assay. Representative images of MSCs on the bottom side of the semipermeable membrane after 24 h of targeted migration. Epifluorescent microscopy, magn. 100×. MSCs visualized with PI staining of nuclei, Control—MSCs cultured in α-MEM. CM—MSCs cultured in conditioned medium of ECs. (c) “Scratch” area occupied with MSCs 24 h after scratching. Column chart (n = 3). (d) An increase in the number of MSCs transmigrated through the insert semipermeable membrane. Column chart. The data are presented as fold changes vs. transmigrated MSCs in α-MEM (Control), n = 3. p-values indicate the significance of differences between MSCs transmigrated in α-MEM or EC conditioned medium.
Ijtm 01 00009 g006
Figure 7. Expression of adhesion molecules on quiescent and inflammatory activated ECs in monoculture and co-cultures with MSCs. (a) Representative flow cytometry histograms of the endothelial PECAM (CD31) and VE-cadherin (CD144) staining. (b) The intensity of adhesion molecules’ expression on ECs under 5% O2 presented as MFI. Flow cytometry, n = 3. (c) The intensity of adhesion molecules’ expression on ECs under 0.1% O2 presented as MFI. Flow cytometry, n = 3. p-values indicate the significance of differences between ECs in monocultures vs. ECs from co-cultures with MSCs. ECs in monocultures were exposed to the same O2 levels as co-cultures (at 5% or 0.1%, accordingly).
Ijtm 01 00009 g007
Figure 8. PBMC adhesion assay. (a) Adhered PBMCs on inflammatory-activated ECs in monoculture and co-culture with MSCs. Representative images. Giemsa staining. Bright-field microscopy, scale bar 100 um. PBMCs are marked by circles. (b) The efficacy of PBMCs’ adhesion to inflammatory-activated ECs in monoculture and co-culture with MSCs. Column chart. The data are presented as the number of adhered PBMCs per mm2, n = 3. Dotted line—the number of PBMCs adhered to quiescent ECs. p-values indicate the significance of differences between the number of PBMCs adhered to TNF-α–activated ECs in monocultures or co-cultures with MSCs. ECs in monocultures were exposed to the same O2 levels as co-cultures (at 5% or 0.1%, accordingly).
Ijtm 01 00009 g008
Figure 9. The levels of NO and NOS3 transcription in quiescent and inflammatory activated ECs in monoculture and co-culture with MSCs. (a) Intracellular levels of NO. Flow cytometry. The data are presented as MFI. Column chart, n = 3. (b) Differential expression of NO synthase gene. The data are presented as fold changes vs. monocultured ECs. Column chart, n = 3. p values indicate the significance of differences between ECs or TNF-α–activated ECs in monocultures and in co-cultures with MSCs. ECs or TNF-α–activated ECs in monocultures were exposed to the same O2 levels as co-cultures (at 5% or 0.1%, accordingly).
Ijtm 01 00009 g009
Publisher’s Note: MDPI stays neutral with regard to jurisdictional claims in published maps and institutional affiliations.

