Article

Microplastic Accumulation in Urban Stream Sediments: Vertical Distribution and Transport Dynamics

by
Meghana Parameswarappa Jayalakshmamma
1,
Ashish D. Borgaonkar
2,*,
Dibyendu Sarkar
3,
Christopher Obropta
4 and
Michel Boufadel
1,*
1
Department of Civil and Environmental Engineering, New Jersey Institute of Technology, 323 MLK Blvd., Newark, NJ 07102, USA
2
School of Applied Engineering and Technology, New Jersey Institute of Technology, 323 MLK Blvd., Newark, NJ 07102, USA
3
Department of Civil, Environmental and Ocean Engineering, Stevens Institute of Technology, 1 Castle Point Terrace, Hoboken, NJ 07030, USA
4
Water Resources Research Institute Environmental Engineering, Rutgers, New Brunswick, NJ 08854, USA
*
Authors to whom correspondence should be addressed.
Microplastics 2025, 4(3), 65; https://doi.org/10.3390/microplastics4030065
Submission received: 11 July 2025 / Revised: 28 August 2025 / Accepted: 12 September 2025 / Published: 18 September 2025

Abstract

Microplastics (MPs) have emerged as persistent pollutants in urban freshwater ecosystems, yet their vertical distribution in stream sediments remains underexplored. This study investigated MPs at 5 cm and 10 cm depths across 17 sites in Branch Brook Park, Newark, NJ, during three sampling periods in 2022 and 2023. MPs were extracted through density separation and quantified using FTIR and Raman spectroscopy. The MP concentrations in stream sediments ranged from 560 to 3930 p/kg of dry sediment, with significantly higher abundances observed at 5 cm depth. The surface sediments consistently accumulated more MPs, especially during dry seasons, highlighting limited vertical infiltration under low-saturation conditions. The longitudinal spatial distribution did not show a notable trend along the urban stream course. Furthermore, there was a significant difference in MP accumulation between the three sampling periods, indicating a seasonal and temporal variation. The regression analyses showed weak correlations between MP concentrations and environmental parameters such as pH (R2 = 0.02) and temperature (R2 = 0.05), suggesting that physicochemical conditions alone exert limited control on MP accumulation compared to localized hydrological and land-use factors. These findings provide new insights and highlight the need for depth-integrated monitoring strategies and targeted pollution mitigation at stormwater entry points.

1. Introduction

Microplastics (MPs), commonly defined as plastic particles less than 5 mm in size, have emerged as pervasive contaminants in marine [1], freshwater [2], and terrestrial environments [3], due to their persistence, mobility, and potential to cause ecological harm and human health [4,5,6].
Among these, freshwater systems are increasingly recognized as hotspots for MP pollution [7], due to their proximity to urban and industrial areas, and their role in integrating multiple pollution sources, such as combined sewer overflows [8], urban runoff [9], wastewater treatment plant (WWTP) effluent [10], and atmospheric deposition [11]. Additionally, MPs are also being investigated for promoting Harmful Algal Blooms in freshwater systems by acting as a vector for nutrients and pollutants [12,13].
The reported MP concentration in lakes varies significantly from 0.00014 particles/L (p/L) in Lake Tollense, Germany [14] to 34 p/L in Lake Poyang, China [15]. This variation is often attributed to geographical locations [16], population density [17], pollutant point source, and land use type [18]. In addition, streams and rivers act as critical transfer zones that funnel land-based MPs into larger riverine and ultimately marine environments [19,20]. Although the direct comparison of MP abundance between the connected lakes and streams is limited in the existing literature, MPs in streams have been well reported. McCormick et al. [21] found that MP concentrations and flux varied significantly among streams, highlighting the spatial and temporal heterogeneity of MPs in urban streams. For instance, Montecinos et al. [22] found up to 72,000 p/L in the Langueyú stream basin at the WWTP discharge point, while Dikareva and Simon [23] found 0.017–0.3 p/L in multiple streams of the Auckland region, New Zealand.
Furthermore, sediments within these systems act as critical reservoirs for MPs, functioning simultaneously as sinks that accumulate particles from water columns and sources that reintroduce contaminants back into aquatic environments through resuspension and remobilization processes [2,19]. The recent findings confirm that MP abundance in sediment is much higher than that in water [16]. For instance, Gonzalez-Saldias et al. [24] found 56,900 ± 39,900 p/kg in river sediments compared to 3.5 ± 3.3 p/L in water. Similarly, in streams, Dikareva and Simon [23] found 9–80 particles/kg (p/kg) in sediments compared to 0.017–0.3 p/L in the water column, with the strongest correlation between the smallest size fraction particles (63–500 μm). The deposition of MPs from water to sediments is influenced by multiple factors, including particle density, particle composition, and hydrodynamic energy of the surrounding environment [25,26].
Additionally, the depth of sediment layers plays a critical role in MP accumulation and distribution, where MP abundance is generally higher in surface sediments compared to deeper strata [23,27,28]. While shallow sediment layers (0–5 cm) show immediate anthropogenic influences from surface runoff and urbanization, deeper layers (5–10 cm) may reveal historical pollution trends and the gradual sedimentation of MPs over time [29,30]. Hence, understanding the vertical stratification of MPs within stream sediments is crucial. However, despite the advanced studies, the processes governing the vertical transport of MPs and their long-term accumulation are poorly understood [31]. For instance, in lake sediments, Baldwin et al. [32] found ~2000 p/kg MPs in shallow cores (up to 33 cm depth) with no consistent trend with depth or time. On the contrary, Huang, Fan, Liu and Lu [29] found 730–1300 p/kg in 12 to 35 cm depth, which was considerably higher than in 0 to 12 cm depth. Similarly, in the riverbed, Pittroff et al. [33] found varied MP concentrations of ~22.6 p/kg in 0–30 cm, ~6.5 p/kg in 30–60 cm, and ~36 p/kg in 60–100 cm depths. Moreover, the depth-specific studies in flowing waters such as streams are extremely limited.
Furthermore, limited attention has been given to investigating how environmental factors such as temperature and pH influence the vertical distribution and concentration patterns of MPs, despite these parameters potentially affecting sediment chemistry and MP behavior [34]. For instance, Feng et al. [35] reported an inverse relationship between MP concentration and pH, with MPs being more prevalent in acidic to neutral environments. In contrast, Mutshekwa et al. [36] noticed increased MP counts with higher pH levels, although the correlation was seasonally dependent and confounded by other physicochemical parameters. These inconsistencies reflect the complex role pH may play in modifying sediment properties, such as electrostatic interactions and organic matter associations, which in turn affect the retention and fate of MPs. Furthermore, the presence of biofilms and organic coatings on MPs in natural environments may buffer or obscure pH-related effects [37]. In addition, Fox et al. [38] noticed that colder conditions affect the depth distribution and abundance of MPs, imposing further investigation into seasonal effects and thermal stratification that could influence MP behavior in aquatic systems. Similar patterns were observed in river systems in South Africa, where lower temperature zones had elevated MP concentrations, potentially due to lower flow-induced remobilization [36]. Conversely, some tropical systems, such as the Brantas River in Indonesia, showed positive correlations between MP load and temperature, attributed to downstream accumulation of MPs from untreated discharges and increased fragmentation of plastics under warmer conditions [39].
Consequently, the complex interplay between location within the stream (upstream versus downstream), sediment depth, environmental factors, hydrodynamic and anthropogenic influences must be carefully analyzed to understand the behavior and impact of MPs in freshwater systems. To address these research gaps, this study aims to (1) quantify MP concentrations at sediment depths of 5 cm and 10 cm in an urban stream environment; (2) assess spatial variations in MP distribution along the stream course; (3) investigate the potential relationship between MP abundance and environmental parameters, specifically temperature and pH; and (4) investigate the temporal variation in MP accumulation within urban streams.

2. Materials and Methods

2.1. Site Description

The study was conducted in Branch Brook Park, located in Newark, NJ, USA. Spanning over 360 acres, the park is known for its rich biodiversity and serves as an urban oasis in a densely populated area [40]. Newark is the most densely populated city in New Jersey, with a population of 307,220 and a population density of 33,421 per square km [41].
The Branch Brook Park Lake includes multiple freshwater streams and interconnected water bodies (Figure 1) that drain into the Passaic River, a major tributary within the region that has experienced historical contamination and ongoing environmental pressures [42]. The Branch Brook waterbodies receive inputs from urban runoff, particularly via numerous stormwater inlets distributed throughout the landscape. These inlets function as conduits for contaminants from adjacent impervious surfaces such as roads, sidewalks, and parking lots, facilitating the entry and accumulation of pollutants, including MPs, into the park’s aquatic environment.

2.2. Sample Collection

The sediment samples were collected from the streambed during dry weather conditions in March 2022, October 2022, and March 2023. A total of 17 sampling locations were selected along the stream channel (Figure 1). From each location, ~200 g of sediment samples were extracted at two depths, 5 cm and 10 cm, using a stainless-steel soil core. After collection, the samples were immediately transferred to the labelled PYREX™ glass bottles (Fisher Scientific, Swedesboro, NJ, USA) in a cooler to be transferred to the lab for further analysis. Each sample consisted of one composite core (~200 g), homogenized and subsampled in duplicate for analysis. Additionally, environmental parameters, including sediment temperature and pH, were tested during the sample collection using a HANNA HI9811-51 pH/EC/TDS/Temperature meter with HI1285-51 electrode (Hanna instruments, Palisades Park, NJ, USA).

2.3. MPs Extraction and Characterization

The extraction and characterization procedures adopted in this study were consistent with our previously published methods [28]. The collected stream sediment samples were initially oven-dried at 40 °C for 24 h to remove excess moisture and then sieved using a series of ASTM standard stainless sieves with mesh sizes ranging from 250 μm to 5 mm. Particles retained on each sieve were visually investigated using a magnifying glass to identify potential plastic particles. The suspected plastic particles were subsequently analyzed using Fourier Transform Infrared Spectroscopy equipped with a bench diamond Attenuated Total Reflectance accessory (FTIR-ATR; Cary 600 Series, Agilent Technologies, Santa Clara, CA, USA) to confirm their polymeric composition [43]. The spectra were obtained in the wavenumber range of 4000–400 cm−1, using 32 scans at increments of 4 cm−1, and the type of polymers was characterized by comparing the obtained spectra with the built-in polymer library database. The morphological characteristics of confirmed MPs were further examined under a stereomicroscope.
The sediment particles smaller than 250 µm were subsequently sieved through 125 µm and 45 µm mesh sieves to segregate MPs according to particle size. These finer sediment fractions underwent further extraction processes, adapted from the method outlined by Masura et al. [44]. Density separation was conducted using zinc chloride (ZnCl2) solution (density = 1.7 g/cm3) for 24 h, facilitating the separation of MPs and lighter organic particles. The resultant supernatants were extracted and subjected to a wet peroxide oxidation treatment using 30% hydrogen peroxide (H2O2; Thermo Scientific™, CAS: 7722-84-1) and 0.05 M iron (Fe(II)) solution, following [45]. This oxidation reaction was carried out at 40 °C for 30 min to remove any residual organic matter.
Post-oxidation, samples were vacuum-filtered onto Whatman 0.45 μ m aluminum oxide ( Al 2 O 2 ) filter membrane. The resultant filters were analyzed using a DXR2 Raman microscope (Thermo Scientific, Madison, WI, USA) operated via OMNIC software (Thermo Scientific, Madison, WI, USA), at 532 nm wavelength with laser set to a power range of 7–10 mW. The filters were observed using MPlan objectives at magnifications of 10×/0.25, 50×, and 100×, with the instrument configured to a 25 µm pinhole aperture and a grating of 900 lines/mm, covering a spectral range of 36–3590 cm−1. Each particle’s morphology was initially examined visually using the OMNIC software’s camera interface, Alt μ s window. The spectra obtained were then compared against the Hummel Polymer and Additives Spectral Library to validate the type of polymers. The spectrums with >80% correlation with the Hummel Polymer Library were considered as valid. Finally, MP particles with sizes ranging 1 μ m −5 mm were quantified, and concentrations were expressed as the number of MP particles per kilogram of dry sediment ( pkg 1 ).

2.4. Data Analysis

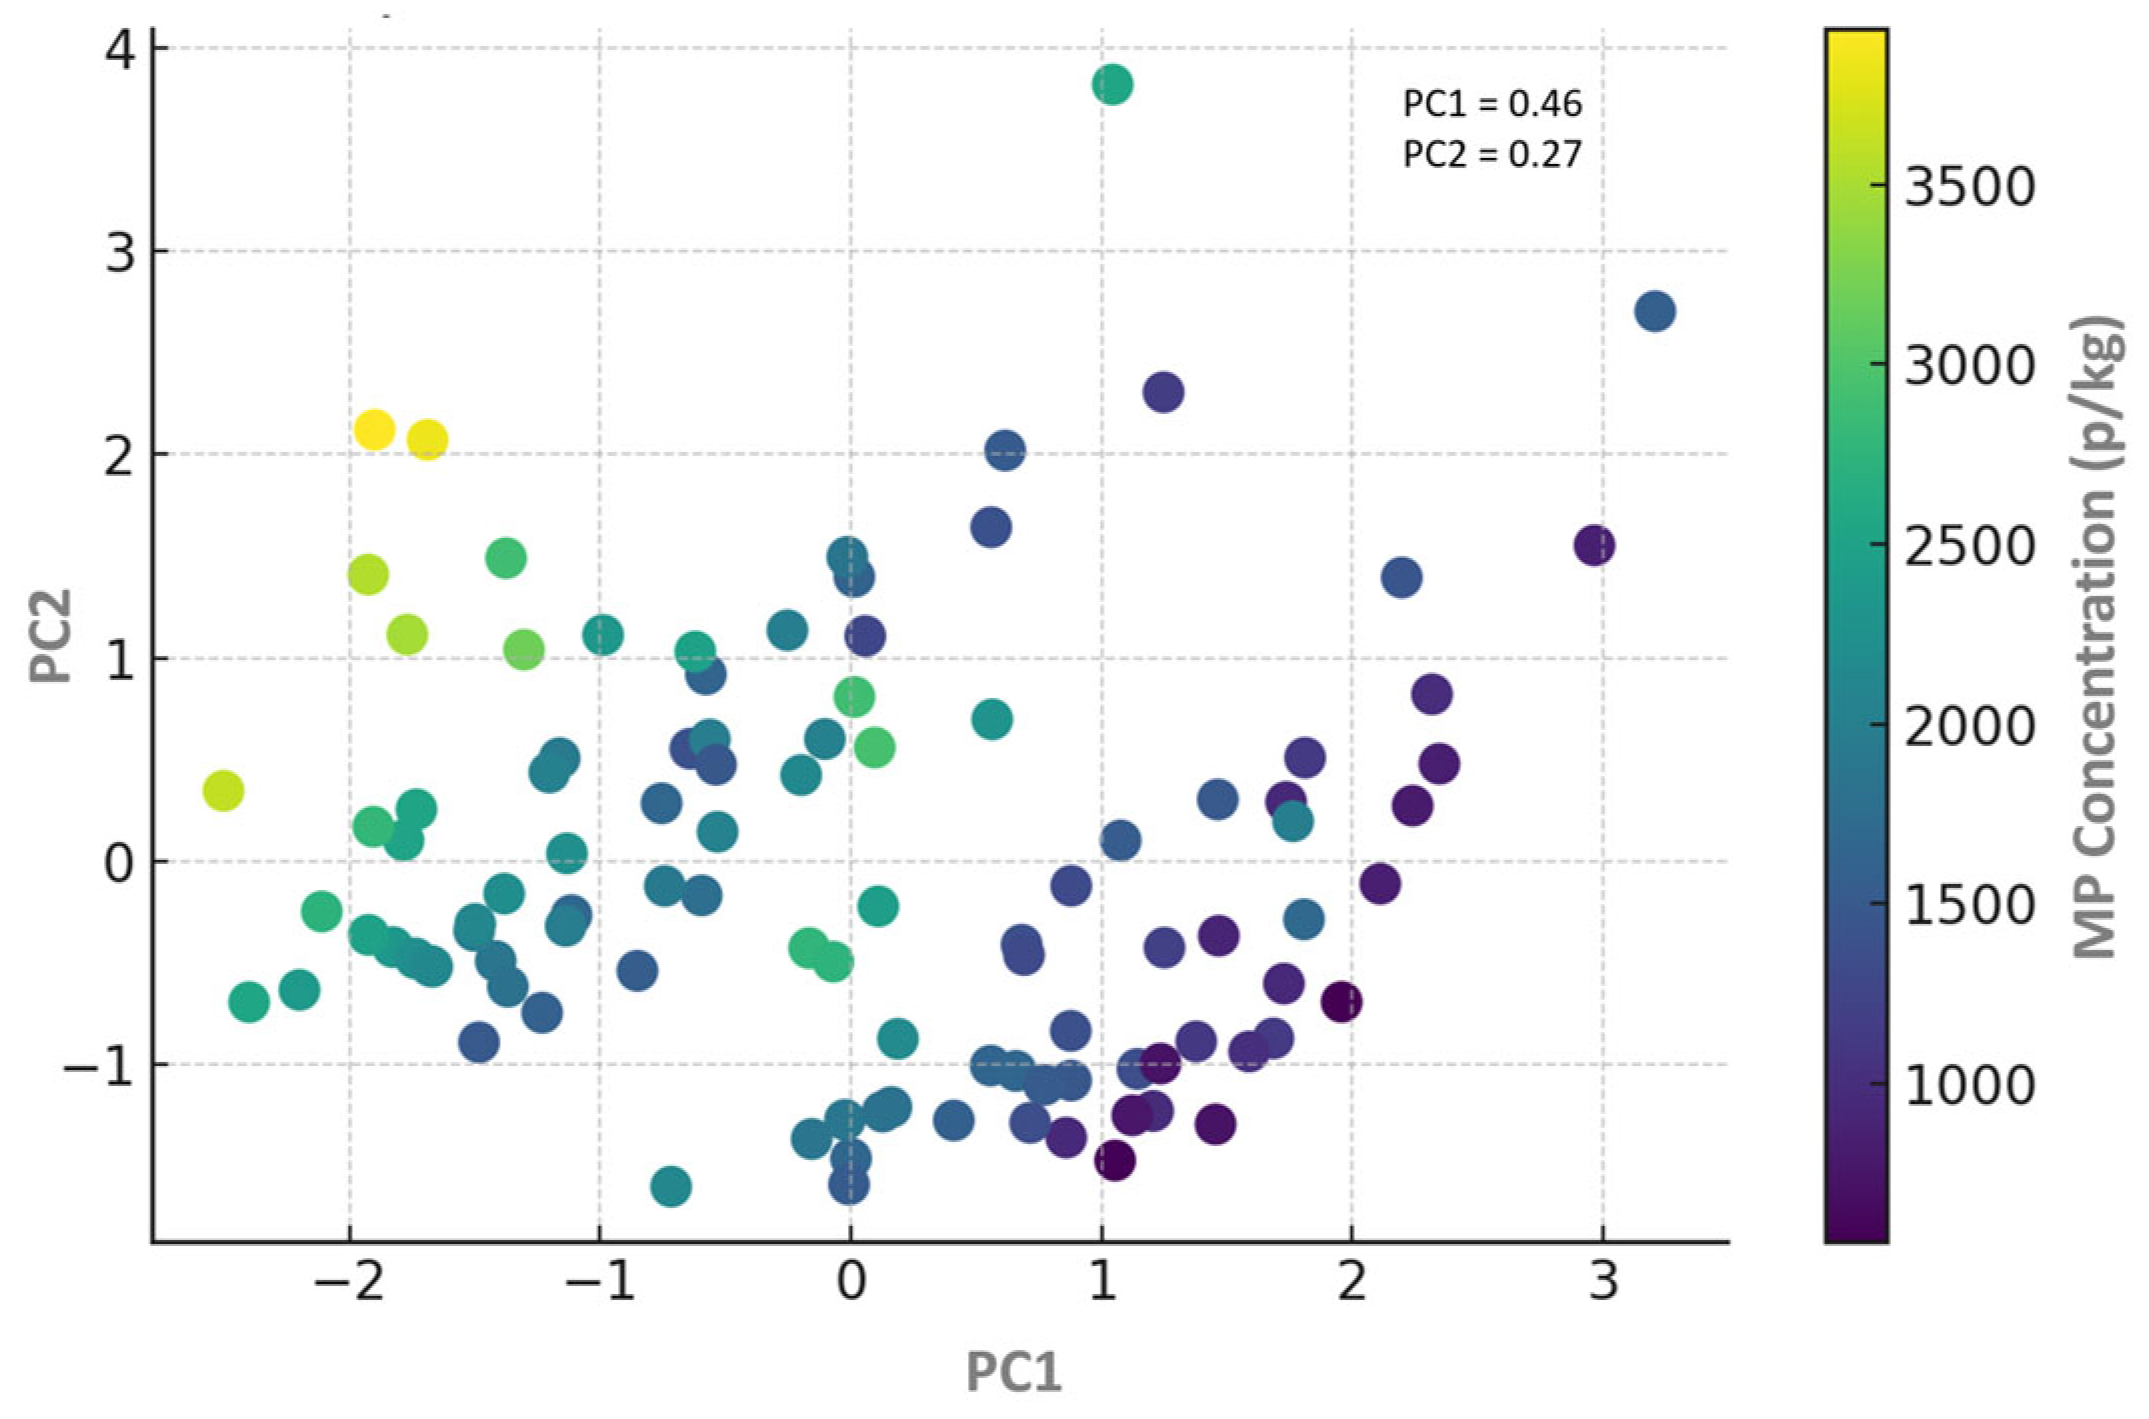
Data analysis was incorporated to assess spatial and temporal variations in MP concentrations across sediment depths and sampling periods. Descriptive statistics, including mean and standard deviation, were calculated to summarize MP concentrations for each depth and season. To evaluate the vertical distribution of MPs within each depth and longitudinal distance from the upstream, a one-way analysis of variance (ANOVA) and subsequent Tukey’s post hoc test were conducted for each sampling event. These tests assessed the statistical significance of observed differences in MP accumulation between surface and subsurface layers. Additionally, correlation and linear regression analyses were performed to explore potential relationships between MP concentration and environmental parameters such as temperature and pH. Coefficients of determination (R2) and regression equations were used to evaluate the strength and direction of these associations. To further examine the combined influence of environmental parameters, a Principal Component Analysis (PCA) was conducted, and the first two principal components explained ~73% of the total variance. PC1 primarily contrasted depth against MP and temperature, while PC2 was dominated by pH. All statistical analyses were performed using Microsoft Excel and Python version 3.12 (SciPy and scikit-learn libraries), with a significance threshold set at p < 0.05.

2.5. Quality Assurance and Quality Control (QA/QC)

The experiments avoided using plastic materials and rinsed all the equipment, glassware, and materials with deionized water before use. During extraction procedures, the samples were covered with aluminum foil, and the filter substrate was covered with glass Petri dish covers. During the MP extraction process, two recovery blank tests were performed. In this procedure, 200 g of sandy loam soil obtained from the Cedar Hill Landscaping [46,47] was artificially spiked with a known quantity and various sizes of MPs to assess the efficiency of the method adopted. The recovery efficiency observed was ~93%, indicating that the method effectively extracted the spiked MPs from the soil sample. To minimize secondary contamination from airborne particles, lab wear, and potential degradation of plastic equipment during the analysis, 100% cotton lab coats, nitrile gloves, and intermittent surface cleaning were implemented throughout the procedures.

3. Results & Discussion

3.1. MPs Concentration in Stream Sediments

The concentration of MPs in stream sediments ranged from 560 to 3930 p/kg, varying across the sampled locations and sampling periods. The highest concentration (3930 p/kg) was observed at location ‘S6’ at 5 cm depth in March 2023, while the lowest concentration (560 p/kg) was found at ‘S10’ at 10 cm depth in March 2022. The overall mean concentration of MPs in stream sediments was 1647 ± 506 p/kg in March 2022, 1950 ± 613 p/kg in October 2022 and 1891 ± 943 p/kg in March 2023. In terms of polymer composition, PET and PE were the most abundant types, followed by PP and MC. Over 90% of the MPs were fragments, and ~10% were fibers. Additionally, larger MPs (>500 μm) were slightly more common at 5 cm, while smaller particles (<125 μm) were present at both depths without significant variation. Figure 2 shows some of the sampled MPs and their spectroscopy spectra confirming the polymer types.
The MP concentrations found in this study are comparable to the highest concentrations reported in Mugnone Creek, Italy (1110–1540 p/kg) [48]. However, the concentrations are significantly elevated compared to many flowing waters worldwide, for instance, 9–80 p/kg in small Auckland streams, New Zealand [23], 64 p/kg in large European rivers [2], 760 p/kg in Lake Ontario tributaries in Canada [49], 84–710 p/kg in the Thames River, UK [20,50], 228–563 p/kg in Rhine–Main region, Germany [51] and 312 p/kg in the Beijiang River, China [52]. Even in urban contexts, these prior findings remain an order of magnitude lower than concentrations observed in Branch Brook Park, Newark, where the most contaminated site (S6, March 2023) reached nearly 4000 p/kg. These elevated levels likely reflect cumulative inputs from nearby impervious surfaces, stormwater inlets, vehicular emissions (e.g., tire and road wear), high population density, and characteristics of northeastern U.S. urban watersheds. However, this substantial variation may partly stem from the absence of standardized methods for sampling, extraction, and analysis, which could lead to false positives or negatives [53,54]. For instance, Dikareva and Simon [23] relied on sieving and visual identification under a stereomicroscope, which may have limited the detection of smaller or less distinguishable particles. Additionally, research indicates that MPs tend to be more concentrated in smaller urban streams due to the direct input of contaminants from nearby densely populated areas [55,56]. In contrast, lower concentrations observed in larger rivers are likely attributed to dilution across larger water volumes and enhanced settling of particles through sedimentation processes [57].
Surprisingly, the concentrations from this study are more similar to the large freshwater systems, such as 1070 p/kg in Lake Simcoe, Canada [58], 1102 p/kg in Lake Victoria [59], and 1079.3 p/kg in Lake Ox Bow [60] in Africa. This indicates that smaller urban streams, particularly those embedded within densely populated or impervious landscapes, may act as persistent sinks for MPs, retaining particle loads at levels akin to large, depositional lake environments.

3.2. Spatial Variation in MPs in Stream Sediments

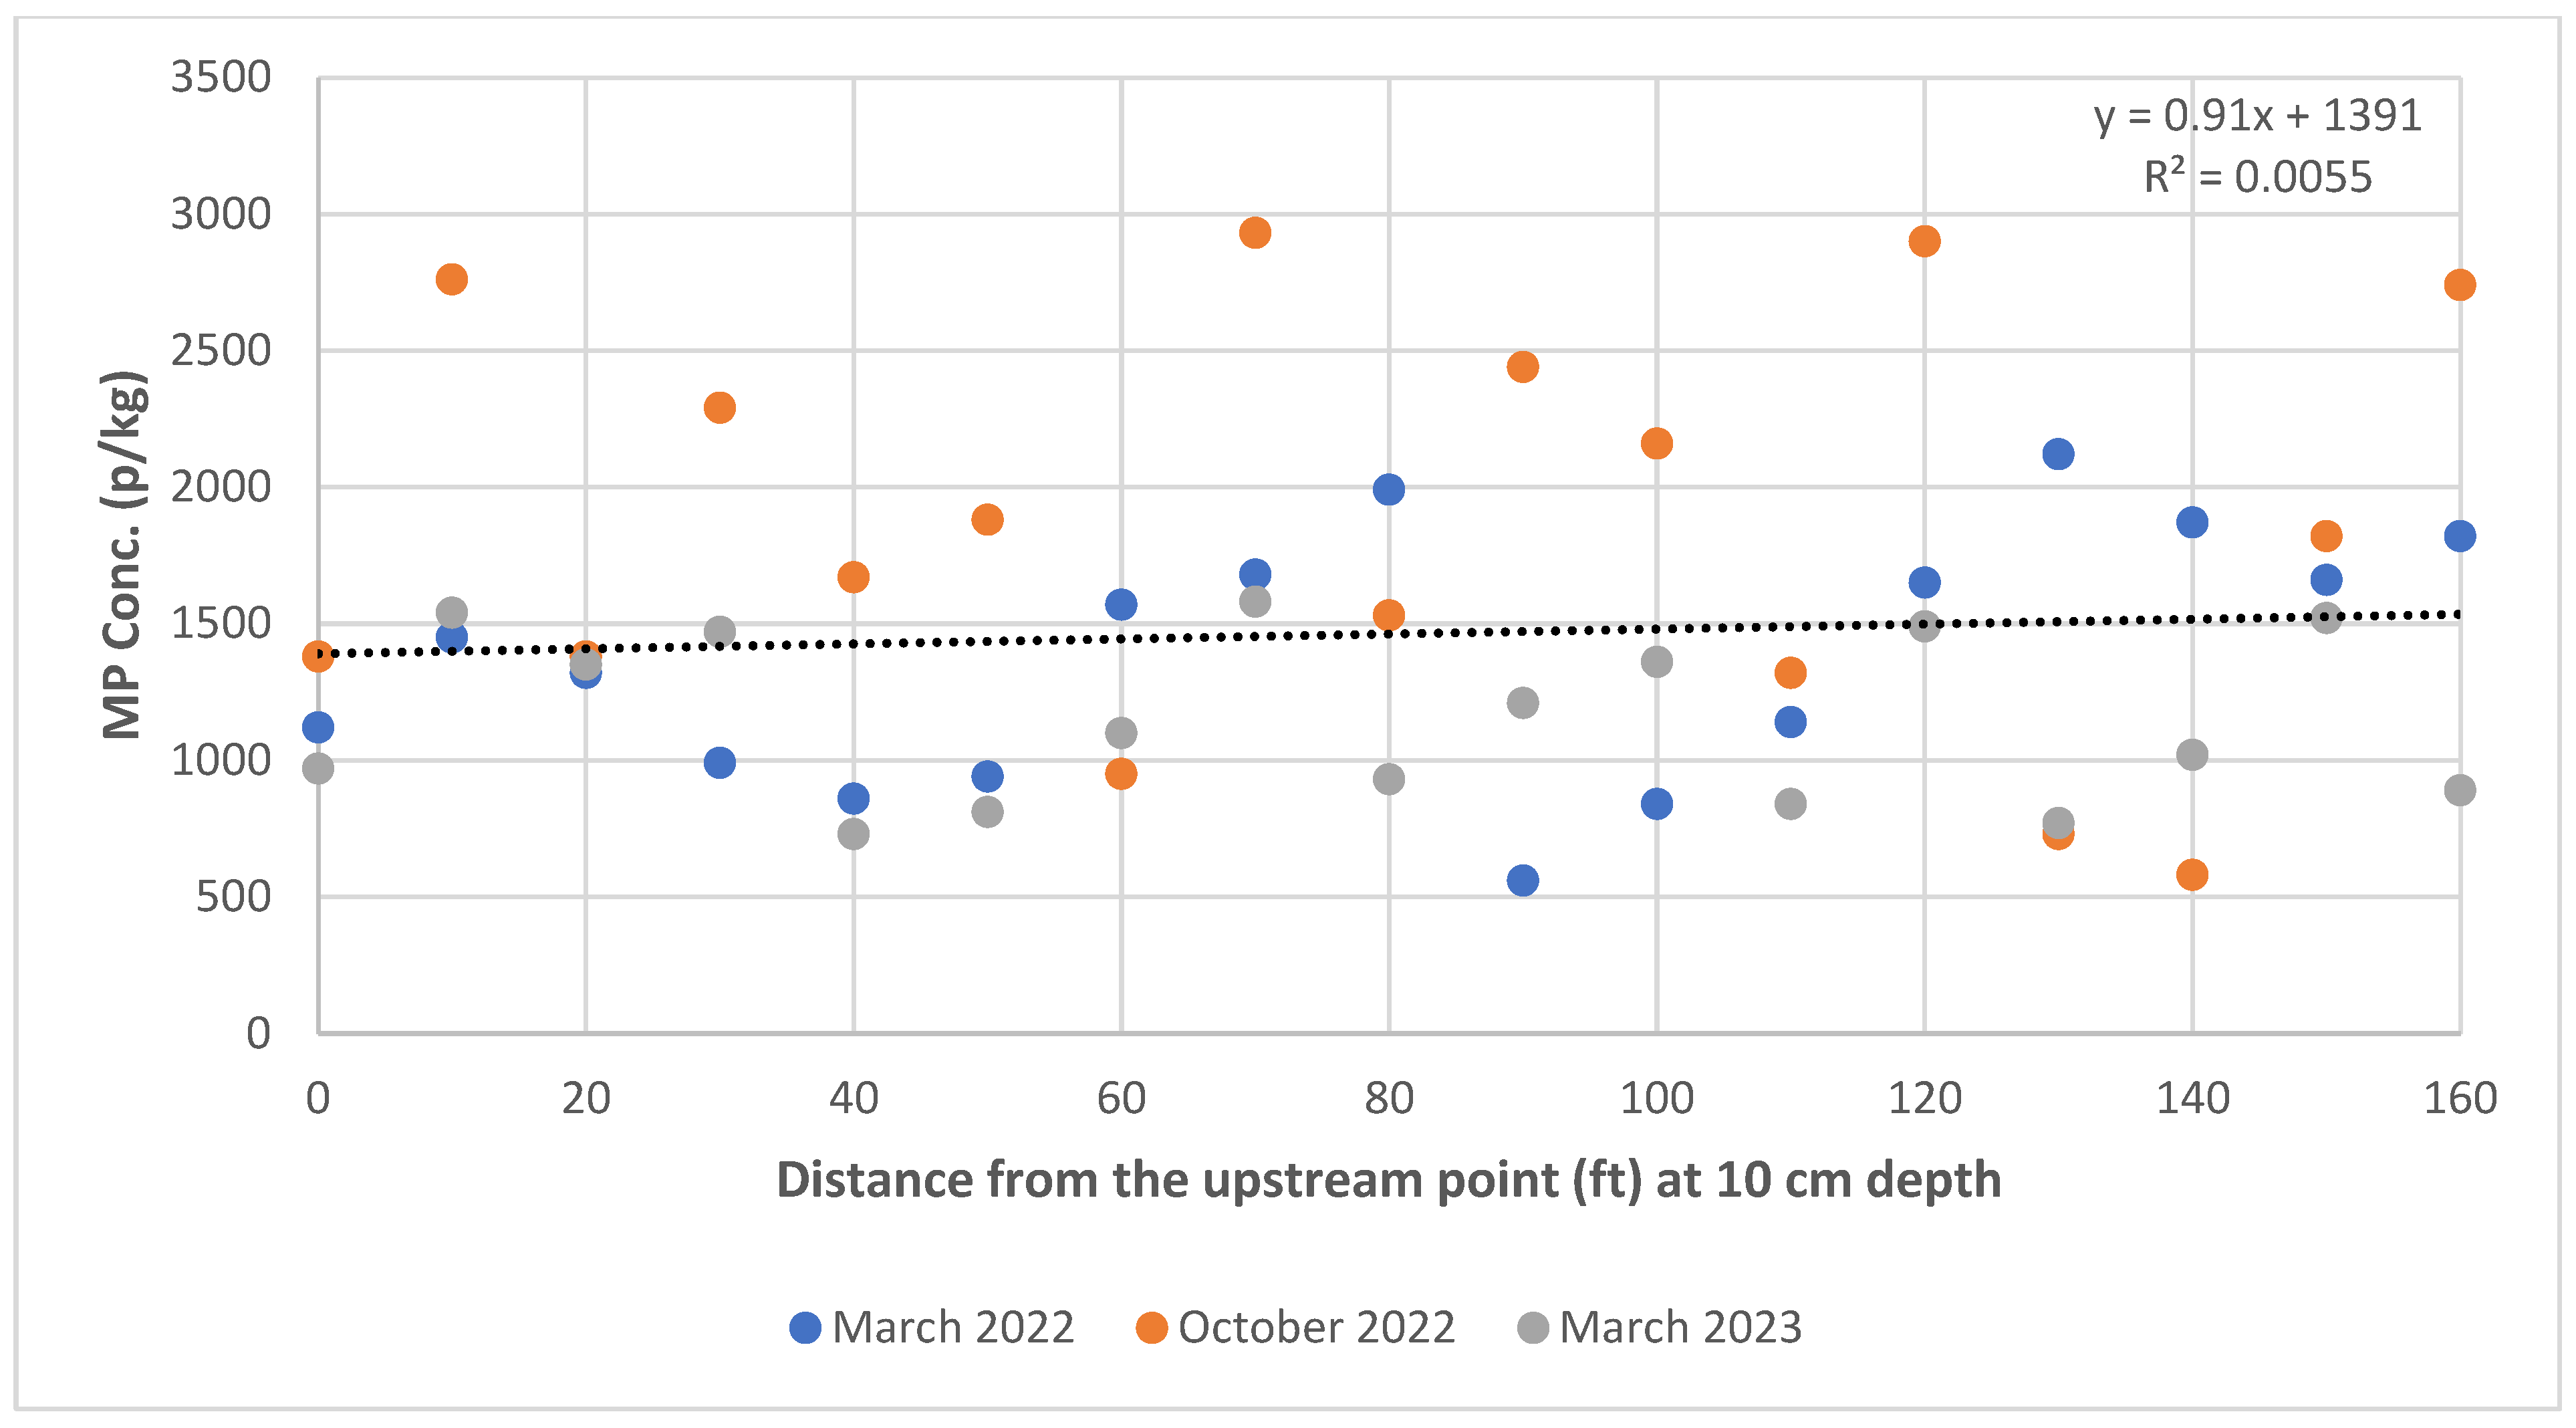
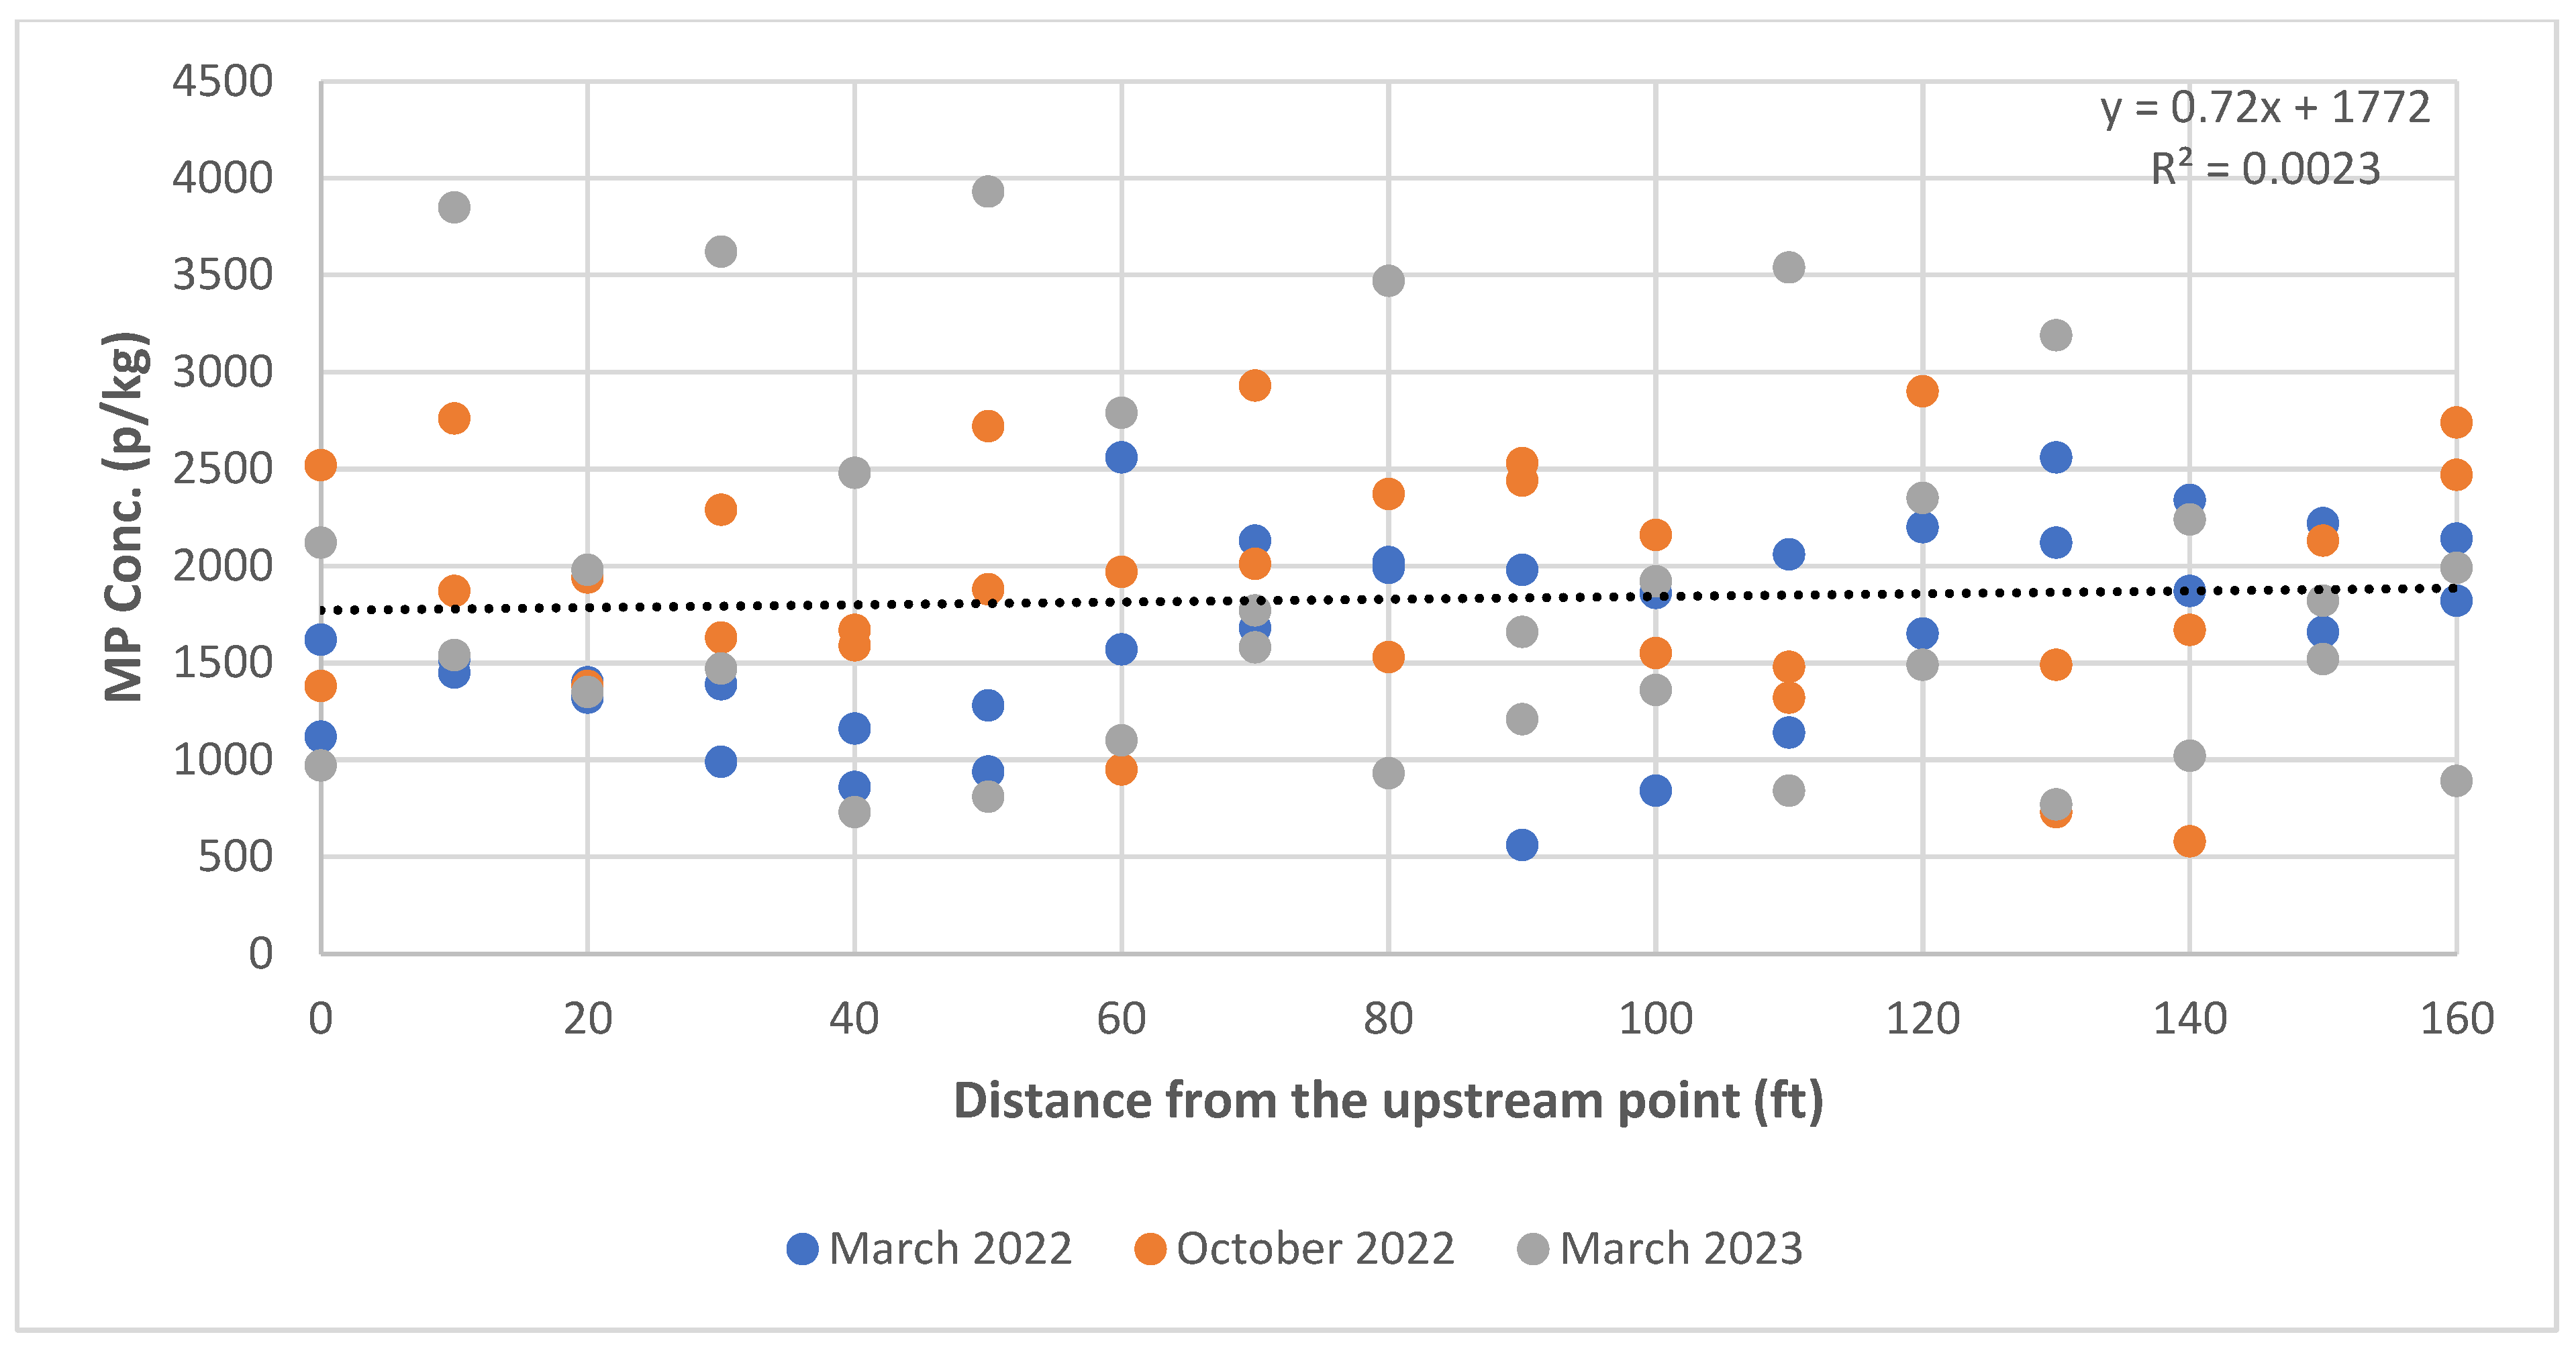
The MP concentration at each sampling location within the stream is plotted as a function of distance from the upstream point at 5 cm depth (Figure 3), 10 cm depth (Figure 4), and combined measurements (Figure 5). The small slope and the small R2 indicate that there was no trend of increase or decrease in the concentration along the stream, which is unlike our previous investigation in Green Infrastructures in Newark, NJ [28] where the concentration of MPs decreased exponentially from the stormwater inlet, this is attributed to the multiple stormwater drainage connections to the Branch Brook streams, where MPs can enter the streams from multiple locations, most likely as overland flow rather than at the upstream part of the stream system.
In terms of vertical distribution, results showed a consistent surface bias, with average concentrations recorded at 5 cm depth significantly higher than those at 10 cm depth. One-way ANOVA statistical analysis confirmed a significant difference between the two depths, with an overall mean concentration of 2196.08 p/kg at 5 cm compared to 1463.14 p/kg at 10 cm (p < 0.0001). This vertical gradient indicates that surface-proximal zones in sediment profiles may serve as primary sinks for MPs, likely influenced by lower mobility and physical filtration near the surface. The observations align with existing literature emphasizing that vertical distributions of MPs can significantly vary based on sediment depth and environmental conditions. A similar trend was observed by Bao et al. [61], demonstrating that the concentration of MPs significantly decreases with depth, with distinct layers of higher concentrations found closer to the sediment surface. Klein, Worch and Knepper [51] also observed a similar trend and emphasized that the density and buoyancy of MPs influence their distribution, resulting in surface layers acting as significant reservoirs for MP pollution compared to deeper sediment layers. Similarly, Harrison et al. [62] reported higher MP concentration at the coastal shorelines, while deeper sediment layers presented diminished MP counts, attributing the variation to anthropogenic activities at the shore. A few other studies also found that MP concentrations decrease with depth, attributing this pattern to the dynamics of sediment transport and accretion [28,63].
In addition, the existing literature shows that high concentrations of MPs are prevalent in areas of increased anthropogenic activity, such as near wastewater treatment plants and urban runoff [64]. For instance, Castañeda et al. [65] highlighted that MPs in the St. Lawrence River displayed a patchy distribution in sediments, influenced by factors such as water currents and sediment deposition patterns. This pattern explains the slight variation in concentrations at some of the sampling sites, such as S10 and S13, where jogging and leisure walk paths intersect pedestrian walkway bridges in this study area.

3.3. Seasonal and Temporal Variation in MPs in Stream Sediments

MP concentration in stream sediments demonstrated notable temporal and seasonal variability across the three monitoring events, March 2022, October 2022, and March 2023 (Figure 6).
Tukey’s post hoc analysis indicated that at 5 cm depth, the MP concentrations in March 2023 were significantly higher than those in March 2022 (mean difference = 722.35 p/kg, p = 0.0023) and October 2022 (mean difference = 581.18 p/kg, p = 0.0163). In contrast, no significant difference was observed between March 2022 and October 2022 (p = 0.7656). At 10 cm depth, the highest MP concentrations were recorded in October 2022, which were significantly greater than those in March 2022 (mean difference = 463.53 p/kg, p = 0.0401) and March 2023 (mean difference = 698.82, p = 0.0012). No statistically significant difference was observed between March 2022 and March 2023 (p = 0.4158).
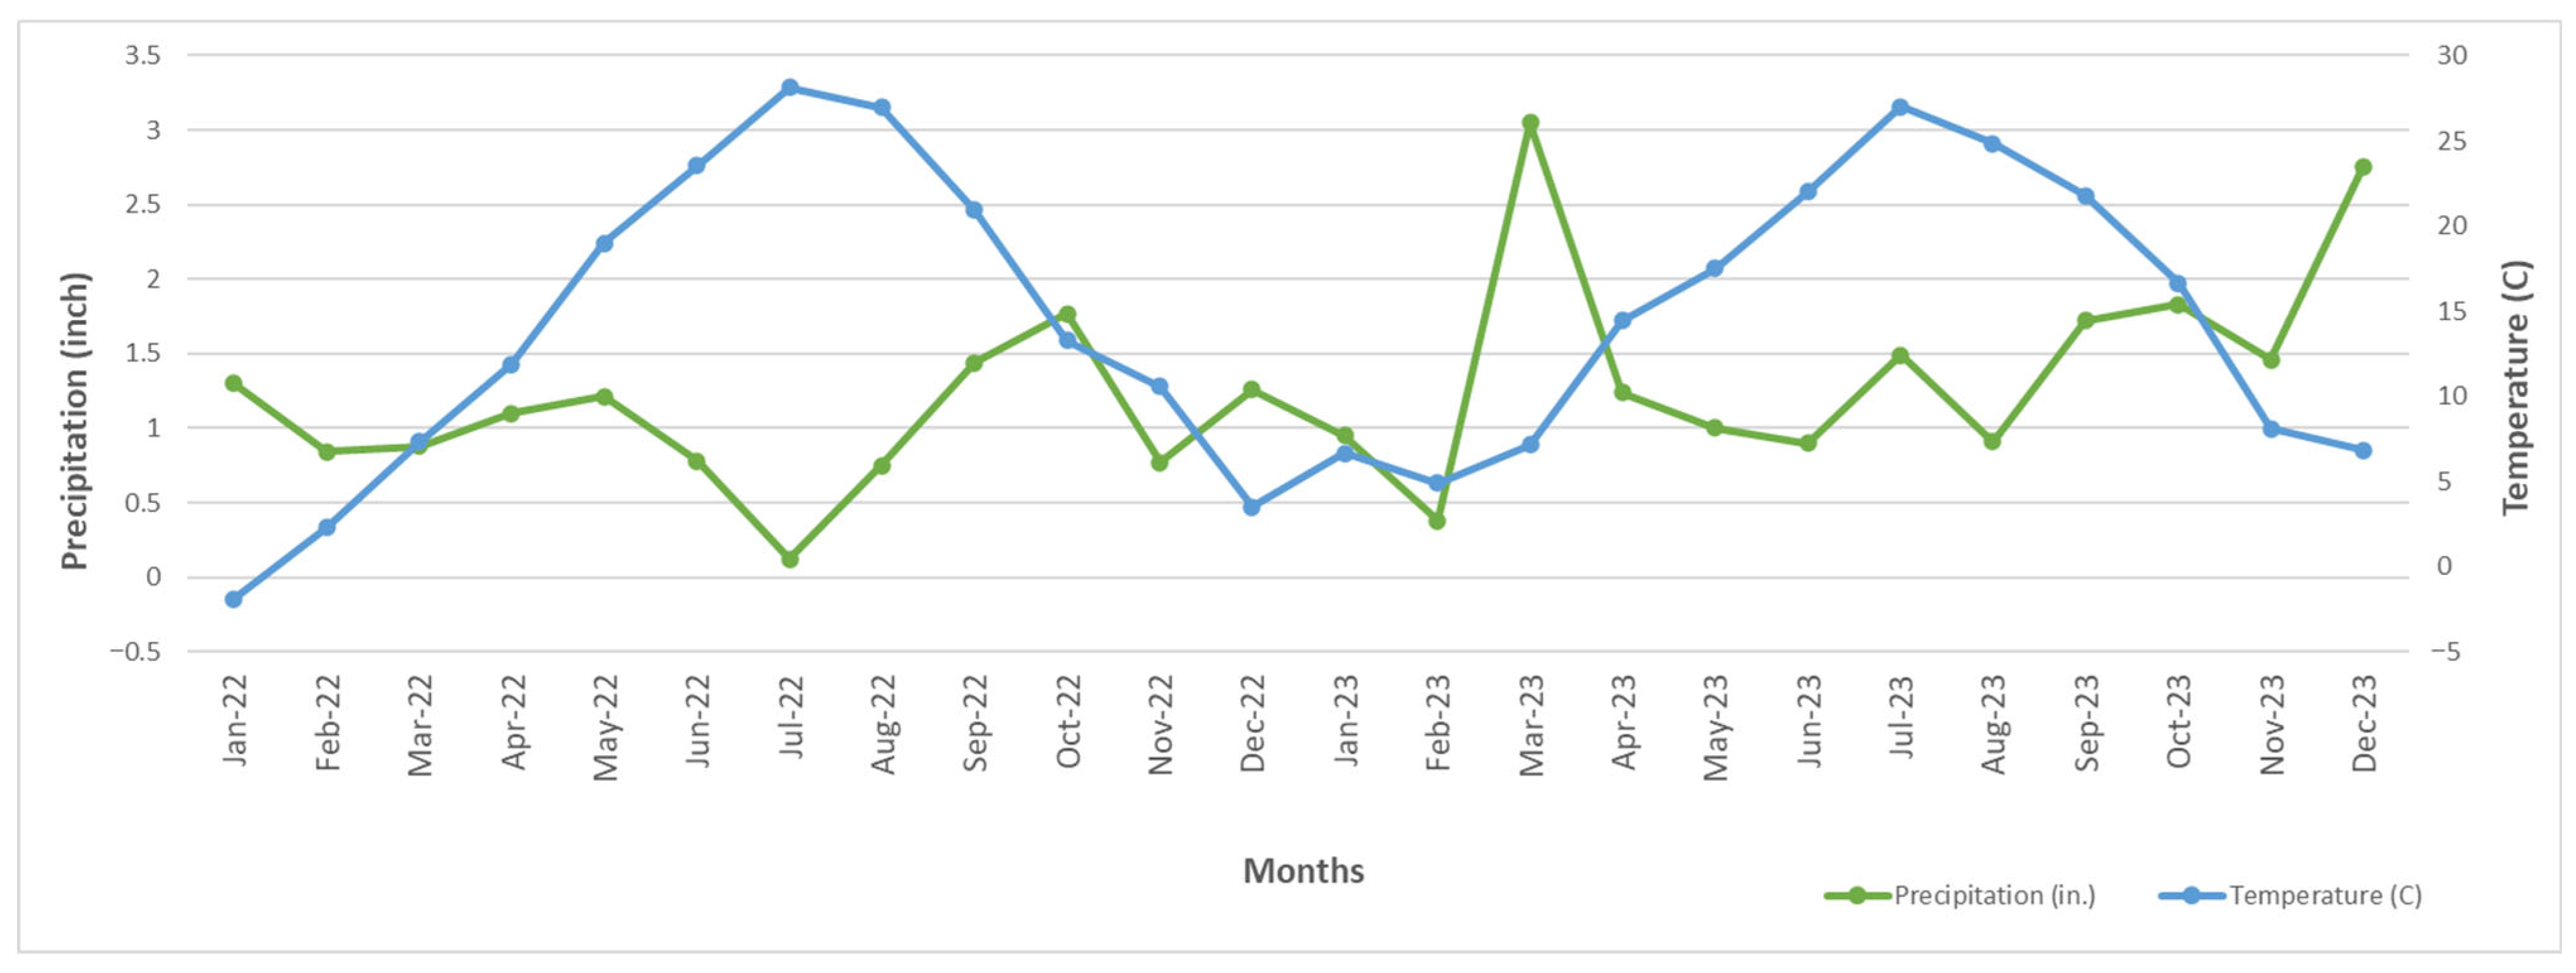
These patterns reflect the influence of seasonal rainfall and temperature (Figure 7). The March 2022 sampling event followed a period of moderate precipitation (~1.2 inches) and lower ambient temperatures (~7 °C), resulting in relatively stable MP concentrations. As shown in our prior work [28], such conditions favor the gradual and consistent accumulation of MPs in upper sediment layers due to lower disturbance and steady input from urban runoff.
In October 2022, the MP concentrations at 5 cm were significantly elevated, with higher spatial variability across sampling sites. This pattern is likely due to cumulative deposition during the summer months, with a gradual increase in rainfall between July 2022 and September 2022 (Figure 7), when anthropogenic activities such as vehicular traffic and road runoff during warm, wet months likely contributed to this accumulation. The retention and surface bias of MPs are consistent with patterns observed in low-energy depositional zones of urban streams [20].
The March 2023 sampling event showed that the MP concentrations at 5 cm were lower compared to previous events, and the concentration difference between 5 cm and 10 cm was often reduced or reversed. This shift can be attributed to the intense rainfall event, which recorded 3.2 inches, the highest rainfall during the entire monitoring period (Figure 7). This event likely triggered sediment disturbance, vertical mixing, and downstream flushing of surface-deposited MPs, explaining the overall reduction in 5 cm concentrations and more frequent inversions where 10 cm concentrations exceeded those at 5 cm. This finding is consistent with Radford et al. [66], who observed that during periods of substantial rainfall, such as 122 mm (4.72 in), the MP concentrations in soils diminished significantly, indicating loss due to runoff. Similarly, Crossman et al. [67] noticed a loss of 30–45% of MPs from soils following intense rainfall events. Ockelford et al. [68] and Forrest et al. [8] further demonstrated that sediment disturbance events can lead to vertical redistribution of MPs, with particles migrating to deeper layers through physical mixing or hyporheic exchange, following intense rain-induced sediment mixing. These findings suggest that MP concentration in stream sediments not only fluctuates across seasons but also shows vertical redistribution patterns shaped by seasonal hydrology. These dynamics underscore the need to consider both temporal variability and storm-event history when interpreting MP profiles in fluvial sediments. While these trends are apparent, future studies should consider a comprehensive study with at least three seasonal cycles for stronger conclusions.
Additionally, the observed temporal trend also suggests a cumulative accumulation of MPs in the streambed, particularly in the surface layer. Such accumulation patterns have been linked to urban runoff and inefficient stormwater infrastructure [2].

3.4. Influence of pH on MP Concentration

This study investigated the potential relationship between MP concentration and soil pH. The pH in most of the sampling sites ranged from 6 to 7, which is considered slightly acidic to neutral and falls within the typical range for freshwater ecosystems. However, during the March 2022 sampling period, lower pH values between 5.0 and 5.5 were recorded at sites S2, S5, and S7, indicating more acidic conditions at these locations.
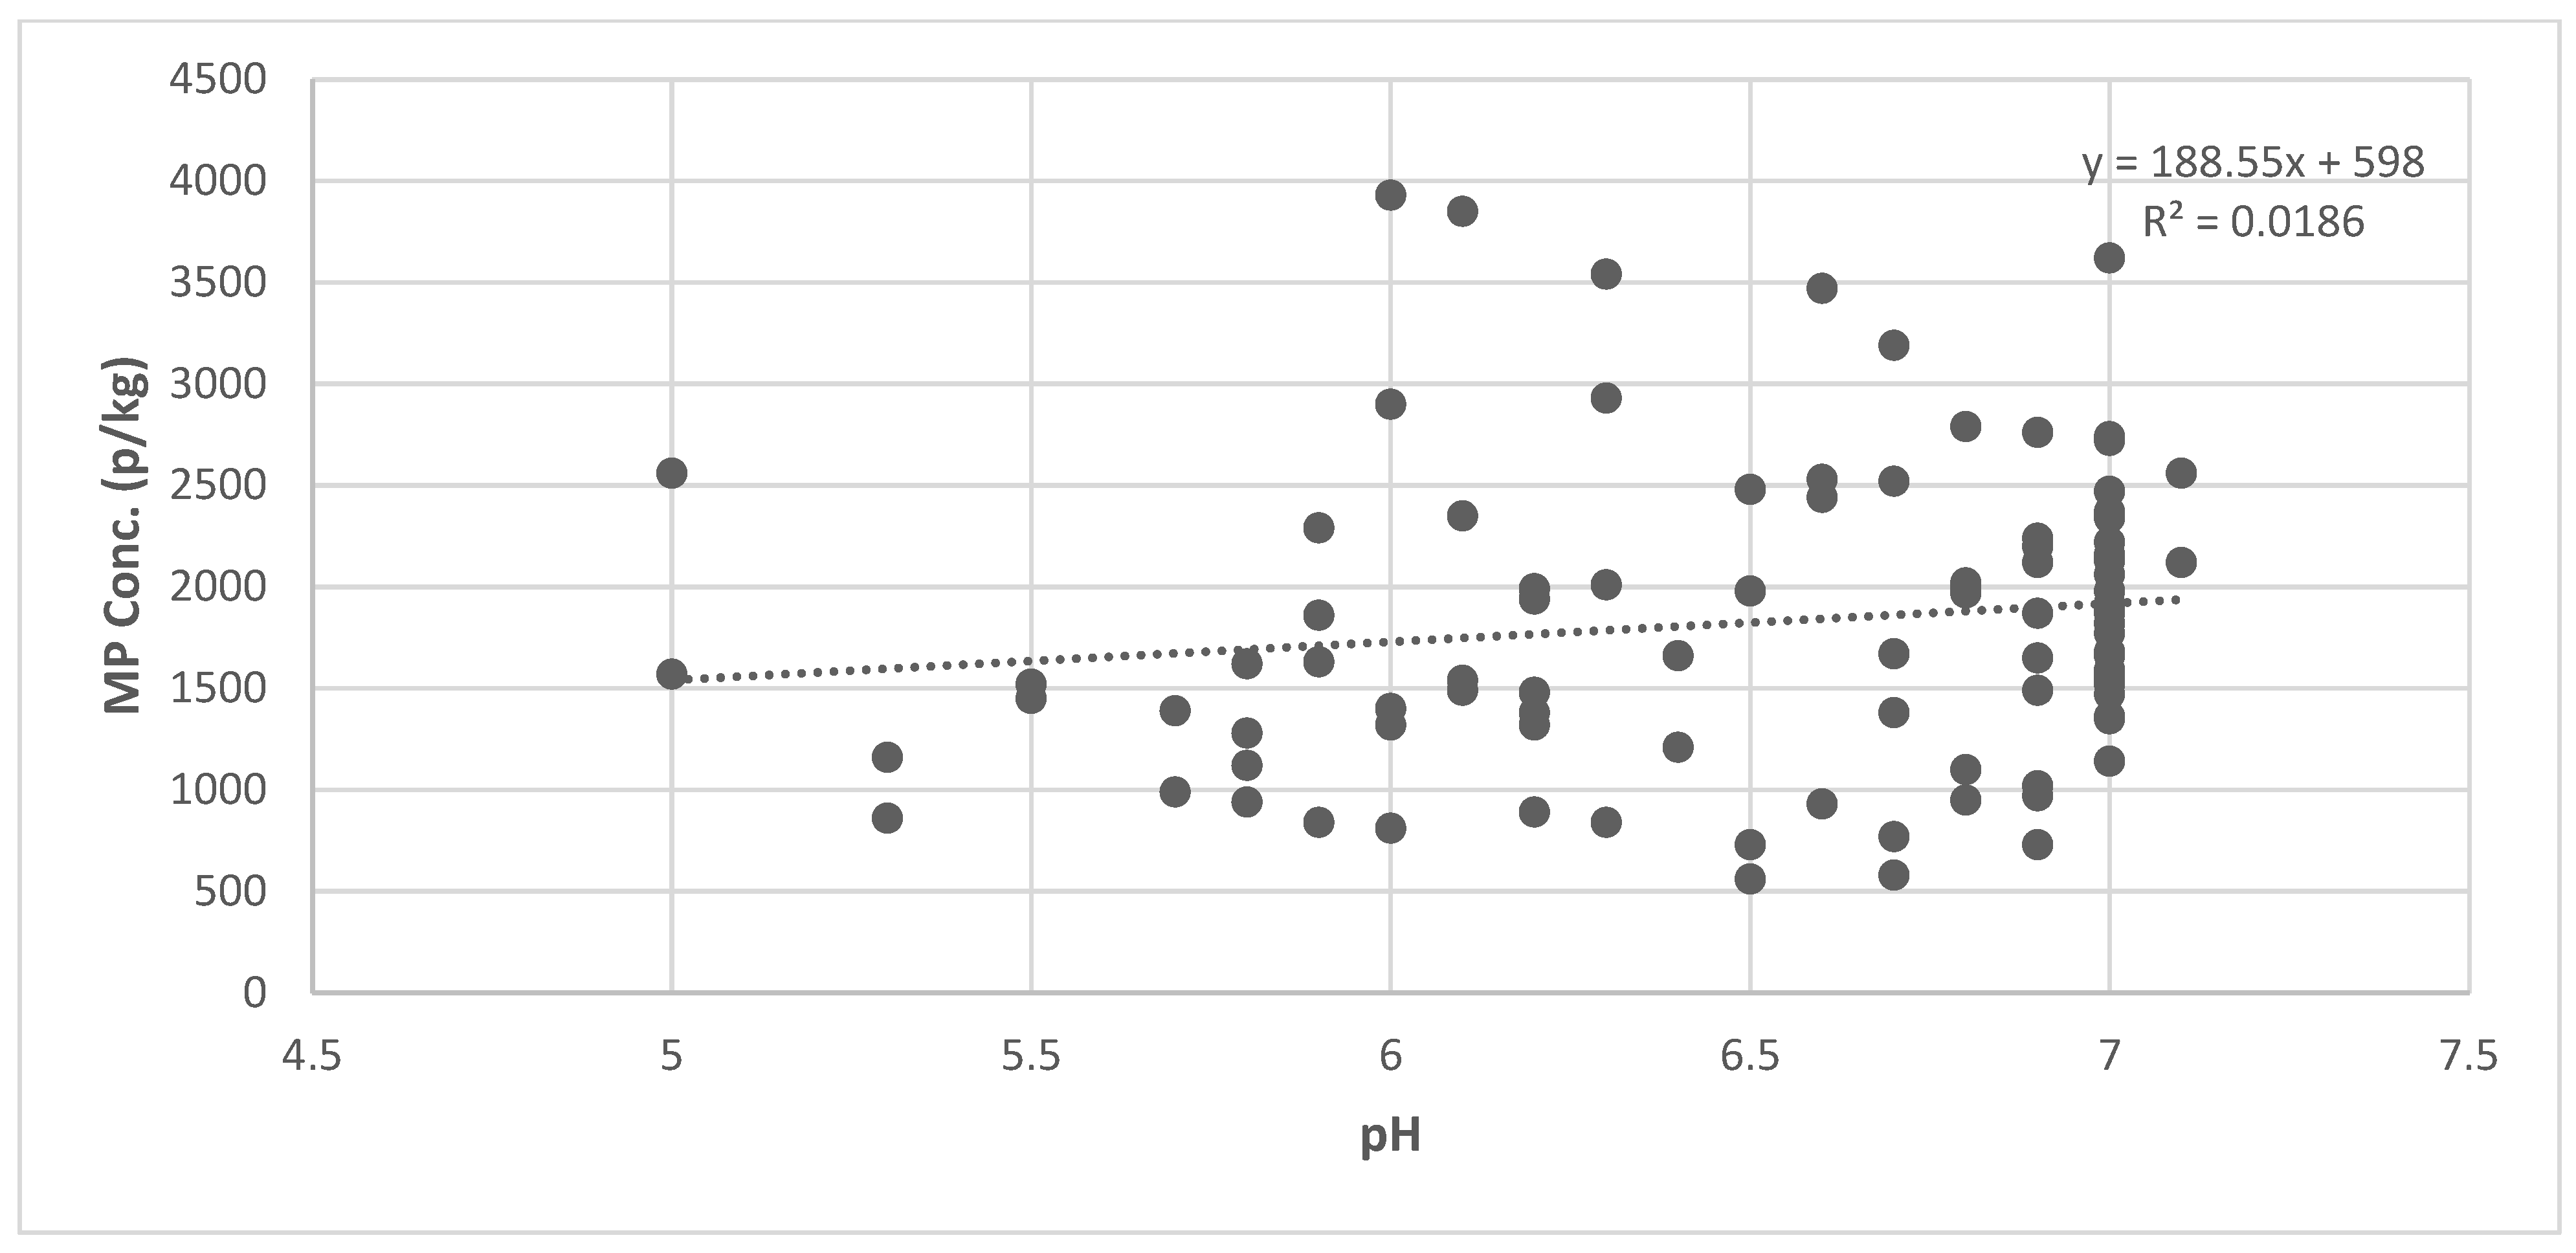
Despite these variations, no clear increasing or decreasing trend was observed between these pH levels and MP abundance (Figure 8). Furthermore, the regression analysis between sediment pH and MP concentration showed a similarly weak relationship, with a coefficient of determination (R2 = 0.0186). The R2 indicates that less than 2% of the variation in MP concentrations can be explained by pH, suggesting a very limited association. While the PCA identified pH as the dominant variable in PC2 (loading = −0.77), explaining ~27% of the variance, its effect on MP concentrations remained inconsistent. Sites with different pH values did not show systematic clustering of MP concentrations in the PCA scatterplots (Figure 9). This suggests that pH may interact with other sediment properties to influence MP retention, but does not independently predict vertical distribution in urban stream sediments. These results are consistent with several field studies in freshwater and marine systems, where pH was not identified as a primary controlling factor for MP accumulation. For instance, Liu et al. [69] found no significant correlation between sediment pH and MP abundance in Daya Bay, China, where pH was slightly alkaline (at pH = 8), concluding that organic carbon and nitrogen content were stronger predictors of MP levels than pH [69]. Similarly, in a study of the Crocodile River in South Africa, while a positive correlation was observed between MP abundance and pH (p = 0.001), the authors noted that pH likely acted as a proxy for anthropogenic pollution, particularly wastewater inputs that also introduce MPs [70].
Interestingly, contrasting patterns were observed in mangrove ecosystem sediments in the Persian Gulf, where lower pH sediments (at pH = 6.86) correlated with higher MP retention compared to the higher pH (at pH = 10) [71]. The acidic, organic-rich conditions of mangrove ecosystems may promote MP deposition by facilitating particle aggregation or reducing mobility [72].
These findings indicate that, although neutral (pH = 7) or slight variations in pH (6–8) may not have a direct influence on MP abundance, the extremely acidic or alkaline conditions may impact the MP abundance by altering their physical and chemical properties. Ariza-Tarazona et al. [73] conducted a laboratory study reporting that low pH (pH = 3) and low temperature (0 °C) have a combined effect on MPs degradation, with a mass loss of 71.77 ± 1.88%, compared to pH 11 at the same temperature (1.55 ± 0.31%). The study noted that if the system is acidic, the degradation is initiated by the interaction of OH with the surface of MPs, after which it is promoted by H+ ions to facilitate the continuity of the plastic degradation reactions [73]. While this evidence highlights the direct impact of pH on MPs’ physical properties, the influence on MP abundance remains unclear. Hence, more studies in a controlled environment are needed to understand the impact of pH on MPs.
The limited predictive value of pH in this study suggests that it is unlikely to be a standalone driver of MP accumulation in streambed sediments and should be considered alongside more influential variables such as land use, stormwater entry points, and sediment texture in future investigations.

3.5. Influence of Temperature on MP Concentration

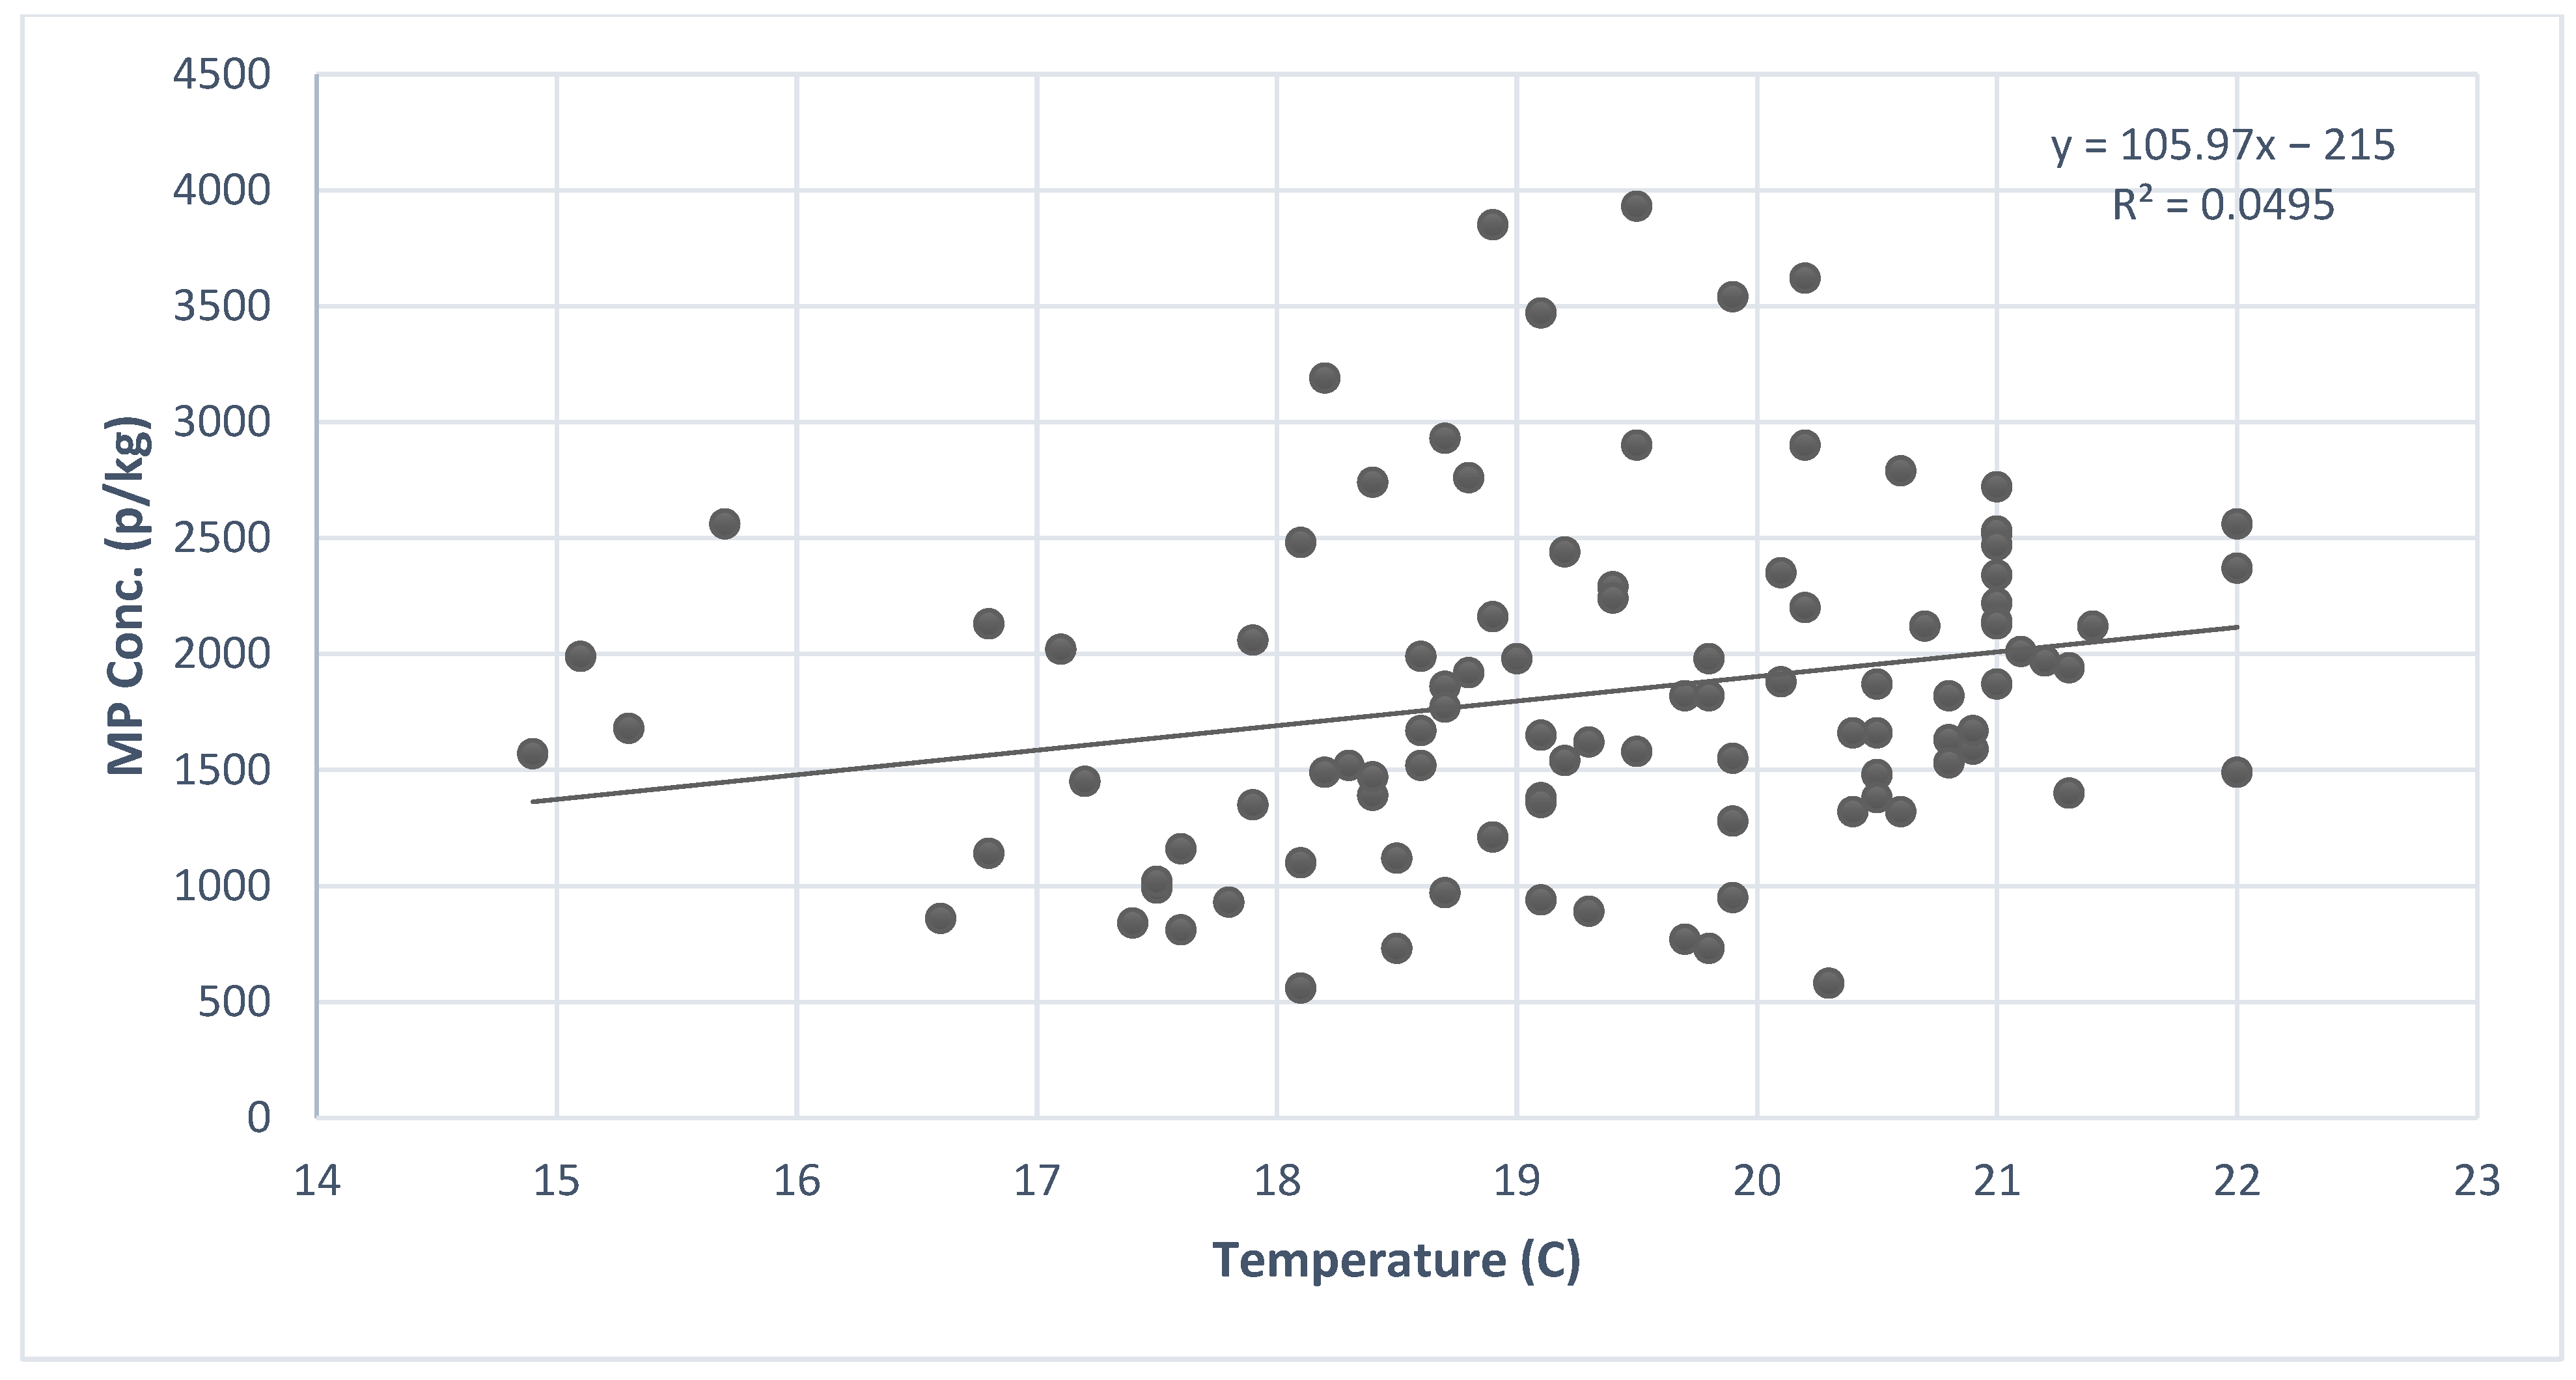
This study investigated the potential relationship between MP concentration and soil temperature. The correlation analysis between MP concentration and sediment temperature yielded a weak relationship, with an R2 value of 0.05 (Figure 10). This suggests that only 5% of the variability in MP concentration can be attributed to temperature changes within the observed range (14.9–22 °C). The PCA further confirmed the weak role of temperature in shaping MP distributions. While temperature contributed moderately to PC1 (loading = −0.53), its influence was secondary to depth, which accounted for most of the explained variance. MP concentrations did not cluster strongly by temperature gradients in the PCA scatterplots (Figure 9). This suggests that temperature had minimal direct influence on MP distribution in the sampled sediments.
This finding is consistent with previous research in freshwater systems, where temperature typically exhibits weak or non-significant correlations with MP concentrations in sediments. For example, Guo et al. [74] conducted sediment microcosm experiments comparing 5 °C and 25 °C and found that while temperature influenced microbial communities, it had no significant effect on the concentration or degradation of MPs within sediments. Similarly, Park and Kim [75] noted enhanced microbial degradation of polyethylene at elevated temperatures (~50 °C), but such high-temperature conditions are rarely encountered in natural freshwater settings.
The existing field studies provide mixed results depending on system characteristics. For instance, the Wei River in China showed a positive correlation between warmer seasonal temperatures and increased MP accumulation in sediments, likely due to decreased flow velocities and enhanced plastic weathering during summer [76]. Conversely, ref. [77] reported higher MP concentrations during the cool-dry season in South Africa’s Nandoni Reservoir, attributing this pattern to reduced turbulence and better sediment retention during colder, calmer conditions. In marine settings, temperature effects tend to be more indirect. Studies in Daya Bay, South China Sea, showed no significant correlation between sediment MP concentration and seawater temperature, with sediment organic content being a more dominant factor [69]. However, marine environments tend to exhibit slower plastic degradation due to generally lower ambient temperatures, which promotes long-term MP persistence [78].
Collectively, these results suggest that temperature alone does not reliably predict MP concentrations in sediments, and its role is likely moderated by site-specific factors such as hydrodynamics, sediment characteristics, and proximity to pollution sources. Future studies should consider integrating other environmental factors such as sediment texture, organic matter, and redox parameters to better explain MP retention mechanisms.

4. Conclusions

This study presents a comprehensive assessment of MP contamination in small urban stream sediments, with a focus on spatial, temporal, and vertical variability, as well as environmental influences such as pH and temperature. MP concentrations in Branch Brook Park streams were higher in 5 cm sediments than in 10 cm, confirming surface accumulation patterns that are seasonally dependent and influenced by hydrological conditions. This highlights the potential of small, highly urbanized water bodies to act as persistent sinks for MP pollution due to cumulative inputs from stormwater runoff, vehicular traffic, and impervious surfaces.
Importantly, while pH and temperature were examined as potential controlling factors, both demonstrated weak statistical associations with MP concentrations (R2 = 0.02 and R2 = 0.05, respectively). These findings are consistent with the broader literature suggesting that although pH and temperature can influence MP behavior through effects on microbial communities, particle aggregation, or degradation processes, their standalone predictive power remains limited in natural sediment environments. Instead, site-specific variables such as land use, hydrodynamic conditions, sediment texture, and proximity to point sources appear to exert greater control over MP distribution. Future work should integrate sediment characteristics, other environmental parameters such as organic matter, redox potential, and turbidity, hydrological modeling, and long-term monitoring to refine our understanding of MP transport and retention mechanisms
Overall, this study advances the understanding of MP behavior in stream systems by emphasizing the multidimensional nature of MP accumulation. It emphasizes the need to incorporate spatial, vertical, and temporal dynamics, together with local environmental conditions and anthropogenic influences, into any predictive or management strategies aimed at addressing microplastic pollution in sediments.

Author Contributions

Conceptualization, M.B. and M.P.J.; Methodology, M.P.J.; Investigation, M.P.J.; Formal Analysis, M.P.J.; Validation, M.P.J. and M.B.; Writing—original draft preparation, M.P.J.; Writing—review and editing, M.P.J., M.B., A.D.B., D.S. and C.O.; Resources, M.B.; Supervision, A.D.B. and M.B.; All authors have read and agreed to the published version of the manuscript.

Funding

This research received no external funding.

Data Availability Statement

The raw data supporting the conclusions of this article will be made available by the authors on request.

Conflicts of Interest

The authors declare no conflicts of interest.

References

  1. Mishra, S.; Charan Rath, C.; Das, A.P. Marine microfiber pollution: A review on present status and future challenges. Mar. Pollut. Bull. 2019, 140, 188–197. [Google Scholar] [CrossRef] [PubMed]
  2. Wagner, M.; Scherer, C.; Alvarez-Muñoz, D.; Brennholt, N.; Bourrain, X.; Buchinger, S.; Fries, E.; Grosbois, C.; Klasmeier, J.; Marti, T. Microplastics in freshwater ecosystems: What we know and what we need to know. Environ. Sci. Eur. 2014, 26, 12. [Google Scholar] [CrossRef]
  3. Campanale, C.; Galafassi, S.; Savino, I.; Massarelli, C.; Ancona, V.; Volta, P.; Uricchio, V.F. Microplastics pollution in the terrestrial environments: Poorly known diffuse sources and implications for plants. Sci. Total Environ. 2022, 805, 150431. [Google Scholar] [CrossRef]
  4. Horton, A.A.; Walton, A.; Spurgeon, D.J.; Lahive, E.; Svendsen, C. Microplastics in freshwater and terrestrial environments: Evaluating the current understanding to identify the knowledge gaps and future research priorities. Sci. Total Environ. 2017, 586, 127–141. [Google Scholar] [CrossRef]
  5. Li, J.; Liu, H.; Chen, J.P. Microplastics in freshwater systems: A review on occurrence, environmental effects, and methods for microplastics detection. Water Res. 2018, 137, 362–374. [Google Scholar] [CrossRef]
  6. Meegoda, J.N.; Pennock, W.H.; Brenckman, C.; Borgaonkar, A.D. Would the Oceans Become Toxic to Humanity Due to Use and Mismanagement of Plastics? Int. J. Environ. Res. Public Health 2024, 22, 17. [Google Scholar] [CrossRef] [PubMed]
  7. Eerkes-Medrano, D.; Thompson, R.C.; Aldridge, D.C. Microplastics in freshwater systems: A review of the emerging threats, identification of knowledge gaps and prioritisation of research needs. Water Res. 2015, 75, 63–82. [Google Scholar] [CrossRef] [PubMed]
  8. Forrest, S.A.; McMahon, D.; Adams, W.A.; Vermaire, J.C. Change in Microplastic Concentration During Various Temporal Events Downstream of a Combined Sewage Overflow and in an Urban Stormwater Creek. Front. Water 2022, 4, 958130. [Google Scholar] [CrossRef]
  9. Jayalakshmamma, M.P.; Nagara, V.N.; Borgaonkar, A.; Sarkar, D.; Sadik, O.; Boufadel, M. Characterizing microplastics in urban runoff: A multi-land use assessment with a focus on 1–125 μm size particles. Sci. Total Environ. 2023, 904, 166685. [Google Scholar] [CrossRef]
  10. Kay, P.; Hiscoe, R.; Moberley, I.; Bajic, L.; McKenna, N. Wastewater treatment plants as a source of microplastics in river catchments. Environ. Sci. Pollut. Res. 2018, 25, 20264–20267. [Google Scholar] [CrossRef]
  11. Wright, S.L.; Ulke, J.; Font, A.; Chan, K.L.A.; Kelly, F.J. Atmospheric microplastic deposition in an urban environment and an evaluation of transport. Environ. Int. 2020, 136, 105411. [Google Scholar] [CrossRef]
  12. Brenckman, C.M.; Parameswarappa Jayalakshmamma, M.; Pennock, W.H.; Ashraf, F.; Borgaonkar, A.D. A Review of Harmful Algal Blooms: Causes, Effects, Monitoring, and Prevention Methods. Water 2025, 17, 1980. [Google Scholar] [CrossRef]
  13. Ren, X.; Mao, M.; Feng, M.; Peng, T.; Long, X.; Yang, F. Fate, abundance and ecological risks of microcystins in aquatic environment: The implication of microplastics. Water Res. 2024, 251, 121121. [Google Scholar] [CrossRef] [PubMed]
  14. Tamminga, M.; Stoewer, S.-C.; Fischer, E.K. On the representativeness of pump water samples versus manta sampling in microplastic analysis. Environ. Pollut. 2019, 254, 112970. [Google Scholar] [CrossRef] [PubMed]
  15. Yuan, W.; Liu, X.; Wang, W.; Di, M.; Wang, J. Microplastic abundance, distribution and composition in water, sediments, and wild fish from Poyang Lake, China. Ecotoxicol. Environ. Saf. 2019, 170, 180–187. [Google Scholar] [CrossRef]
  16. Yang, S.; Zhou, M.; Chen, X.; Hu, L.; Xu, Y.; Fu, W.; Li, C. A comparative review of microplastics in lake systems from different countries and regions. Chemosphere 2022, 286, 131806. [Google Scholar] [CrossRef]
  17. Yonkos, L.T.; Friedel, E.A.; Perez-Reyes, A.C.; Ghosal, S.; Arthur, C.D. Microplastics in four estuarine rivers in the Chesapeake Bay, USA. Environ. Sci. Technol. 2014, 48, 14195–14202. [Google Scholar] [CrossRef]
  18. Baldwin, A.K.; Corsi, S.R.; Mason, S.A. Plastic debris in 29 Great Lakes tributaries: Relations to watershed attributes and hydrology. Environ. Sci. Technol. 2016, 50, 10377–10385. [Google Scholar] [CrossRef]
  19. Dris, R.; Imhof, H.; Sanchez, W.; Gasperi, J.; Galgani, F.; Tassin, B.; Laforsch, C. Beyond the ocean: Contamination of freshwater ecosystems with (micro-) plastic particles. Environ. Chem. 2015, 12, 539–550. [Google Scholar] [CrossRef]
  20. Hurley, R.; Woodward, J.; Rothwell, J.J. Microplastic contamination of river beds significantly reduced by catchment-wide flooding. Nat. Geosci. 2018, 11, 251–257. [Google Scholar] [CrossRef]
  21. McCormick, A.R.; Hoellein, T.J.; London, M.G.; Hittie, J.; Scott, J.W.; Kelly, J.J. Microplastic in Surface Waters of Urban Rivers: Concentration, Sources, and Associated Bacterial Assemblages. Ecosphere 2016, 7, e01556. [Google Scholar] [CrossRef]
  22. Montecinos, S.; Gil, M.; Tognana, S.; Salgueiro, W.; Amalvy, J. Distribution of microplastics present in a stream that receives discharge from wastewater treatment plants. Environ. Pollut. 2022, 314, 120299. [Google Scholar] [CrossRef]
  23. Dikareva, N.; Simon, K.S. Microplastic pollution in streams spanning an urbanisation gradient. Environ. Pollut. 2019, 250, 292–299. [Google Scholar] [CrossRef]
  24. Gonzalez-Saldias, F.; Sabater, F.; Gomà, J. Microplastic distribution and their abundance along rivers are determined by land uses and sediment granulometry. Sci. Total Environ. 2024, 933, 173165. [Google Scholar] [CrossRef]
  25. Berg, E.M.; Speir, S.L.; Shogren, A.J.; Dee, M.M.; Vincent, A.E.S.; Tank, J.L.; Kelly, J.J.; Hoellein, T.J. Transport and Retention of Microplastic Fibers in Streams Are Impacted by Benthic Algae, Discharge, and Substrate. Limnol. Oceanogr. 2025, 70, 1093–1107. [Google Scholar] [CrossRef]
  26. Vincent, A.E.S.; Hoellein, T.J. Distribution and Transport of Microplastic and Fine Particulate Organic Matter in Urban Streams. Ecol. Appl. 2021, 31, e02429. [Google Scholar] [CrossRef]
  27. Drummond, J.D.; Schneidewind, U.; Li, A.; Hoellein, T.J.; Krause, S.; Packman, A.I. Microplastic accumulation in riverbed sediment via hyporheic exchange from headwaters to mainstems. Sci. Adv. 2022, 8, eabi9305. [Google Scholar] [CrossRef]
  28. Jayalakshmamma, M.P.; Nagara, V.N.; Borgaonkar, A.; Sarkar, D.; Obropta, C.; Boufadel, M. Temporal and spatial distribution of microplastics in green infrastructures: Rain gardens. Chemosphere 2024, 362, 142543. [Google Scholar] [CrossRef]
  29. Huang, Y.; Fan, J.; Liu, H.; Lu, X. Vertical distribution of microplastics in the sediment profiles of the Lake Taihu, eastern China. Sustain. Environ. Res. 2022, 32, 44. [Google Scholar] [CrossRef]
  30. Kida, M.; Ziembowicz, S.; Koszelnik, P. CH4 and CO2 emissions from the decomposition of microplastics in the bottom sediment—Preliminary studies. Environments 2022, 9, 91. [Google Scholar] [CrossRef]
  31. Tristanova, T.; Ismanto, A.; Widiaratih, R.; Zainuri, M.; Sugianto, D.N.; Rochaddi, B.; Ismuniarti, D.H.; Wulandari, S.Y.; Hernawan, U.; Hadibarata, T. Modeling the fate of microplastics in the Sengkarang Estuary, Pekalongan City, Central Java, Indonesia. Environ. Qual. Manag. 2024, 34, e22239. [Google Scholar] [CrossRef]
  32. Baldwin, A.K.; Spanjer, A.R.; Rosen, M.R.; Thom, T. Microplastics in Lake Mead national recreation area, USA: Occurrence and biological uptake. PLoS ONE 2020, 15, e0228896. [Google Scholar] [CrossRef]
  33. Pittroff, M.; Loui, C.; Oswald, S.E.; Bochow, M.; Kamp, J.; Dierkes, G.; Lensing, H.-J.; Munz, M. Riverbed depth-specific microplastics distribution and potential use as process marker. Environ. Sci. Pollut. Res. 2024, 31, 45326–45340. [Google Scholar] [CrossRef]
  34. Li, C.; Tang, K.H.D. Effects of pH and temperature on the leaching of di (2-ethylhexyl) phthalate and di-n-butyl phthalate from microplastics in simulated marine environment. Biointerface Res. Appl. Chem. 2023, 13, 269. [Google Scholar]
  35. Feng, S.; Lu, H.; Xue, Y.; Liu, Y.; Li, H.; Zhou, C.; Zhang, X.; Yan, P. Occurrence of microplastics in the headwaters of Yellow River on the Tibetan Plateau: Source analysis and ecological risk assessment. J. Hazard. Mater. 2024, 477, 135327. [Google Scholar] [CrossRef] [PubMed]
  36. Mutshekwa, T.; Munyai, L.F.; Mugwedi, L.; Cuthbert, R.N.; Dondofema, F.; Dalu, T. Seasonal occurrence of microplastics in sediment of two South African recreational reservoirs. Water Biol. Secur. 2023, 2, 100185. [Google Scholar] [CrossRef]
  37. Aralappanavar, V.K.; Mukhopadhyay, R.; Yu, Y.; Liu, J.; Bhatnagar, A.; Praveena, S.M.; Li, Y.; Paller, M.; Adyel, T.M.; Rinklebe, J. Effects of microplastics on soil microorganisms and microbial functions in nutrients and carbon cycling–A review. Sci. Total Environ. 2024, 924, 171435. [Google Scholar] [CrossRef]
  38. Fox, J.M.; Schwoerer, G.D.; Schreiner, K.M.; Minor, E.C.; Maurer-Jones, M.A. Microplastics in the Water Column of Western Lake Superior. ACS ES&T Water 2022, 2, 1659–1666. [Google Scholar] [CrossRef]
  39. Buwono, N.R.; Risjani, Y.; Soegianto, A. Distribution of microplastic in relation to water quality parameters in the Brantas River, East Java, Indonesia. Environ. Technol. Innov. 2021, 24, 101915. [Google Scholar] [CrossRef]
  40. Essex County Parks. Branch Brook Park Overview. 2023. Available online: https://essexcountyparks.org/parks/branch-brook-park (accessed on 15 August 2025).
  41. US Census Bureau. Population Estimates. 2021. Available online: https://www.census.gov/quickfacts/fact/table/US/PST045221 (accessed on 15 August 2025).
  42. EPA. Passaic River Basin Restoration Efforts. Available online: https://www.epa.gov/urbanwaterspartners/passaic-river-partnership-history-and-accomplishments (accessed on 15 September 2025).
  43. Mishra, S.; Dash, D.; Das, A.P. Detection, characterization and possible biofragmentation of synthetic microfibers released from domestic laundering wastewater as an emerging source of marine pollution. Mar. Pollut. Bull. 2022, 185, 114254. [Google Scholar] [CrossRef] [PubMed]
  44. Masura, J.; Baker, J.; Foster, G.; Arthur, C. Laboratory Methods for the Analysis of Microplastics in the Marine Environment: Recommendations for Quantifying Synthetic Particles in Waters and Sediments; NOAA Technical Memorandum; NOS-OR&R-48; NOAA Marine Debris Division: Silver Spring, MD, USA, 2015; Volume 48, p. 10296. [Google Scholar] [CrossRef]
  45. Radford, F.; Zapata-Restrepo, L.M.; Horton, A.A.; Hudson, M.D.; Shaw, P.J.; Williams, I.D. Developing a systematic method for extraction of microplastics in soils. Anal. Methods 2021, 13, 1695–1705. [Google Scholar] [CrossRef]
  46. Jayalakshmamma, M.P.; Ji, W.; Abou Khalil, C.; Marhaba, T.F.; Abrams, S.; Lee, K.; Zhang, H.; Boufadel, M. Removal of hydrocarbons from heterogenous soil using electrokinetics and surfactants. Environ. Chall. 2021, 4, 100071. [Google Scholar] [CrossRef]
  47. Ji, W.; Jayalakshmamma, M.P.; Abou Khalil, C.; Zhao, L.; Boufadel, M. Removal of hydrocarbon from soils possessing macro-heterogeneities using electrokinetics and surfactants. Chem. Eng. J. Adv. 2020, 4, 100030. [Google Scholar] [CrossRef]
  48. Rimondi, V.; Monnanni, A.; De Beni, E.; Bicocchi, G.; Chelazzi, D.; Cincinelli, A.; Fratini, S.; Martellini, T.; Morelli, G.; Venturi, S. Occurrence and quantification of natural and microplastic items in urban streams: The case of Mugnone Creek (Florence, Italy). Toxics 2022, 10, 159. [Google Scholar] [CrossRef]
  49. Ballent, A.; Corcoran, P.L.; Madden, O.; Helm, P.A.; Longstaffe, F.J. Sources and sinks of microplastics in Canadian Lake Ontario nearshore, tributary and beach sediments. Mar. Pollut. Bull. 2016, 110, 383–395. [Google Scholar] [CrossRef]
  50. Horton, A.A.; Svendsen, C.; Williams, R.J.; Spurgeon, D.J.; Lahive, E. Large microplastic particles in sediments of tributaries of the River Thames, UK–Abundance, sources and methods for effective quantification. Mar. Pollut. Bull. 2017, 114, 218–226. [Google Scholar] [CrossRef]
  51. Klein, S.; Worch, E.; Knepper, T.P. Occurrence and spatial distribution of microplastics in river shore sediments of the Rhine-Main area in Germany. Environ. Sci. Technol. 2015, 49, 6070–6076. [Google Scholar] [CrossRef] [PubMed]
  52. Wang, J.; Peng, J.; Tan, Z.; Gao, Y.; Zhan, Z.; Chen, Q.; Cai, L. Microplastics in the surface sediments from the Beijiang River littoral zone: Composition, abundance, surface textures and interaction with heavy metals. Chemosphere 2017, 171, 248–258. [Google Scholar] [CrossRef] [PubMed]
  53. Lenz, R.; Enders, K.; Stedmon, C.A.; Mackenzie, D.M.; Nielsen, T.G. A critical assessment of visual identification of marine microplastic using Raman spectroscopy for analysis improvement. Mar. Pollut. Bull. 2015, 100, 82–91. [Google Scholar] [CrossRef] [PubMed]
  54. Song, Y.K.; Hong, S.H.; Jang, M.; Han, G.M.; Rani, M.; Lee, J.; Shim, W.J. A comparison of microscopic and spectroscopic identification methods for analysis of microplastics in environmental samples. Mar. Pollut. Bull. 2015, 93, 202–209. [Google Scholar] [CrossRef]
  55. Hale, R.C.; Seeley, M.E.; Guardia, M.J.L.; Mai, L.; Zeng, E.Y. A Global Perspective on Microplastics. J. Geophys. Res. Ocean. 2020, 125, e2018JC014719. [Google Scholar] [CrossRef]
  56. Henny, C.; Suryono, T.; Rohaningsih, D.; Yoga, G.P.; Sudarso, J.; Waluyo, A. The Occurrence of Microplastics in the Surface Water of Several Urban Lakes in the Megacity of Jakarta. IOP Conf. Ser. Earth Environ. Sci. 2023, 1201, 012023. [Google Scholar] [CrossRef]
  57. Clayer, F.; Jartun, M.; Buenaventura, N.; Guerrero, J.-L.; Lusher, A. Bypass of Booming Inputs of Urban and Sludge-Derived Microplastics in a Large Nordic Lake. Environ. Sci. Technol. 2021, 55, 7949–7958. [Google Scholar] [CrossRef]
  58. Felismino, M.E.L.; Helm, P.A.; Rochman, C.M. Microplastic and other anthropogenic microparticles in water and sediments of Lake Simcoe. J. Great Lakes Res. 2021, 47, 180–189. [Google Scholar] [CrossRef]
  59. Egessa, R.; Nankabirwa, A.; Basooma, R.; Nabwire, R. Occurrence, distribution and size relationships of plastic debris along shores and sediment of northern Lake Victoria. Environ. Pollut. 2020, 257, 113442. [Google Scholar] [CrossRef]
  60. Oni, B.A.; Ayeni, A.O.; Agboola, O.; Oguntade, T.; Obanla, O. Comparing microplastics contaminants in (dry and raining) seasons for Ox-Bow Lake in Yenagoa, Nigeria. Ecotoxicol. Environ. Saf. 2020, 198, 110656. [Google Scholar] [CrossRef]
  61. Bao, K.; Jiang, H.; Su, P.; Lü, P.; Yan, Z. Vertical Profiles of Microplastics in the Hyporheic Zone Sediment: A Case Study in the Yangtze River, Nanjing Section. Sustainability 2023, 15, 7895. [Google Scholar] [CrossRef]
  62. Harrison, J.P.; Schratzberger, M.; Sapp, M.; Osborn, A.M. Rapid bacterial colonization of low-density polyethylene microplastics in coastal sediment microcosms. BMC Microbiol. 2014, 14, 232. [Google Scholar] [CrossRef]
  63. Chen, P.; Kane, I.; Clare, M.; Soutter, E.; Mienis, F.; Wogelius, R.A.; Keavney, E. Direct Evidence That Microplastics Are Transported to the Deep Sea by Turbidity Currents. Environ. Sci. Technol. 2025, 59, 7278–7287. [Google Scholar] [CrossRef] [PubMed]
  64. Barrows, A.; Christiansen, K.S.; Bode, E.T.; Hoellein, T.J. A Watershed-Scale, Citizen Science Approach to Quantifying Microplastic Concentration in a Mixed Land-Use River. Water Res. 2018, 147, 382–392. [Google Scholar] [CrossRef]
  65. Castañeda, R.A.; Avlijas, S.; Simard, M.A.; Ricciardi, A. Microplastic pollution in St. Lawrence river sediments. Can. J. Fish. Aquat. Sci. 2014, 71, 1767–1771. [Google Scholar] [CrossRef]
  66. Radford, F.; Horton, A.; Hudson, M.; Shaw, P.; Williams, I. Agricultural soils and microplastics: Are biosolids the problem? Front. Soil. Sci. 2023, 2, 941837. [Google Scholar] [CrossRef]
  67. Crossman, J.; Hurley, R.R.; Futter, M.; Nizzetto, L. Transfer and transport of microplastics from biosolids to agricultural soils and the wider environment. Sci. Total Environ. 2020, 724, 138334. [Google Scholar] [CrossRef] [PubMed]
  68. Ockelford, A.; Cundy, A.; Ebdon, J.E. Storm response of fluvial sedimentary microplastics. Sci. Rep. 2020, 10, 1865. [Google Scholar] [CrossRef]
  69. Liu, P.; Liao, H.; Deng, Y.; Zhang, W.; Zhou, Z.; Sun, D.; Ke, Z.; Zhou, A.; Tang, H. Microplastic Pollution and Its Potential Correlation with Environmental Factors in Daya Bay, South China Sea. J. Mar. Sci. Eng. 2023, 11, 1465. [Google Scholar] [CrossRef]
  70. Nkosi, M.S.; Cuthbert, R.N.; Wu, N.; Shikwambana, P.; Dalu, T. Microplastic abundance, distribution, and diversity in water and sediments along a subtropical river system. Environ. Sci. Pollut. Res. Int. 2023, 30, 91440–91452. [Google Scholar] [CrossRef]
  71. Maghsodian, Z.; Sanati, A.M.; Ramavandi, B.; Ghasemi, A.; Sorial, G.A. Microplastics accumulation in sediments and Periophthalmus waltoni fish, mangrove forests in southern Iran. Chemosphere 2021, 264, 128543. [Google Scholar] [CrossRef]
  72. Maghsodian, Z.; Sanati, A.M.; Tahmasebi, S.; Shahriari, M.H.; Ramavandi, B. Study of microplastics pollution in sediments and organisms in mangrove forests: A review. Environ. Res. 2022, 208, 112725. [Google Scholar] [CrossRef] [PubMed]
  73. Ariza-Tarazona, M.C.; Villarreal-Chiu, J.F.; Hernández-López, J.M.; De la Rosa, J.R.; Barbieri, V.; Siligardi, C.; Cedillo-González, E.I. Microplastic pollution reduction by a carbon and nitrogen-doped TiO2: Effect of pH and temperature in the photocatalytic degradation process. J. Hazard. Mater. 2020, 395, 122632. [Google Scholar] [CrossRef]
  74. Guo, F.; Liu, B.; Zhao, J.; Hou, Y.; Wu, J.; Hu, H.; Zhou, C.; Hu, H.; Zhang, T.; Yang, Z. A Song of Ice and Fire: Temperature-Dependent Effects of Microplastics on Sediment Bacteriome and Metabolome. Chemosphere 2024, 350, 141190. [Google Scholar] [CrossRef] [PubMed]
  75. Park, S.Y.; Kim, C.G. Biodegradation of micro-polyethylene particles by bacterial colonization of a mixed microbial consortium isolated from a landfill site. Chemosphere 2019, 222, 527–533. [Google Scholar] [CrossRef] [PubMed]
  76. Zhang, L.; Li, X.; Li, Q.; Xia, X.; Zhang, H. The effects of land use types on microplastics in river water: A case study on the mainstream of the Wei River, China. Environ. Monit. Assess. 2024, 196, 349. [Google Scholar] [CrossRef]
  77. Themba, N.N.; Dondofema, F.; Cuthbert, R.N.; Munyai, L.F.; Dalu, T. Abundance and distribution of microplastics in benthic sediments and Cladocera taxa in a subtropical Austral reservoir. Integr. Environ. Assess. Manag. 2024, 20, 2256–2270. [Google Scholar] [CrossRef]
  78. Haque, F.; Fan, C. Fate of microplastics under the influence of climate change. iScience 2023, 26, 107649. [Google Scholar] [CrossRef] [PubMed]
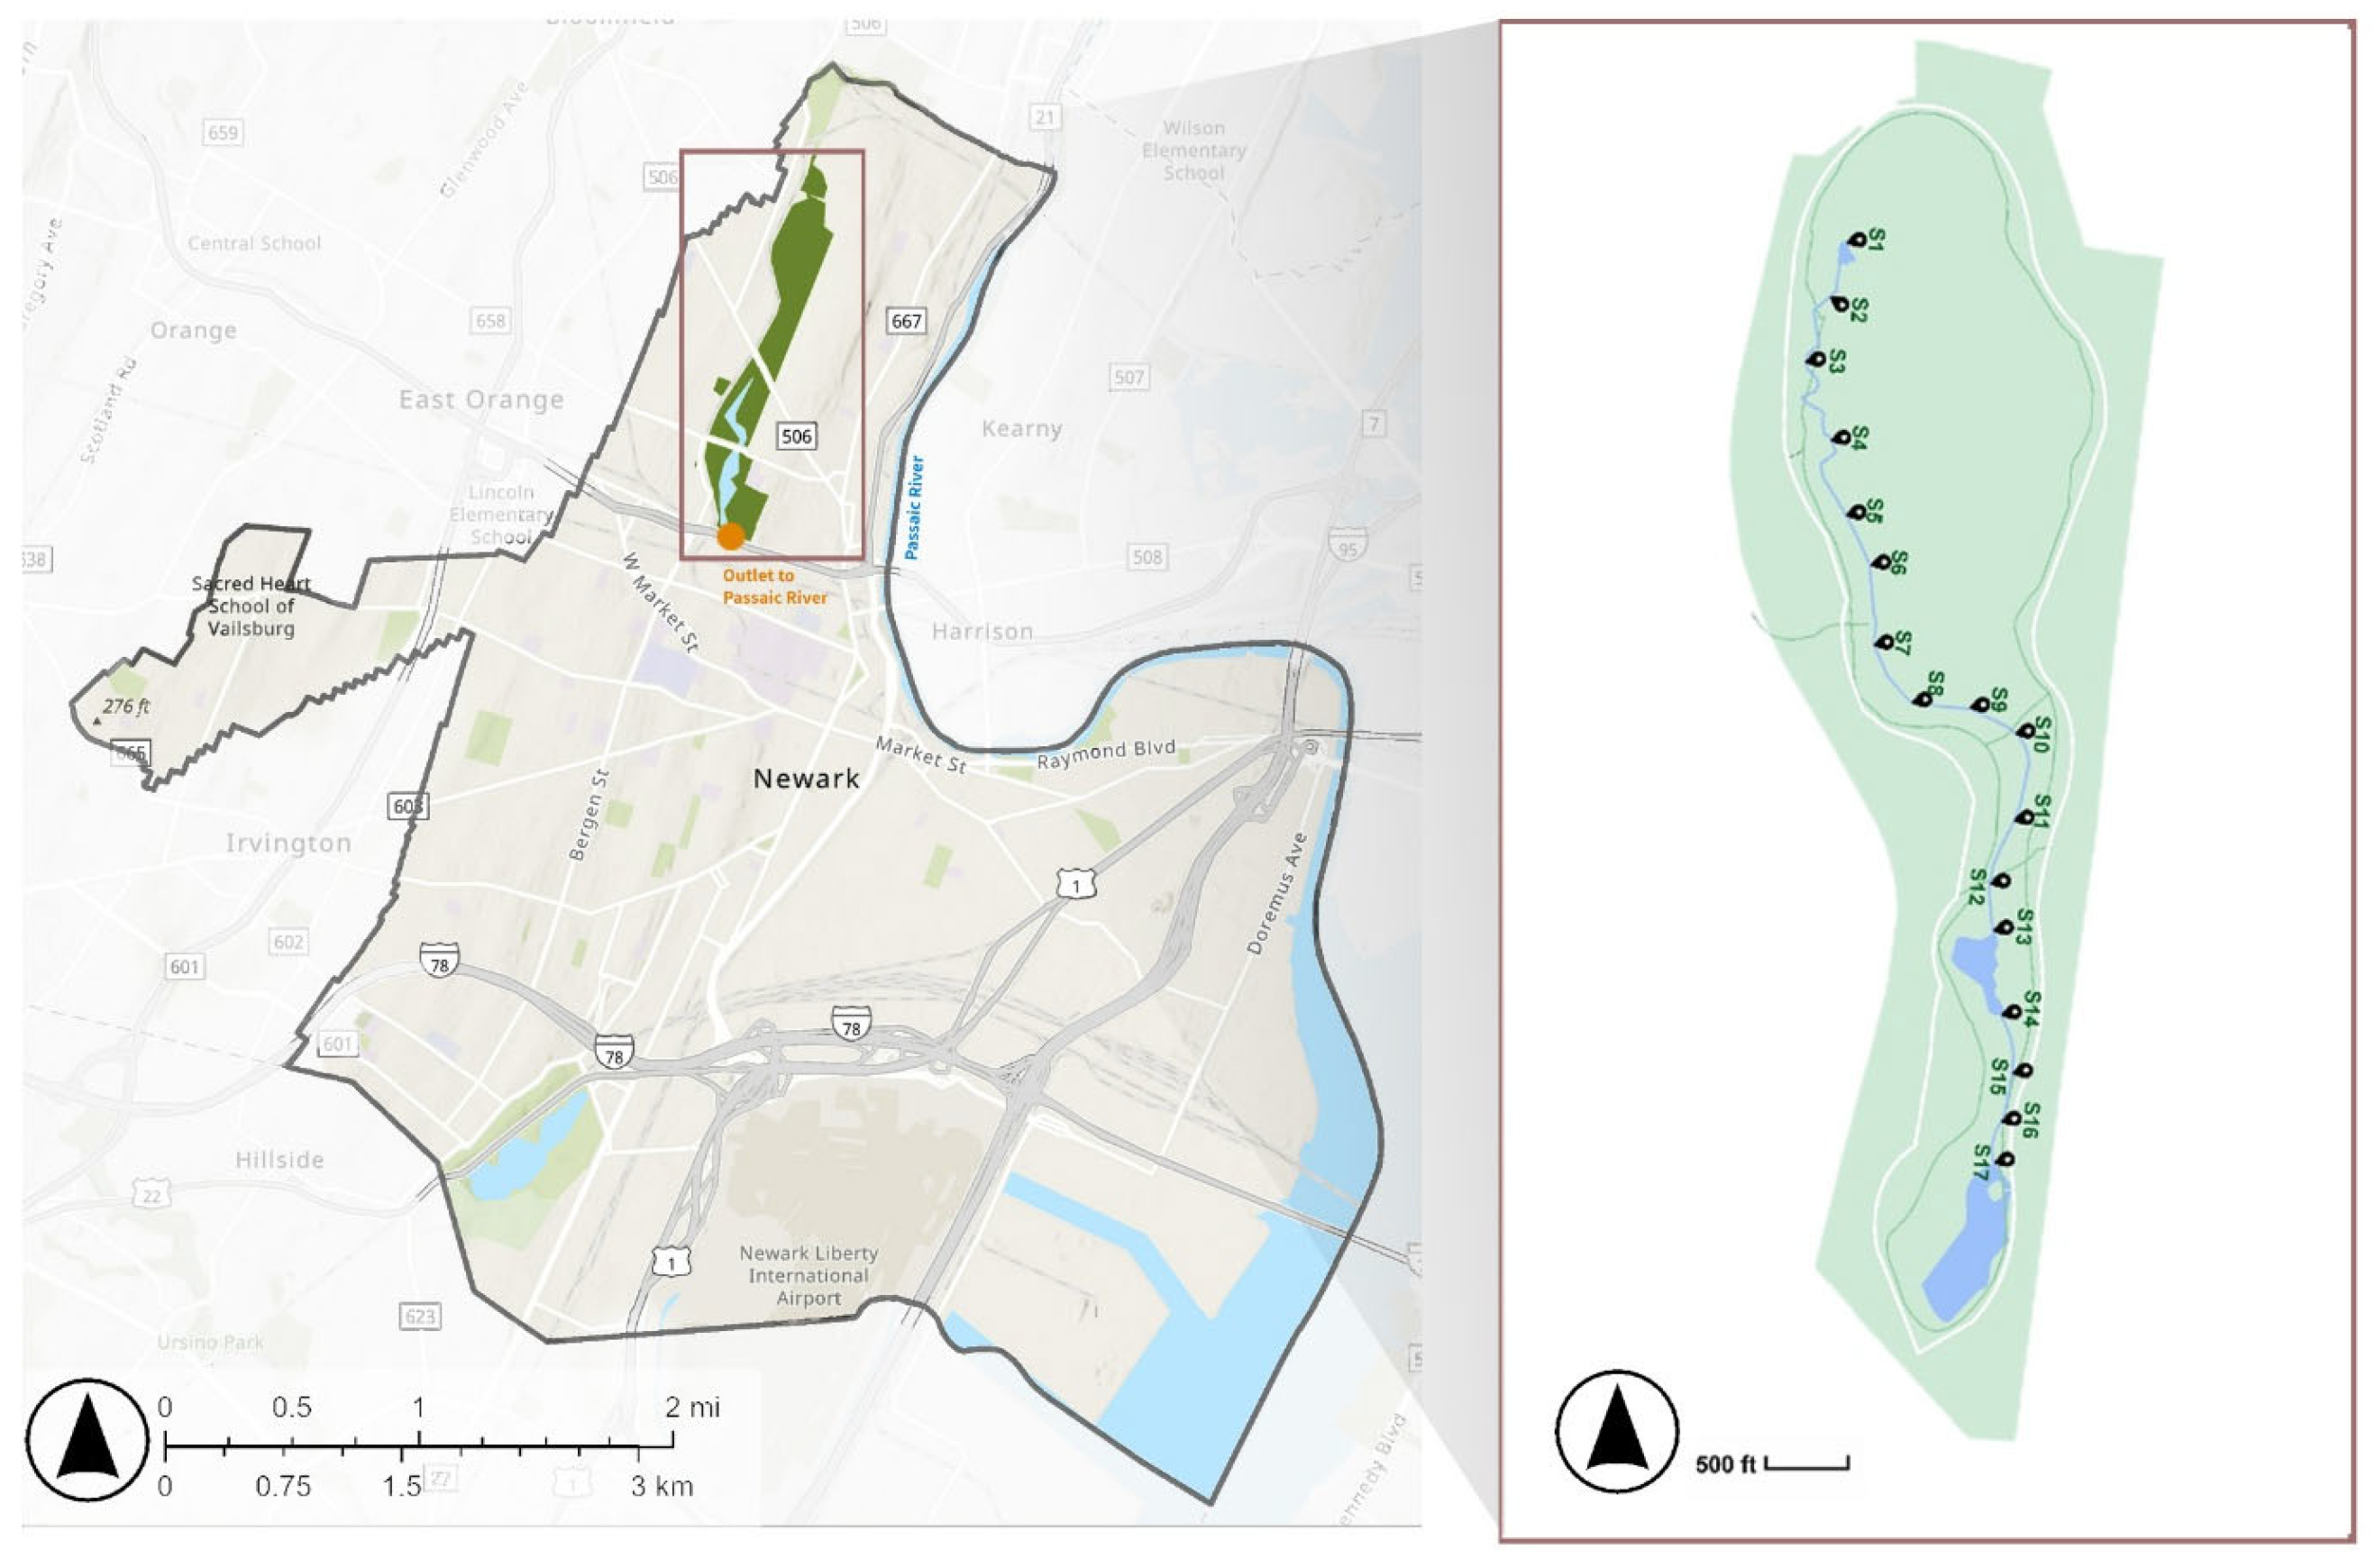
Figure 1. Sampling locations of the streambed within Branch Brook Park, located in Newark, NJ, USA. Sites S1–S17 represent the sampling locations.
Microplastics 04 00065 g001
Figure 2. (a) PE polymer under Raman microscope, (b) Spectrum confirming PE obtained on FTIR, (c) PTFE polymer under Raman microscope, (d) Spectrum confirming PTFE obtained on Raman microscope. The green line represents the polymer library, and the blue line represents the analyzed particle.
Microplastics 04 00065 g002
Figure 3. Measured MP concentration at each site as a function of distance from the upstream point at 5 cm depth.
Microplastics 04 00065 g003
Figure 4. Measured MP concentration at each site as a function of distance from the upstream point at 10 cm depth.
Microplastics 04 00065 g004
Figure 5. MP concentration at each site as a function of distance from the upstream point based on measurements.
Microplastics 04 00065 g005
Figure 6. MP concentration at each site between sampling periods based on measurements.
Microplastics 04 00065 g006
Figure 7. Precipitation (inches) and air temperature (Celsius) in Newark, NJ, during 2022 and 2023 years recorded by the NOAA Weather Service station.
Microplastics 04 00065 g007
Figure 8. Measured MP concentration (p/kg) as a function of pH.
Microplastics 04 00065 g008
Figure 9. PCA of MP Concentration and pH | Temperature.
Microplastics 04 00065 g009
Figure 10. Measured MP concentration (p/kg) as a function of temperature (°C).
Microplastics 04 00065 g010
Disclaimer/Publisher’s Note: The statements, opinions and data contained in all publications are solely those of the individual author(s) and contributor(s) and not of MDPI and/or the editor(s). MDPI and/or the editor(s) disclaim responsibility for any injury to people or property resulting from any ideas, methods, instructions or products referred to in the content.