Article

Microplastics Contamination on the Surfaces of Fruits and Vegetables: Abundance, Characteristics, and Exposure Assessment

1
Department of Civil Engineering, American University of Sharjah, Sharjah P.O. Box 26666, United Arab Emirates
2
Department of Civil Engineering, Center for Energy, Water, and Sustainable Environment, American University of Sharjah, Sharjah P.O. Box 26666, United Arab Emirates
3
Department of Civil, Environmental and Architectural Engineering, University of Kansas, Lawrence, KS 66045, USA
*
Author to whom correspondence should be addressed.
Microplastics 2025, 4(3), 61; https://doi.org/10.3390/microplastics4030061
Submission received: 29 May 2025 / Revised: 15 August 2025 / Accepted: 3 September 2025 / Published: 8 September 2025

Abstract

There is limited research that addresses microplastics (MPs) contamination on the surfaces of fruits and vegetables. This study quantifies and characterizes MPs on the surface of tomatoes, apples, grapes, and cucumbers purchased from three markets (A, C, L). MPs were examined by stereomicroscopy, hot needle tests, and Scanning Electron Microscopy with Energy Dispersion Detector (SEM-EDX), and the results were reported by abundance, shape, color, and composition. Grapes in market A had the highest surface MPs concentration with a maximum of 0.891 particles/mm2, while tomatoes in the same market had the lowest, at 0.030 particles/mm2. The majority of MPs (> 85%) were transparent. Tomato, grape, and cucumber surfaces in all markets predominantly contained fragments, while apple surfaces primarily contained fibers. SEM-EDX analysis revealed MPs were primarily composed of carbon and oxygen and provided insights into the surface structures, elemental compositions, and sizes. Exposure assessment revealed the highest estimated daily intake (EDI) occurred in grapes from market A, at 9.24 × 10⁻⁵ MPs/kg/day for adults and 4.04 × 10⁻⁴ MPs/kg/day for children. Although the values appear low, no regulatory limits exist. Surface contamination remains an overlooked exposure route, emphasizing the need for food safety policies addressing MPs contamination and their effect on human health and the environment.

1. Introduction

In 2021, global plastic production reached 390.7 million tons, with forecasts that by 2050 it could escalate to 800 million tons [1]. A range of attractive features, such as affordability, resistance to corrosiveness, low density, cost-efficient production processes, reduced thermal and electrical conductivity, as well as increased tensile strength, allow plastics to be used with flexibility and durability [2,3]. Due to these characteristics, plastics are resistant to degradation and extremely persistent in the environment. Four mechanisms of degradation—photodegradation, thermo-oxidative degradation, hydrolysis, and biodegradation by microbes—may degrade plastics in the environment into smaller particles called microplastics (MPs) [4]. MPs are plastics particles smaller than 5 mm, and they are organic emerging pollutants that warrant a deeper understanding of their production, transportation to other objects, and removal so that informed decisions can be made for enhanced regulation [5]. MPs are typically categorized into primary and secondary MPs. Primary MPs are tiny particles intentionally manufactured to be microscopic in size, while particles resulting from the wear, deterioration, and breakdown of plastic materials are labeled as secondary MPs [6]. The effects of MP pollution on soil and aquatic environments are well documented [7,8,9]. In recent times, however, more attention has been diverted towards the possible consequences of MPs ingestion, inhalation, and dermal exposure on living organisms. A research investigation provided a conservative calculation suggesting that the average individual ingests and breathes around 94,000 MPs each year [10]. As a result, MPs have been detected in several parts of the human body. Studies found MPs in the human blood [11], placenta [12], and breast milk [13], indicating potential exposure pathways during pregnancy and even after delivery. These results suggest that humans are exposed to MPs not only through skin contact and inhalation, but also through consumption of tainted food and beverages. Therefore, there is a need to look into common dietary exposure sources, especially fresh produce that is frequently consumed. It has increased due to MPs’ capacity to enter and remain in internal organs, where they may cause inflammation and oxidative stress or carry toxic co-contaminants. It has been established that exposure to MPs can result in adverse health impacts in smaller organisms, not only from the MPs themselves, but more so from the additives they may be manufactured with or the toxicants they may serve as a vector for [14,15]. However, research gaps regarding human uptake of MPs has rendered assessments of impacts on humans undetermined. Thus, quantifying the degree of exposure to MPs from different routes is the first step to assessing the chronic impacts of plastic use.
One of the MP exposure pathways is the consumption of foods and beverages. Among beverages, studies have particularly focused on drinking water [16,17] and bottled water [18,19], as they are consumed daily and therefore are a constant source of exposure. With regard to food, fish and shellfish have been the focus of over 400 studies related to MPs [20], as the trophic transfer phenomenon can bring about MPs buildup along the food chain. Other studies have also looked into salts [21,22], sugar [23], honey [23], oil [24], and processed foods [25,26,27]. Studies involving salts reported MPs contamination in many salt types, such as commercially sold food-grade sea salt; rock salt; unprocessed, unpackaged sea salt; and even laboratory-grade sodium chloride, with up to 806 items/kg, 64 items/kg, 3345.7 ± 311.4 items/kg, and 253 items/kg, respectively. Depending on the amount of salt consumed, the brand, and region, humans can consume anywhere from 37 to 180 MPs annually [21,22,28] In honey and sugar, MPs fiber counts averaged 166 ± 147/kg of honey and 217 ± 123/kg of sugar [23]. MPs counts in processed food like rice reached a maximum of 322 µg/g with a potential plastic consumption of 13.3 mg per 100 g of rice [26].
While most of the work to date has focused on MPs found within food or beverages, surface contamination has received comparatively less attention. One of the potential routes of surface contamination of MPs is plastic packaging, as nearly 44% of plastic production is used for packaging [29]. Plastic packaging encompasses items such as bottles, foils, bags, cups, and take-out containers. According to [30], the intake of MPs by individuals through take-out food is estimated to be approximately 2977 MPs per person annually. Another study found that a normal person in Southeast Asia usually consumes around 195,000 MPs annually from containers used for takeaway or dine-in meals and beverages [31]. In their study, ref. [32] found varying levels of MPs contamination in meat due to its packaging. Moreover, ref. [33] examined the release of MPs from cups when hot water was poured into 100 mL plastic cups and left to sit for 15 min. The research demonstrated that when these cups come into contact with hot water or beverages, the plastic begins to degrade, leading to the release of MPs. Finally, ref. [34] examined the release of MPs from infant feeding bottles and, startlingly, found that these bottles can release approximately 16,200,000 polypropylene (PP) MPs per liter of prepared formula milk.
Other sources of MPs on the produce’s surface could be from atmospheric deposition during food production, storage, and food preparation areas as well as particles shedding from the inner surfaces of containers due to mild mechanical forces, their loose composition, and rough surfaces. A study found that human exposure to MPs is estimated to be up to 79.4 million from cutting on chopping boards [35]. There are various other pathways that could contribute to MPs contamination of food. In agricultural environments, fragmentation from plastic mulch films, which are used to conserve soil moisture and suppress weeds, causes the release of MPs directly into the soil and potentially onto the produce surface [36]. Another recognized source is contaminated irrigation water. For instance, studies have detected MPs in groundwater and other irrigation channels at varying concentrations from as low as 33 to as high as 2406 MPs/kg [37,38], suggesting the possibility of MPs transfer to crops during watering. Further contamination may occur through deterioration of plastic due to high water temperature, sterilization, and repeated use; airborne particles containing synthetic fibers and fragments from clothes; degradation of fishing nets; or merely dust. A recent study quantified MPs deposition in indoor dust, revealing fiber deposition rates ranging from 22 to 6169 fibers/m2/day, which could potentially result in MPs settling on the surface of any nearby produce [39].
A significant and often overlooked exposure route is the surface contamination that may occur through the various routes discussed above. Rather, recent studies have primarily investigated MPs inside fruits and vegetables. One study found a maximum of 44 particles per gram [40], and another study found a maximum of 124,900 particles per gram [41]. This difference might be attributed to different geographical locations, analysis methods, produce types, and a lack of standardized methods. The World Health Organization (WHO) emphasizes that to maintain a favorable health status, it is recommended to consume a minimum of 400 g of fruits and vegetables daily [42]. Given this context, the vigilant monitoring of food quality is imperative. Considering the prevalent presence of MPs in the environment and in food, the potential health effects and the absence of specific national and international regulations or standards for controlling plastic contamination in food, the assessment of MPs gains particular significance. Therefore, this study aims to address a gap in the current literature by specifically evaluating MPs contamination on the surfaces of fresh fruits and vegetables. The specific objectives of this research are to examine the abundance of MPs on four commonly consumed fruits and vegetables (tomatoes, apples, grapes, and cucumbers) sourced from different markets; characterize the MPs in terms of their color, morphology, and composition; and perform exposure assessment by calculating the estimated daily intake (EDI) and estimated annual intake (EAI) based on per capita consumption of MPs. This study contributes to the broader dialogue on food contamination, supporting the United Nations (UN) 17 Sustainable Development Goals (SDGs) related to good health, responsible consumption, and environmental protection [43].

2. Materials and Methods

2.1. Sample Collection

The study focuses on the most commonly consumed fruits and vegetables (produce) that therefore may be a source of chronic exposure to MPs, i.e., apples, grapes, tomatoes, and cucumbers [44]. Each selected produce type was collected in triplicate (n = 3) from three common marketplaces, named in this paper as C, L, and A, for a total of 36 samples. The original packaging of the samples purchased was not retained due to logistical and market constraints. The materials used in the produce packaging were identified as polyethylene terephthalate (PET), based on the stamp on the packaging, as well as polyethylene (PE) and polystyrene (PS), which are commonly used as food packaging for the produce in the authors’ country. Future work can expand on this by including identification for both packaging and MPs to confirm source correlations more rigorously.
Apples and grapes procured were imported from New Zealand and Egypt, respectively, while tomatoes and cucumbers were locally produced. For each type of produce, the samples were chosen such that the packaging material was identical. As mentioned before, age of packaging material, temperature, and stress/friction form the most important factors influencing the release of MPs from packaging before and after purchasing [45]. However, the age, temperature, or stress that packaging has gone through was not known prior to purchase. Temperature and stress were regulated post purchase to keep conditions consistent throughout the experimental duration. The sampling was performed on the day of the purchase.

2.2. Extraction and Pretreatment of the Samples

For the extraction, pretreatment, and all subsequent analytical steps, the samples of each produce type from all three markets, including the triplicates, were grouped together and treated as one set. Each set consisted of 9 samples, resulting in a total of 4 sets.
It was ensured that packaging was removed carefully to minimize external mechanical force. Only a surgical scalpel was used to cut through packaging if needed. Each type of produce was immersed in a 200 mL volume of filtered deionized water and subjected to gentle agitation in a shaker for 3 h to facilitate the detachment of MPs adhering to the produce surfaces. Then, the produce samples were cautiously removed from the water using tongs, washed using filtered deionized water, and kept away.
Pretreatment is essential to remove any substances that could interfere with the quantification and characterization of MPs. Natural samples often contain organic matter that cannot be eliminated through filtration alone. Various digestion solutions have been used for this purpose in food analysis such as alkaline, acidic, and oxidizing solutions [46]. For this research, 45 mL of 30% hydrogen peroxide (Medichem) was added to the 200 mL water sample. The samples were heated in the temperature range of 40 °C to 50 °C for 24 h. Hydrogen peroxide was selected due to its effectiveness in removing organic matter without significantly degrading most MPs at moderate temperatures. In contrast, alkaline solutions can degrade MPs [47], and acidic digestion may melt MPs at high temperatures, resulting in low recovery [48]. Although enzymatic digestion is non-destructive, its high cost made it unsuitable for this study [49]. Given the high organic content of fruits and vegetables, an invasive yet compatible method was required; therefore, hydrogen peroxide was chosen as it is increasingly adopted in similar contexts [50]. After completing the oxidation process, the water sample was vacuum filtered using 1.2 µm Whatman cellulose nitrate filter paper and then placed in a desiccator for an additional 24 h to dry.

2.3. Quantification of MPs

One of the problems with comparing MPs studies is the inconsistency in the way the quantity is reported, with both count (items/kg) and mass (mass/kg) of particles commonly mentioned in the literature. In this study, the number of particles per area is reported. The filter paper mentioned in Section 2.2 was divided into quarters, and MPs were counted and quantified on one-quarter of the paper using a stereoscopic microscope (Kern Optics). The MPs were identified by visually examining them under a stereoscopic microscope at 40× magnification. There is no specific cut-off size for detection, but under 40× magnification, a stereomicroscope can generally show features larger than 100 μm clearly. All the assessments were carried out by the same researcher under consistent lighting conditions to reduce personal bias, and the following criteria were applied to identify MPs [51]:
  • No visible cellular or organic matter.
  • Clear and well-defined edges.
  • Uniform width (W) and thickness (T) along the entire length (L) of fibers.
  • Consistent and homogeneous color throughout.
  • Presence of slight curvature (not entirely straight) to rule out biological origins.
Furthermore, MPs typically exhibit a certain level of flexibility and do not easily break when probed. Hence, when examining suspicious particles, tweezers or a probe were used for inspection. If a particle broke upon contact, it was not classified as MP. Moreover, to be extra cautious, the “hot needle test” was used when differentiating between plastic fragments and organic substances. The needle was heated using a flame from a lighter. When exposed to a very hot needle, plastic pieces will either melt, curl, distort, or display stickiness or adhesion to the needle, while biological and non-plastic materials will not undergo such changes. It was ensured that the needle was extremely hot and positioned as close as possible to the piece under examination without obstructing the view. The hot needle test is mostly effective when MPs are spaced well apart.
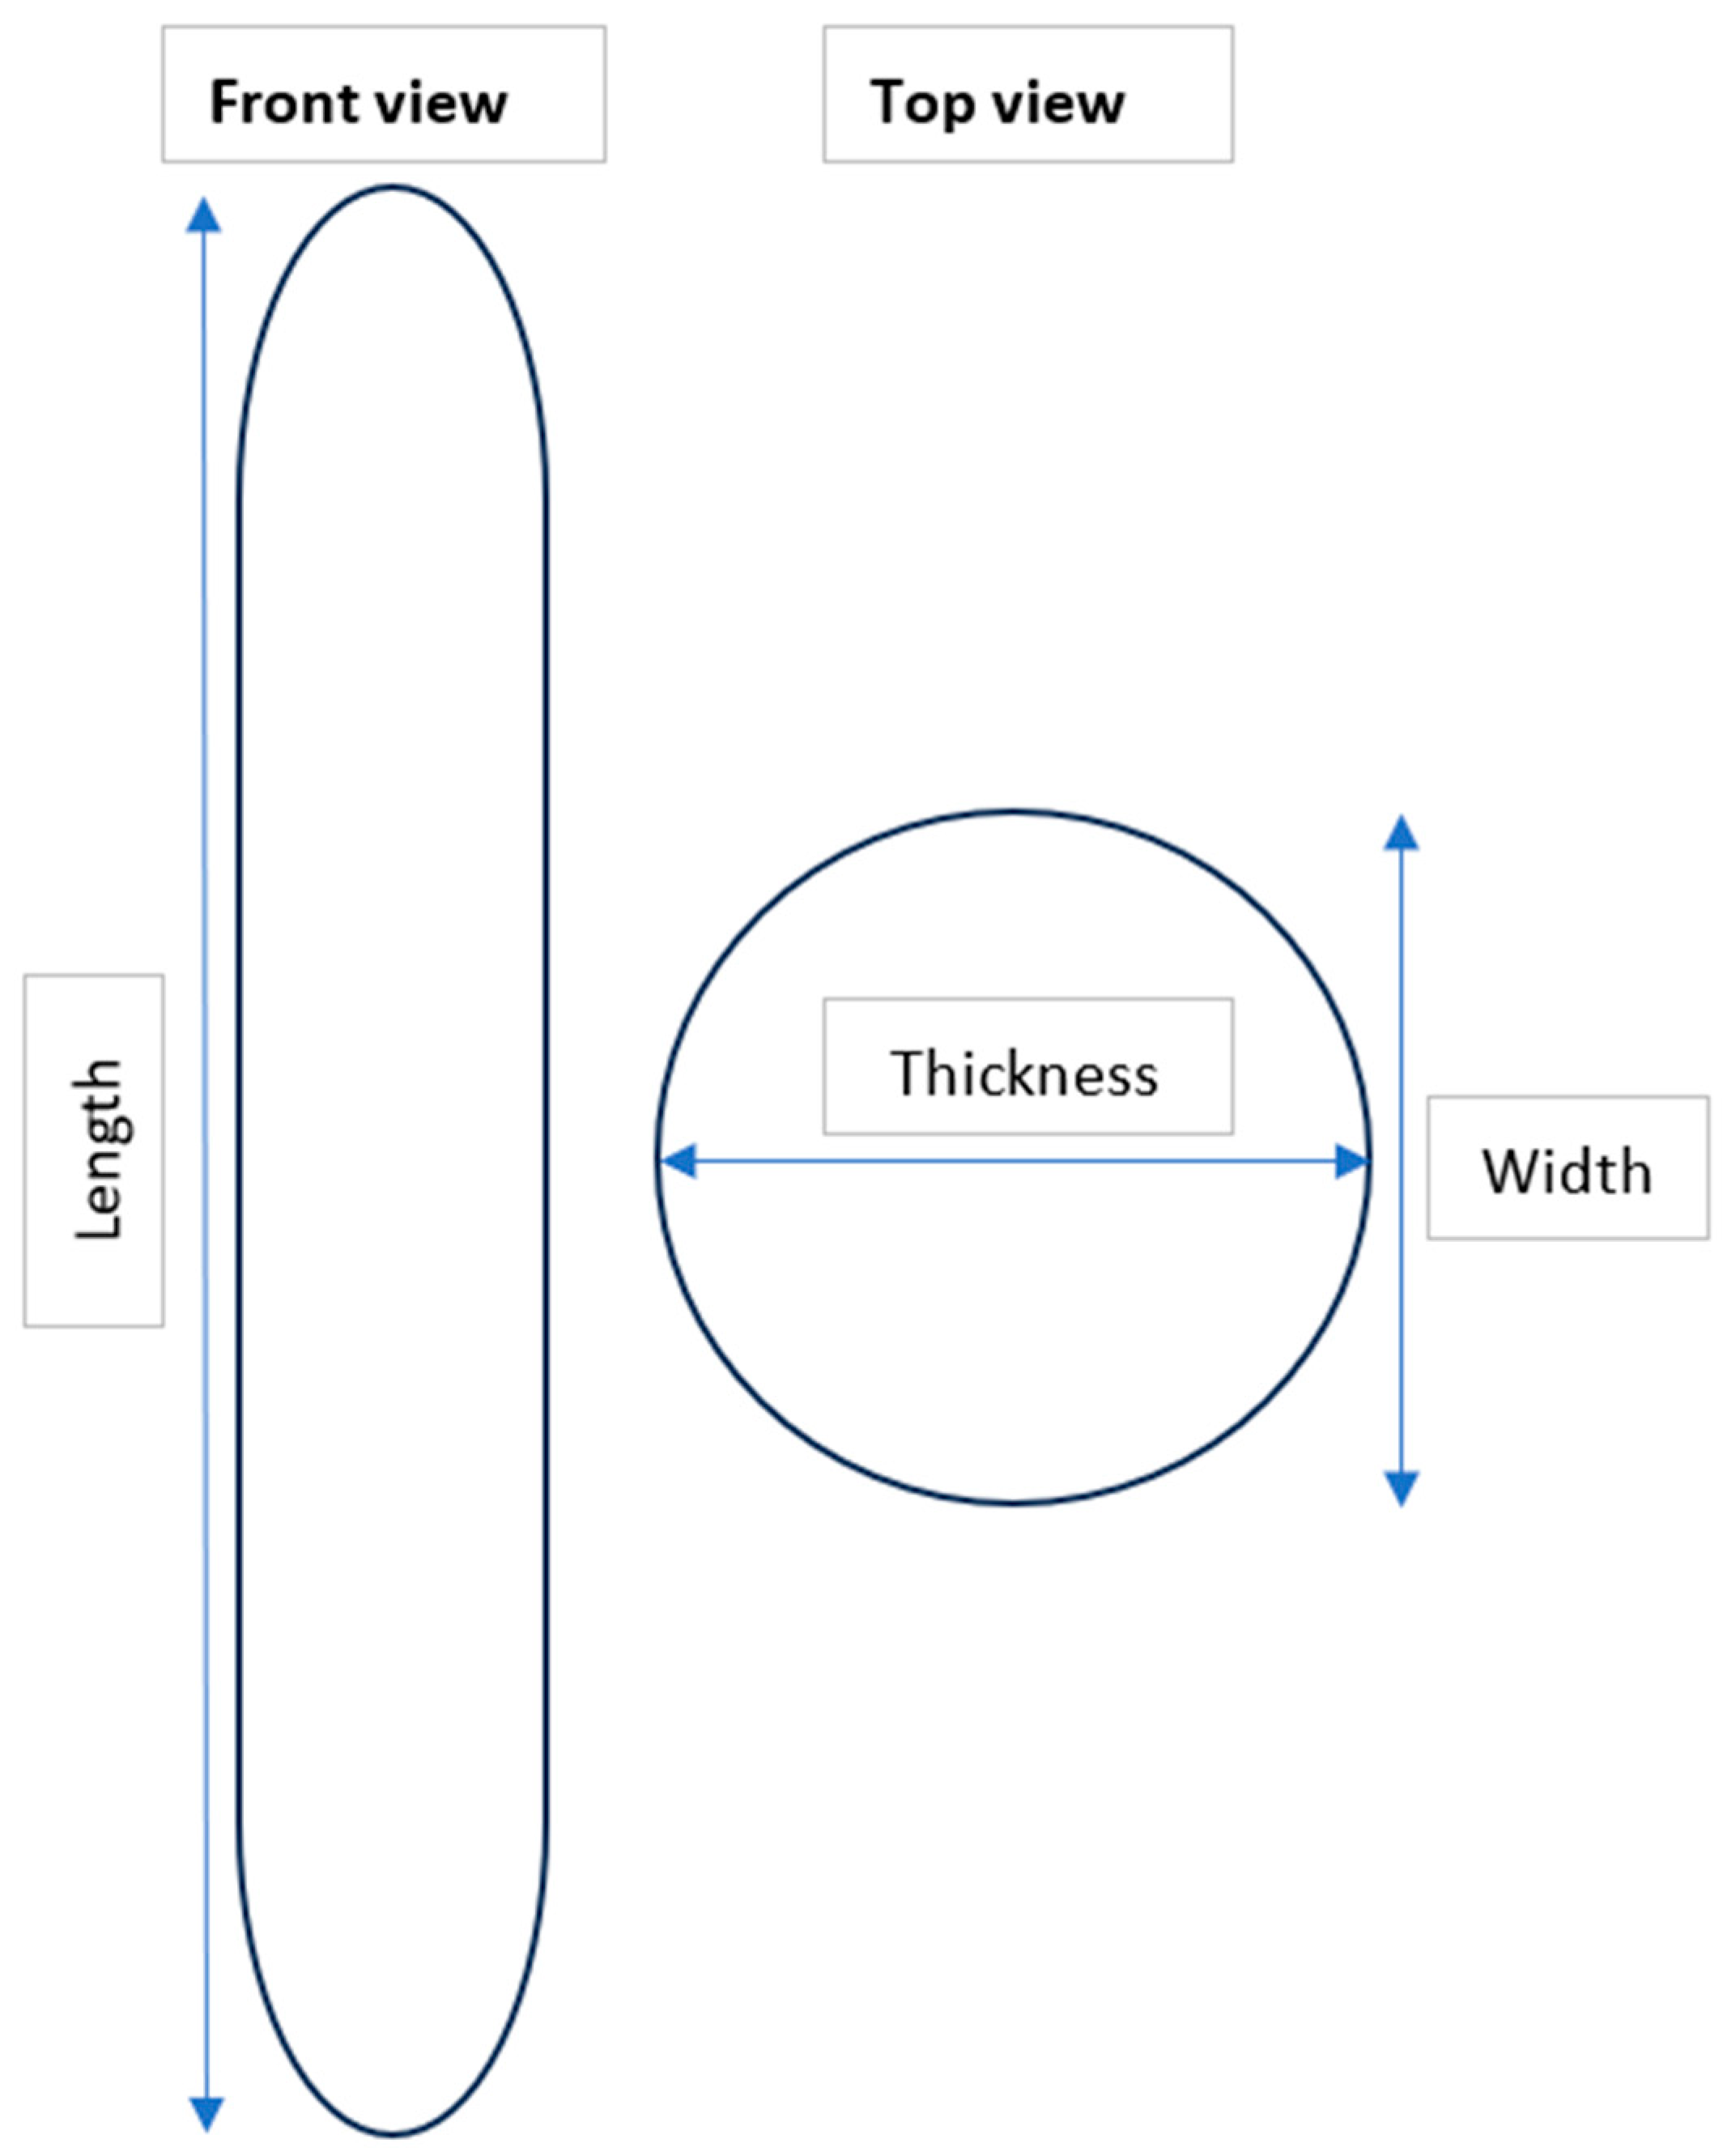
Figure 1 shows the simulated dimensions of grapes, tomatoes, and apples, while Figure 2 is specifically dedicated to cucumbers. The produce shape was considered as a sphere for surface area (S) calculation. These dimensions, including L, T, and W, were recorded for each type of produce to calculate the S.
S, defined as the total outer (skin) area of the fruit, was then used for calculating the MPs abundance as particles per square millimeter (n/mm2). The S of the produce was determined by considering it as a sphere with a matching geometric mean diameter (Dg), employing Equations (1) and (2) as a reference [52,53]:
D g = L × W × T 3 ,
S = π × D g 2
The use of MPs count per S (n/mm2) was chosen to directly reflect the level of contamination on the external surfaces of the produce, which was the focus of this study. This unit was especially relevant because MPs were extracted from rinsing the produce surfaces only, not from within the tissue. However, to enhance comparability, MPs concentrations in terms of particles per kilogram (n/kg) were calculated and used in the EDI and EAI exposure calculations (see Section 2.6).

2.4. Characterization of MPs

MPs were two different shapes: fibers and fragments. According to the WHO definition, fibers are described as “elongated and slender particles with a L-to-W ratio exceeding 3” [54]. Furthermore, the colors of the colored MPs were recorded. The colors of the MPs counted facilitated their recognition, as MPs with subdued or muted colors could be prone to being missed, potentially resulting in an underestimation of their quantities.
Certain MPs underwent analysis using Scanning Electron Microscopy (SEM) (MAGNA, TESCAN, Czech Republic) paired with an X-ray Energy Dispersive Detector (EDX) (EDS, Oxford) to gain a comprehensive understanding of their elemental composition. Due to limited access to the SEM-EDX, only a small number of particles were analyzed. Selection depended on factors such as intact particles and visible particles without distortion. It is important to note that all particles, including those not imaged by SEM-EDX, were subjected to confirmation steps such as the hot needle test and visual inspection under a stereoscopic microscope using established criteria. Therefore, while the SEM-EDX images represent a limited number of particles, they illustrate the typical characteristics observed across the wider sample set. The samples were coated with gold (Au), and the analyses were carried out with a voltage of 15 kV.

2.5. Quality Control

To account for potential air and procedural contamination, a procedural blank was conducted for each set, i.e., type of produce (n = 4). These blanks, in which DI water was processed in the same manner as the samples, were run in parallel with each experimental run. Moreover, to detect any particles lost during the various pretreatment steps, a recovery test (n = 3) was performed using green, orange, and Rhodamine B PE spheres with diameters of 425–500 μm, 250–300 μm, and 45–53 μm, respectively (Cospheric Inc., Santa Barbara, CA, USA) suspended in water [55].
Additional quality control measures included filtering the DI water through a 0.45 μm pore size filter (GF/F Whatman, 47 mm diameter, nitrocellulose), regularly cleaning the workstation with a mixture of DI water and ethanol (70%), rinsing all glassware with DI water followed by ethanol (70%) before use, covering all samples with aluminum (Al) foil and placing them within glass petri dishes when not in use, preparing all reagents with filtered DI water, and wearing a cotton lab coat and nitrile-free gloves.

2.6. Exposure Assessment

EDI and EAI values for each fruit and vegetable were calculated using Equations (3) and (4) [40].
E D I = C 1 × I R B W
E A I = C 2 × A I R
where
C1: Mean number of MPs per kilogram detected on the sample (particles kg−1).
IR: The Daily Ingestion Rate per capita of apples (0.059 kg day−1), grapes (0.028 kg day−1), tomatoes (0.068 kg day−1), and cucumbers (0.016 kg day−1) in the United Arab Emirates [56].
BW: Body weight (70 kg for adults and 16 kg for children) [57].
C2: Average number of MPs detected per gram in fruit and vegetable tissues (particles g−1)
AIR: Annual Ingestion Rate per capita for apples (21,700 g year−1), grapes (6200 g year−1), tomatoes (24,800 g year−1), and cucumbers (5700 g year−1) in the United Arab Emirates [56].
AIR per capita was calculated by dividing the amount of food item consumed in the United Arab Emirates by the population (population of the United Arab Emirates in 2015 9,282,410) [58].

3. Results and Discussion

3.1. Enumeration of MPs

A quarter of each filter paper was analyzed to ascertain the MPs concentration across the entire filter paper. Counts from the blank samples were subtracted from the final sample counts, with any resulting negative values being recorded as zero; refer to Table A1 in the Appendix A for the blank results. All triplicates underwent identical procedures, and an average was computed. Table 1 shows the average count of MPs along with the standard deviation (SD) for each produce type and marketplace, while Table A1 in the appendix shows the MPs count for each produce type and marketplace. Results show the presence of MPs in all samples. The extent of MPs contamination exhibited variation across the different produce types and markets. The recorded numbers of MPs in each produce in descending order of their abundance were as follows: grapes > apples > cucumbers > tomatoes.
The highest number of MPs was found in grapes from market A, with a maximum concentration of 0.891 n/mm2 among all produce values, while the lowest number was found in tomatoes from market A, with a minimum concentration of 0.030 n/mm2 among all produce values. The variation in MPs number on fruits and vegetables can be due to various factors. Grapes and apples, which are not locally sourced, are likely to undergo longer supply chain processes, potentially increasing their exposure to multiple sources of MPs during harvesting, packaging, shipping, and retail storage. While plastic packaging might be one of the major contributors to surface contamination, it is important to acknowledge that other mechanisms such as atmospheric deposition, abrasion during transport, or cross-contamination from plastic-lined containers and surfaces may also play a role. Studies have demonstrated that environmental factors, polymer aging, friction, transportation, and handling cause plastic packaging to deteriorate over time, increasing the release of MPs into food [22,26,32,40]. For instance, a study on store-bought rice found that plastic storage bags and handling equipment from transportation were the main source of the average of 166 MPs fragment per 100 g [26]. This underscores that more exposure represents a major source of MPs contamination and is immediately relevant to the elevated MPs levels on imported fruit like grapes and apples in the present study.
Another factor is the surface (skin) roughness, which can play a crucial role in the adherence of MPs on the produce skin. Studies show that smooth surfaces have lower adhesion, while rough surfaces increase adhesion [59]. For instance, apples typically have a roughness of approximately 6 μm, which is slightly higher than that of tomatoes’ roughness, which is about 3 μm [60,61,62]. Similarly, the surface of cucumbers was described as rough, while the surface of apples was described as smooth [63]. So, the cucumbers have a rougher surface than tomatoes. Thus, these two reasons might explain why tomatoes have the lowest number of MPs count in all markets.
To compare the MPs count across the three markets (C, L, and A), a one-way ANOVA was conducted for each type of produce (apples, grapes, tomatoes, and cucumbers). The aim was to assess whether there were statistically significant differences in the mean MPs concentrations among the markets. Therefore, the null hypothesis stated that the mean MPs count is the same for all markets, while the alternative hypothesis was that at least one market has a mean MPs count that is significantly different from the others. Table 2 shows that for all cases, the p-values were greater than 0.05. This means that the differences in mean MPs counts between markets are not statistically significant; therefore, the null hypothesis is not rejected. In other words, any difference observed is likely due to random variation, not actual market effects.

3.2. Color of MPs

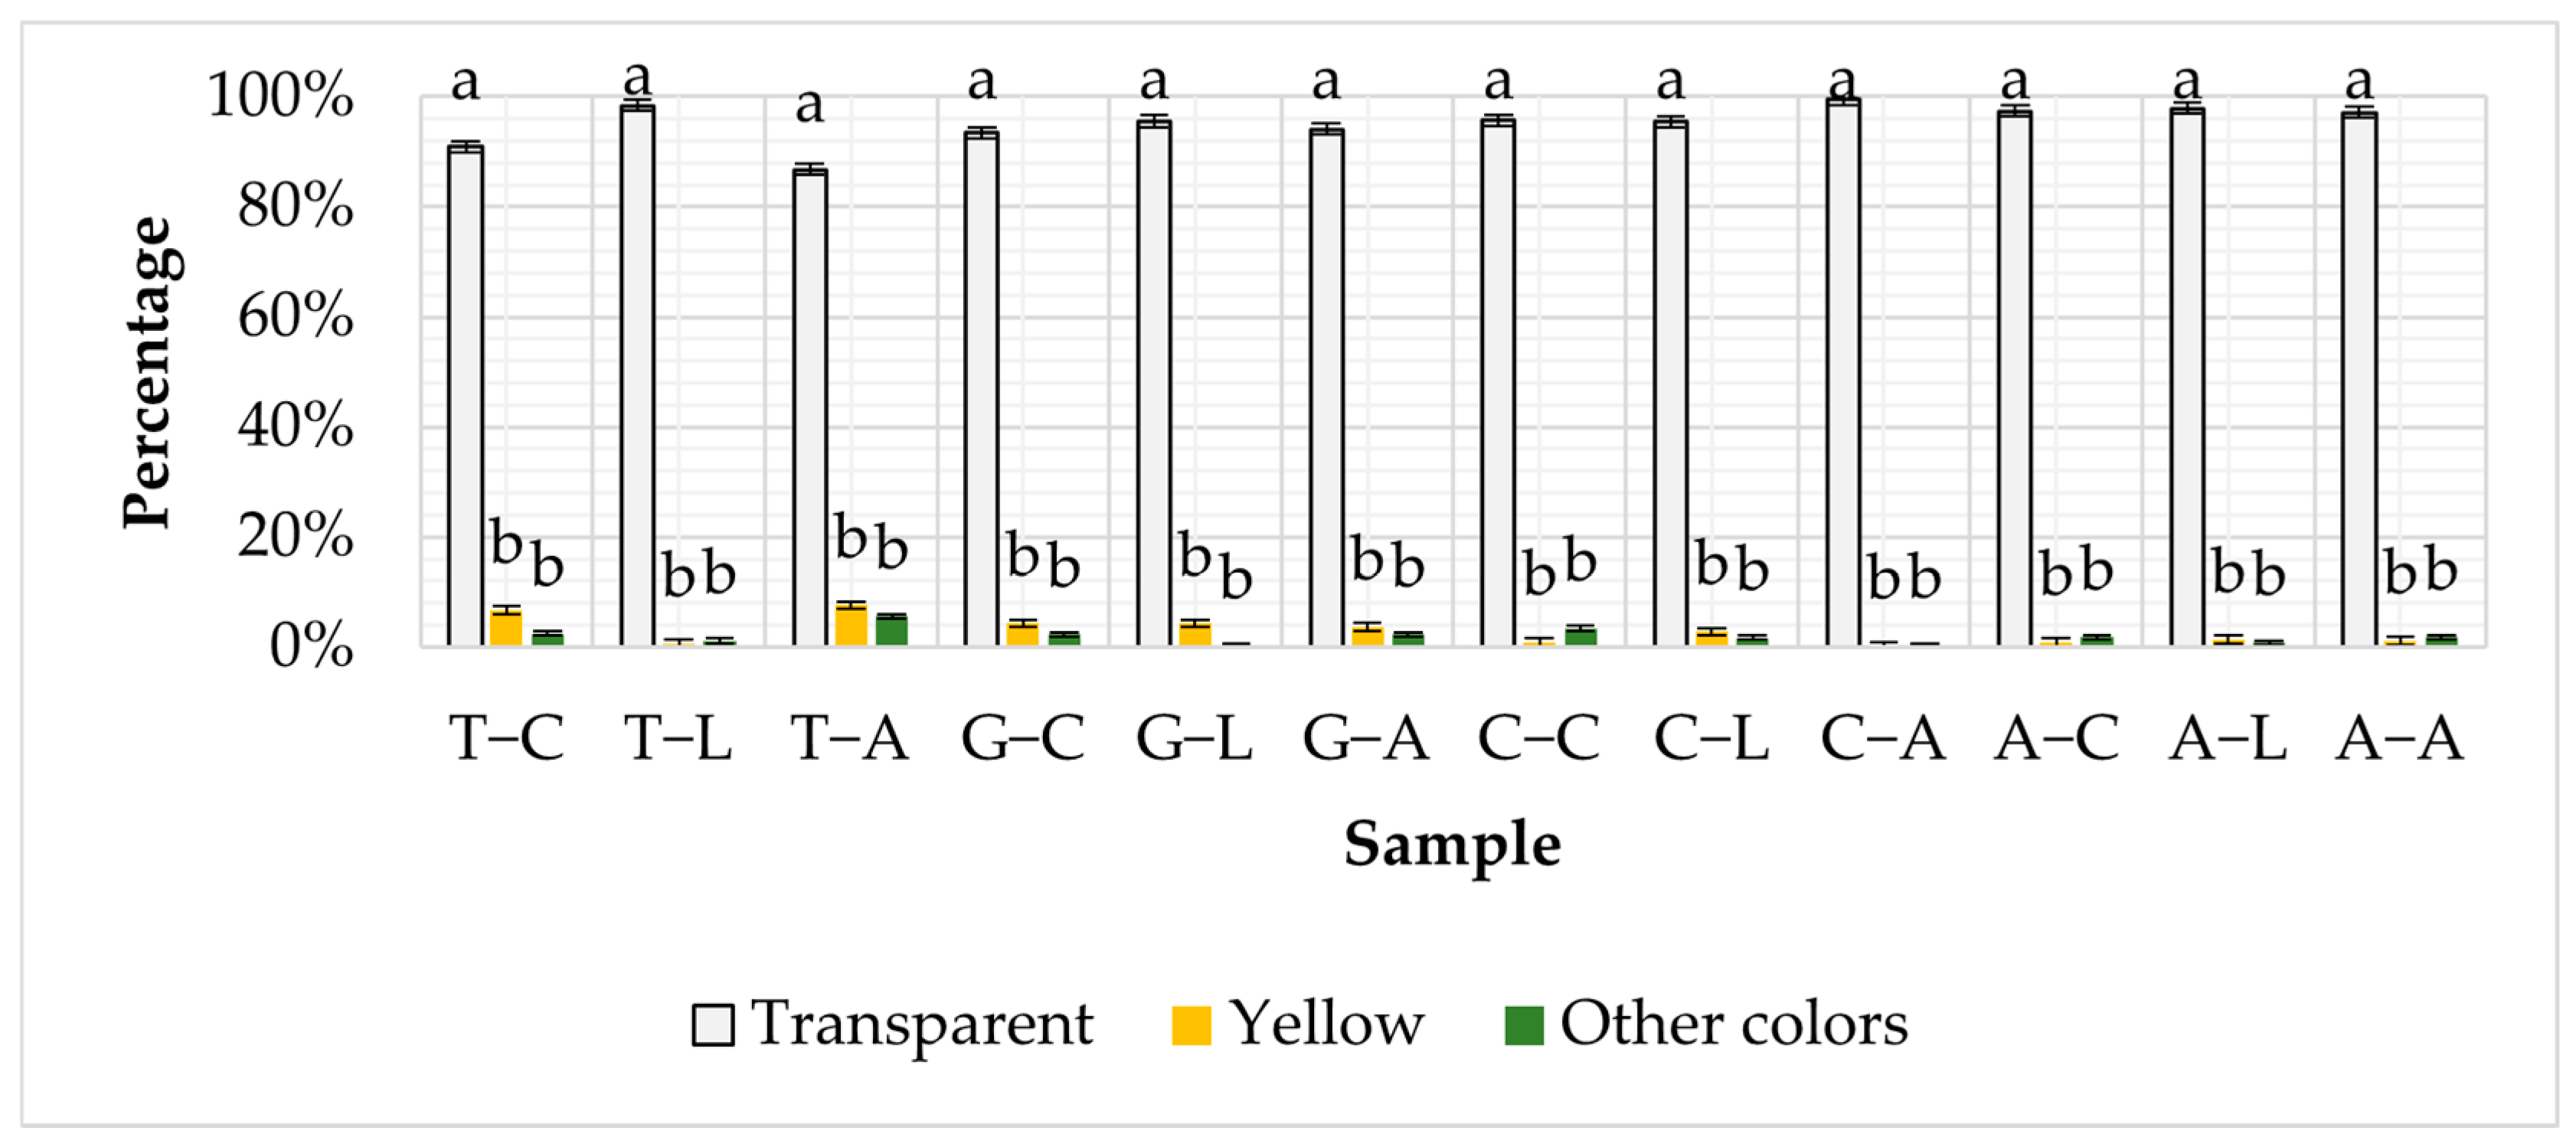
The MPs extracted were examined under a 40× microscope, and their color was documented. The coloration of these MPs serves as an indicator of the synthetic origin of this contamination [64]. Figure 3 shows the percentage of each color category for the MPs in each sample. The majority of MPs were transparent, with each sample containing over 85% transparent MPs. This might be because the produce’s packaging was transparent PET, PE, and PS packaging. Figure 4a shows transparent fibers and fragments. This is consistent with another study, where transparent MPs were also reported as the most abundant type detected from food containers [27]. The second most abundant color was yellow (Figure 3). It was seen that tomatoes had the largest percentage of yellow MPs, ranging from 0.55% in market L to 7.59% in market A, whereas apples had the lowest percentage of yellow MPs, ranging from 0.80% in market C to 1.31% in market L. The presence of yellowish MPs can be due to the discoloration of transparent MPs occurring during the oxidation process of removing organic matter. This is due to the over-oxidation of phenolic compounds that are in the polymer [65]. A paper confirmed that discoloration can occur with the use of oxidants such as hydrogen peroxide [50]. Moreover, fruits and vegetables contain phenolic compounds including phenolic acids, flavonoids, and tannins that can over-oxidize and contribute to discoloration [66,67]. These are plausible explanations because under the microscope, MPs did not appear distinctly yellow; instead, they exhibited a faded yellow hue (Figure 4b).
Furthermore, various other colors of MPs were visible under the microscope. These colors included blue, red, pink, black, gray, green, and purple; Figure 4c shows black MPs. The overall recorded numbers of MPs in each color in descending order of their abundance are as follows: black > blue > pink > purple > gray > green > red. As the percentage of each of these colors was relatively low, ranging from a minimum of 0% to a maximum of 2.4%, the percentages of these colors were summed together (Figure 3). The different colors can be from various sources, such packaging contamination through airborne MPs, contamination during the manufacturing and production process, and food preparation areas. Alternatively, there is a risk of potential contamination of the produce itself through different agricultural methods, including the use of plastic mulch or exposure to contaminated irrigation water if the produce is not washed before packaging. A study discovered that there is an average of 22,675 MPs/kilogram of soil resulting from mulching [68]. Also, a research study revealed that MPs were detected in varying concentrations within the irrigation system [69]. Thus, these MPs can adhere to the skin of the produce. It is important to note that colored MPs were not included in the quantitative counts used for estimating MPs concentration or exposure.
A two-way ANOVA was performed, which revealed that color had a statistically significant effect on MPs counts across all produce types (refer to the next paragraph). As a result, a Tukey HSD post hoc test was conducted using IBM SPSS Statistics Version 31.0.0.0 software to determine pairwise differences between color categories in each market. The results displayed in Table A2, Table A3, Table A4 and Table A5 in Appendix A show that transparent MPs were significantly more abundant than both yellow and other colored MPs. Moreover, the results revealed that yellow and other colored MPs did not differ significantly from each other. Based on these findings, letter groupings were assigned in Figure 3, where ‘a’ denotes significantly higher mean values, and ‘b’ indicates groups not significantly different from each other (p < 0.05).
For every type of produce, a two-way ANOVA was conducted to examine the impact of market (A, C, L) and MPs color (transparent, yellow, and other colors) on MPs count. Table 3 illustrates the two-way ANOVA analysis results, which revealed that color had a highly significant effect (p < 0.000001) in all produce types, confirming that transparent MPs were consistently the most dominant. However, neither the market effect nor the interaction between color and market was statistically significant (p > 0.05). According to these findings, the prevalence of transparent MPs might be caused by common transparent packaging materials rather than differences in market conditions.

3.3. Shape of MPs

The fibers and fragments were observed consistently with previous studies [6]. Figure 5a,b shows that among tomatoes, grapes, and cucumbers, fragment was the most prevalent shape in terms of the number of MPs, with all markets having fragment percentages greater than or equal to 50%. On the contrary, in the case of apples, fiber was the most prevalent shape in terms of the number of MPs, with all markets showing fiber percentages more than 55%. The presence of fibers and fragments provides evidence of secondary MPs. The literature on MPs in food has revealed discrepant findings on the most prevalent shape. Some studies found that fiber is the predominant shape in water and soft drinks [70,71], while others demonstrated that fragment is the dominant shape in other food matrices such as bottled water [15,72] and canned tuna [73]. The original source of MPs can be responsible for the various shapes they exhibit. Fragment MPs result from the degradation of items such as discarded jars, rice packs, and food packaging, whereas fibers originate from the fragmentation of monofilament materials such as single strands of plastics. In the case of the apples in this study, it is possible that they have been exposed to sources that release fibers, particularly considering they were not local. The exact source of each fiber cannot be determined with certainty. Although contamination from the transparent packaging, handling, or processing is possible, there is no sufficient evidence to quantify its contribution or confirm whether those potential sources contributed to transparent fibers, as was predominantly observed in the study. For the variable shape in apples, ANOVA indicated a significant difference (refer to next paragraph). However, there were only two shape categories (fibers and fragments). As such, a post hoc test was not required, since the ANOVA alone was sufficient to confirm the difference between the two groups. Instead, error bars representing standard error have been included in the figure to visually communicate the variation in means between the two shape categories.
For every type of produce, a two-way ANOVA was performed to determine whether the market (A, C, L), the shape of the MPs (fiber vs. fragment), or their combination significantly affected the overall MPs count. Table 4 shows the two-way ANOVA analysis results, where shape had a statistically significant effect on both apples and cucumbers (p < 0.05). The analysis showed that apples had more fiber-shaped MPs and cucumbers had more fragment-shaped MPs. On the other hand, there was no statistically significant difference in the fiber and fragment counts between tomatoes and grapes. These findings lend credence to the idea that the type of produce and the related handling and packaging circumstances might be the main factors influencing the prevalence of MPs’ shapes rather than point-of-sale market differences.

3.4. SEM-EDX Analysis

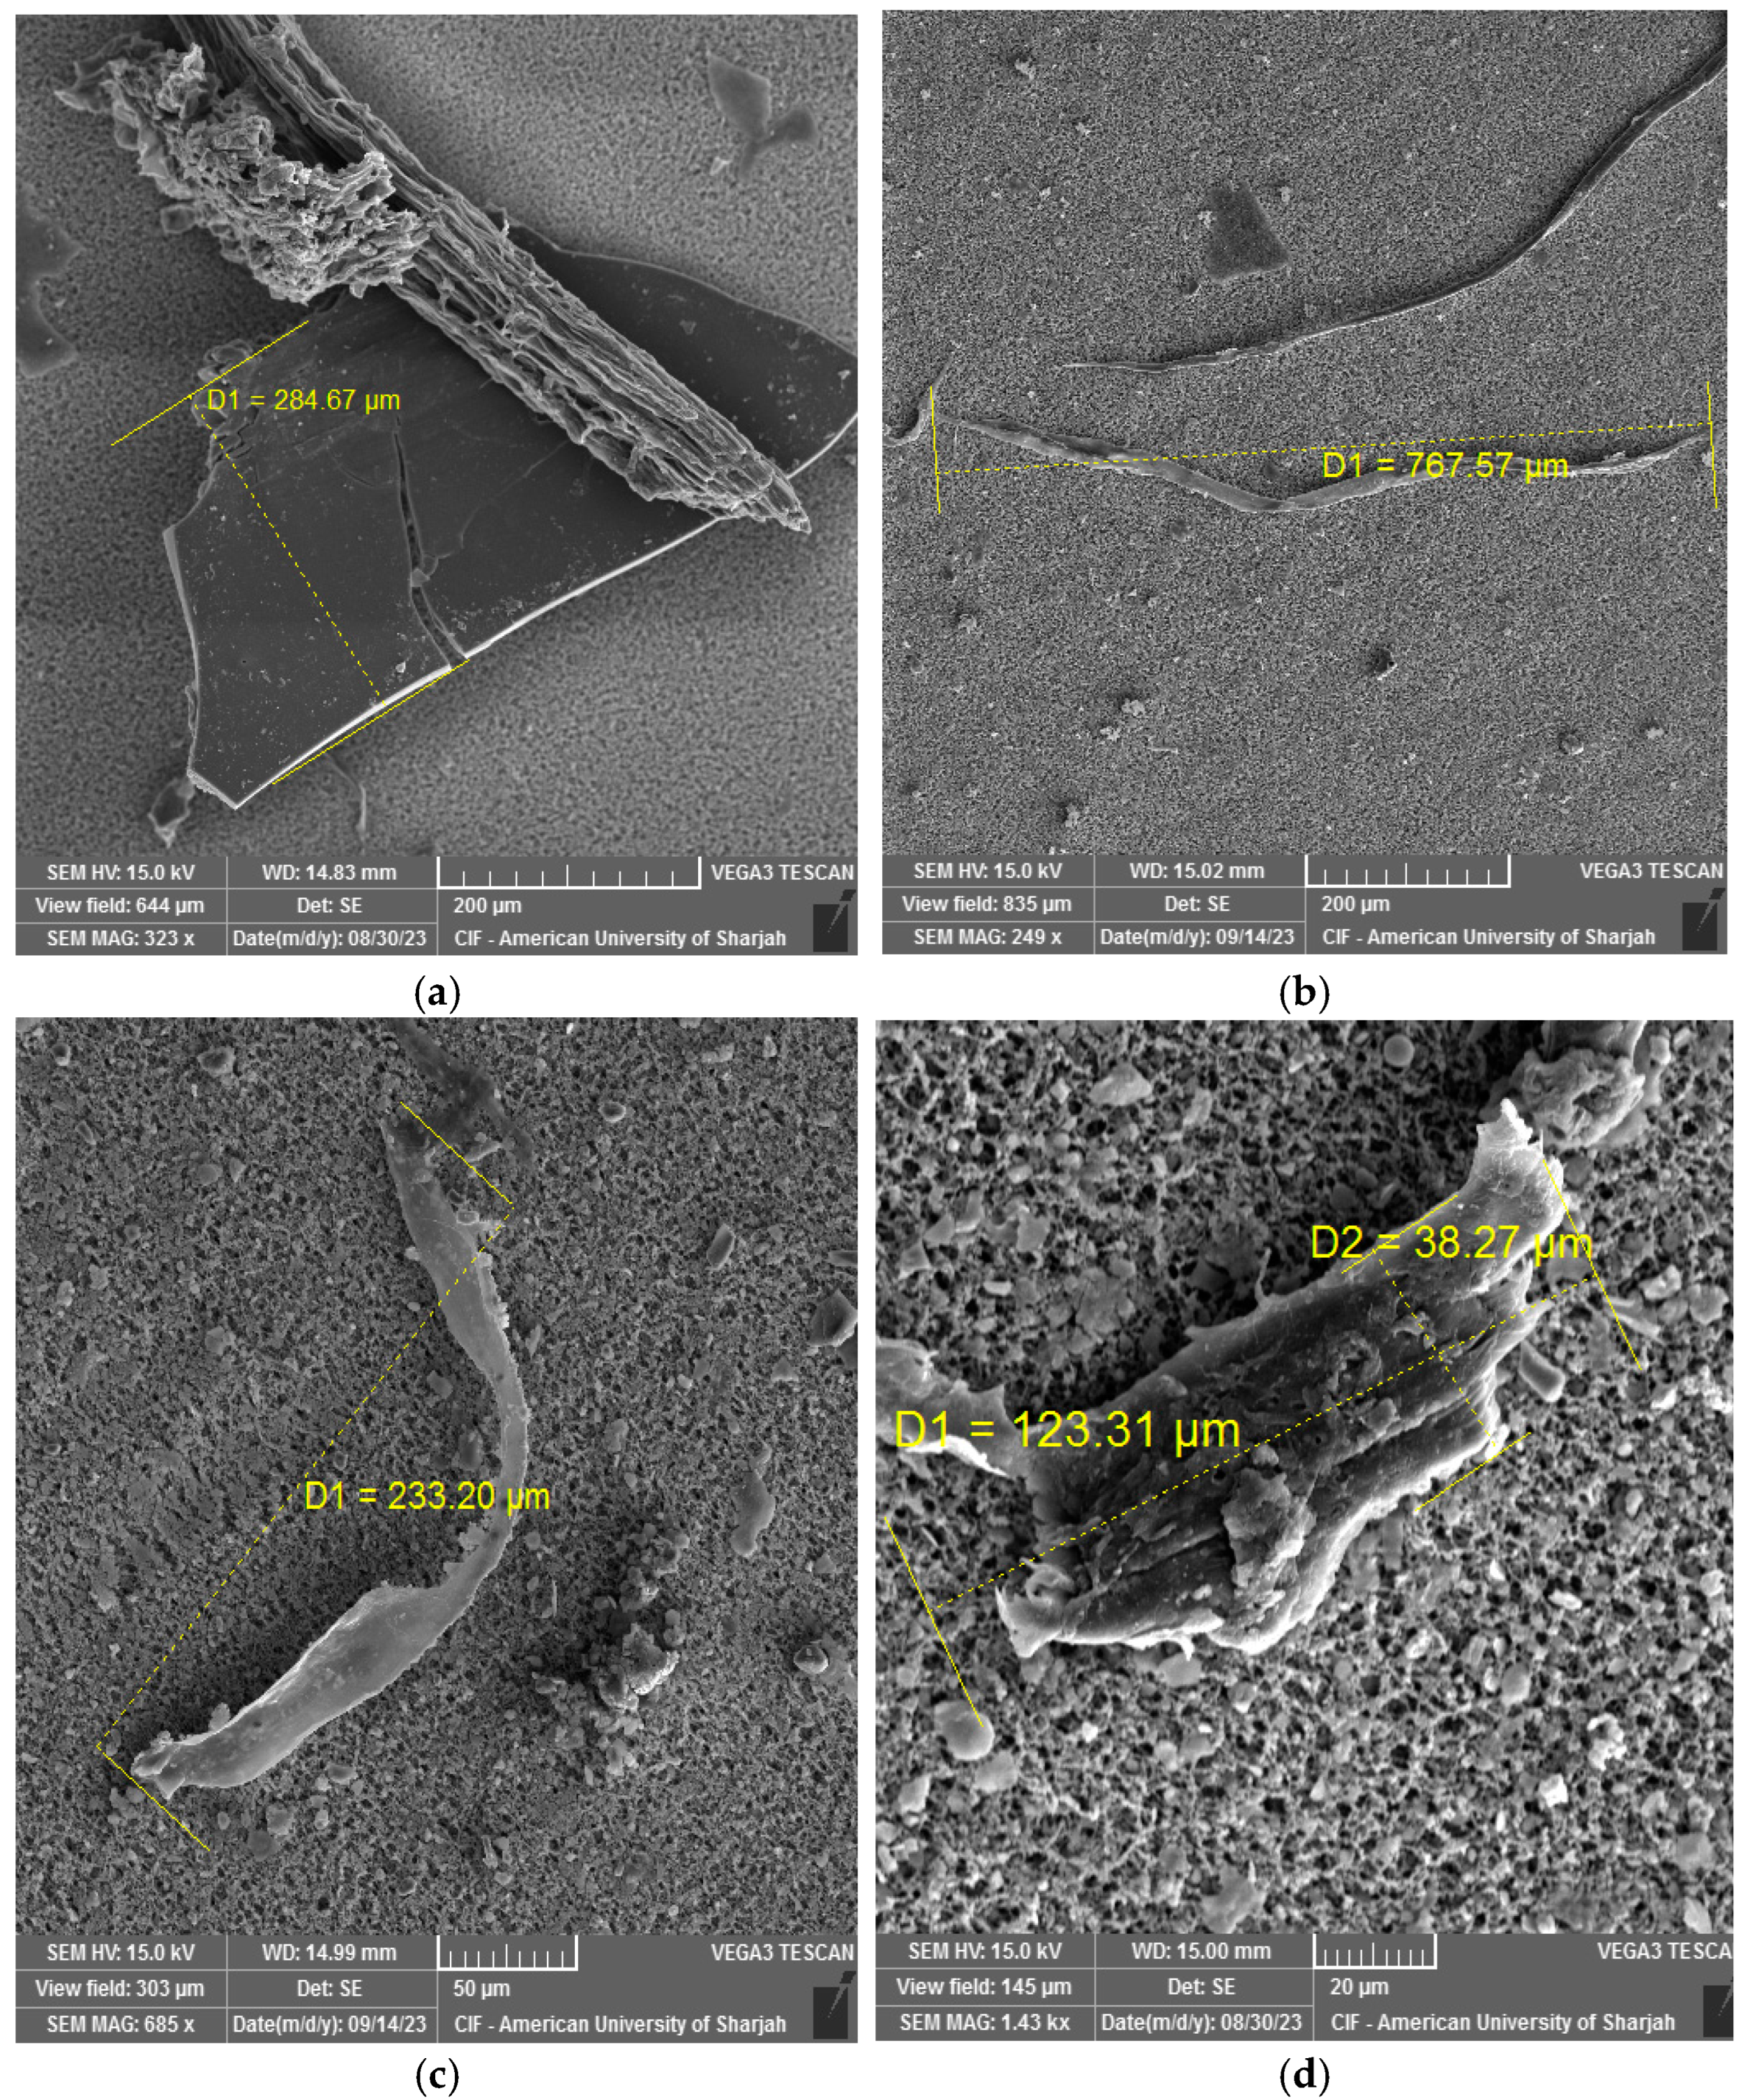
The SEM-EDX analysis results with higher magnification images revealed morphological characteristics of MPs, encompassing fibers and fragments (Figure 6). Moreover, the images showed the presence of rugged surfaces with fractures, worn edges, and scratches, contrasting with pristine MPs that possess flat and smooth surfaces. These observations suggest that aging or fragmentation processes have influenced the morphology of the MPs. Additionally, frictional forces and mechanical shearing or stress during manufacturing, transportation, and handling may have contributed to the alteration of the MPs’ morphological features.
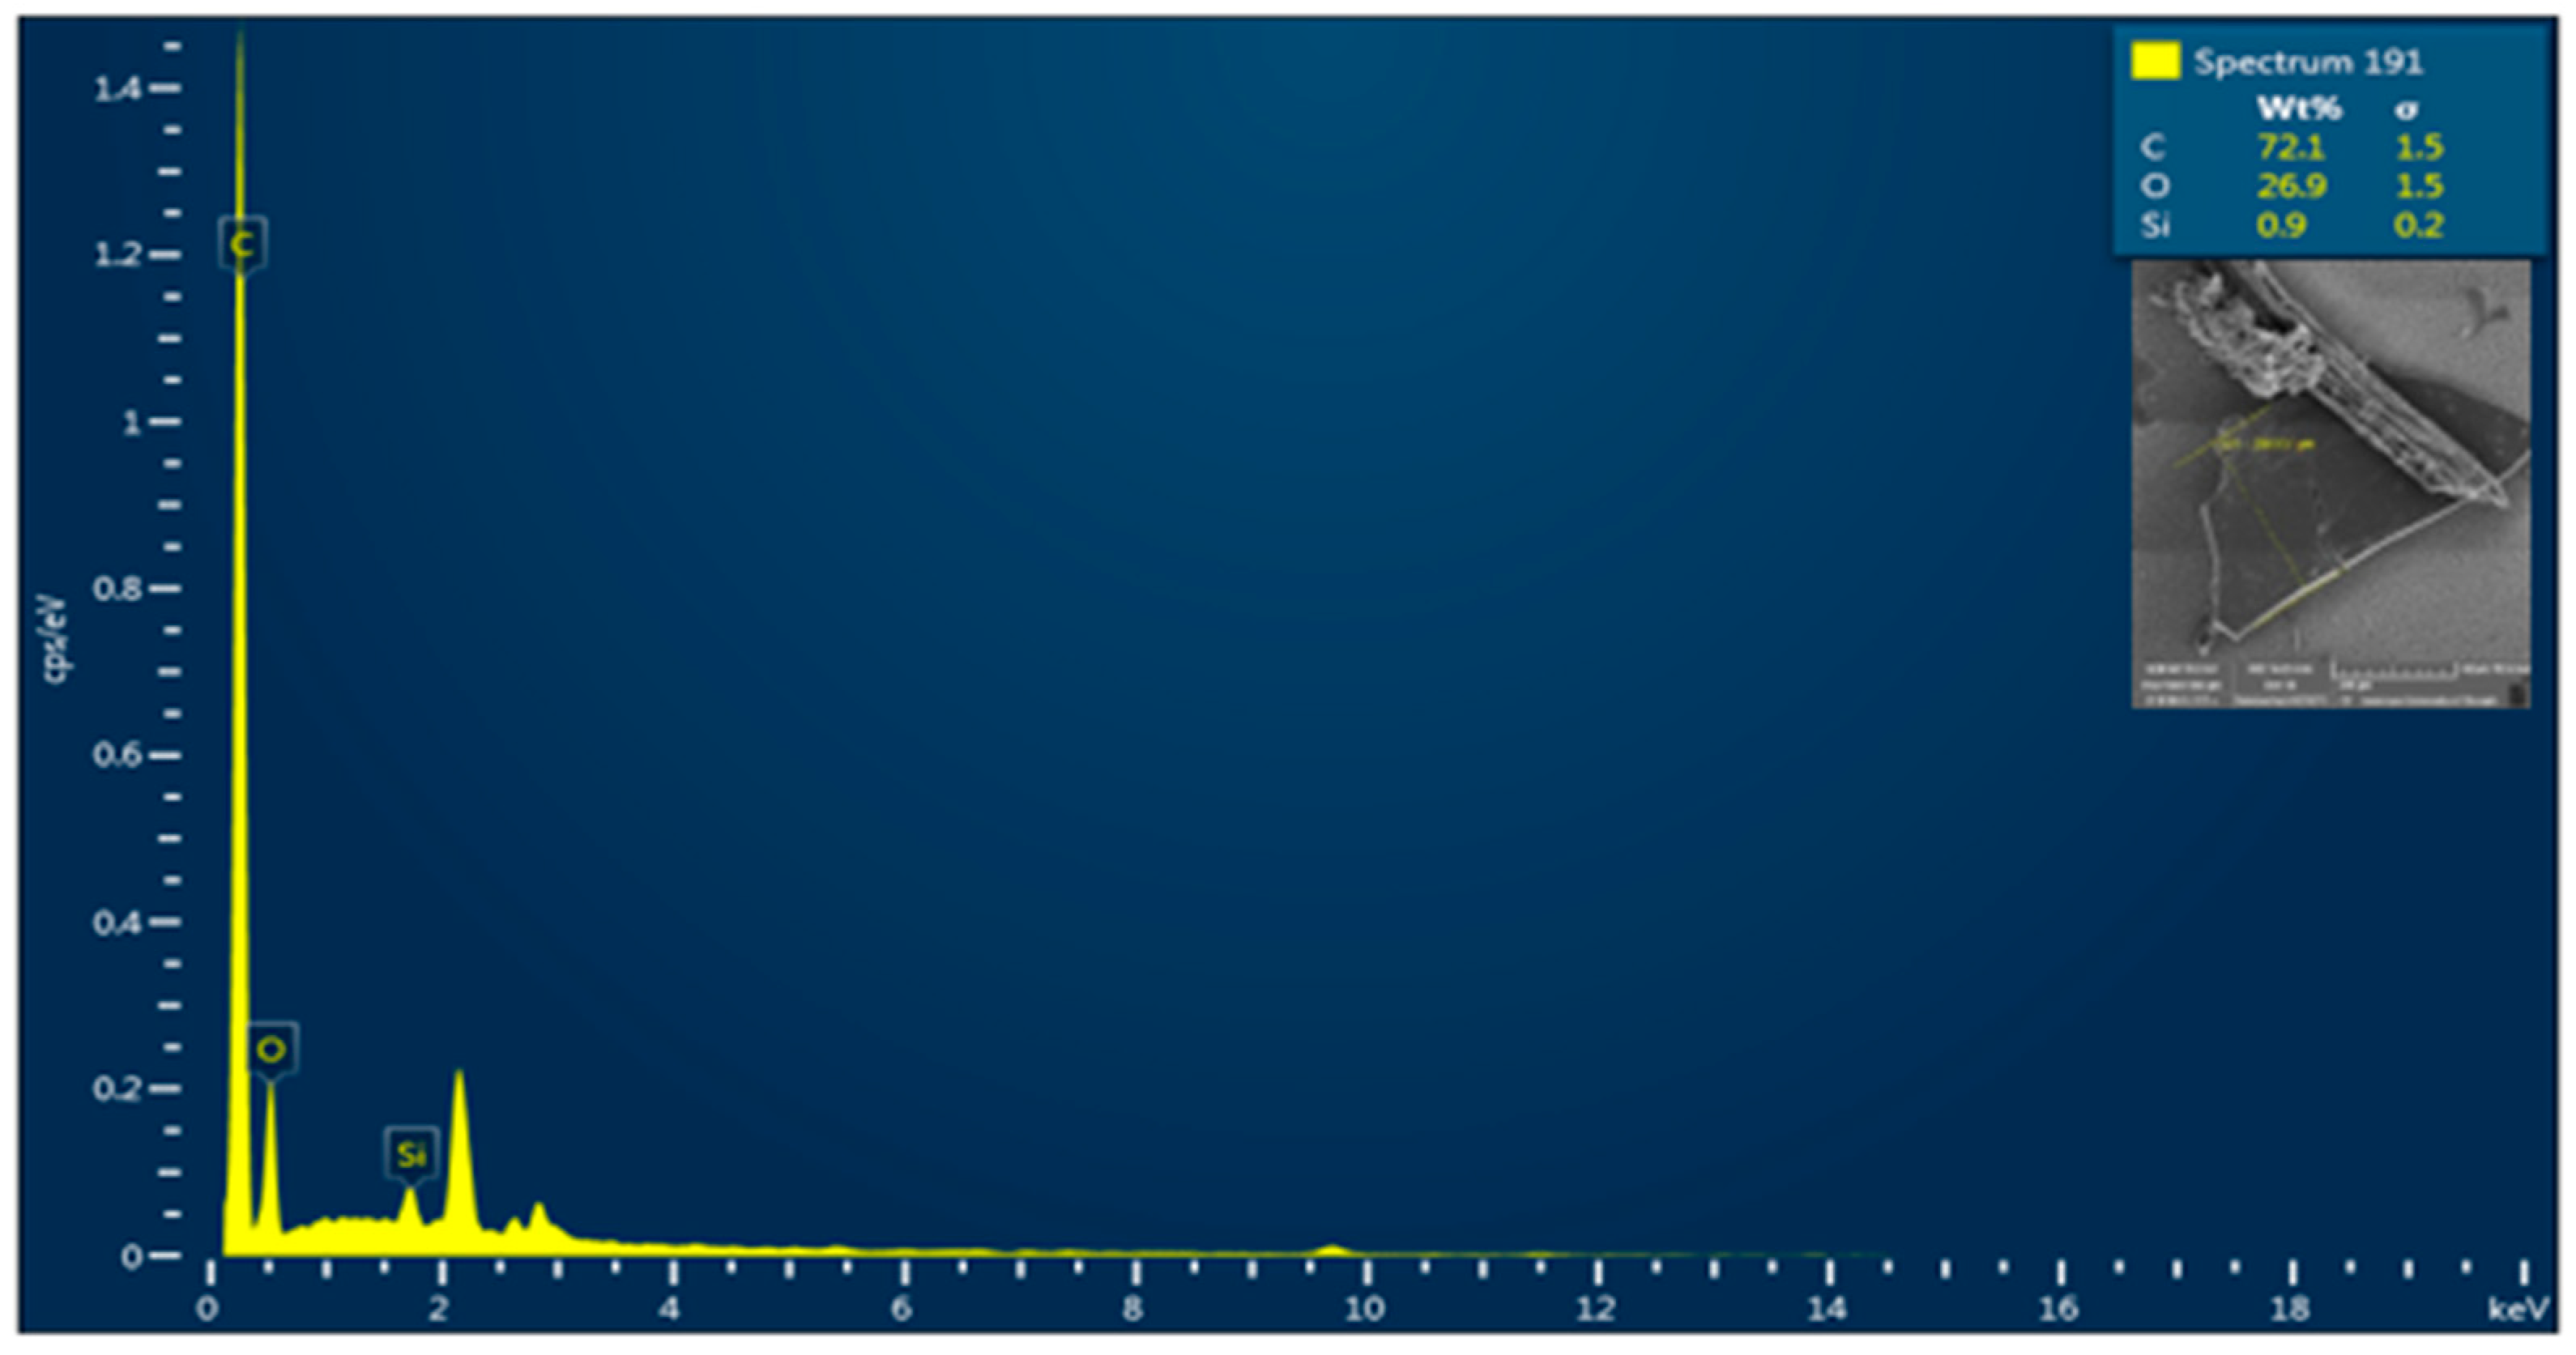
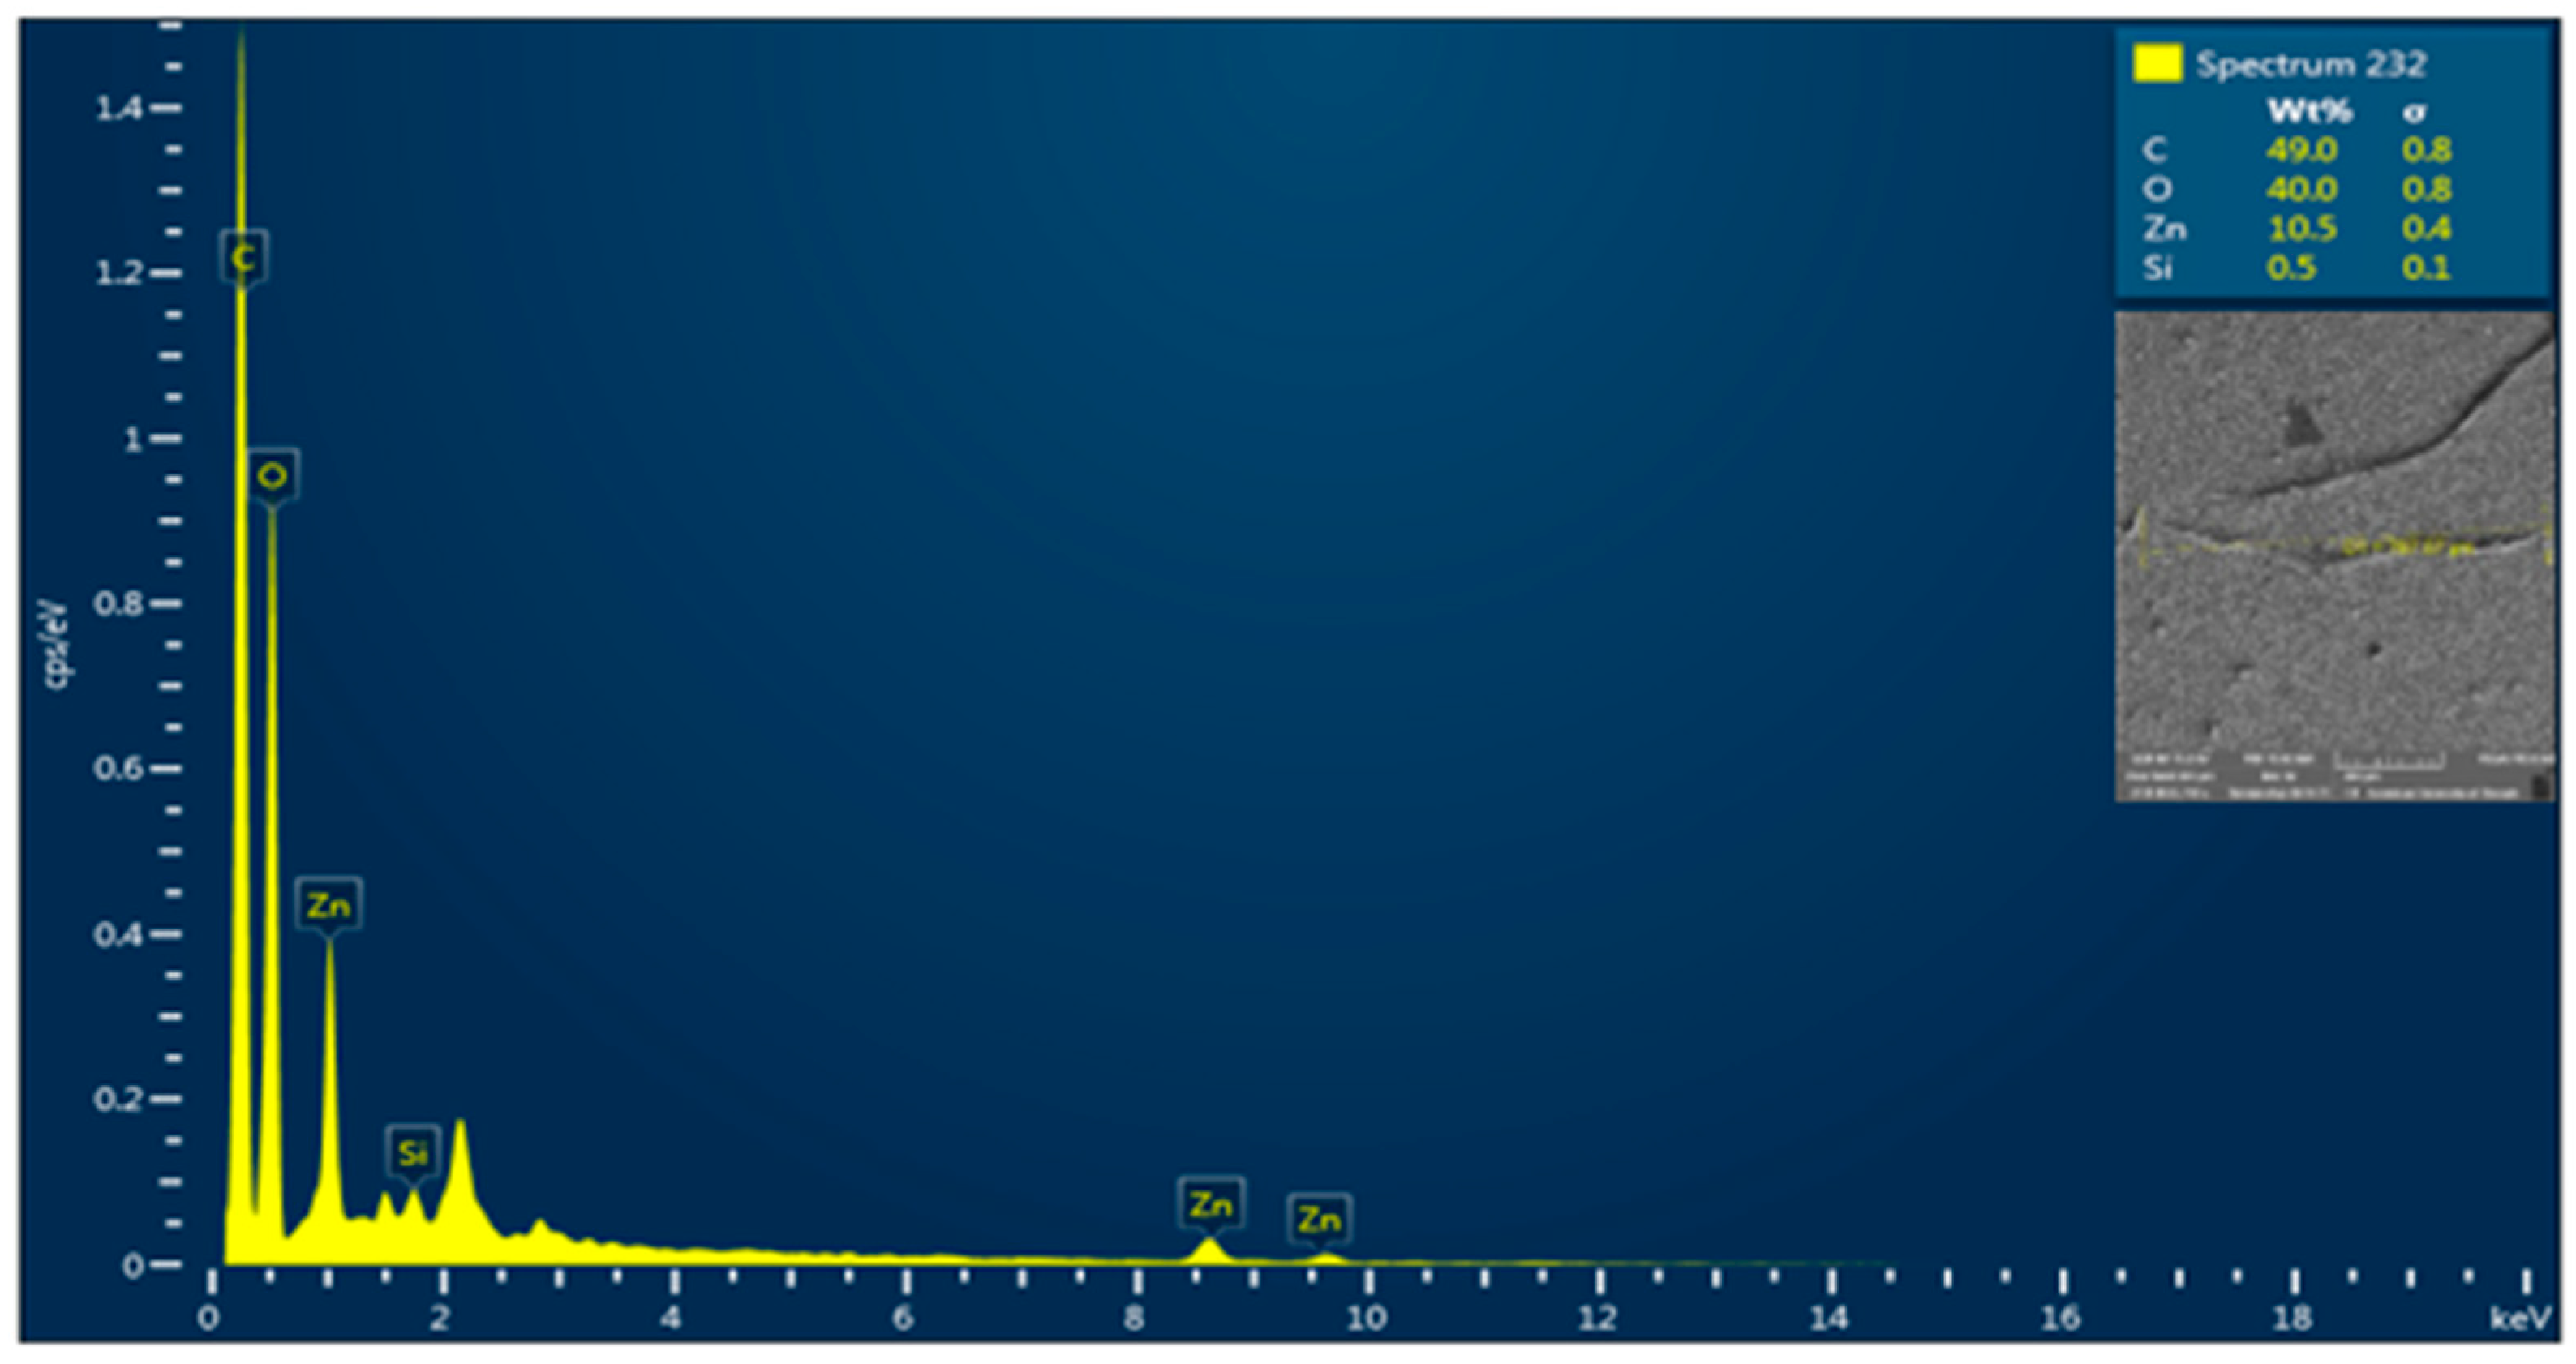
The results of the EDX are shown in Figure 7, Figure 8, Figure 9 and Figure 10. This data revealed that the MPs analyzed were predominantly composed of carbon and oxygen elements, as they are the main plastic components, with traces of silicon (Si), zinc (Zn), magnesium (Mg), iron (Fe), Al, and sodium (Na) also detected. These results align with findings in the existing literature [62,74]. The presence of metals in MPs may be attributed to the manufacturing process or absorption/adsorption from the surrounding environment. For example, elements like Si, Al, and Zn are inorganic additives commonly employed in the production of plastics [75]. Finally, the diameters of the detected MPs ranged between 100 μm and 800 μm. MPs with varying sizes suggest heterogeneity in the source or origin of these particles. They may come from various sources or have gone through different degradation processes. Moreover, the size of MPs can influence their potential impact. For instance, smaller MPs can be ingested by a range of organisms, including humans and smaller lifeforms. MPs with a diameter of less than 110 μm are able to move through the portal vein, which transports blood from the digestive organs, including the intestines and pancreas [76].

3.5. Recovery Tests

The microspheres went through the same experimental procedure in this study. The recovery tests involved spiking a 200 mL sample of filtered deionized water with a predetermined mass of fluorescent PE microspheres obtained from Cospheric Innovations in Santa Barbara, CA, USA. The samples underwent gentle agitation, oxidation with hydrogen peroxide, filtration, and quantification. This procedure was repeated three times. Table 5 shows the average triplicate recovery along with the SD. The average was 73% for the spiked MPs with a diameter size of 45–53 μm, 89% for those with a diameter size of 250–300 μm, and 98% for particles with diameter sizes of 425–500 μm. Recovery rates above 70% with standard deviations below 5% are a clear indicator of reliable method performance of the analyses conducted. A few microspheres displayed minor signs of degradation, including indications of mechanical damage and discoloration. This discoloration closely resembled the discoloration observed during the primary experiment, which was attributed to oxidation.

3.6. Exposure Assessment Results

The highest EDI was observed in grape samples from market A for both adults and children, with a value of 9.24 × 10⁻⁵ and 4.04 × 10⁻⁴ MPs/kg/day for adults and children, respectively (Table 6). The findings indicated that children ingest more, and this is expected because their average weight is lower compared with adults. WHO guidelines recommend 400 g of fruits and vegetables daily; therefore, when following this guideline and consuming grapes, which were found to contain the highest quantity of MPs in this study, it implies that 1.62 × 10⁻¹ MPs may enter the digestive system daily for children and 3.70 × 10⁻² particles for adults. Moreover, the highest EAI was in grape samples in market A, with a value of 0.154 MPs/individual/gram/year (Table 7). Following grapes, there were apples, tomatoes, and cucumbers. Market C had the highest EAI for tomatoes, cucumbers, and apples with 0.013, 0.005, and 0.023 MPs/individual/gram/year, respectively. Even though the intake may not appear to be significant in terms of MPs number, it is important to emphasize that there are currently no established limits or regulations regarding the allowable number of MPs that can be ingested. As there is no published literature on this topic, MPs intake from the produce’s surface was compared with MPs intake from consuming the produce as a whole (i.e., MPs inside the produce). One recent study found the highest EAI in tomato samples, with 398,520 MPs/individual/gram, and the highest EDI was in tomato samples, with 68.24 and 16.5 MPs/kg/day for children and adults, respectively [40]. A second study reported only EDI, and the highest EDI values for children and adults were in apple samples with 1.41 × 10⁶ MPs/kg/day for children and 4.62 × 10⁵ MPs/kg/day for adults [41]. The discrepancy between these two studies can be attributed to the calculation of both nanoplastics and MPs numbers in the second study. It is expected that the number of MPs consumed from eating the produce as a whole will be more than from only the skin.

4. Conclusions

This study identified and quantified MPs particles on the surface of commonly consumed fruits and vegetables. Among the produce tested from three markets (A, C, and L), grapes exhibited the highest number of MPs in market A, with 0.891 n/mm2 as the maximum. Most MPs were transparent, with every sample containing above 85% transparency, which may suggest potential origins such as the transparent packaging. In terms of shape, fibers were prevalent in apples, while fragments were more frequent in the rest of the produce. ANOVA results confirmed that MPs concentration results across colors and shapes were statistically significant.
SEM-EDX revealed that MPs were predominantly made of carbon and oxygen, with traces of Si, Zn, Mg, Fe, Al, and Na also detected. These elements support existing evidence that MPs can absorb chemical and harmful substances, which may desorb upon ingestion and pose potential risks to human health. The exposure assessment revealed that children and adults consuming grapes from market A may ingest up to 4.04 × 10⁻⁴ and 9.24 × 10⁻⁵ MPs/kg/day, respectively. This highlights the potential for significant exposure from food. There are currently no set regulatory thresholds that specify a safe MPs consumption level, which emphasizes how urgent it is to address this food safety issue.
These findings are important for public health and food safety, especially in light of the absence of regulations regarding MPs in fresh produce. The outcomes of this study provide a foundational reference for future research endeavors. Future studies could benefit by developing mitigation methods in various processes such as farming and handling. Also, studies can further look into factors that affect the adhesion of MPs on the surface of produce. Expanding the number of sampled fruits and vegetables as well as the number of markets would enhance the reliability of results.

Author Contributions

Conceptualization, M.M.M.; methodology, M.M.M., B.T. and S.N.; software: B.T.; formal analysis, M.M.M., B.T., S.N., S.A. and K.P.F.; investigation, M.M.M., B.T. and S.N.; resources, M.M.M., S.A. and K.P.F. data curation, S.N. and B.T.; writing—original draft preparation, B.T. and S.N.; writing—review and editing, M.M.M., S.A. and K.P.F.; supervision, M.M.M., S.A. and K.P.F.; project administration, M.M.M.; funding acquisition, M.M.M., S.A. and K.P.F. All authors have read and agreed to the published version of the manuscript.

Funding

The research is partially supported by American University of Sharjah (PDFA-RA-23-E6 and FRG24-C-E59).

Data Availability Statement

The data presented in this study are available on request from the corresponding author due to restriction on disclosure of the sources of fruits and vegetable.

Acknowledgments

The authors would like to acknowledge the help and support of Riyad Temam and other research associates for their advice.

Conflicts of Interest

The authors declare no conflicts of interest.

Abbreviations

The following abbreviations are used in this manuscript:
MPsMicroplastics
WHOWorld Health Organization
UNUnited Nations
LLength
TThickness
WWidth
SSurface area
DgGeometric mean diameter
SEMScanning Electron Microscopy
EDXEnergy Dispersion Detector
EDIEstimated daily intake
EAIEstimated annual intake
PEPolyethylene
SiSilicon
ZnZinc
MgMagnesium
FeIron
AlAluminum
NaSodium

Appendix A

Table A1. Blank results.
Blank MPs (n/200 mL)
TomatoesCucumbersGrapesApples
934013033
Table A2. Tomatoes Tukey HSD post hoc test results.
MPs Homogeneous Subsets
Color 1Color 2Significance12
Other colorTransparent< 0.00112.4444-
Yellow0.982
Transparent Other color< 0.001-395.8889
Yellow< 0.001
YellowOther color0.98222.2222-
Transparent< 0.001
Table A3. Grapes Tukey HSD post hoc test results.
MPs Homogeneous Subsets
Color 1Color 2Significance12
Other colorTransparent<0.00111.0000-
Yellow0.923
Transparent Other color<0.001-669.6667
Yellow<0.001
YellowOther color0.92328.4444-
Transparent<0.001
Table A4. Apples Tukey HSD post hoc test results.
MPs Homogeneous Subsets
Color 1Color 2Significance12
Other colorTransparent<0.00119.1111-
Yellow0.999
Transparent Other color<0.001-1302.4444
Yellow<0.001
YellowOther color0.99914.2222-
Transparent<0.001
Table A5. Cucumbers Tukey HSD post hoc test results.
MPs Homogeneous Subsets
Color 1Color 2Significance12
Other colorTransparent<0.0017.5556-
Yellow0.998
Transparent Other color<0.001-406.6667
Yellow<0.001
YellowOther color0.9984.4444-
Transparent<0.001

References

  1. Rouch, D. Plastic Future: How to Reduce the Increasing Environmental Footprint of Plastic Packaging; Clarendon Policy & Strategy Group: Melbourne, Australia, 2021. [Google Scholar]
  2. Chatterjee, S.; Sharma, S. Microplastics in our oceans and marine health. Field Actions Sci. Rep. 2019, 19, 54–61. [Google Scholar]
  3. Shrivastava, A. Plastic Properties and Testing. In Introduction to Plastics Engineering; William Andrew: Norwich, NY, USA, 2018; pp. 49–110. [Google Scholar]
  4. Webb, H.K.; Arnott, J.; Crawford, R.J.; Ivanova, E.P. Plastic degradation and its environmental implications with special reference to poly (ethylene terephthalate). Polymers 2013, 5, 18. [Google Scholar] [CrossRef]
  5. Alshamsi, A.M.O.; Tatan, B.M.; Ashoobi, N.M.S.; Mortula, M.M. Emerging pollutants of water supplies and the effect of climate change. Environ. Rev. 2023, 31, 256–277. [Google Scholar] [CrossRef]
  6. Khant, N.A.; Kim, H. Review of Current Issues and Management Strategies of Microplastics in Groundwater Environments. Water 2022, 14, 1020. [Google Scholar] [CrossRef]
  7. Aslam, H.; Ali, A.; Mortula, M.M.; Attaelmanan, A.G. Evaluation of microplastics in beach sediments along the coast of Dubai, UAE. Mar. Pollut. Bull. 2020, 150, 110739. [Google Scholar] [CrossRef] [PubMed]
  8. Hammodat, A.R.; Nassar, S.; Mortula, M.M.; Shamsuzzaman, M. Factors affecting the leaching of micro and nanoplastics in the water distribution system. J. Environ. Manag. 2023, 345, 118779. [Google Scholar] [CrossRef]
  9. He, D.; Luo, Y.; Lu, S.; Liu, M.; Song, Y.; Lei, L. Microplastics in soils: Analytical methods, pollution characteristics and ecological risks. TrAC Trends Anal. Chem. 2018, 109, 163–172. [Google Scholar] [CrossRef]
  10. Cox, K.D.; Covernton, G.A.; Davies, H.L.; Dower, J.F.; Juanes, F.; Dudas, S.E. Human consumption of microplastics. Environ. Sci. Technol. 2019, 53, 7068–7074. [Google Scholar] [CrossRef]
  11. Leslie, H.A.; Velzen, M.J.; Brandsma, S.H.; Vethaak, A.D.; Garcia-Vallejo, J.J.; Lamoree, M.H. Discovery anquantification of plastic particle pollution in human blood. Environ. Int. 2022, 163, 107199. [Google Scholar] [CrossRef]
  12. Ragusa, A.; Svelato, A.; Santacroce, C.; Catalano, P.; Notarstefano, V.; Carnevali, O.; Papa, F.; Rongioletti, M.C.A.; Baiocco, F.; Draghi, S.; et al. Plasticenta: First evidence of microplastics in human placenta. Environ. Int. 2021, 146, 106274. [Google Scholar] [CrossRef]
  13. Saraluck, A.; Techarang, T.; Bunyapipat, P.; Boonchuwong, K.; Pullaput, Y.; Mordmuang, A. Detection of Microplastics in Human Breast Milk and Its Association with Changes in Human Milk Bacterial Microbiota. Clin. Med. 2024, 13, 4029. [Google Scholar] [CrossRef]
  14. Prata, J.C.; da Costa, J.P.; Lopes, I.; Andrady, A.L.; Duarte, A.C.; Rocha-Santos, T.A. One health perspective of the impacts of microplastics on animal, human and environmental health. Sci. Total Environ. 2021, 777, 146094. [Google Scholar] [CrossRef]
  15. Rahman, A.; Sarkar, A.; Yadav, O.P.; Achari, G.; Slobodnik, J. Potential human health risks due to environmental exposure to nano- and microplastics and knowledge gaps: A scoping review. Sci. Total Environ. 2021, 757, 143872. [Google Scholar] [CrossRef]
  16. Kirstein, I.V.; Hensel, F.; Gomiero, A.; Iordachescu, L.; Vianello, A.; Wittgren, H.B.; Vollertsen, J. Drinking plastics?—Quantification and qualification of microplastics in drinking water distribution systems by µFTIR and Py-GCMS. Water Res. 2021, 188, 116519. [Google Scholar] [CrossRef] [PubMed]
  17. Koelmans, A.A.; Nor, N.H.M.; Hermsen, E.; Kooi, M.; Mintenig, S.M.; De France, J. Microplastics in freshwaters and drinking water: Critical review and assessment of data quality. Water Res. 2019, 155, 410–422. [Google Scholar] [CrossRef] [PubMed]
  18. Mason, S.A.; Welch, V.G.; Neratko, J. Synthetic polymer contamination in bottled water. Front. Chem. 2018, 6, 407. [Google Scholar] [CrossRef] [PubMed]
  19. Oßmann, B.E.; Sarau, G.; Holtmannspötter, H.; Pischetsrieder, M.; Christiansen, S.H.; Dicke, W. Small-sized microplastics and pigmented particles in bottled mineral water. Water Res. 2018, 141, 307–316. [Google Scholar] [CrossRef]
  20. Udovicki, B.; Andjelkovic, M.; Cirkovic-Velickovic, T.; Rajkovic, A. Microplastics in food: Scoping review on health effects, occurrence, and human exposure. Int. J. Food Contam. 2022, 9, 7. [Google Scholar] [CrossRef]
  21. Kapukotuwa, R.W.M.G.K.; Jayasena, N.; Weerakoon, K.C.; Abayasekara, C.L.; Rajakaruna, R.S. High levels of micro-plastics in commercial salt and industrial salterns in Sri Lanka. Mar. Pollut. Bull. 2022, 174, 113239. [Google Scholar] [CrossRef]
  22. Kosuth, M.; Mason, S.A.; Wattenberg, E.V. Anthropogenic contamination of tap water, beer, and sea salt. PLoS ONE 2018, 13, e0194970. [Google Scholar] [CrossRef]
  23. Liebezeit, G.; Liebezeit, E. Non-pollen particulates in honey and sugar. Food Addit. Contam. Part A 2013, 30, 2136–2140. [Google Scholar] [CrossRef] [PubMed]
  24. Guo, X.; Dai, H.; Gukowsky, J.; Tan, X.; He, L. Detection and quantification of microplastics in commercially bottled edible oil. Food Packag. Shelf Life 2023, 38, 101122. [Google Scholar] [CrossRef]
  25. Akhbarizadeh, R.; Dobaradaran, S.; Nabipour, I.; Tajbakhsh, S.; Darabi, A.H.; Spitz, J. Abundance, composition, and potential intake of microplastics in canned fish. Mar. Pollut. Bull. 2020, 160, 111633. [Google Scholar] [CrossRef] [PubMed]
  26. Dessì, C.; Okoffo, E.D.; O’Brien, J.W.; Gallen, M.; Samanipour, S.; Kaserzon, S.; Rauert, C.; Wang, X.; Thomas, K.V. Plastics contamination of store-bought rice. J. Hazard. Mater. 2021, 416, 125778. [Google Scholar] [CrossRef]
  27. Piyawardhana, N.; Weerathunga, V.; Chen, H.S.; Guo, L.; Huang, P.J.; Ranatunga, R.R.M.K.P.; Hung, C.C. Occurrence of microplastics in commercial marine dried fish in Asian countries. J. Hazard. Mater. 2022, 423, 127093. [Google Scholar] [CrossRef]
  28. Karami, A.; Golieskardi, A.; Keong Choo, C.; Larat, V.; Galloway, T.S.; Salamatinia, B. The presence of microplastics in commercial salts from different countries. Sci. Rep. 2017, 7, 46173. [Google Scholar] [CrossRef]
  29. Plastics—The Facts. 2022. Available online: https://plasticseurope.org/knowledge-hub/plastics-the-facts-2022/ (accessed on 25 August 2025).
  30. Du, F.; Cai, H.; Zhang, Q.; Chen, Q.; Shi, H. Microplastics in take-out food containers. J. Hazard. Mater. 2020, 399, 122969. [Google Scholar] [CrossRef]
  31. Hee, Y.Y.; Weston, K.; Suratman, S. The effect of storage conditions and washing on microplastic release from food and drink containers. Food Packag. Shelf Life 2022, 32, 100826. [Google Scholar] [CrossRef]
  32. Kedzierski, M.; Lechat, B.; Sire, O.; Le Maguer, G.; Le Tilly, V.; Bruzaud, S. Microplastic contamination of packaged meat: Occurrence and associated risks. Food Packag. Shelf Life 2020, 24, 100489. [Google Scholar] [CrossRef]
  33. Ranjan, V.P.; Joseph, A.; Goel, S. Microplastics and other harmful substances released from disposable paper cups into hot water. J. Hazard. Mater. 2021, 404, 124118. [Google Scholar] [CrossRef]
  34. Li, D.; Shi, Y.; Yang, L.; Xiao, L.; Kehoe, D.K.; Gun’ko, Y.K.; Boland, J.J.; Wang, J.J. Microplastic release from the degradation of polypropylene feeding bottles during infant formula preparation. Nat. Food 2020, 1, 746–754. [Google Scholar] [CrossRef]
  35. Yadav, H.; Khan, M.R.H.; Quadir, M.; Rusch, K.A.; Mondal, P.P.; Orr, M.; Xu, E.G.; Iskander, S.M. Cutting Boards: An Over-looked Source of Microplastics in Human Food? Environ. Sci. Technol. 2023, 57, 8225–8235. [Google Scholar] [CrossRef]
  36. Khalid, N.; Aqeel, M.; Noman, A.; Rizvi, Z.F. Impact of plastic mulching as a major source of microplastics in agroecosystems. J. Hazard. Mater. 2023, 445, 130455. [Google Scholar] [CrossRef]
  37. Tatan, B.; Mortula, M.M.; Ali, T. Evaluation of microplastics in groundwater within surrounding areas of Sajaa landfill site, Sharjah, United Arab Emirates. Bioresour. Technol. Rep. 2025, 30, 102114. [Google Scholar] [CrossRef]
  38. Salehi, Z.; Hashemi, S.H.; Flury, M. Micro- and Mesoplastics in Farmlands with Different Irrigation Water Sources. Water Air Soil Pollut. 2023, 234, 267. [Google Scholar] [CrossRef]
  39. Soltani, N.S.; Taylor, M.P.; Wilson, S.P. Quantification and exposure assessment of microplastics in Australian indoor house dust. Environ. Pollut. 2021, 283, 117064. [Google Scholar] [CrossRef] [PubMed]
  40. Aydın, R.B.; Yozukmaz, A.; Şener, İ.; Temiz, F.; Giannetto, D. Occurrence of Microplastics in Most Consumed Fruits and Vegetables from Turkey and public risk assessment for consumers. Life 2023, 13, 1686. [Google Scholar] [CrossRef]
  41. Oliveri Conti, G.; Ferrante, M.; Banni, M.; Favara, C.; Nicolosi, I.; Cristaldi, A.; Fiore, M.; Zuccarello, P. Micro- and nano-plastics in edible fruit and vegetables. The first diet risks assessment for the general population. Environ. Res. 2020, 187, 109677. [Google Scholar] [CrossRef]
  42. WHO. Healthy Diet. 2020. Available online: https://www.who.int/news-room/fact-sheets/detail/healthy-diet (accessed on 25 August 2025).
  43. Halkos, G.; Gkampoura, E.C. Where do we stand on the 17 Sustainable Development Goals? An overview on progress. Econ. Anal. Policy 2021, 70, 94–122. [Google Scholar] [CrossRef]
  44. Top 20 Fruits and Vegetables Sold in the U.S. 2021. Available online: https://www.freshproduce.com/resources/consumer-trends/top-20/ (accessed on 25 August 2025).
  45. Jadhav, E.B.; Sankhla, M.S.; Bhat, R.A.; Bhagat, D.S. Microplastics from food packaging: An overview of human con-sumption, health threats, and alternative solutions. Environ. Nanotechnol. Monit. Manag. 2021, 16, 100608. [Google Scholar] [CrossRef]
  46. Bai, C.L.; Liu, L.Y.; Hu, Y.B.; Zeng, E.Y.; Guo, Y. Microplastics: A review of analytical methods, occurrence and charac-teristics in food, and potential toxicities to biota. Sci. Total Environ. 2022, 806, 150263. [Google Scholar] [CrossRef] [PubMed]
  47. Munno, K.; Helm, P.A.; Jackson, D.A.; Rochman, C.; Sims, A. Impacts of temperature and selected chemical digestion methods on microplastic particles. Environ. Toxicol. Chem. 2018, 37, 91–98. [Google Scholar] [CrossRef] [PubMed]
  48. Avio, C.G.; Gorbi, S.; Regoli, F. Experimental development of a new protocol for extraction and characterization of mi-croplastics in fish tissues: First observations in commercial species from Adriatic Sea. Mar. Environ. Res. 2015, 111, 18–26. [Google Scholar] [CrossRef] [PubMed]
  49. Cole, M.; Webb, H.; Lindeque, P.K.; Fileman, E.S.; Halsband, C.; Galloway, T.S. Isolation of microplastics in biota-rich seawater samples and marine organisms. Sci. Rep. 2014, 4, 4528. [Google Scholar] [CrossRef]
  50. Pfeiffer, F.; Fischer, E.K. Various digestion protocols within microplastic sample processing—Evaluating the resistance of different synthetic polymers and the efficiency of biogenic organic matter destruction. Front. Environ. Sci. 2020, 8, 572424. [Google Scholar] [CrossRef]
  51. Hidalgo-Ruz, V.; Gutow, L.; Thompson, R.C.; Thiel, M. Microplastics in the marine environment: A Review of the methods used for identification and quantification. Environ. Sci. Technol. 2012, 46, 3060–3075. [Google Scholar] [CrossRef]
  52. Arshad, M.; Shahnawaz, M.; Shahkeela, S.; Hussain, M.; Ahmad, M.; Khan, S.S. Significance of physical properties of apple fruit influenced by preharvest orchard management factors. Eur. J. Exp. Biol. 2014, 4, 82–89. [Google Scholar]
  53. Werby, R.A.; Mousa, A. Some physical and mechanical properties of jatropha fruits. J. Agric. Eng. 2016, 33, 475–490. [Google Scholar] [CrossRef]
  54. Selvam, S.; Jesuraja, K.; Venkatramanan, S.; Roy, P.D.; Jeyanthi Kumari, V. Hazardous microplastic characteristics and its role as a vector of heavy metal in groundwater and surface water of coastal south India. J. Hazard. Mater. 2021, 402, 123786. [Google Scholar] [CrossRef]
  55. Dronjak, L.; Exposito, N.; Rovira, J.; Florencio, K.; Emiliano, P.; Corzo, B.; Schuhmacher, M.; Valero, F.; Sierra, J. Screening of microplastics in water and sludge lines of a drinking water treatment plant in Catalonia, Spain. Water Res. 2022, 225, 119185. [Google Scholar] [CrossRef]
  56. United Arab Emirates. 2015. Available online: https://app.indexbox.io/table/080810/784/ (accessed on 25 August 2025).
  57. Copat, C.; Vinceti, M.; D’Agati, M.G.; Arena, G.; Mauceri, V.; Grasso, A.; Fallico, R.; Sciacca, S.; Ferrante, M. Mercury and selenium intake by seafood from the Ionian Sea: A risk evaluation. Ecotoxicol. Environ. Saf. 2014, 100, 87–92. [Google Scholar] [CrossRef]
  58. Fact Sheet. 2020. Available online: https://u.ae/en/about-the-uae/fact-sheet (accessed on 25 August 2025).
  59. Bohinc, K.; Štukelj, R.; Abram, A.; Jerman, I.; Van de Velde, N.; Vidrih, R. Biophysical Characterization of Autochthonous and New Apple Cultivar Surfaces. Agronomy 2022, 12, 2051. [Google Scholar] [CrossRef]
  60. Bhide, S.; Salvi, D.; Schaffner, D.W.; Karwe, M.V. Effect of Surface Roughness in Model and Fresh Fruit Systems on Microbial Inactivation Efficacy of Cold Atmospheric Pressure Plasma. J. Food Prot. 2017, 80, 1337–1346. [Google Scholar] [CrossRef] [PubMed]
  61. Fernandes, P.É.; São José, J.F.B.; Zerdas, E.R.M.A.; Andrade, N.J.; Fernandes, C.M.; Silva, L.D. Influence of the hydro-phobicity and surface roughness of mangoes and tomatoes on the adhesion of Salmonella enterica serovar Typhimurium and evaluation of cleaning procedures using surfactin. Food Control 2014, 41, 21–26. [Google Scholar] [CrossRef]
  62. Quevedo, R.; Aguilera, J.M. Characterization of food surface roughness using the glistening points method. J. Food Eng. 2004, 65, 1–7. [Google Scholar] [CrossRef]
  63. Zhou, J.; Meng, Y.; Wang, M.; Memon, M.S.; Yang, X. Surface roughness estimation by optimal tactile features for fruits and vegetables. Int. J. Adv. Robot. Syst. 2017, 14, 1729881417721866. [Google Scholar] [CrossRef]
  64. Retama, I.; Jonathan, M.P.; Shruti, V.C.; Velumani, S.; Sarkar, S.K.; Roy, P.D.; Rodríguez-Espinosa, P.F. Microplastics in tourist beaches of Huatulco Bay, Pacific coast of southern Mexico. Mar. Pollut. Bull. 2016, 113, 530–535. [Google Scholar] [CrossRef]
  65. Corcoran, P.L. Degradation of Microplastics in the Environment. In Handbook of Microplastics in the Environment; Rocha-Santos, T., Costa, M., Mouneyrac, C., Eds.; Springer: Cham, Switzerland, 2021; pp. 1–12. [Google Scholar]
  66. Bayram, B.; Ozkan, G.; Kostka, T.; Capanoglu, E.; Esatbeyoglu, T. Valorization and Application of Fruit and Vegetable Wastes and By-Products for Food Packaging Materials. Molecules 2021, 26, 4031. [Google Scholar] [CrossRef]
  67. Perea-Domínguez, X.P.; Hernández-Gastelum, L.Z.; Olivas-Olguin, H.R.; Espinosa-Alonso, L.G.; Valdez-Morales, M.; Medina-Godoy, S. Phenolic composition of tomato varieties and an industrial tomato by-product: Free, conjugated and bound phenolics and antioxidant activity. J. Food Sci. Technol. 2018, 55, 3453–3461. [Google Scholar] [CrossRef]
  68. Long, B.; Li, F.; Wang, K.; Huang, Y.; Yang, Y.; Xie, D. Impact of plastic film mulching on microplastic in farmland soils in Guangdong province, China. Heliyon 2023, 9, e16587. [Google Scholar] [CrossRef]
  69. Jiang, J.J.; Hanun, J.N.; Chen, K.Y.; Hassan, F.; Liu, K.T.; Hung, Y.H.; Chang, T.W. Current levels and composition profiles of microplastics in irrigation water. Environ. Pollut. 2023, 318, 120858. [Google Scholar] [CrossRef]
  70. Shruti, V.C.; Pérez-Guevara, F.; Elizalde-Martínez, I.; Kutralam-Muniasamy, G. First study of its kind on the microplastic contamination of soft drinks, cold tea and energy drinks—Future research and environmental considerations. Sci. Total Environ. 2020, 726, 138580. [Google Scholar] [CrossRef]
  71. Shruti, V.C.; Kutralam-Muniasamy, G.; Pérez-Guevara, F.; Roy, P.D.; Elizalde-Martínez, I. Free, but not microplastic-free, drinking water from outdoor refill kiosks: A challenge and a wake-up call for urban management. Environ. Pollut. 2022, 309, 119800. [Google Scholar] [CrossRef] [PubMed]
  72. Makhdoumi, P.; Amin, A.A.; Karimi, H.; Pirsaheb, M.; Kim, H.; Hossini, H. Occurrence of microplastic particles in the most popular Iranian bottled mineral water brands and an assessment of human exposure. J. Water Process Eng. 2021, 39, 101708. [Google Scholar] [CrossRef]
  73. Diaz-Basantes, M.F.; Nacimba-Aguirre, D.; Conesa, J.A.; Fullana, A. Presence of microplastics in commercial canned tuna. Food Chem. 2022, 385, 132721. [Google Scholar] [CrossRef] [PubMed]
  74. Haque, M.R.; Ali, M.M.; Ahmed, W.; Siddique, M.A.B.; Akbor, M.A.; Islam, M.S.; Rahman, M.M. Assessment of micro-plastics pollution in aquatic species (fish, crab, and snail), water, and sediment from the Buriganga River, Bangladesh: An ecological risk appraisals. Sci. Total Environ. 2023, 857, 159344. [Google Scholar] [CrossRef]
  75. Pérez-Guevara, F.; Roy, P.D.; Elizalde-Martínez, I.; Kutralam-Muniasamy, G.; Shruti, V.C. Human exposure to microplastics from urban decentralized pay-to-fetch drinking-water refill kiosks. Sci. Total Environ. 2022, 848, 157722. [Google Scholar] [CrossRef]
  76. WHO. Microplastics in Drinking-Water; WHO: Geneva, Switzerland, 2019. [Google Scholar]
Figure 1. Dimensions for apples, tomatoes, and grapes.
Microplastics 04 00061 g001
Figure 2. Dimensions of cucumbers.
Microplastics 04 00061 g002
Figure 3. Percentage of MPs colors (transparent, yellow, other) across all produce types and markets.
Microplastics 04 00061 g003
Figure 4. MPs under the microscope: (a) transparent MPs; (b) discolored MPs; (c) black MPs.
Microplastics 04 00061 g004
Figure 5. (a) Percentage of fragment-shaped MPs in each product and across all markets. (b) Percentage of fiber-shaped MPs in each product and across all markets.
Microplastics 04 00061 g005
Figure 6. SEM images: (a) Grape fragment. (b) Apple fiber. (c) Tomato fiber. (d) Cucumber fragment.
Microplastics 04 00061 g006
Figure 7. SEM-EDX spectrum and image of a fragment from grapes, showing elemental composition.
Microplastics 04 00061 g007
Figure 8. SEM-EDX spectrum and image of a fiber from apples, showing elemental composition.
Microplastics 04 00061 g008
Figure 9. SEM-EDX spectrum and image of a fiber from tomatoes, showing elemental composition.
Microplastics 04 00061 g009
Figure 10. SEM-EDX spectrum and image of a fragment from cucumbers, showing elemental composition.
Microplastics 04 00061 g010
Table 1. Average count of MPs.
MarketMPs in Produce (n/mm2)
TomatoesCucumbersGrapesApples
C0.055 ± 0.0060.078 ± 0.0110.439 ± 0.0810.119 ± 0.015
L0.038 ± 0.0240.049 ± 0.0230.642 ± 0.1460.120 ± 0.039
A0.030 ± 0.0160.063 ± 0.0300.891 ± 0.1680.089 ± 0.020
Table 2. ANOVA results for MPs count across markets for each produce type.
One-Way ANOVA
ProduceMarketsp-ValueSignificance
(p < 0.05)
TomatoesC, L, and A0.30Not statistically significant
GrapesC, L, and A0.31Not statistically significant
CucumbersC, L, and A0.47Not statistically significant
ApplesC, L, and A0.18Not statistically significant
Table 3. ANOVA results showing the effects of color, market, and interaction on MPs for each produce type.
ProduceColor
p-Value
Market
p-Value
Interaction
p-Value
Color
Effect
Market
Effect
Interaction
Effect
Tomatoes9.16 × 10−70.230.34SignificantNot significantNot significant
Grapes1.44 × 10−110.080.07SignificantNot significantNot significant
Cucumbers6.85 × 10−80.450.48SignificantNot significantNot significant
Apples4.68 × 10−110.130.11SignificantNot significantNot significant
Table 4. ANOVA results showing the effects of shape, market, and interaction on MPs for each produce type.
ProduceShape
p-Value
Market
p-Value
Interaction
p-Value
Shape
Effect
Market
Effect
Interaction
Effect
Tomatoes0.120.170.68Not significantNot significantNot significant
Grapes0.480.060.86Not significantNot significantNot significant
Cucumbers0.040.240.57Marginally significantNot significantNot significant
Apples0.010.190.41SignificantNot significantNot significant
Table 5. Recovery test data.
Particle Size [μm]Microsphere TypeWeight (g)Initial NumberFinal NumberRecovery [%]Average ± SD %
45–53Fluorescent rhodamine B PE0.002337,33726,9487273 ± 1.25
45–530.001625,97419,35275
45–530.001117,85712,95373
250–300Fluorescent orange PE0.00534874188689 ± 2.82
250–3000.005954249191
250–3000.005247843491
425–500Fluorescent green PE0.00661271209498 ± 3.38
425–5000.0059114114100
425–5000.0063122122100
Table 6. EDI results.
MarketEDI of MPs per kg for Children
TomatoesCucumbersGrapesApples
C2.02 × 10−58.49 × 10−61.92 × 10−43.59 × 10⁻⁵
L1.63 × 10−55.83 × 10−62.91 × 10−43.39 × 10⁻⁵
A1.13 × 10−57.01 × 10−64.04 × 10−42.40 × 10⁻⁵
MarketEDI of MPs per kg for Adults
TomatoesCucumbersGrapesApples
C4.61 × 10−61.94 × 10−64.38 × 10−58.20 × 10⁻⁶
L3.73 × 10−61.33 × 10−66.65 × 10−57.75 × 10⁻⁶
A2.58 × 10−61.60 × 10−69.24 × 10−55.48 × 10⁻⁶
Table 7. EAI results.
MarketEAI of MPs
TomatoesCucumbersGrapesApples
C0.0130.0050.0730.023
L0.0100.0040.1110.022
A0.0070.0040.1540.015
Disclaimer/Publisher’s Note: The statements, opinions and data contained in all publications are solely those of the individual author(s) and contributor(s) and not of MDPI and/or the editor(s). MDPI and/or the editor(s) disclaim responsibility for any injury to people or property resulting from any ideas, methods, instructions or products referred to in the content.