Article

Cross-Shore Microplastic Accumulation on Sri Lanka’s West Coast One Year After the Catastrophic X-Press Pearl Pollution Event

1
Laboratoire d’Ecogéochimie des Environnements Benthiques, Sorbonne Université, LECOB, 66650 Banyuls-sur-Mer, France
2
Blue Resources Trust, Colombo 00100, Sri Lanka
3
Commonwealth Scientific and Industrial Research Organisation (CSIRO), Perth 6000, Australia
*
Author to whom correspondence should be addressed.
Microplastics 2025, 4(3), 37; https://doi.org/10.3390/microplastics4030037
Submission received: 5 May 2025 / Revised: 1 June 2025 / Accepted: 6 June 2025 / Published: 1 July 2025

Abstract

Understanding how marine debris accumulates within coastal ecosystems is a crucial aspect of predicting its long-term environmental and biological consequences. The release and subsequent dispersion of 50 billion microplastic pellets from the fire and subsequent sinking of the container ship X-Press Pearl along the western coast of Sri Lanka in 2021 provides an important case study. Here, we present a three-dimensional assessment of pellet accumulation (number density) along affected beaches and compare this with other common microplastic particles one year following the incident. Surveys confirmed that pellets were still widely present in the surface sediments of ocean beaches, with some locations returning average densities of 588 pellets m2 (very high according to the global Pellet Pollution Index [PPI]). Profiling deeper into beach sediments showed pellets were present to depths of 30 cm; however, most were restricted to the top 10 cm. Our observations of persistent pellet contamination of beaches along Sri Lanka’s west coast emphasize the need for continued monitoring of these types of events to assess the magnitude and persistence of risks to the environment, wildlife, and human well-being.

1. Introduction

Microplastic contamination of marine and coastal ecosystems is now one of the most serious issues threatening marine life and human health worldwide [1,2]. One group of microplastics that have attracted both public as well as scientific attention are microplastic pellets (also called ‘nurdles’). Pellets are spherical or cylindrical particles that typically range from 1 to 5 mm and are composed of polyethylene, polystyrene, HDPE and polyvinylidene, which are used as raw materials for a broad range of products [3,4]. Recent figures suggest that pellets now account for up to 10% of all beached microplastics [5] because they are lost at various points in the production and transportation chain (e.g., one single production site has been shown to release between 3 and 36 million pellets annually [6]). The fate and distribution of these particles and their associated chemical pollutants are being studied across a variety of coastal ecosystems to assess ecological impacts on wildlife and consequences for human beings [7,8,9]. Nevertheless, understanding the links between sources of marine plastic debris and the accumulation of these particles in different marine ecosystems remains a challenge as it depends on various factors, such as their chemical composition and the complex interaction between oceanic currents, tides and riverine inputs [10,11].
Spills of pellets are becoming a serious problem in many regions of the globe, and clean-up operations remain a major challenge [12]. Large spills have impacted coasts around the world, including the beaches of Spain (e.g., 50 million particles along the beaches of Galicia [13]), California [14], Mexico [15,16] and Brazil [4]. Because of their chemical stability, pellets are also extremely long-lasting in the environment and can be mistaken for food and ingested by many different groups of animals [17,18,19,20]. Accumulation in the environment can similarly lead to contamination of soils [21,22,23], freshwater environments [24,25], and increasingly, coastal and estuarine environments because of the trapping ability of marine macrophytes, like mangroves and seagrasses [26,27,28]. The tremendous demand for pellets of all types means that spills will become increasingly common and require a better understanding of how these materials accumulate in marine environments and pose chronic and long-term risks [29].
One of the most dramatic cases of a microplastic pellet spill in Sri Lanka was the result of the fire and subsequent sinking of the X-Press Pearl container ship along the country’s west coast [30,31]. In May 2021, the ship which was carrying around 1680 tons of plastic pellets, together with oil and other toxic chemicals, caught fire and eventually sunk 18 km offshore from the capital of Colombo (7°04′57″ N, 79°46′39″ E) at a depth of around 21 m. Approximately 50 billion microplastic pellets (~5 mm ø) of whitish color were released and subsequently washed up along the coast [30]. Despite a concerted effort by government agencies and volunteers to clean up the pellets (see [32]), they are still widely present along the beaches and coastal ecosystems of the country’s west coast [33,34]. Moreover, clean-up campaigns, whilst initiated immediately, faced significant operational constraints due to COVID-19 lockdowns in effect during the time of the incident. Another notable difference with this incident was the intense fire which occurred prior to the sinking of the ship, which burnt many of the pellets, changing their color, shape, density and buoyancy, and created agglomerations of burnt pellets [32]. These physical changes pose a challenge for scientists, as the interaction between pellets and marine biota, as well as their dispersal dynamics, may have changed [35]. Indeed, several studies have suggested that the environmental risks of burnt pellets for coastal environments might be far more complex than just the visible debris found on the beaches [8,32].
The aim of this study was to present data on the cross-shore accumulation patterns of microplastic pellets along the beaches of the central west coast of Sri Lanka, approximately one year after the X-Press Pearl accident, and to compare this with other forms of microplastics. We provide two complementary evaluations of pellets density including (1) surface accumulation per m2 using replicate quadrats that also evaluated tidal height (low, high and backshore); and (2) an assessment of accumulation into the beach sediment profile using core samples. These data provide complementary information on the net accumulation of microplastic pellets in coastal environments one year following a catastrophic spill and contrast it with other forms of microplastic debris to improve our understanding about the mechanisms of dispersal governed by ocean currents, beach hydrodynamics and other coastal processes.

2. Materials and Methods
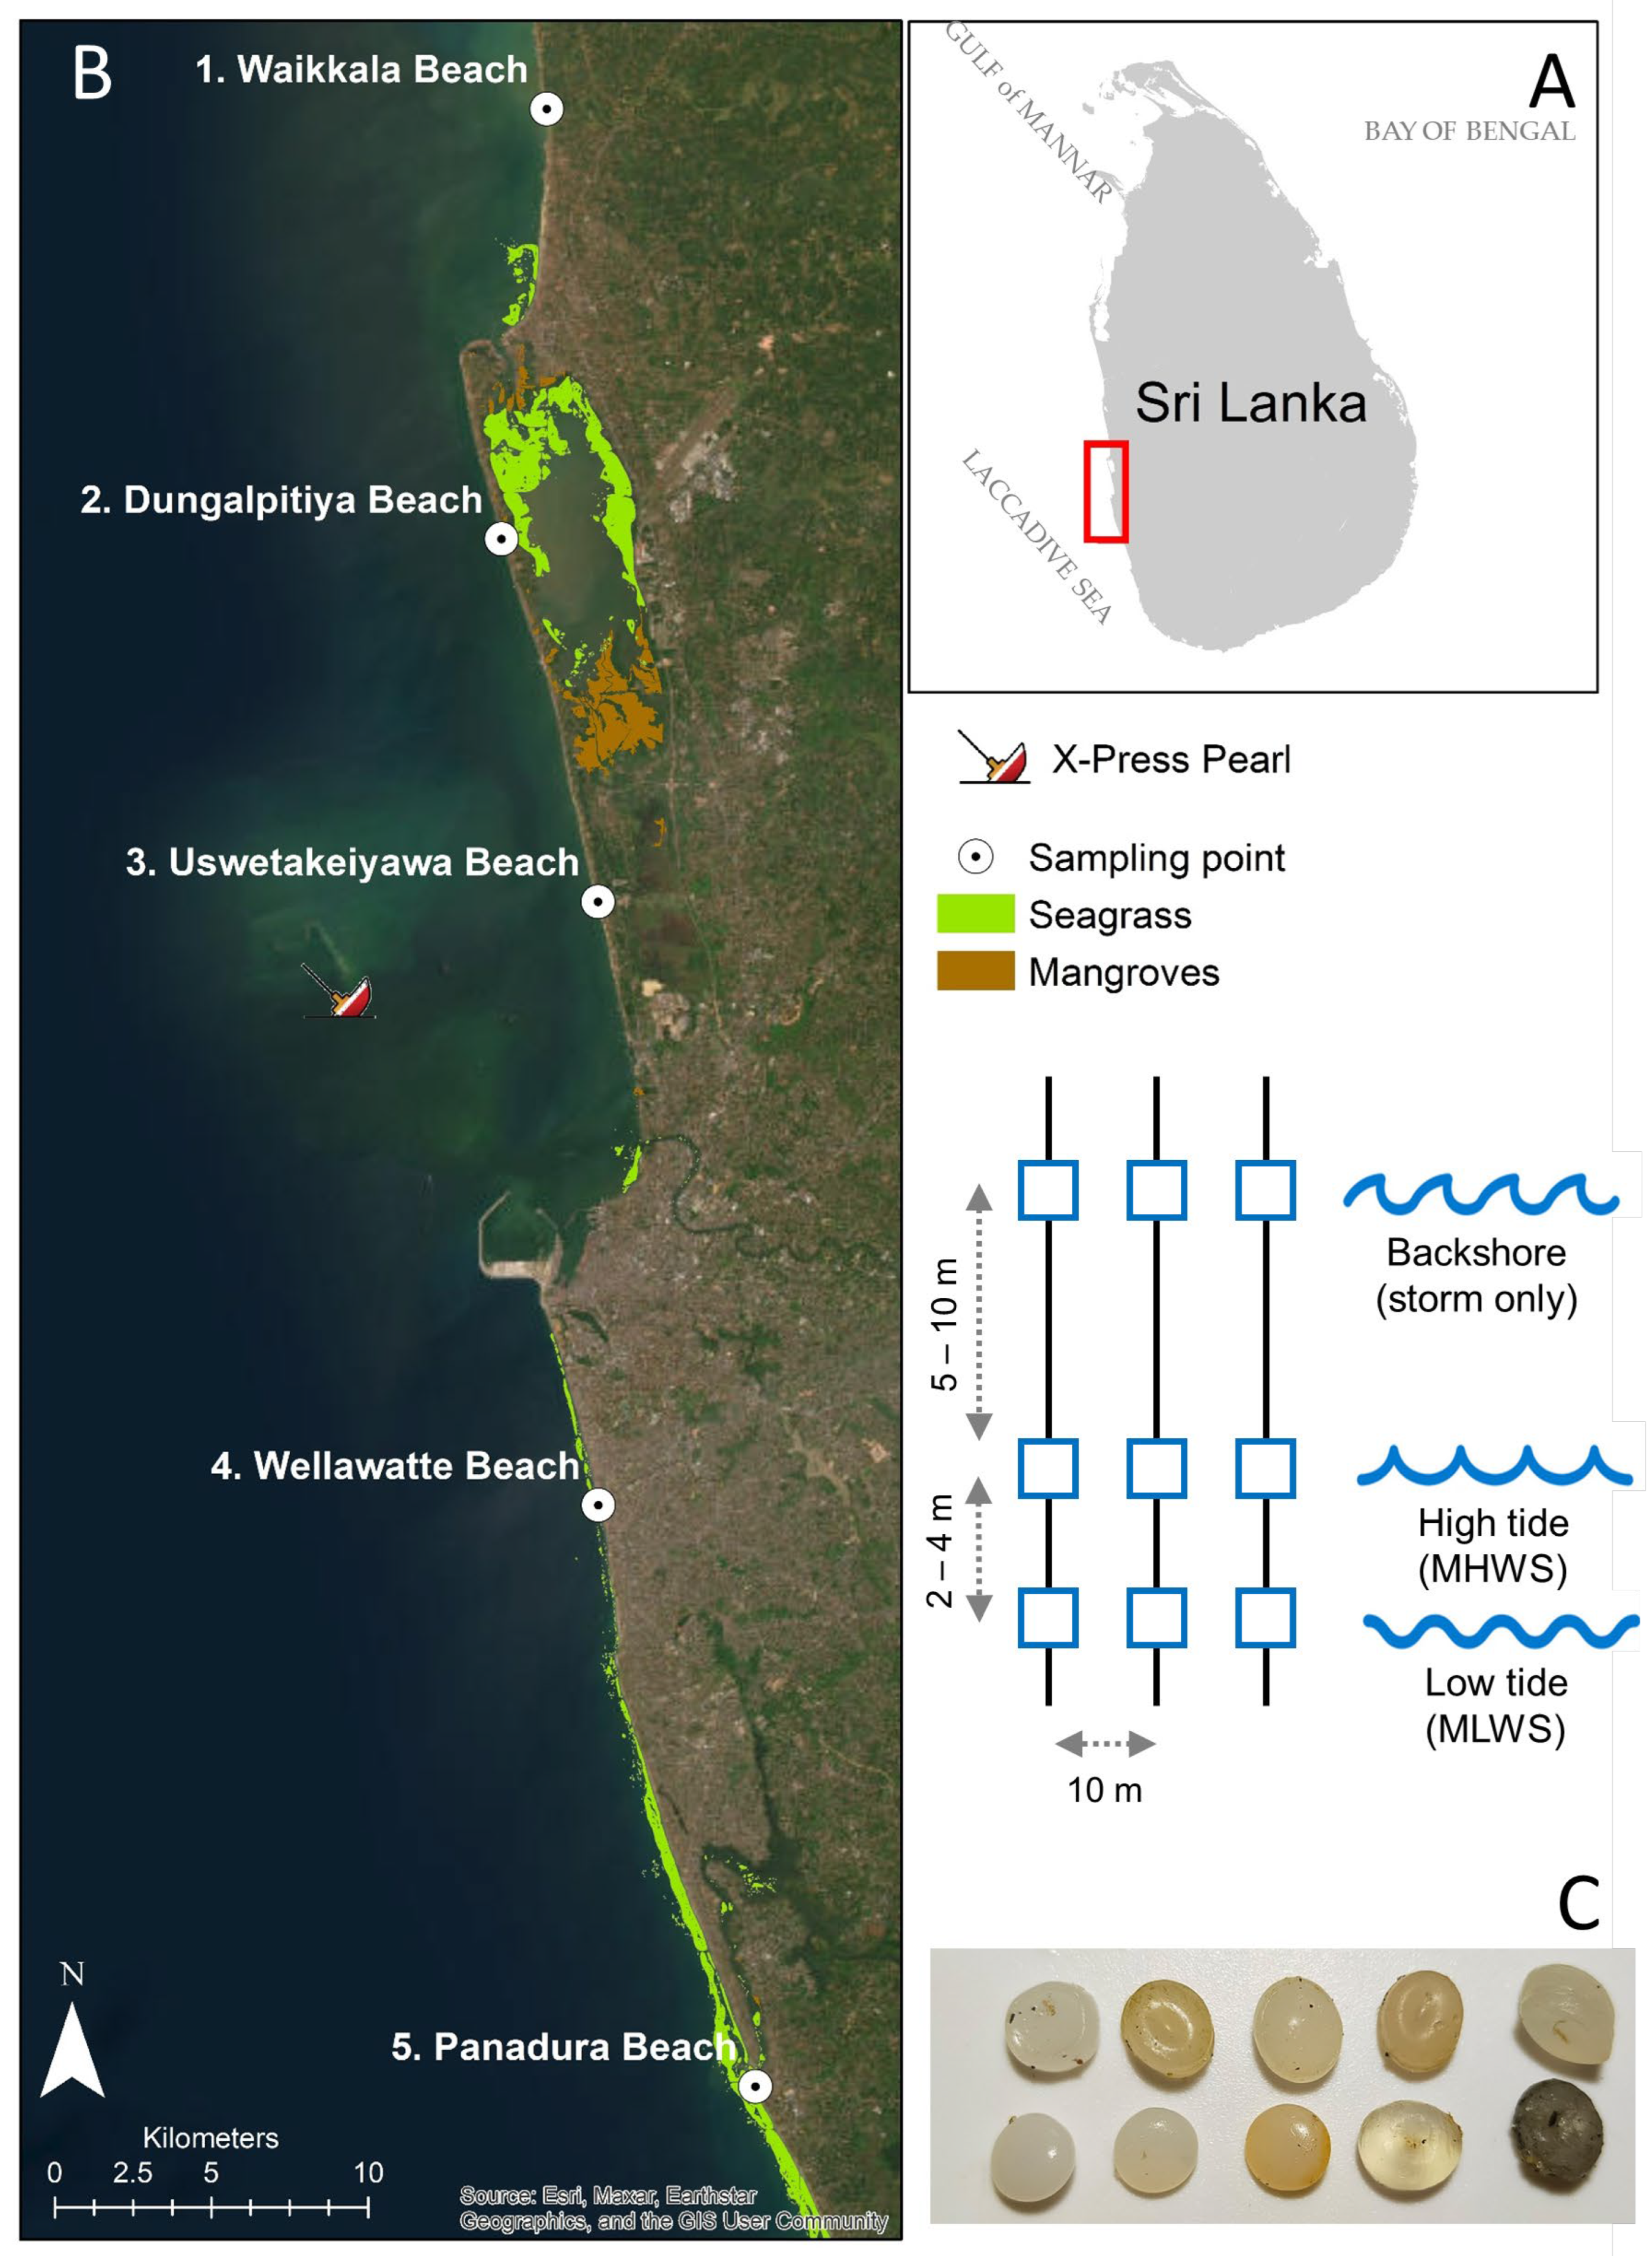
2.1. Sampling Sites

Sri Lanka is an island nation located in the northern part of the Indian Ocean, between the Bay of Bengal, the Gulf of Mannar and the Laccadive Sea (Figure 1A). The circulation patterns and weather conditions influencing the region are highly variable and are driven by the semi-annual monsoon [36]. The timing of the X-Press Pearl accident coincided with easterly summer monsoon winds [37], a period characterized by pronounced southward flowing surface currents that persist throughout much of the year [38].
The survey was performed during the first week of May 2022 and spanned a 70 km stretch of coastline that had been designated as highly impacted by the International Tanker Owners Pollution Federation (ITOPF). A total of five representative sampling sites were selected stretching from Waikkal beach (S1) in the north, to Panadura Beach (S5) in the south (Figure 1B). Sites were chosen to complement previous studies (i.e., overlapping coverage with [34,35,39,40]) and were situated equidistantly both north and south of the spill site to capture the dispersal pattern of the pellets. In other respects, all sites were similar in their geographical characteristics, including beach extent, slope, grain size (i.e., being relatively homogenously coarse sand) and backshore terrestrial vegetation. Further, all sampling sites were characterized by similar human habitation levels but varied in proximity to features, such as lagoon entrances. At the time of sample collection (beginning of May 2022—which coincided with a low tidal coefficient, suggesting that sampled plastics were at the time unlikely to be disturbed by large tides), the predominant current flow was southeastward as has been well described in other studies [37,38,41]. Regarding the sea level during the study period, the minimum variation occurs in August and the maximum in December, driven mainly by the effect of the moon; therefore, the survey period exhibited a moderate tidal range of between 0.4 m and 0.6 m [42].

2.2. Sampling Strategy

Each sampling site was surveyed during low tide and employed three transects of variable length (depending on the width of the beach) that were randomly established perpendicular to the shoreline and separated by a minimum of 10 m from each other. Because the accumulation of microplastics on sandy beaches can vary significantly across the intertidal zone due to the positioning of strand lines [43], each transect included replicate quadrats (0.5 × 0.5 m) positioned within low and high tide lines and others taken from the backshore section of the beach (see [44]). The low and high tide lines (typically 2–4 m apart) coincided with the spring low and high tide levels, while the backshore of the beach (approx. 5–10 m further landward) was considered as the zone above this high tide where only storms can deposit materials (i.e., storm tide line). In this way, quadrats were sampled from different tidal elevations per transect (low, high, and backshore), giving a total of nine quadrats per sampling site. For each quadrat, the top five centimeters of sand were extracted using a trowel (see similar approach in [11]), with resulting sediments retained in labelled Ziplock™ bags for further analysis.
The three-dimensional distribution of pellets within the sub-surface layers of beach sediment was evaluated by extracting material to a depth of 30 cm using a stainless-steel soil auger (7.5 cm in diameter). While the diameter of this auger is smaller than recommendations for broadscale microplastic sampling [45], it was chosen to reduce processing time (given resource limitations), whilst generating a standard measure that could be compared across all sites and tidal zones. While we acknowledge that this smaller diameter core may have under-sampled spatial heterogeneity, this was consistent across all sites and thus provides a standardized measure for the present study. Indeed, previous studies have shown that similar cores with a slightly smaller diameter of 7.2 cm are sufficient to recover between 60% and 100% of a known density of particles [46]. Each extracted sediment core was divided into 3 sub-samples (10, 20 and 30 cm), having therefore a total of 3 depth intervals for each sample taken, and 9 profiles per transect. Samples were placed in labelled Ziplock™ bags for further analysis.
To compare the abundance (number density) of pellets found in our study with previous estimates, we used the pellet pollution index (PPI) [4], which is given by the following equation: PPI = (n/a) × p, where ‘n’ is the number of pellets found, ‘a’ is the area of the quadrat in m2, and ‘p’ is the correction coefficient value 0.02. The results are then classified within different ranges of pollution level: very low (0.0 < PPI ≤ 0.5); low (0.5 < PPI ≤ 1.0); moderate (1.0 < PPI ≤ 2.0); high (2.0 < PPI ≤ 3.0); and very high (PPI > 3.0) [4]. These results can then be used to compare the severity of other pollution events using this same metric (e.g., [41]) or similar values calculated per kg of sediment (e.g., [35]). While the approach has the advantages of allowing quick comparisons that can aid in cleanup operations, the results can vary depending on the sampling scale, scope and inherent variability, and can introduce inconsistencies. Nevertheless, we provide this information to advocate for greater transparency and consistency in future applications.

2.3. Microplastics Separation, Quantification, and Statistical Analysis

Each sample was separated from the substrate (sand) through a density separation method that employed saltwater (mean salinity 34 ppt), as recommended by the Marine Strategy Framework Directive (MSFD) Technical Subgroup on Marine Litter. Samples were placed into a bucket, covered with seawater, thoroughly mixed, and left for a period of 24 h to permit the sediments to settle. The supernatant was then sieved through a mesh sieve of 1 mm diameter, and pellets and microplastics were separated from one another (Figure 1C). While we acknowledge that excluding particles smaller than 1 mm would have omitted a significant fraction of microplastics in our overall ‘particle type comparison’ (and in future we would employ mesh of 500 or 250 μm), at the time of sampling, our primary concern was pellets which are generally larger than 1 mm. All collected particles were taken to the facilities of Blue Resources Trust, where they were enumerated by type, shape and color into the categories: pellets, fibers, film, foam and pieces (or fragments) following standard methods that involved visual inspection and identification based on particle size, color and shape [47]. While we admit it would have been advantageous to confirm the visual inspection method using spectroscopic analysis, this was not possible in the current study. The number of pellets that showed physical signs of being burnt or chemically degraded were also recorded (Figure 1C). This included observations of any blackened, melted, warped, or irregular shapes indicating that they may have been exposed to fire, and any yellowing, cracks, or brittleness, often with a powdery or flaky texture due to oxidation.
Statistical analyses were performed using R version 4.5.0 software (R Development Core Team. 2025). For the surface abundance estimates (quadrate samples), 2-way ANOVA was used to identify the significant differences in the abundance of pellets as a function of the tidal strand level (low, high and backshore) and site. Data was tested for normality using the Shapiro–Wilk tests and homogeneity using Levene’s test. Post hoc analysis (Tukey test) was performed to determine where significant differences were found. Accumulation of pellets within the sediment profile was based on the average estimates of each sediment profile depth increment (from replicate transects) per site to provide a measure of variability. Data was log10 (x + 1 transformed) to ensure that zero pellet counts preserved the depth-related distribution patterns and to improve interpretability of the figures. Trends were predicted using LOESS smoothing, which presents non-linear trends that can accommodate gradual or abrupt variations in pellet distribution with depth.

3. Results

3.1. Pellets as a Proportion of Surface Beach Plastic Debris

Beach surface samples collected across all sites and tidal heights contained a variety of microplastic particles (Figure 2). Plastic pellets constituted the majority of particles greater than 1 mm diameter at most sites (mean 53.5%), apart from S5, where secondary plastics (fractured pieces) dominated (85%). This was followed by polystyrene foam (10.4%), fibers (2.4%) and film (2.4%).
The overall densities of pellets greater than 1 mm in diameter recovered from the surface of beach sampling sites showed considerable variability (Figure 2, Table 1—ANOVA result on main effect of ‘Site’). The greatest density observed during the sampling survey was 589.0 pellets per m2 at S4 (Wellawatte Beach), followed by 120.6 pellets per m2 at S2 (Dungalpitiya Beach), 18.6 pellets per m2 at S1 (Waikkala Beach), 4.7 pellets per m2 at S5 (Panadura Beach) and the lowest densities of 2.8 pellets per m2 at S3 (Uswetakeiyawa Beach). The highest densities of cumulative pellets recovered at each site x tidal elevation were recorded from the high tide lines at S4 (total of all quadrats: 1408.3 m2), S2 (355 m2) and S3 (54.3 m2). Only a relatively small percentage of the pellets across all sites (2.5%) were observed to be burnt (Table 1).
Two-way ANOVA showed that there was a significant interaction between the number of pellets observed across sites and tidal height (Table 1—ANOVA result on Site × Height interaction term), with post hoc tests showing strong statistical differences between S4 and all the other sampling sites (Tukey HSD: 4.9 × greater than S2, the second most polluted). While the Shapiro–Wilk test was marginally significant, indicating that the residuals of the model were not normally distributed (most notably for the ‘high’ tide), ANOVA is typically robust to modest departures from normality, especially given that the sample sizes were equal across groups. This combined with the non-significant outcome from Levene’s test, indicating no significant evidence of unequal variances across the groups, supported the validity of using ANOVA. The influence of tidal height also differed among sites, with the high tide line yielding consistently greater pellet densities than both low and backshore zones for S4 and S5, similar densities to the backshore but not low tide for S2, and no differences among zones for S1 and S3 (Table 1, see Tukey HSD Homologous Subsets).
Comparing the observed densities of pellets greater than 1 mm diameter across sites and tides using the PPI revealed that 68.3% could be considered very low or low (≤1.0), 8% were considered medium (≤2.0), and 23% were high or very high (≥2.0). Of these more heavily polluted sites, almost all (86%) were from S2 and S4, and the largest majority (61%) were collected from the high tide level. The highest PPI values observed in the present study was 188.3 for S4 (Wellawatte Beach) located ~30 kms to the south of the location of the sinking and the city of Colombo. The lowest values of 0.9 were obtained from S3 (Uswetakeiyawa Beach), which surprisingly is the closest to the site of the sinking and was immediately after the incident considered to be extremely impacted.

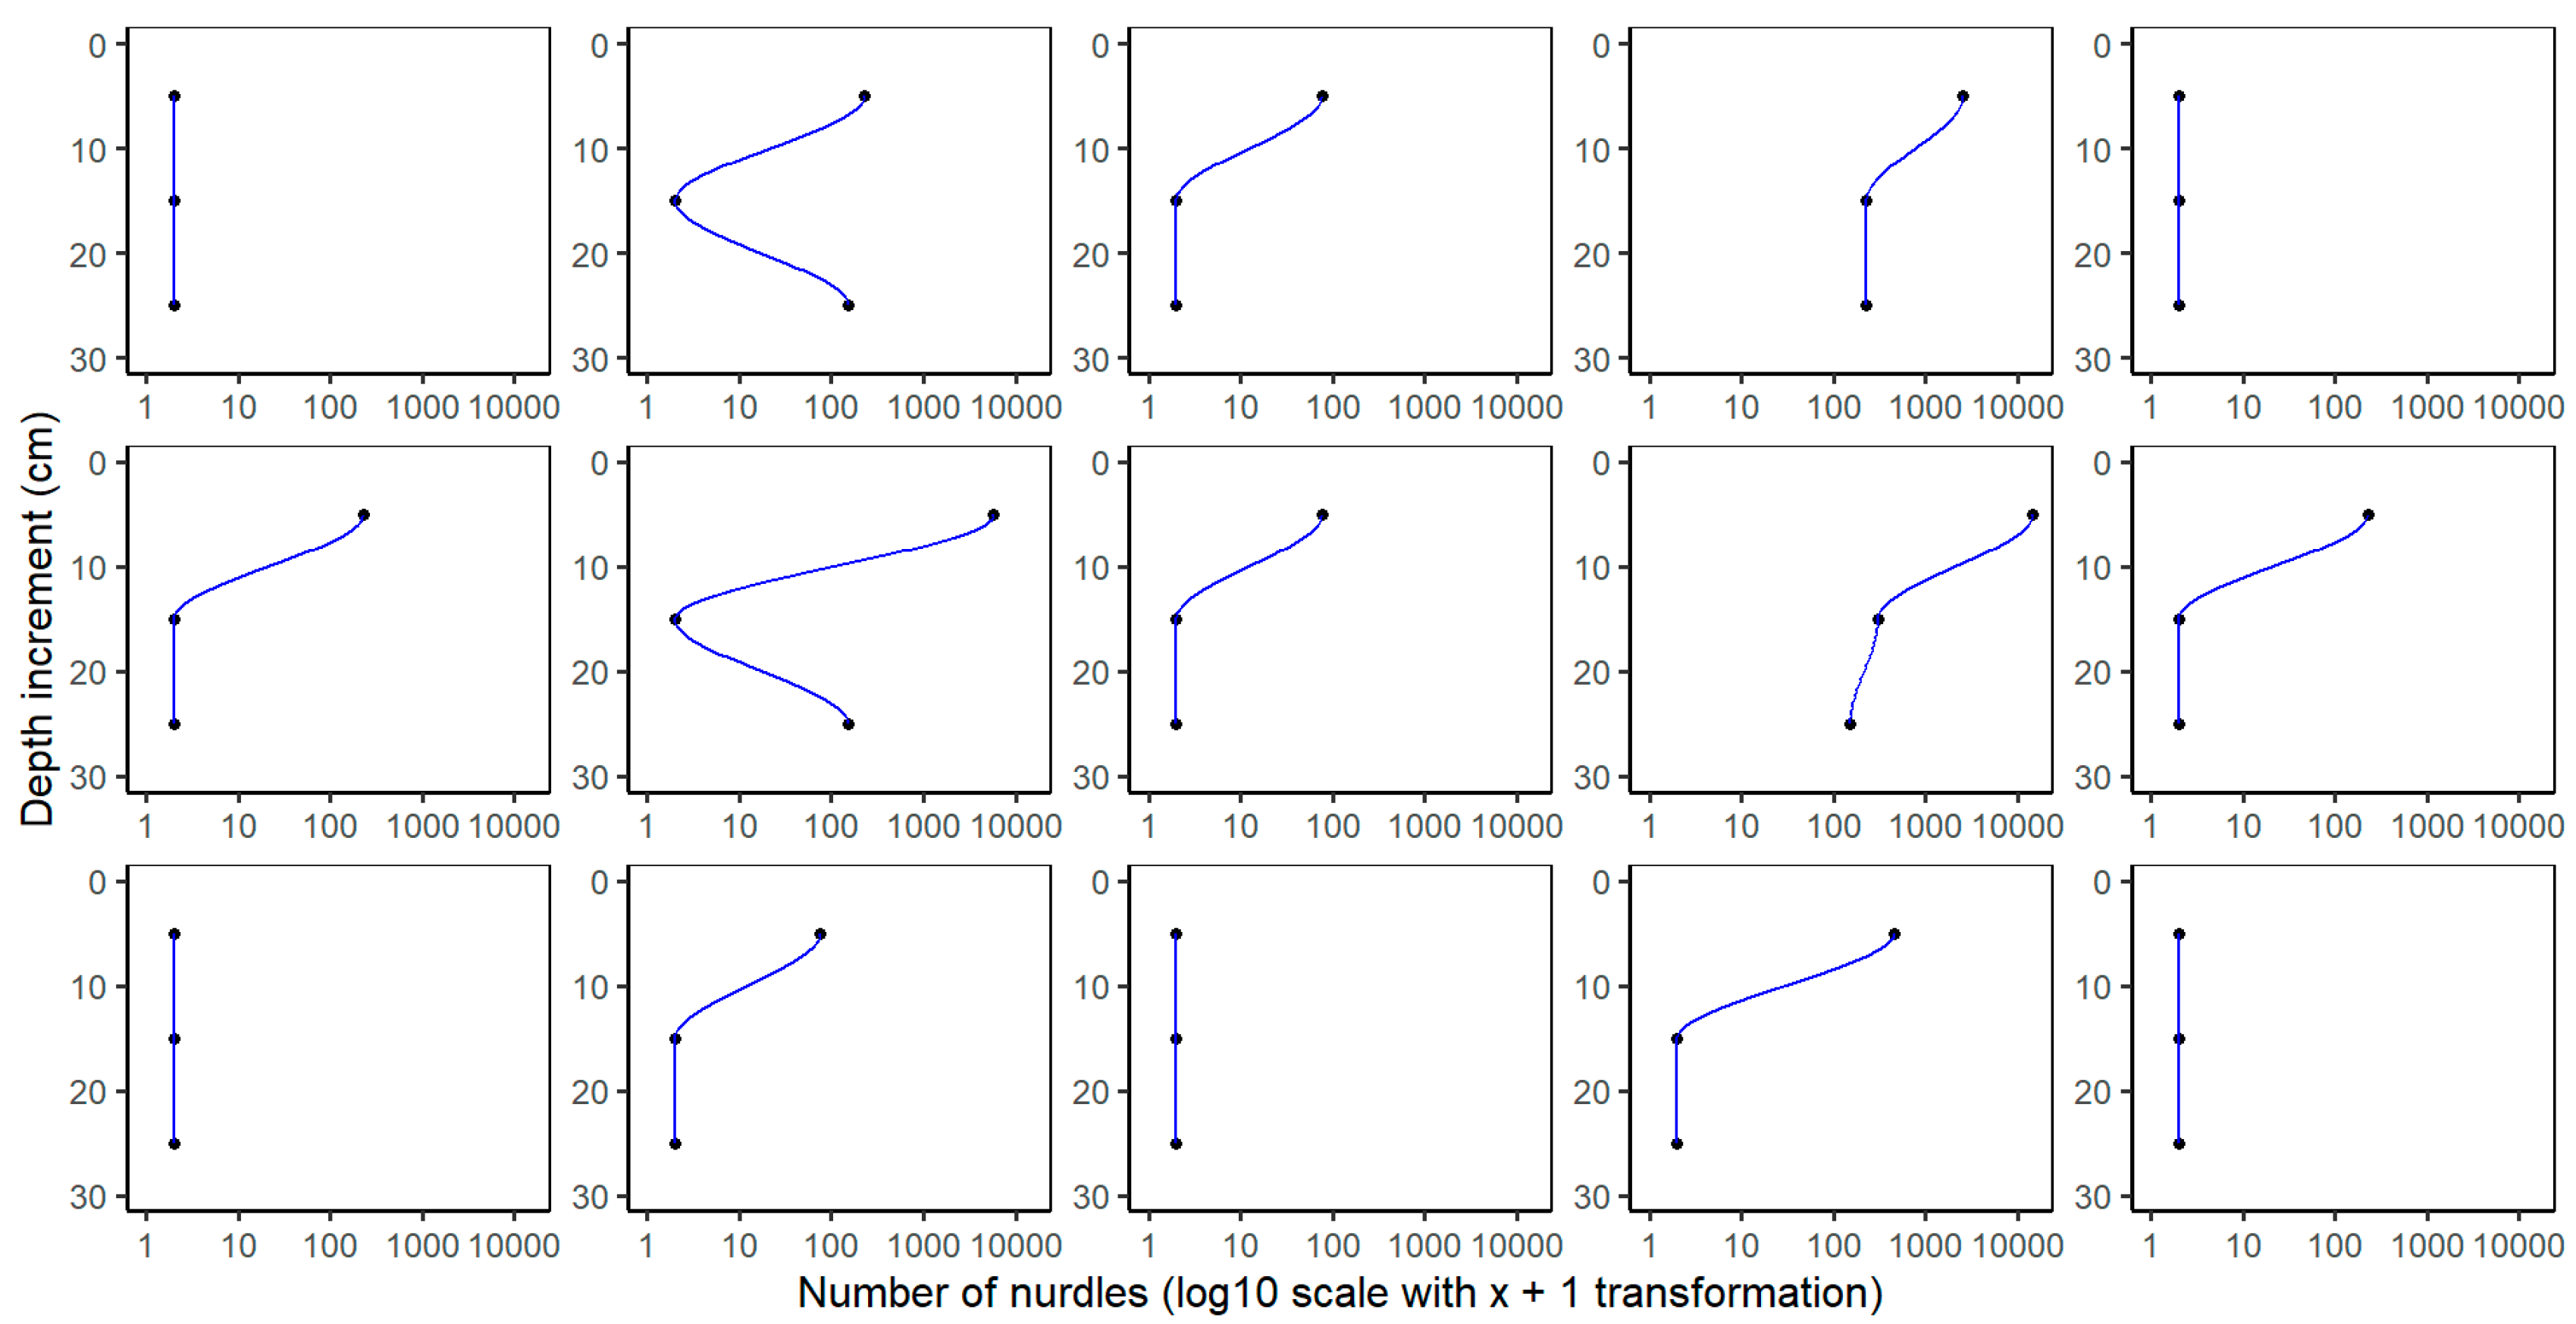
3.2. Three-Dimensional Pellet Accumulation in Sediments

Microplastic accumulation into beach sediments exhibited similar trends to those of surface contamination that were contingent on site and tide but also depth (Figure 3, means presented as points). Overall, the density of pellets greater than 1 mm diameter declined consistently with increasing depth (from 0 to 30 cm), but this decline was more pronounced at S4 (in the south) and S2 (in the north), which were similar distances away from the epicenter of the spill. Additionally, these sites showed the greatest variability in pellet density estimates among replicate transects (Figure 3 shown as red lines). For sampling points 1, 3 and 5, densities were low and uniform regardless of depth. For all sampling points, the distribution of pellets was exclusively found in the top 10 cm of the core samples (indeed, anecdotally, on the surface and top few cm), except at S4 in which pellets were found across all depths. In fact, statistical analysis of pellet abundance and depth showed a significant difference between groups, being the first 10 cm significantly different from the rest of depths (p = 0.005 for both groups). The observed densities of pellets within different depth increments (Figure 3) show general trends in pellet accumulation, with higher values in surface layers at southern sites and a general trend towards few to no pellets at depths of 30 cm.

4. Discussion

This study presents data on the distribution and accumulation of microplastic pellets and other plastic debris greater than 1 mm diameter along the beaches of Sri Lanka’s western coastline one year after the sinking of X-Press Pearl in May 2021. This event has been recognized as one of the worst man-made environmental disasters in the country’s history [35]. Its ongoing effects pose substantial risk to the environmental values and diversity of marine life (fauna and flora) within the region [48] and may affect coastal communities that rely on marine resources for their livelihoods (e.g., through fishing). Indeed, recent studies have shown that microplastics are increasingly being found in commercially important fish and prawns within the Negombo lagoon, the entrance to which is near the site of the disaster [49,50]. Quantifying the degree to which pellets are still present within beach sediments and other ecosystems, such as lagoons and estuaries (where they can be trapped by aquatic vegetation, like mangrove forests and seagrass), is vital to understand the potential long-term ecological and societal impacts.

4.1. Pellets as a Proportion of Surface Beach Plastic Debris

Temporal changes in the makeup of microplastic debris are being reported in a range of aquatic and several marine ecosystems [24,28,51]. These often reflect hydrological conditions [25], seasonal dynamics between wet and dry seasons [52], but there have also been reports of permanent shifts in the dominant forms of debris due to anthropogenic effects [53]. Our data suggests that there may have been analogous shifts in the dominant form of microplastic debris found along the beaches of Sri Lanka’s central-western coast. Because of the large inputs of pellets from the X-Press Pearl spill, it appears that these particles now comprise the dominant form of microplastic pollution at four out of the five sites sampled. While we are cautious about insinuating a direct change, given a lack of before and after data, it could be assumed that this is the case. Indeed, it conforms with the findings of previous studies that showed none to very low densities of pellets within the Negombo Lagoon and along the broader Sri Lankan west coast prior to the incident [7,54]. Indeed, ref. [55] carried out a study in two Marine Protected Areas in the south of Sri Lanka in 2018 showing that the main type of plastics found along the Sri Lankan coastline were fragments and filaments from fishing nets and ropes. This result is consistent with a study carried out in 2017, where a significantly higher abundance of microplastics (229.4 ± 46.4 items/m3; 0.30–100 mm size) were found in the waters adjacent to Wellawatte beach (S4), where the second highest number of pellets were found in the present study [56]. Thus, other forms of microplastic, such as foam, pieces, film and fibers, which were previously dominant prior to the accident, appear to have been superseded by pellets along much of the affected coastline and at all except one of the sites examined in the current study.
Such changes have been well documented at beaches directly impacted by the spill and subsequently classified as ‘highly impacted’ by the ITOPF. Ref. [40] conducted a survey at Sarakkuwa beach (adjacent to the sinking) and showed that the density of pellets increased from 1.6 per m2 before the accident to more than 227.7 m2 immediately following the accident in May 2021 and before preliminary clean-up efforts, then subsequently declined to densities of 10.24 pellets per m2 four months later. Our observations from Dungalpitiya beach (S2), which is very close to Sarakkuwa beach, showed that pellet densities remained high, exceeding 120 pellets per m2 after 12 months. This highlights the likelihood that pellets are still moving through the environment and circulating within coastal waters and sediments, emphasizing the need for ongoing monitoring of long-term effects.
Our observations of site-specific differences in pellet accumulation are consistent with weather conditions and the predominant southeastward currents that prevail along the coast [38,57]. The two sampling sites, which recorded the highest densities of pellets in the present study (589 and 121 pellets per m2, respectively, for S4 and S2) were north and south of the sinking site, respectively. This general trend matches the outputs of numerical modelling of beached particles, the Kernel Density Estimation and Pellet Pollution Index, which were generally constrained to 50 km north and south of the spill site [9]. The lower number of pellets found immediately adjacent to the sinking at S3 (2.8 pellets m2), might be explained by the geomorphological conditions of the beach, including a rocky shoreline that may have impeded the settlement of pellets. Indeed, the dispersal of microplastic pellets in estuarine and coastal waters can be difficult to predict as it can be influenced by surface currents, geomorphology, as well as rainfall and tidal cycle [58]. Variation in pellet accumulation can be driven by coastal hydrodynamics and the prevailing environmental conditions occurring within estuaries, lagoons and river systems [11,39]. Several of these processes are likely to have driven variation in the number of pellets observed in the present study. Riverine discharge from the Bolgoda River (Panadura Beach) for example, may have pushed pellets drifting in coastal waters further offshore, thus reducing the number that accumulated at this site. In contrast, the sheltering effect of the coastline orientation and large port in the vicinity of S3 may have moderated the effect of the southeast current flow and created conditions favoring the settlement of beach debris. Understanding the influence of factors like these will help anticipate site-specific factors that determine microplastic pollution levels.
Our comparison showed mean PPI values that ranged from 0.9 at S3 to 188.3 at S4. Ref. [48], calculated PPI values from Sarakkuwa Beach in the same way as described here, reported values immediately following the incident of 228, declining to 26.3 one month later, and then 10.0 after four months. Our values for S3, which is the station closest to Sarakkuwa Beach, suggest that the pollution index for beaches along this region of coast continued to decline over the subsequent year. Ref. [35] showed the most severely contaminated sites had PPI values exceeding 3000 (though the authors did not use the correction coefficient value 0.02), but these data are not directly comparable with ours given that they used metric that employed pellets per kg of sediment.
Historically, 6500 to 7000 MT of waste are produced in Sri Lanka every day [59] and much of this comprises plastic waste, which finds its way into river systems where it is broken down into smaller pieces [55]. Our choice to select microplastics ranging from 1 to 5 mm may have meant that we missed a component of the secondary microplastics smaller than this. Indeed, observations from S5 (Panadura Beach) yielded counts of microplastics that were higher than that of pellets, especially small fragments of plastic (≥1 mm), which is a trend persisting to the present according to a recent study [60]. While it could be that at the time of sampling (12 months following the incident) the pellet front had not yet travelled the 35 km south to have a major impact on coastal beaches, this is unlikely given that pellets have been shown to travel distances of up to 70 km in as little as two days [61]. It is more likely that most of the pellets had already beached further to the north, thereby reducing the number of pellets carried on coastal waters and resulting in a “decreasing gradient of pellet densities” with distance from source as has been shown elsewhere [44,62]. Although we were primarily focused on pellets resulting from the spill, a true comparison of microplastic contamination might warrant the examination of smaller diameter pieces (i.e., using a finer mesh size) to determine overall concentrations of microplastics present in the environment.
Regarding the distribution of pellets across the beach slope, the observed trends are likely to be influenced by the hydrodynamics of the shore during the sampling period that showed a small tidal range variation, between 0.4 m and 0.6 m [42]. Indeed, the accumulation of pellets and other microplastics was consistently greater along the high tide line (mean: 367 pellets per m2). This is because plastics tend to accumulate at the top of the intertidal zone especially along ocean beaches [63], where most pellets in the current study were recorded. This pattern of deposition can be explained by two physical properties of the pellets themselves: their round shape and their low density (lower than the seawater). These two properties give pellets a high buoyancy and make them prone to accumulate in the swash zone, after which they are deposited higher on the beach slope [64]. However, tidal cycles vary throughout the year, and drift lines can change and/or overlap, creating a high variability in the distribution and accumulation of pellets across shorelines [65]. This helps to explain the considerable variation in the number of pellets found for the three different tidal levels. Even the small difference in tidal range variation during the sampling period (0.4 m to 0.6 m) can lead to overlapping strand lines and to a higher accumulation of pellets in high tidal level. Therefore, further studies should be carried out across different tidal cycles to better understand the density of plastic pellets across a typical beach profile.

4.2. Assessment of Pellet Integration into Sediment Profile

Our data presents a three-dimensional assessment of the accumulation of plastic pellets to a depth of 30 cm in beach sediments at various sites and at different shoreline elevations. Overall, the density of pellets was relatively low. The decision to use a manual soil auger meant that we only present data for the top 30 cm of the sediment profile, but this information is still valuable one year following the disaster. At all sites, pellets were mostly restricted to the top 10 cm layer of the sediment profile (i.e., including the surface and top few centimeters), contrasting previous studies in other parts of the world showing that pellets can be observed vertically up to two meters deep (albeit having a much longer history of contamination), being most abundant from 30 to 40 cm [66]. The fact that we did not find pellets in deeper layers (20–30 cm) could be cause for optimism, suggesting that they have not accumulated deep into the sediment profile through the process of vertical accumulation of sand and changes to beach profile. This may be a result of their size, the time that they need to be buried deeper into the profile, or because of the meso-tidal nature of the Sri Lankan coastline. Another possibility for the general absence of pellets in deeper sediment layers could relate to the overall success of beach clean-up programs that were initiated early by a range of stakeholders, including government, local groups and even the military [67,68].
Changes to the color and/or texture of microplastic pellets as a result of being burnt can have implications for their toxicological effects [69]. Indeed, one study testing the consequences of pellets from the X-press Pearl being exposed to fire and nitric acid, suggests that this led to the formation of secondary microplastics that pose a severe environmental threat as a transoceanic marine pollutant [70]. Our observations showed relatively few burnt pellets and no visible evidence of infused oil in buried sediments (contrast, [35]) suggesting slightly different processes and potentially a reduced risk of transferring persistent organic pollutants to the beach environment and associated biota [8]. Again, this may be due to the coordinated efforts at beach clean-up by a range of government and non-government sectors that resulted in more than 650 tons of pellets being removed during the first six months [71]. Nevertheless, long-term monitoring of the health of marine and estuarine organisms (especially fisheries species) will be crucial to ensure reduced risks to local communities.

5. Conclusions

This study provides valuable data on how pellets from the X-Press pearl accident (one year following the disaster) have dispersed and accumulated along the impacted west coast of Sri Lanka and how they may be integrating into coastal environments. We provide evidence that pellets have dispersed in a southerly direction (matching prevailing currents and the results of other modelling studies) and are impacting S4 Wellawatte beach where they are found in high abundance in the surface layer from the high tide line. It is worth noting that the apparent southerly movement of pellets may have been limited given that the density of pellets observed at S4 was considerably higher than at S5, which was only ~20 km further south. Nevertheless, at four of the five sites examined, pellets comprised the dominant form of microplastic debris, being found in greater numbers than fibers, film, foam and degraded pieces. There are concerns that these materials will continue to wash up on beaches and accumulate in surface layers, but there does not yet seem to be widespread accumulation in deeper sediment layers. Overall, further studies will be necessary to determine the extent and persistence of microplastic pollution along beaches and within lagoons and estuaries where vegetation, such as mangroves and seagrass, can trap particles, and we advocate the low-cost and rapid three-dimensional mapping protocol presented here for ongoing monitoring and collection of baseline data.

Author Contributions

All authors contributed to the study conception and design. P.M.L.—Writing—review & editing, Methodology, Formal analysis, Conceptualization, Data curation, Investigation; S.U.—Review & editing, Resources, Methodology, Formal analysis, Conceptualization, Data curation, Investigation, Project administration; R.W.—Resources, Methodology, Investigation; D.G.—Writing—review & editing, Methodology, Formal analysis, Data curation, Conceptualization. All authors have read and agreed to the published version of the manuscript.

Funding

This work was supported by the Program to Assess the Presence of Marine Litter in Coastal Seagrass Habitats of Sri Lanka in relation to The Ocean Country Partnership Programme (OCPP).

Institutional Review Board Statement

Not applicable.

Informed Consent Statement

Not applicable.

Data Availability Statement

The raw data supporting the conclusions of this article will be made available by the authors on request.

Acknowledgments

Technical guidance and support for the preparation of this article was provided by the Commonwealth Scientific and Industrial Research Organization (CSIRO)—Environment Business Unit. The authors have reviewed and edited the output and take full responsibility for the content of this publication.

Conflicts of Interest

Authors Paula Masiá Lillo, Susantha Udagedara and Ross Williamson were employed by the company Blue Resources Trust. Author Daniel Gorman declares that the research was conducted in the absence of any commercial or financial relationships that could be construed as a potential conflict of interest.

References

  1. Cole, M.; Lindeque, P.; Halsband, C.; Galloway, T.S. Microplastics as contaminants in the marine environment: A review. Mar. Pollut. Bull. 2011, 62, 2588–2597. [Google Scholar] [CrossRef]
  2. do Sul, J.A.I.; Costa, M.F. The present and future of microplastic pollution in the marine environment. Environ. Pollut. 2014, 185, 352–364. [Google Scholar] [CrossRef]
  3. Pozo, K.; Urbina, W.; Gómez, V.; Torres, M.; Nuñez, D.; Přibylová, P.; Audy, O.; Clarke, B.; Arias, A.; Tombesi, N.; et al. Persistent organic pollutants sorbed in plastic resin pellet—“Nurdles” from coastal areas of Central Chile. Mar. Pollut. Bull. 2020, 151, 110786. [Google Scholar] [CrossRef]
  4. Fernandino, G.; Elliff, C.; Reimão, I.; Bittencourt, A. How many pellets are too many? The pellet pollution index as a tool to assess beach pollution by plastic resin pellets in Salvador, Bahia, Brazil. Rev. Gest. Costeira Integr. 2015, 15, 325–332. [Google Scholar] [CrossRef]
  5. Falih, M.S.; Abbas, R.N.; Alshammary, A.G.; Ati, E.M.; Al-Lami, A.M.A. Ecological effects of plastic pollution: A review. J. Crit. Rev. 2020, 7. [Google Scholar] [CrossRef]
  6. Karlsson, T.M.; Arneborg, L.; Broström, G.; Almroth, B.C.; Gipperth, L.; Hassellöv, M. The unaccountability case of plastic pellet pollution. Mar. Pollut. Bull. 2018, 129, 52–60. [Google Scholar] [CrossRef] [PubMed]
  7. Bimali Koongolla, J.; Andrady, A.L.; Terney Pradeep Kumara, P.B.; Gangabadage, C.S. Evidence of microplastics pollution in coastal beaches and waters in southern Sri Lanka. Mar. Pollut. Bull. 2018, 137, 277–284. [Google Scholar] [CrossRef]
  8. Gorman, D.; Moreira, F.T.; Turra, A.; Fontenelle, F.R.; Combi, T.; Bicego, M.C.; Martins, C.D. Organic contamination of beached plastic pellets in the South Atlantic: Risk assessments can benefit by considering spatial gradients. Chemosphere 2019, 223, 608–615. [Google Scholar] [CrossRef]
  9. Rulent, J.; James, M.K.; Rameshwaran, P.; Jardine, J.E.; Katavouta, A.; Wakelin, S.; Jayathilaka, R.; Arulananthan, K.; Holt, J.; Sutton, M.A.; et al. Modelling pollutants transport scenarios based on the X-Press Pearl disaster. Mar. Pollut. Bull. 2024, 209, 117129. [Google Scholar] [CrossRef]
  10. Gregory, M.R.; Andrady, A.L. Plastics in the Marine Environment. In Plastics and the Environment; Andrady, A.L., Ed.; Wiley: Hoboken, NJ, USA, 2003; pp. 379–401. [Google Scholar]
  11. Balthazar-Silva, D.; Turra, A.; Moreira, F.T.; Camargo, R.M.; Oliveira, A.L.; Barbosa, L.; Gorman, D. Rainfall and tidal cycle regulate seasonal inputs of microplastic pellets to sandy beaches. Front. Environ. Sci. 2020, 8, 123. [Google Scholar] [CrossRef]
  12. Ghosh, S.; Sinha, J.K.; Ghosh, S.; Vashisth, K.; Han, S.; Bhaskar, R. Microplastics as an Emerging Threat to the Global Environment and Human Health. Sustainability 2023, 15, 10821. [Google Scholar] [CrossRef]
  13. Peña, S.Á. Plastic Pellet Spill Highlights Huge Pollution Problem in EU, and Beyond. 2024. Available online: https://www.pewtrusts.org/en/research-and-analysis/articles/2024/03/07/plastic-pellet-spill-highlights-huge-pollution-problem-in-eu-and-beyond (accessed on 18 June 2024).
  14. Meiffren-Swango, C. Millions of Tiny Plastic Pellets Are Being Dumped into Our Waterways. 2024. Available online: https://environmentamerica.org/articles/millions-of-tiny-plastic-pellets-are-being-dumped-into-our-waterways/ (accessed on 18 June 2024).
  15. Tunnell, J.W.; Dunning, K.H.; Scheef, L.P.; Swanson, K.M. Measuring plastic pellet (nurdle) abundance on shorelines throughout the Gulf of Mexico using citizen scientists: Establishing a platform for policy-relevant research. Mar. Pollut. Bull. 2020, 151, 110794. [Google Scholar] [CrossRef] [PubMed]
  16. Jiang, X.; Lu, K.; Tunnell, J.W.; Liu, Z. The impacts of weathering on concentration and bioaccessibility of organic pollutants associated with plastic pellets (nurdles) in coastal environments. Mar. Pollut. Bull. 2021, 170, 112592. [Google Scholar] [CrossRef] [PubMed]
  17. Au, S.Y.; Lee, C.M.; Weinstein, J.E.; van den Hurk, P.; Klaine, S.J. Trophic transfer of microplastics in aquatic ecosystems: Identifying critical research needs. Integr. Environ. Assess. Manag. 2017, 13, 505–509. [Google Scholar] [CrossRef]
  18. Foo, Y.H.; Ratnam, S.; Lim, E.V.; Abdullah, M.; Molenaar, V.J.; Hwai, A.T.S.; Zhang, S.F.; Li, H.J.; Zanuri, N.B.M. Microplastic ingestion by commercial marine fish from the seawater of Northwest Peninsular Malaysia. PeerJ 2022, 10, e13181. [Google Scholar] [CrossRef]
  19. Jovanovic, B. Ingestion of microplastics by fish and its potential consequences from a physical perspective. Integr. Environ. Assess. Manag. 2017, 13, 510–515. [Google Scholar] [CrossRef]
  20. Nam, K.B.; Kim, M.; Hong, M.J.; Kwon, Y.S. Plastic debris ingestion by seabirds on the Korean Peninsula. Mar. Pollut. Bull. 2021, 166, 112240. [Google Scholar] [CrossRef]
  21. Wang, J.; Liu, X.; Li, Y.; Powell, T.; Wang, X.; Wang, G.; Zhang, P. Microplastics as contaminants in the soil environment: A mini-review. Sci. Total Environ. 2019, 691, 848–857. [Google Scholar] [CrossRef]
  22. Wang, W.; Ge, J.; Yu, X.; Li, H. Environmental fate and impacts of microplastics in soil ecosystems: Progress and perspective. Sci. Total Environ. 2020, 708, 134841. [Google Scholar] [CrossRef]
  23. Kim, Y.N.; Yoon, J.H.; Kim, K.H.J. Microplastic contamination in soil environment—A review. Soil Sci. Annu. 2021, 71, 300–308. [Google Scholar] [CrossRef]
  24. Bancone, C.; Rose, P.N.; Francis, R. Temporal distribution and seasonal fluxes of microplastics in the sediments of UK rural and urban lakes. In Proceedings of the EGU General Assembly Conference Abstracts, Online, 4–8 May 2020; p. 19776. [Google Scholar]
  25. de Carvalho, A.R.; Garcia, F.; Riem-Galliano, L.; Tudesque, L.; Albignac, M.; ter Halle, A.; Cucherousset, J. Urbanization and hydrological conditions drive the spatial and temporal variability of microplastic pollution in the Garonne River. Sci. Total Environ. 2021, 769, 144479. [Google Scholar] [CrossRef] [PubMed]
  26. Gorman, D.; Turra, A. Mangrove revegetation as a means of restoring macrofaunal communities along degraded coasts. In Proceedings of the ECSA 57 Changing Estuaries, Coasts and Shelf Systems—Diverse Threats and Opportunities, Perth, Australia, 3–6 September 2018. [Google Scholar]
  27. Huang, Y.; Xiao, X.; Xu, C.; Perianen, Y.D.; Hu, J.; Holmer, M. Seagrass beds acting as a trap of microplastics—Emerging hotspot in the coastal region? Environ. Pollut. 2020, 257, 113450. [Google Scholar] [CrossRef] [PubMed]
  28. Dahl, M.; Bergman, S.; Björk, M.; Diaz-Almela, E.; Granberg, M.; Gullström, M.; Leiva-Dueñas, C.; Magnusson, K.; Marco-Méndez, C.; Piñeiro-Juncal, N.; et al. A temporal record of microplastic pollution in Mediterranean seagrass soils. Environ. Pollut. 2021, 273, 116451. [Google Scholar] [CrossRef]
  29. He, L.; Ou, Z.; Fan, J.; Zeng, B.; Guan, W. Research on the non-point source pollution of microplastics. Front Chem 2022, 10, 956547. [Google Scholar] [CrossRef]
  30. Pattiaratchi, C.; van der Mheen, M.; Schlundt, C.; Narayanaswamy, B.E.; Sura, A.; Hajbane, S.; White, R.; Kumar, N.; Fernandes, M.; Wijeratne, S. Plastics in the Indian Ocean—Sources, transport, distribution, and impacts. Ocean Sci. 2022, 18, 1–28. [Google Scholar] [CrossRef]
  31. Hassan, P.; Camille, L.; Stephane, L.F.; Luigi, A. X-Press Pearl Maritime Disaster Sri Lanka-Report of the UN Environmental Advisory Mission July 2021, in UN Environmental Advisory Mission. UN. 2021. Available online: https://wedocs.unep.org/bitstream/handle/20.500.11822/36608/XPress.pdf?sequence=1&isAllowed=y (accessed on 21 June 2023).
  32. Rubesinghe, C.; Brosché, S.; Withanage, H.; Pathragoda, D.; Karlsson, T. Press Pearl, a ‘new kind of oil spill’ consisting of a toxic mix of plastics and invisible chemicals. Int. Pollut. Elimin. Netw. (IPEN) 2022. [Google Scholar] [CrossRef]
  33. Karthik, R.; Robin, R.S.; Purvaja, R.; Karthikeyan, V.; Subbareddy, B.; Balachandar, K.; Hariharan, G.; Ganguly, D.; Samuel, V.D.; Jinoj, T.P.S.; et al. Microplastic pollution in fragile coastal ecosystems with special reference to the X-Press Pearl maritime disaster, southeast coast of India. Environ. Pollut. 2022, 305, 17. [Google Scholar] [CrossRef] [PubMed]
  34. Perera, U.; Subasinghe, H.C.S.; Ratnayake, A.S.; Wijewardhana, W.; Wijewardhana, T.D.U. Maritime pollution in the Indian Ocean after the MV X-Press Pearl accident. Mar. Pollut. Bull. 2022, 185, 11. [Google Scholar] [CrossRef]
  35. de Vos, A.; Aluwihare, L.; Youngs, S.; DiBenedetto, M.H.; Ward, C.P.; Michel, A.P.M.; Colson, B.C.; Mazzotta, M.G.; Walsh, A.N.; Nelson, R.K.; et al. The M/V X-Press Pearl Nurdle Spill: Contamination of Burnt Plastic and Unburnt Nurdles along Sri Lanka’s Beaches. ACS Environ. Au 2022, 2, 128–135. [Google Scholar] [CrossRef]
  36. Burt, T.P.; Weerasinghe, K.D.N. Rainfall Distributions in Sri Lanka in Time and Space: An Analysis Based on Daily Rainfall Data. Climate 2014, 2, 242–263. [Google Scholar] [CrossRef]
  37. Shankar, D.; Vinayachandran, P.N.; Unnikrishnan, A.S. The monsoon currents in the north Indian Ocean. Prog. Oceanogr. 2002, 52, 63–120. [Google Scholar] [CrossRef]
  38. De Vos, A.; Pattiaratchi, C.B.; Wijeratne, E.M.S. Surface circulation and upwelling patterns around Sri Lanka. Biogeosciences 2014, 11, 5909–5930. [Google Scholar] [CrossRef]
  39. Jayathilaka, R.; Weerakoon, W.; Indika, K.W.; Arulananthan, K.; Kithsiri, H.M.P. Spatio-temporal variation of plastic pellets dispersion in the coastline of Sri Lanka: An assessment of pellets originated from the X-Press Pearl incident during the Southwest monsoon in 2021. Mar. Pollut. Bull. 2022, 184, 114145. [Google Scholar] [CrossRef] [PubMed]
  40. Sewwandi, M.; Amarathunga, A.A.D.; Wijesekara, H.; Mahatantila, K.; Vithanage, M. Contamination and distribution of buried microplastics in Sarakkuwa beach ensuing the MV X-Press Pearl maritime disaster in Sri Lankan sea. Mar. Pollut. Bull. 2022, 184, 114074. [Google Scholar] [CrossRef]
  41. Jain, V.; Amol, P.; Fernando, V.; Michael, G.S.; Aparna, S.G.; Kankonkar, A.; Tari, P.A.; Gaonkar, M.G.; Satelkar, N.P.; Khalap, S.T. Observed current variability in Gulf of Mannar. J. Earth Syst. Sci. 2021, 130, 197. [Google Scholar] [CrossRef]
  42. Indika, K.W.; Wijerathne, E.M.S.; Fernando, G.W.A.R. Sea Level Variability in the West Coast of Sri Lanka. 2017. Available online: http://192.248.104.6/handle/345/1753 (accessed on 22 August 2024).
  43. Moreira, F.T.; Balthazar-Silva, D.; Barbosa, L.; Turra, A. Revealing accumulation zones of plastic pellets in sandy beaches. Environ. Pollut. 2016, 218, 313–321. [Google Scholar] [CrossRef]
  44. Gorman, D.; Gutiérrez, A.R.; Turra, A.; Manzano, A.B.; Balthazar-Silva, D.; Oliveira, N.R.; Harari, J. Predicting the Dispersal and Accumulation of Microplastic Pellets Within the Estuarine and Coastal Waters of South-Eastern Brazil Using Integrated Rainfall Data and Lagrangian Particle Tracking Models. Front. Environ. Sci. 2020, 8, 559405. [Google Scholar] [CrossRef]
  45. Fisner, M.; Majer, A.P.; Balthazar-Silva, D.; Gorman, D.; Turra, A. Quantifying plastic pellets on sandy beaches: The conundrum of large sample variation and spatial heterogeneity. Environ. Sci. Pollut. Res. 2017, 24, 13732–13740. [Google Scholar] [CrossRef]
  46. Adomat, Y.; Kahl, M.; Musche, F.; Grischek, T. Evaluation of microplastics sediment sampling techniques—Efficiency of common methods and new approaches. Microplast. Nanoplast. 2022, 2, 27. [Google Scholar] [CrossRef]
  47. Sewwandi, M.; Hettithanthri, O.; Egodage, S.M.; Amarathunga, A.A.D.; Vithanage, M. Unprecedented marine microplastic contamination from the X-Press Pearl container vessel disaster. Sci. Total Environ. 2022, 828, 154374. [Google Scholar] [CrossRef]
  48. Retnamma, J.; Kalathil, B.K.; Loganathan, J.; Chinnadurai, K.; Gupta, G.V.M.; Chakraborty, K.; Sahu, K.C. Why the Gulf of Mannar is a marine biological paradise? Environ. Sci. Pollut. Res. 2021, 28, 64892–64907. [Google Scholar] [CrossRef] [PubMed]
  49. Kandeyaya, K.B.K.D.K.; Ranatunga, S.; Ranatunga, R.R.M.K.P. Occurrence of microplastics in some commercially important seafood varieties from Negombo, Sri Lanka. Reg. Stud. Mar. Sci. 2023, 62, 102958. [Google Scholar] [CrossRef]
  50. Lawan, P.L.M.J.H.; De Silva, D.S.M.; Amarathunga, A.A.D.; McGoran, A.; Bakir, A.; Sivyer, D.B.; Reeve, C. Microplastic Contamination in Shrimps from the Negombo Lagoon—Sri Lanka. Water 2024, 16, 447. [Google Scholar] [CrossRef]
  51. Cesarini, G.; Secco, S.; Battisti, C.; Questino, B.; Marcello, L.; Scalici, M. Temporal changes of plastic litter and associated encrusting biota: Evidence from Central Italy (Mediterranean Sea). Mar. Pollut. Bull. 2022, 181, 113890. [Google Scholar] [CrossRef]
  52. Qian, Y.; Shang, Y.; Zheng, Y.; Jia, Y.; Wang, F. Temporal and spatial variation of microplastics in Baotou section of Yellow River, China. J. Environ. Manag. 2023, 338, 117803. [Google Scholar] [CrossRef]
  53. Reethu, M.; Biswajit, R.; Aravind, G.H.; Rafaz, A.K.; Sandeep, K.; Sijinkumar, A.V.; Warrier, A.K. A first report on the spatial and temporal variability of microplastics in coastal soils of an urban town in south-western India: Pre- and post-COVID scenario. Mar. Pollut. Bull. 2023, 190, 114888. [Google Scholar] [CrossRef]
  54. Ranatunga, R.R.M.K.P.; Wijetunge, D.; Karunarathna, K.N.P. Microplastics in beach sand and potential contamination of planktivorous fish Sardinella gibbosa inhabiting in coastal waters of Negombo, Sri Lanka. Sri Lanka J. Aquat. Sci. 2021, 26, 37–54. [Google Scholar] [CrossRef]
  55. Sevwandi Dharmadasa, W.L.S.; Andrady, A.L.; Kumara, P.B.T.P.; Maes, T.; Gangabadage, C.S. Microplastic pollution in Marine Protected Areas of Southern Sri Lanka. Mar. Pollut. Bull. 2021, 168, 112462. [Google Scholar] [CrossRef]
  56. Athawuda, A.M.G.A.D.; Jayasiri, H.B.; Thushari, G.G.N.; Guruge, K.P.G.K.P. Quantification and morphological characterization of plastic litter (0.30–100 mm) in surface waters of off Colombo, west coast of Sri Lanka. Environ. Monit. Assess. 2020, 192, 509. [Google Scholar] [CrossRef]
  57. Pattiaratchi, C.; Wijeratne, S.; de Vos, A. Ocean circulation around Sri Lanka. J. Natl. Sci. Found. Sri Lanka 2022, 50, 293–302. [Google Scholar] [CrossRef]
  58. Gorman, D.; Gutiérrez, A.; Turra, A.; Manzano, A.B.; Balthazar-Silva, D.; Oliveira, N.R.; Harari, J. Integrating rainfall data and Lagrangian models to predict the dispersal and accumulation of microplastics within the estuarine and coastal waters of the Santos region, south eastern Brazil. Front. Ecol. Environ. 2020, 8. [Google Scholar] [CrossRef]
  59. Menikpura, S.N.M.; Gheewala, S.H.; Bonnet, S. Sustainability assessment of municipal solid waste management in Sri Lanka: Problems and prospects. J. Mater. Cycles Waste Manag. 2012, 14, 181–192. [Google Scholar] [CrossRef]
  60. Piyumali, H.; Sewwandi, M.; Atugoda, T.; Wijesekara, H.; Mahatantila, K.; Vithanage, M. Microplastic Abundance, Characteristics, and Heavy Metal Contamination in Coastal Environments of Western Sri Lanka. Phys. Chem. Earth Parts A/B/C 2024, 136, 103770. [Google Scholar] [CrossRef]
  61. Andreussi, C.K.; Harari, J.; Zanetti, D.G.; Leonel, J. Plastic pellet pathways: Understanding transport patterns to Santa Catarina Island, Southwestern Atlantic Ocean. Mar. Pollut. Bull. 2024, 208, 116944. [Google Scholar] [CrossRef]
  62. Izar, G.M.; Morais, L.G.; Pereira, C.D.S.; Cesar, A.; Abessa, D.M.S.; Christofoletti, R.A. Quantitative analysis of pellets on beaches of the Sao Paulo coast and associated non-ingested ecotoxicological effects on marine organisms. Reg. Stud. Mar. Sci. 2019, 29, 11. [Google Scholar] [CrossRef]
  63. Thornton, L.; Jackson, N.L. Spatial and temporal variations in debris accumulation and composition on an estuarine shoreline, Cliffwood Beach, New Jersey, USA. Mar. Pollut. Bull. 1998, 36, 705–711. [Google Scholar] [CrossRef]
  64. Forsberg, P.L.; Sous, D.; Stocchino, A.; Chemin, R. Behaviour of plastic litter in nearshore waters: First insights from wind and wave laboratory experiments. Mar. Pollut. Bull. 2020, 153, 111023. [Google Scholar] [CrossRef]
  65. Moreira, F.T.; Prantoni, A.L.; Martini, B.; de Abreu, M.A.; Stoiev, S.B.; Turra, A. Small-scale temporal and spatial variability in the abundance of plastic pellets on sandy beaches: Methodological considerations for estimating the input of microplastics. Mar. Pollut. Bull. 2016, 102, 114–121. [Google Scholar] [CrossRef]
  66. Turra, A.; Manzano, A.B.; Dias, R.J.S.; Mahiques, M.M.; Barbosa, L.; Balthazar-Silva, D.; Moreira, F.T. Three-dimensional distribution of plastic pellets in sandy beaches: Shifting paradigms. Sci. Rep. 2014, 4, 7. [Google Scholar] [CrossRef]
  67. UNEP. X-Press Pearl Maritime Disaster: Sri Lanka. In Report of the UN Environmental Advisory Mission; United Nations Environment Programme, & United Nations Office for the Coordination of Humanitarian Affairs: Nairobi, Kenya, 2021. [Google Scholar]
  68. Daily FT. Coca-Cola Sri Lanka Unveils First-of-Its-Kind ‘Adopt A Beach’ in Partnership with Clean Ocean Force. 2022. Available online: https://www.ft.lk/csrevents/Coca-Cola-Sri-Lanka-unveils-first-of-its-kind-Adopt-A-Beach-in-partnership-with-Clean-Ocean-Force/38-731853 (accessed on 15 March 2023).
  69. Fisner, M.; Majer, A.; Taniguchi, S.; Bícego, M.; Turra, A.; Gorman, D. Color and composition determine the concentration and composition of polycyclic aromatic hydrocarbons (PAHs) in plastic pellets. Mar. Pollut. Bull. 2017, 122, 323–330. [Google Scholar] [CrossRef]
  70. Gunawardhana, G.M.S.S.; Perera, U.L.H.P.; Ratnayake, A.S.; Weerasingha, W.A.D.B.; Subasinghe, H.C.S. Formation of secondary microplastics during degradation of plastics originating from the MV X-Press Pearl maritime disaster. Discov. Environ. 2024, 2, 22. [Google Scholar] [CrossRef]
  71. The Maritime. Shanghai Salvage Wins Contract to Remove Wreck of the X-Press Pearl. 2021. Available online: https://maritime-executive.com/article/shanghai-salvage-wins-contract-to-remove-wreck-of-the-x-press-pearl (accessed on 14 May 2024).
Figure 1. (A) Map showing the 70-kilometre stretch of coastline that was heavily impacted by the spill. (B) Survey locations along the central west coast. (C) Photos of the variety of beached plastic pellets released from the X-Press Pearl.
Microplastics 04 00037 g001
Figure 2. Comparison of the surface density of different types of microplastic particles sampled from beach sediments at three different tidal heights and five sites along the west coast of Sri Lanka. Codes on the RHS correspond to sites: S1—Waikkala Beach, S2—Dungalpitiya Beach, S3—Uswetakeiyawa Beach, S4—Wellawatte Beach, and S5—Panadura Beach.
Microplastics 04 00037 g002
Figure 3. Summary of the mean estimates of pellets per m2 sampled vertically using a 7.5 cm corer that incorporated a depth gradient (to 30 cm) at five ocean beach sites along the central-west coast of Sri Lanka.
Microplastics 04 00037 g003
Table 1. Summary of the mean (±SD) beach surface pellets per m2 sampled from the lower, upper and backshore tidal heights (n = 3 replicates per site) from five beach sites along the central-west coast of Sri Lanka. SEM = Standard error of the mean. Superscript letters indicate significant homogenous subsets derived from Tukey HSD. Results of two-way ANOVA testing the number of pellets sampled across sites and tidal heights.
Sampling SiteTidal HeightPellet DensityMean % Burnt
(m2 ± SEM)
S1. Waikkala Beach aLow a0.3 ± 0.60
High a54.3 ± 46.31
Backshore a1 ± 10
S2. Dungalpitiya Beach aLow a0 ± 00
High b355 ± 241.23
Backshore ab6.7 ± 8.10
S3. Uswetakeiyawa Beach aLow a0.3 ± 0.60
High a7.3 ± 50
Backshore a0.7 ± 1.20
S4. Wellawatte Beach bLow a37.3 ± 32.514
High b1408.3 ± 544.50
Backshore a320 ± 229.99
S5. Panadura Beach aLow a2 ± 20
High b11 ± 10
Backshore a0.7 ± 0.60
SourcedfMean SquareFSig.
Site4569,832.8920.81<0.001
Height2558,018.6020.38<0.001
Site × Height8285,177.9110.41<0.001
Error3027,384.67
Total45
Disclaimer/Publisher’s Note: The statements, opinions and data contained in all publications are solely those of the individual author(s) and contributor(s) and not of MDPI and/or the editor(s). MDPI and/or the editor(s) disclaim responsibility for any injury to people or property resulting from any ideas, methods, instructions or products referred to in the content.

