Article

Quantification of Microplastics by Pyrolysis Coupled with Gas Chromatography and Mass Spectrometry in Sediments: Challenges and Implications

1
Leesu, Ecole des Ponts, Université Paris Est Creteil, F-94010 Creteil, France
2
UMR METIS, Sorbonne Université, F-75005 Paris, France
3
LEE, Universite Gustave Eiffel, F-44344 Bouguenais, France
*
Author to whom correspondence should be addressed.
Microplastics 2022, 1(2), 229-239; https://doi.org/10.3390/microplastics1020016
Submission received: 14 January 2022 / Revised: 13 March 2022 / Accepted: 17 March 2022 / Published: 28 March 2022

Abstract

:
Pyrolysis-GC/MS is increasingly used to quantify microplastics (MP) in environmental samples. In general, prior to analysis, purification steps are carried out to reduce the environmental matrix in sediment samples. The conventionally used protocol of density separation followed by digestion of organic matter does not allow for complete isolation of MP from the associated organic and mineral matter. Among the pyrolysis products used as indicator compounds for plastic polymers, some may originate from other substances present in the environmental samples. In this paper, the indicator compounds are reviewed for the most common polymers: PE, PP, PS, PET and PVC and selected taking into account potential interactions with substances present in environmental matrices. Even after a purification step, a residual mineral fraction remains in a sediment sample, including matrix effects. This effect may be positive or negative, depending on the investigated polymer and is thus important to consider when using Pyr-GC/MS for the quantification of MP in sediment samples. It also shows that no external calibration can be used to reliably quantify MP in such samples and that the use of internal standards is compulsory.

1. Introduction

For the past two decades, microplastics (MP) have been identified as a risk to the environment and numerous studies have been carried out. Most of the time, MP quantification is based on the observation and the characterization of a sub-sample by either Fourier transform infrared (FT-IR) or Raman microspectroscopy [1,2]. The results are expressed as a number of particles per unit of area or volume. These methods allow for determining the morphological characteristics and size distribution of the particles which are primordial for the assessment of ecotoxicological risk [3]. Mass is sometimes approximated from calculations integrating the number, shape and density of particles [4], but the reliability of such an approximation is questionable. Primpke et al. [5] showed that mass estimation was even more difficult for larger particles whose mass is overestimated. Moreover, spectroscopic methods are unable to characterize particles below a limit resolution (1 to 25 µm depending on the method and the equipment), while it was reported that the toxicity increases when the size of the particles decreases [6].
More recently, pyrolysis coupled with gas chromatography and mass spectrometry (Pyr-GC/MS) has been developed to detect [7,8] and quantify MP polymers in environmental samples [9,10,11,12,13]. Unlike spectroscopic methods, Pyr-GC/MS allows the complete molecular characterization of the particles, without minimal size limitations [14].
Prior to Pyr-GC/MS analysis, environmental samples undergo purification steps to isolate MP from the environmental matrix. However, this purification is not complete, and several organic and mineral constituents survive these treatment steps, especially in complex matrices such as sediments or soils. Hurley et al. [15] reported that the efficiency of removing organic matter from soil varied from 34% to 108% depending on the used reagent (H2O2, Fenton’s reagent, NaOH, KOH). These remaining particles will hamper the characterization and quantification of MP particles through Pyr-GC/MS. Upon thermal cracking, the polymers release pyrolysis products of lower molecular weight. Some of these products are defined as indicator compounds when they allow the detection of targeted polymers. However, some constituents of the remaining natural organic matter may release the same pyrolysis products as the targeted polymers [15,16,17,18], hence a potential MP overestimation. The identification of pyrolysis products that are specific to the targeted polymers is therefore necessary.
Moreover, the mineral matrix initially associated with MP in sediments and soils survives the aforementioned purification procedures. Such minerals, especially clay, were reported to adsorb pyrolysis products and consequently lead to MP underestimation [16]. Taking into consideration the organic and mineral matrix effects is therefore crucial for the quantitative analysis of MP, especially in complex environmental samples, such as soil and sediments.
The aim of the present study is to contribute to the understanding of interferences that occur when using Pyr-GC/MS to quantify the most common plastic polymers (polyethylene (PE), polystyrene (PS), polypropylene (PP), polyethylene terephthalate (PET) and polyvinyl chloride (PVC)) in a riverine sediment sample. The microscopy FTIR analysis was used to indicate that non-plastic particles remain after purification steps, potentially hampering the selection of indicator compounds and including a matrix effect. A reappraisal of the reliability of the indicators, given the likely presence of remaining natural organic matter, is first presented, hence the selection of indicator compounds that are used for the present study. The extent of the matrix effect in these samples is then investigated. Furthermore, implications and perspectives for the development of Pyr-GC/MS for MP quantification in sediments are discussed, emphasizing the need to use internal calibrations to overcome the matrix effects induced by both organic and inorganic residual matter remaining after purification steps.

2. Materials and Methods

2.1. Sample Preparation and FTIR Analysis

A muddy surficial (0–10 cm) sediment sample (1 kg) was collected at the estuary of the Seine river near Le Havre, France (N 49°26′36.409″ E 0°16′15.445″). It was manually homogenized with a spatula and freeze-dried. To remove the densest mineral material, 30 g of dried sediments were submitted to density separation with NaI solution (d = 1.60–1.70 kg·m−3) [19]. A custom-made JAMSS (JAMSTEC Microplastic Sediment Separator) device based on drawings from Nakajima et al. [20] was used to recover the supernatant after 24 h. The supernatant was sieved at 500 µm and the upper fraction was discarded. The fraction below 500 µm was filtered with a glass vacuum filtration unit with a stainless-steel filter of 10 μm porosity and 47 mm in diameter, to remove NaI. The obtained retentate was treated with 100 mL of 30% H2O2 to remove most of the organic matter without affecting the plastic particles [15]. After heating at 40 °C for 24 h and stirring at 300 rpm, the sample was filtered on four alumina filters (Whatman Anodisc ⌀ 25 mm, 0.2 µm porosity).
The resulting filters were analyzed using FTIR imaging microscopy (Nicolet iN10 MX, Thermo Fischer Scientific, Waltham, MA, USA) to assess the nature of the residual particles. The number of particles on one of the filters was estimated using the Particle Wizard option of OMNIC Picta™ software. The SiMPle software [21] was used to process the data obtained from the µFTIR imaging analysis.

2.2. Matrix Effect Evaluation

The matrix effect was evaluated for four polymers: PP, PS, PET and PVC. External calibration curves were established for PP and PS (from Sigma-Aldrich, Munich, Germany: 428116-250G and 331651-25G, respectively). Polymer particles were weighed with a 1 µg precision balance (Mettler Toledo XPE26) to prepare pyrolysis cups with amounts ranging from 1 to 30 µg. To evaluate the matrix effect, additional cups were also prepared with 1–30 µg of PP and PS and 8 mg of sediment matrix. The added sediment matrix corresponds to the settled part of the density separation. The addition of these few mg of matrix allows for representing the residual matrix present in the sediment sample after density separation.
In addition, in order to determine whether the matrix effect depends on the matrix mass, samples were prepared with a fixed amount of polymer, 25 µg of PET (Sigma-Aldrich: 429252-250G) and 500 µg of PVC (Sigma-Aldrich: 81387-250G) mixed with 1–10 mg of matrix sediment. A higher amount of PVC was required due to its lower sensitivity as reported by Gomiero et al. (2019) [11]. To improve the detection of the polar PET pyrolysis products, 10 µL of TMAH was added as a derivatizing agent in each cup [22].

2.3. Pyrolysis Gas Chromatography–Mass Spectrometry

Pyr-GC/MS analyses were carried out with a pyrolyzer (Pyroprobe 6250, CDS) coupled to a gas chromatograph (7890B, Agilent, Santa Clara, CA, USA) and to a mass spectrometer (5977B, Agilent). Samples were pyrolyzed at 650 °C for 10 s under helium. To improve the detection sensitivity of the PET, tetramethylammonium hydroxide (TMAH 25% methanol) was added as a derivatization agent. The released pyrolysis products were on-line separated using a non-polar GC column Rxi5Sil MS (30 m × 0.25 mm × 0.5 µm, Restek, Bellefonte, PA, USA) and an oven ramp (initial temperature of 50 °C maintained during 1 min, raised at 3 °C/min until 310 °C, the final temperature, maintained during 10 min). The mass spectrometer is operated in electron impact and SCAN modes. The molecules are ionized and fragmented in an electron impact source (70 eV; 230 °C) and fragments are analyzed with a quadrupole mass spectrometer, operating at 2 scans/s from 35 to 650 m/z.

3. Results

3.1. Preselection of Indicator Compounds
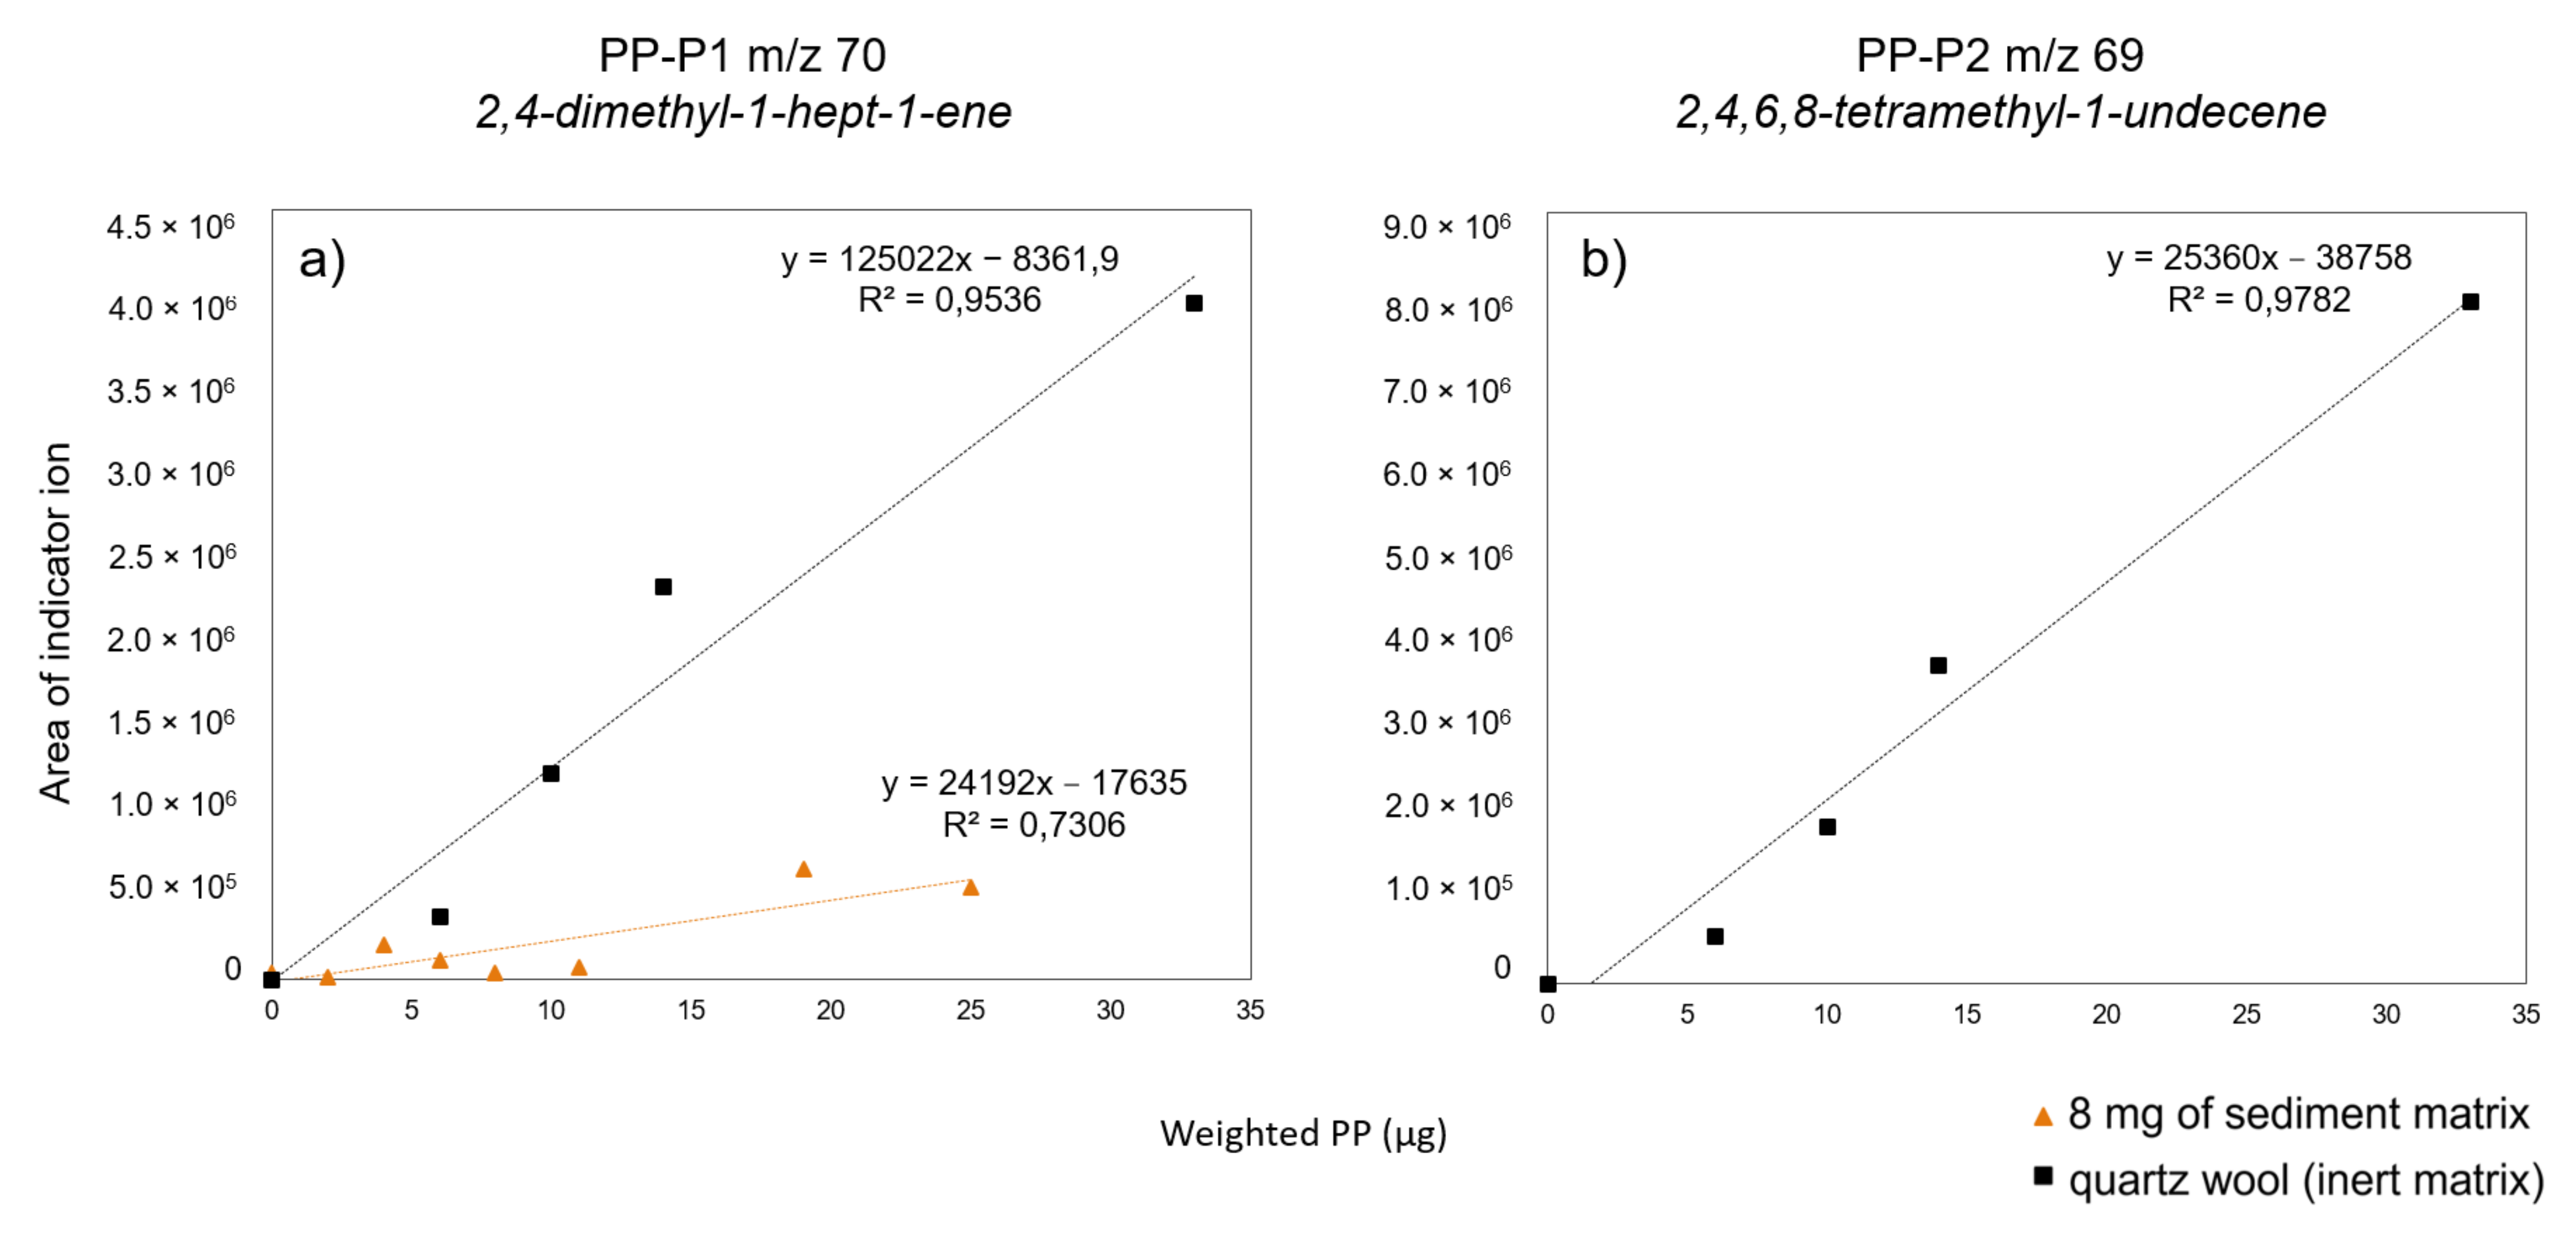
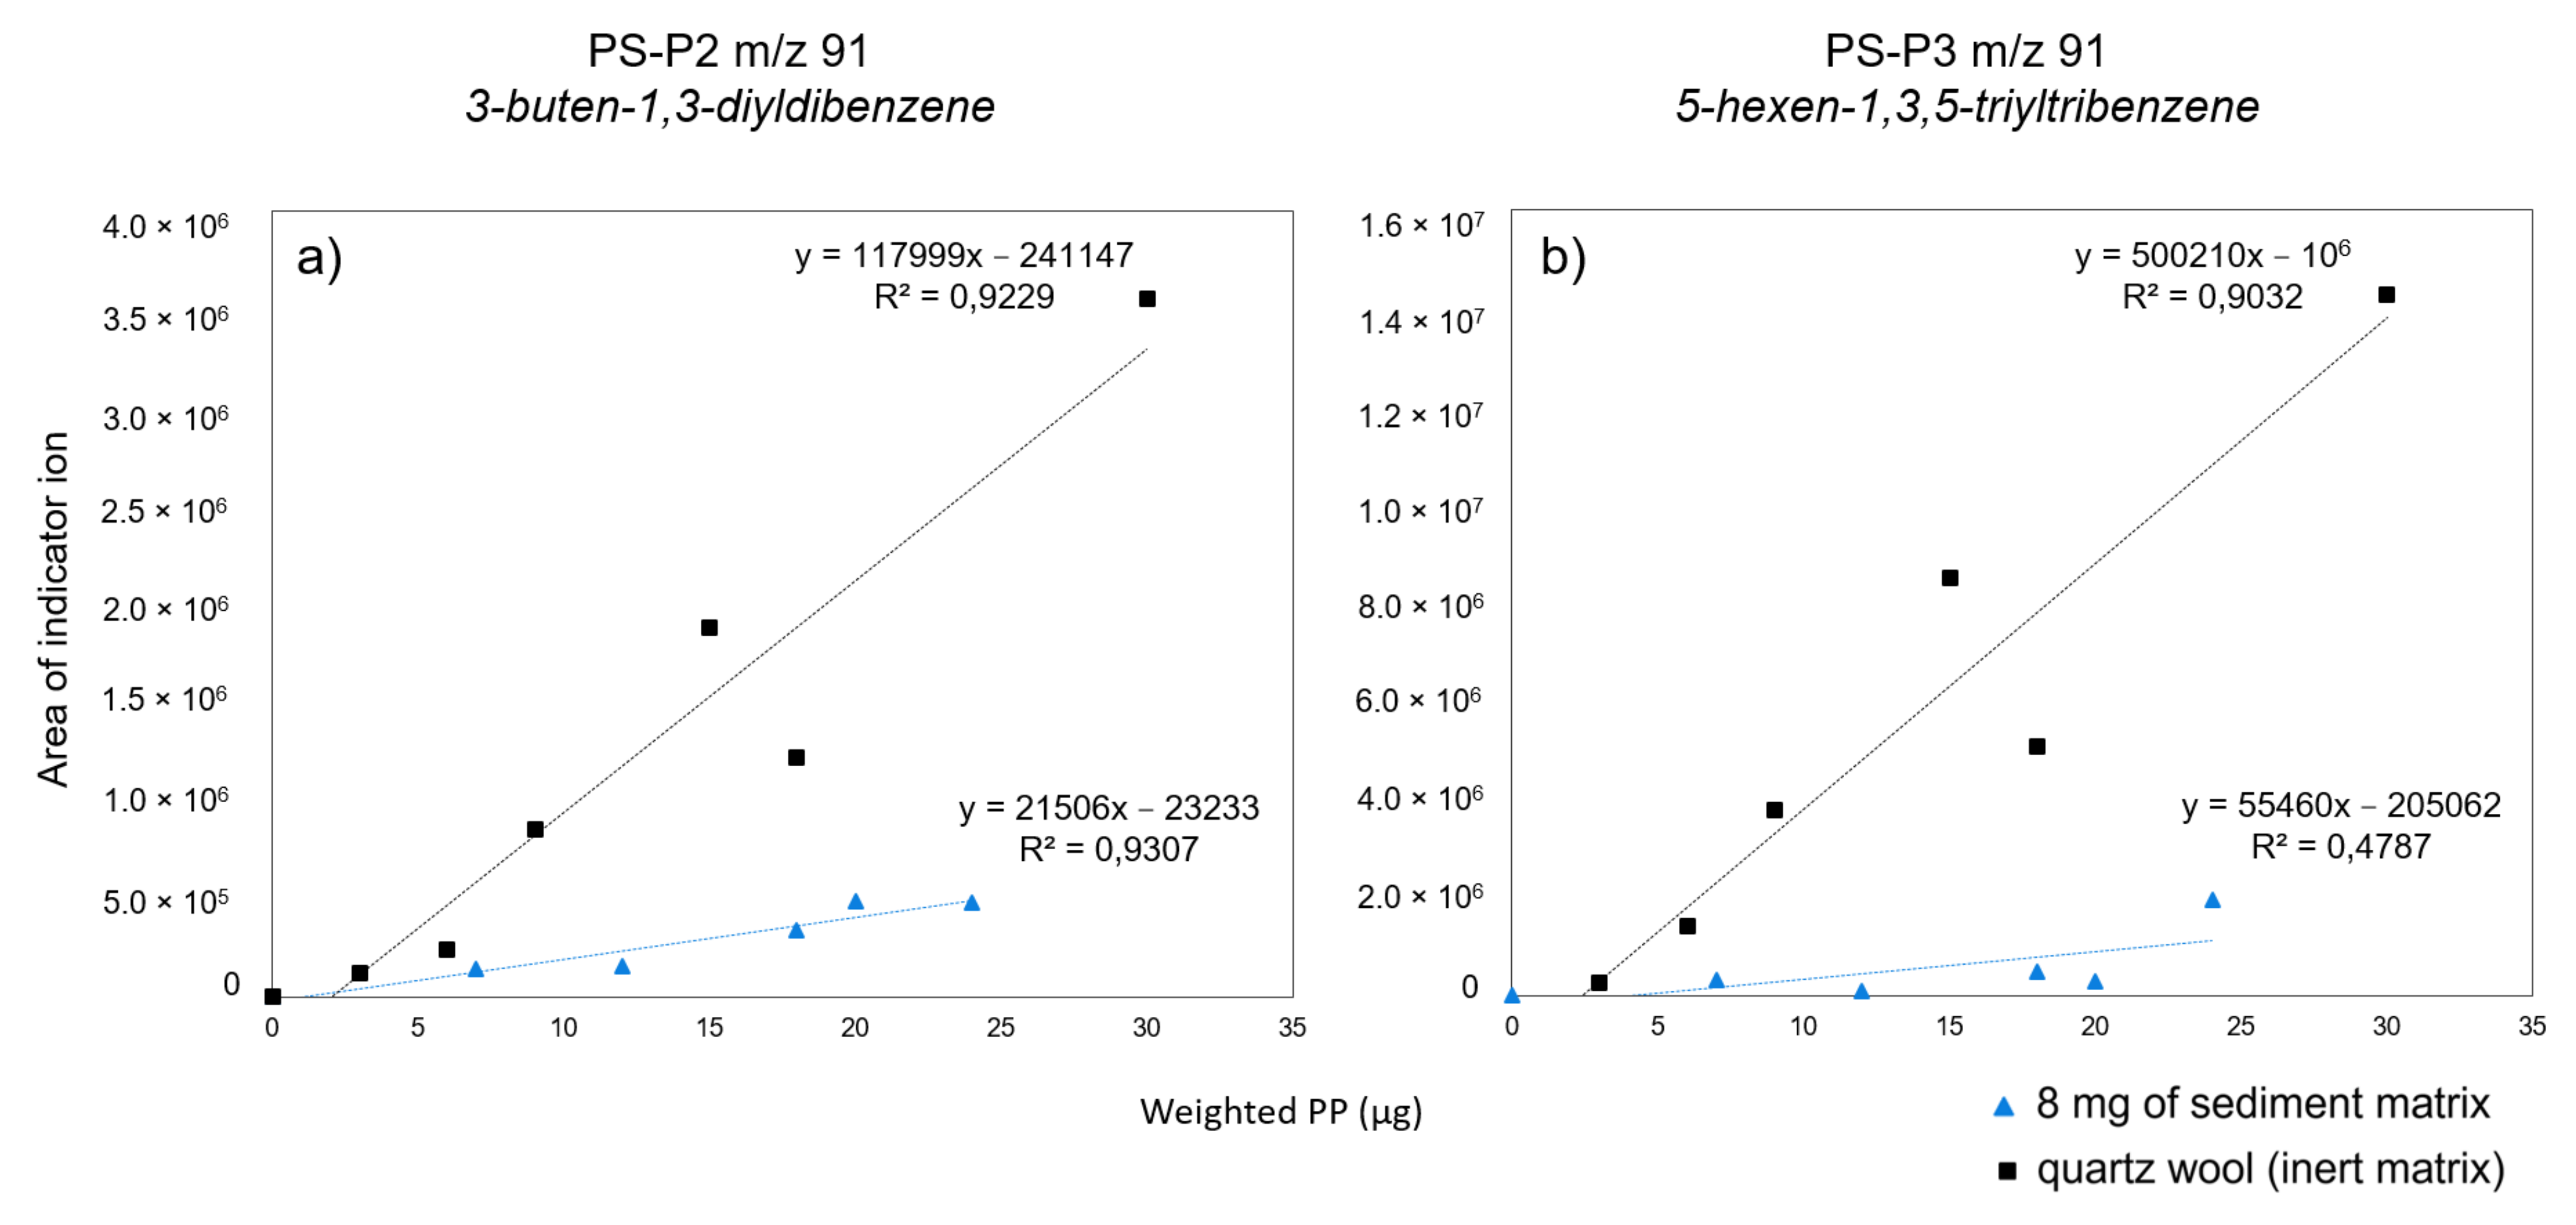
The FTIR analysis showed that a significant number of non-plastic particles remain, even after purification of the sample. Indeed, out of the 2340 particles counted, only 51 were identified as a plastic polymer. These non-plastic particles are composed of both inorganic and organic materials which, as detailed below, can generate interference with the pyrolysis products of the targeted polymers.
In order to determine the most appropriate indicator compounds for the five most common polymers in the environment, namely PE, PP, PS, PET and PVC, the literature was reviewed regarding the use of Pyr-GC/MS for MP quantification in environmental samples. Table 1 lists the indicator compounds and their fragment ions used for the quantification of polymers in these studies. The indicator compounds were usually selected through pyrolysis of pure standard polymers without environmental and sample treatment considerations. Fischer and Scholz-Böttcher, 2017 were the first to provide a database for MP quantification by analyzing eight standard polymers both individually and as a mixture and they compared their results to a database of synthetic polymers [23].
For the quantification of PE, the used compounds belong to the alkane, alkene and alkadiene triplets (C10 to C20) but the nature of the proposed indicator compound and its chain length varies between studies [9,10,11,12,22,24,25]. However, these compounds were reported upon pyrolysis of many natural environmental substances, such as higher plant constituents [26,27,28] and their fossil counterparts [29], sediments [30,31] including coals [32], as well as particulate organic matter and humic substances. As a result, the quantification of PE in the environment can only be confidently achieved after the complete removal of the natural organic matter, which is barely checked. Complete removal of natural organic matter without damaging plastic polymers is, up-to-date, not achievable. Taking this into account, the PE was discarded from the polymers to be analyzed in the presently investigated sediment sample.
For PP, the most abundant pyrolysis product 2,4-dimethyl-1-heptene (PP-P1, Table 1) is commonly used as an indicator compound [9,10,12,22,25], although Gomiero et al. [11] instead proposed the 2,4,6,8-tetramethyl-1-undecene (PP-P2, Table 1). Due to the specific pattern of their branching, these compounds cannot originate from natural organic matter, making them reliable indicator compounds for PP quantification.
In the case of PS, styrene is the most abundant pyrolysis product, and it was used in several studies for PS quantification [15,25]. However, with styrene being formed upon pyrolysis of phenylalanine [34,35], it was reported in the pyrolysates of numerous environmental samples, such as peats [36], soil, compost and green waste [37], sludge [38], sediments and marine particulate organic matter [39]. Nevertheless, it was noted that in the natural environments, the styrene-to-toluene ratio ranges between 0.1 and 0.4 [40] and it was thus proposed to consider that styrene originates from PS only when this ratio is higher than 1 [37]. Although this approach is useful to assess the PS source of styrene, it cannot be used to accurately quantify PS. Other compounds, present in lower abundance in the pyrolysate but more specific, must be used for PS quantification. In this way, the styrene dimer and/or trimer (PS-P2 and PS-P3, Table 1) are reliable indicator compounds for PS quantification and were chosen in several studies.
The most abundant pyrolysis product of PVC is benzene (PVC-P1, Table 1), a ubiquitous and thus unspecific pyrolysis product in environmental samples [41]. Similarly, the methylnaphthalene (PVC-P2, Table 1) that is a ubiquitous pyrolysis compound of natural organic matter was also mentioned as an indicator compound of PVC [38,42]. As a result, although benzene and methylnaphthalene were sometimes used for PVC quantification, it is essential to use chlorobenzene (PVC-P3, Table 1) to establish reliable calibration curves. Indeed, although formed in low abundance compared to benzene and methylnaphthalene, this compound is highly specific to the pyrolysis of PVC.
As for PET, benzoic acid and vinyl benzoate are the most abundant pyrolysis products [43]. These are polar pyrolysis products that have a low resolution when GC/MS analysis is performed using an apolar column. A tailing effect of the peaks is observed, which can lead to co-elution problems and complicates the peak integration. This drawback could be overcome by using a polar column but it would lead to poor detection of the pyrolysis products of the other polymers, thus preventing a simultaneous analysis of all polymers. However, as the benzoic acid is formed through decarboxylation of the monomer, this side reaction can be limited through the use of TMAH as derivatizing agent [44]. In the presence of TMAH, the most abundant pyrolysis product by far is the 1,4-dimethylterephthalate, which can thus be used for quantification [10,11,22]. When quantification of MP includes PET, we therefore recommend performing the pyrolysis in the presence of TMAH. It must be noted that this has no impact on the aforementioned pyrolysis products of the PP, PS and PVC as they do not contain OH or NH groups and are thus unaffected by TMAH. In addition to the interferences associated with natural organic matter, it must be noted that styrene and benzene proposed as indicator compounds of PS and PP, respectively, are also produced, although in small amounts, upon pyrolysis of PET without TMAH.

3.2. Matrix Effect

As a mineral residue is still observed in the supernatant after density separation, a matrix effect can be anticipated. To investigate its extent, calibration curves were established with 1 to 30 µg of MP (PP and PS) in the presence of matrix (8 mg of the settled part after density separation) and compared with the curves obtained with quartz wool, considered as an inert matrix.
For PP, the two aforementioned indicator compounds, 2,4-dimethyl-1-hept-1-ene (PP-P1) and 2,4,6,8-tetramethyl-1-undecene (PP-P2) were used. The m/z 70 ion was chosen to establish the calibration curves with PP-P1, as in the study of Fischer and Scholz-Böttcher [10,22]. This ion was preferred to the m/z 126 molecular ion that is used in some studies [9,12] because of its higher intensity. For PP-P2, the m/z 69 ion was selected for the calibration curve, as in Gomiero et al. [11], due to its higher intensity than the m/z 210 molecular ion.
For PP-P1, the slope of the calibration curve is more than five times lower in the presence of sediment matrix (Figure 1), whereas PP-P2 cannot even be detected in the presence of sediment matrix. This likely reflects the adsorption of the pyrolysis product onto or within clay sheets, as reported by Espitalié et al. (1980) [45], and confirms the observation of Fabbri et al. (1998) [16]. Both indicator compounds show that the use of an external calibration curve for this type of sample would lead to the underestimation of the PP mass. It is, however, preferable to use the m/z 70 ion of PP-P1 to establish the calibration curve because of the higher contribution of this compound, hence better detection.
In the same way, two compounds were considered for PS quantification, the styrene dimer (PS-P2) and trimer (PS-P3). The base peak (m/z 91) was used to establish the calibration curves with the two selected indicator compounds for the same reasons as mentioned above for PP. For both indicator compounds, the calibration curves in the presence of matrix show lower slopes than those with inert matrix, five times lower for PS-P2 and nine times lower for PS-P3 (Figure 2). Moreover, even though both compounds are subject to the matrix effect, it can be seen that the correlation coefficient of the PS-P2 curve remains high in the presence of the matrix compared to that of the PS-P3 curve. Given these results, we recommend the use PS-P2 to calibrate PS, rather than PS-P3.

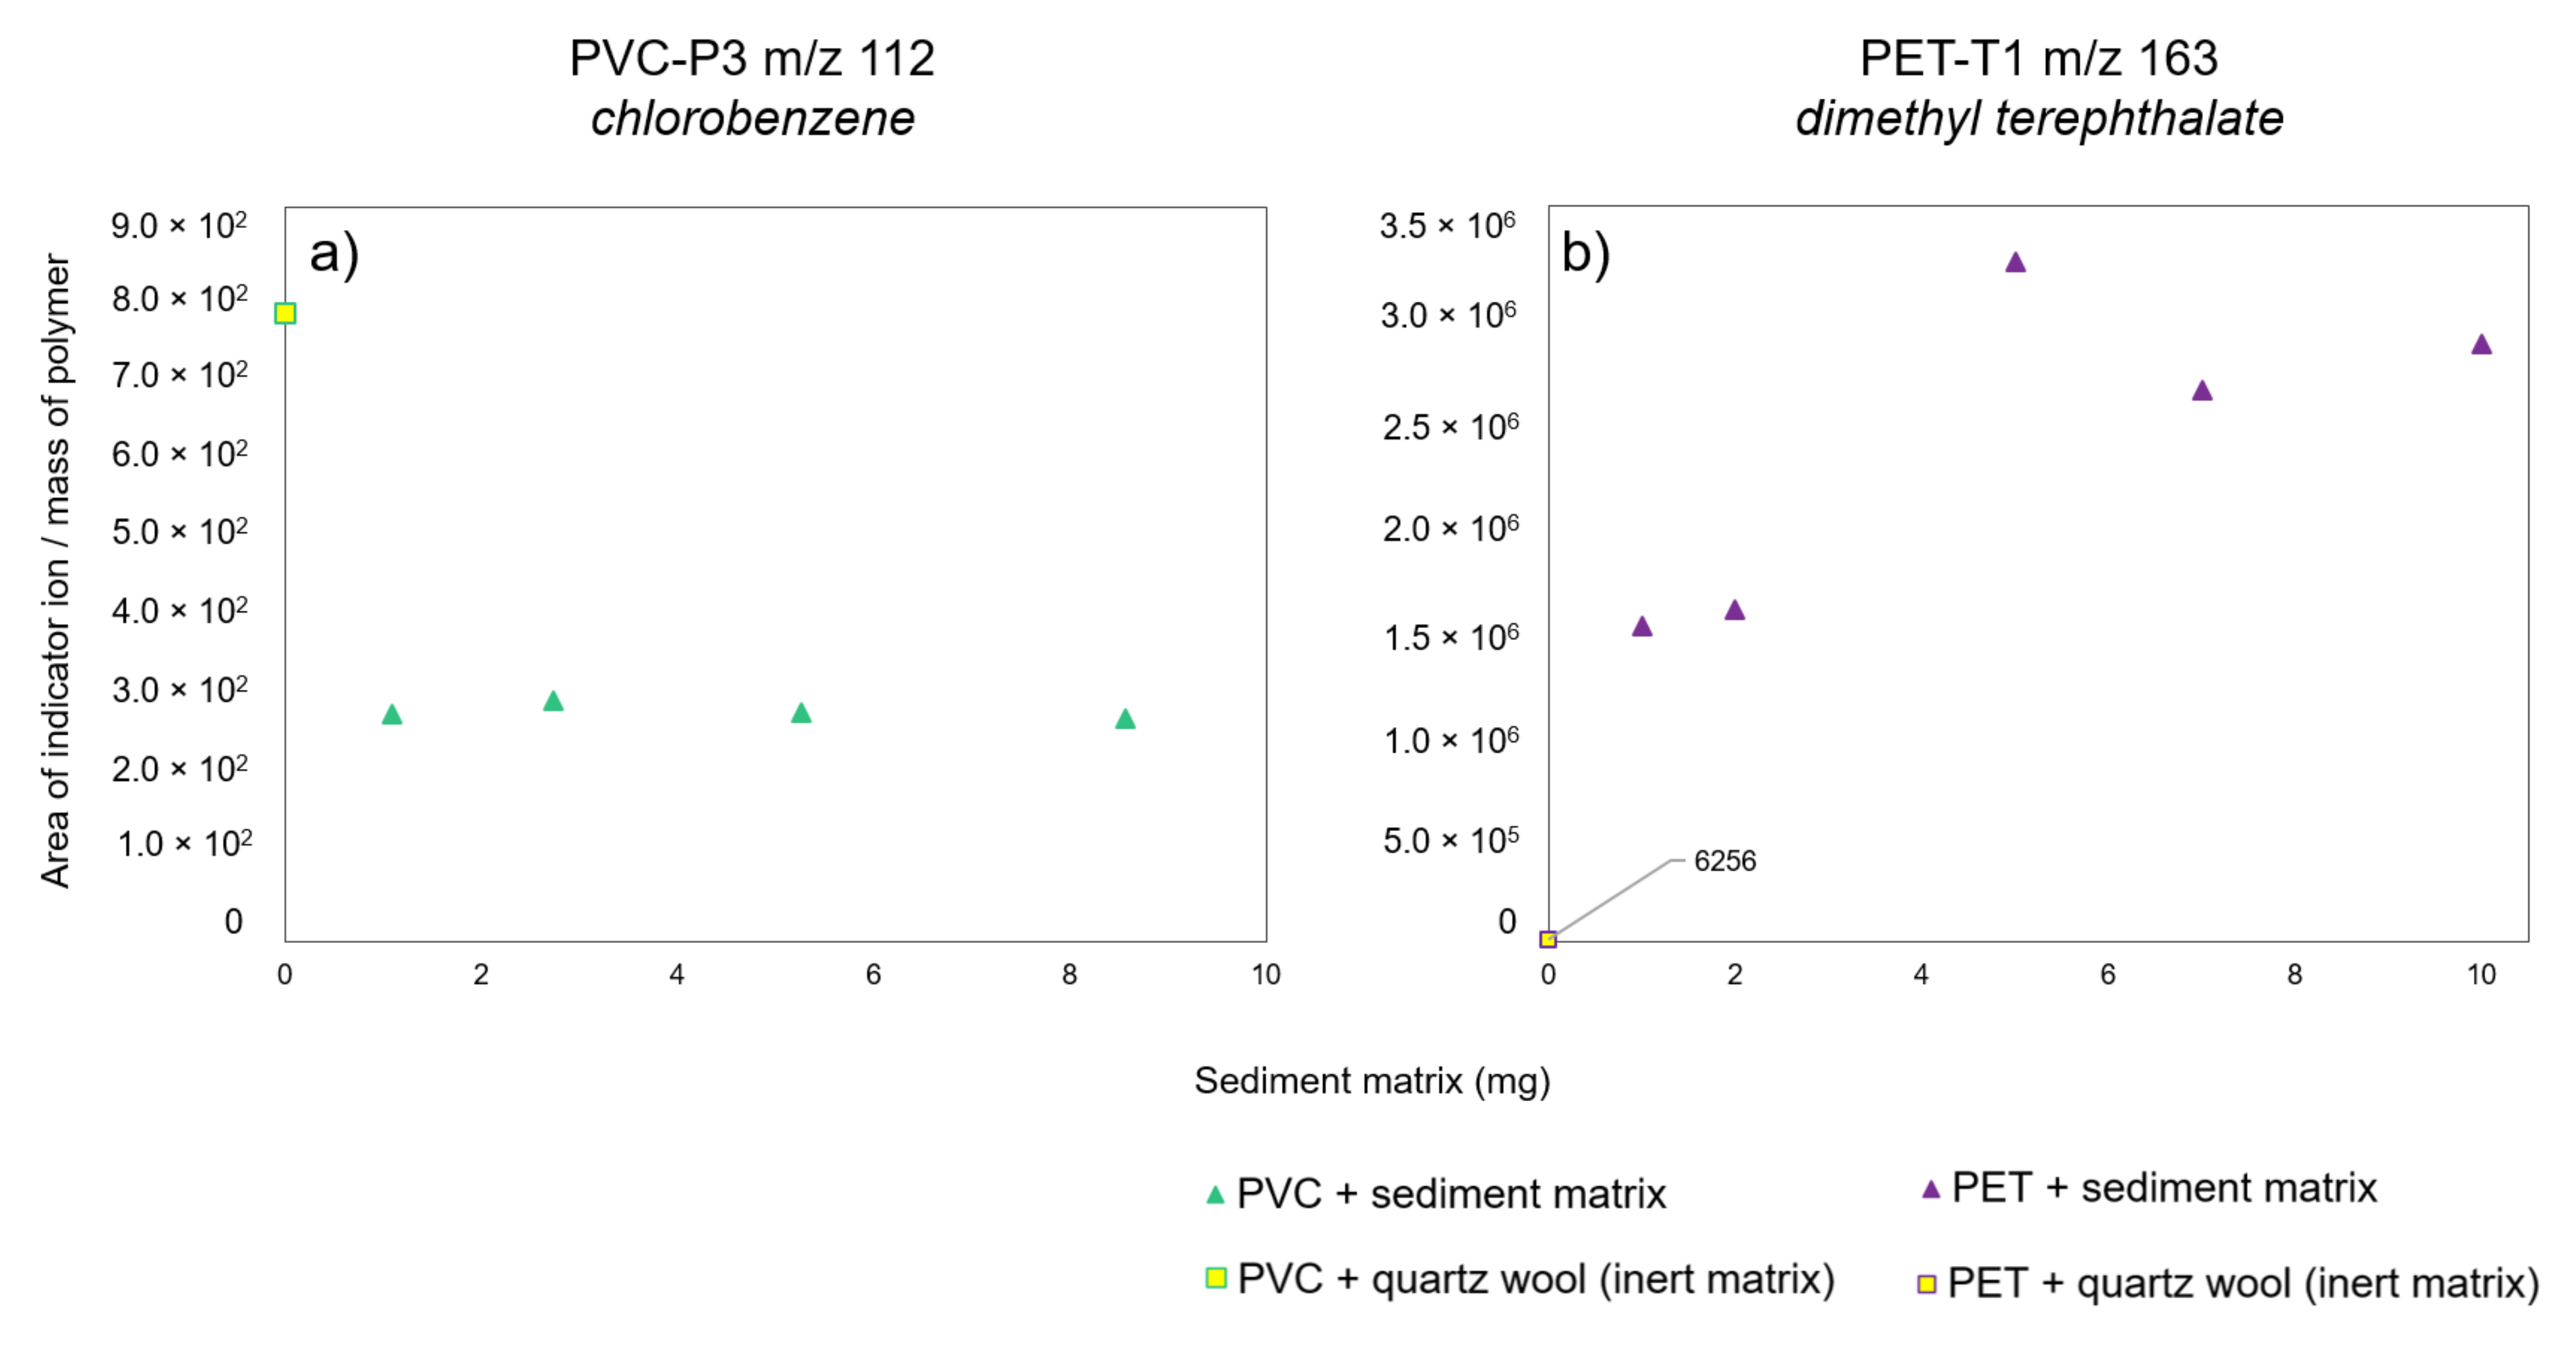
3.3. Influence of the Amount of Matrix

For PVC and PET, only one indicator compound was selected. For these compounds, the impact of the amount of matrix on the signal attenuation was evaluated by mixing 1 to 10 mg of the matrix with a fixed amount of PVC (500 µg) and PET (25 µg).
For PVC, the ion m/z 112 of the chlorobenzene (PVC-P3) was selected as it is the base peak on the mass spectrum. The abundance of this indicator compound is about three times lower in the presence of a sediment matrix (Figure 3). This attenuation is constant whatever the amount of matrix in the 1–10 mg range, indicating that the matrix effect is not dependent on the amount of matrix. However, the use of an external calibration would lead to a major underestimation of the PVC amount in this type of sediment sample.
For PET, the signal of the dimethyl terephthalate base peak at m/z 163 is about 240 times lower in the inert matrix than in the presence of the sediment matrix. The signal increase in the presence of sediment matrix could a priori be explained by the presence of remaining PET in the settled sediment after density separation. However, this increase is not proportional to the amount of added matrix, thus ruling out this hypothesis as the sole source of the increase. Therefore, it seems more likely that this increase reflects the catalysis of the depolymerization reaction by the sediment matrix. Such a phenomenon was previously reported, where the clay minerals promoted or inhibited the pyrolysis reactions depending on the nature of the involved organic matter [46]. These observations show that the use of external calibration curves even when combined with the addition of TMAH is not suitable for the quantification of PET in such samples.

4. Discussion

The purpose of these experiments was to highlight the challenges associated with the use of Pyr-GC/MS for the quantification of MP in sediments. The results obtained after the treatment of a solid environmental sample showed that the different purification steps did not allow the total removal of the organic and mineral matrix. It is therefore important to take into account the potential effect that may result from the presence of this residual matrix, especially since the isolation of MP is even more difficult for small particles (<50 µm). Pressurized liquid extraction was proposed to extract MP from solid matrices and thus completely remove the mineral fraction. These methods are highly relevant for the analysis of nanoplastics as they enable the extraction of MP without size limitations [14]. However, it seems difficult to ensure extraction efficiency for all polymers, which are not highly soluble in organic solvents such as dichloromethane, tetrahydrofuran or trichlorobenzene, as proposed in some studies [9,12,25]. For the fraction above 50 µm, it is possible to sort the particles with tweezers and to analyze them particle by particle [8]. However, this takes an excessively long time, which is not desired for the development of quantitative MP analysis, and above all, does not allow for the analysis of the finest particles.
In addition to the classic pretreatments of digestion of the organic matter (oxidants, acid, and basic reagents), some solutions were proposed to reduce the interferences, reviewed by Ainali et al. [47]. Although these strategies can provide an improvement in the analysis, the presence of interfering organic compounds cannot be fully avoided. This is now well-documented and the interest in selecting indicator compounds/ions that are specific to the targeted polymers was highlighted [48,49].
In contrast, the presence of a residual mineral matrix is barely taken into account. However, the present study clearly demonstrates the effects associated with the residual mineral fraction, emphasizing that the use of external calibration curves for quantification is not appropriate for sediment samples. To take into account such interactions upon pyrolysis, the use of an internal standard in environmental samples, such as sediments but also likely soils, thus appears compulsory. To avoid interferences with residual organic matter, Fischer and Scholz-Bottcher [22] used androstane, deuterated anthracene, 9-dodecyl-1,2,3,4,5,6,7,8-octahydro anthracene, and cholinic acid as internal pyrolysis standards. However, the volatile nature of these molecules used as internal standards could result in different behaviors during pyrolysis compared to the targeted polymers. Thus, polymers enriched in deuterium are sometimes used as an internal standard [9,48,49,50,51,52]. Especially, PS-d5 is increasingly used as an internal pyrolysis standard. Nevertheless, it was recently shown that this deuterated polymer can lead to HD exchange during pyrolysis, notably in the presence of mineral matrices such as alumina filters or sand [53]. Therefore, the authors suggested using a specific polymer, poly(4-fluorostyrene), given its physicochemical properties being close to PS. This internal standard seems to provide promising results for PS, PP and PE, although it is necessary to test the relevance of its use for a wider variety of polymers, especially the more polar ones.
As the present study demonstrates that it is impossible to use any external calibration for a reliable MP quantification in sediment samples, no limit of detection or quantification can be proposed for broad use. Indeed, the extent of the mineral matrix effect is expected to vary with the nature of the mineral itself, as previously demonstrated by Fabbri et al. [16].

5. Conclusions

Pyr-GC/MS is increasingly proposed for the quantitative analysis of MP in environmental matrices as it allows simultaneous analysis of several polymers in the whole sample (including the finest fraction) and the first developments are promising. However, although sample purification protocols are becoming more efficient in processing solid samples such as sediments, the presence of residual mineral and organic matrices remains a major drawback.
The selection of indicator compounds, taking into account potential interfering substances in environmental samples, was reviewed for PE, PP, PS, PET and PVC. Depending on the polymers, the selection of indicator compounds appears more or less tricky due to the specificity of their pyrolysis products and the proportion in which they are formed.
The establishment of calibration curves in the presence of a sediment matrix has highlighted an attenuation of the signal for PP, PS, and PVC. This effect is attributed to the adsorption of pyrolysis products on the clay phase of the mineral residue. It has also shown that the presence of mineral matter can promote the formation of some pyrolysis products, as in the case of PET in the presence of TMAH. Because of potential interferences with residual organic matter and mineral matrix effects, the use of an internal standard is emerging as a prerequisite for the quantification of plastic polymers in complex environmental samples such as sediments. In contrast, no external calibration can be used to reliably quantify MP in such samples. Moreover, the variability of the extent of the matrix effect precludes the general establishment of any limits of detection/quantification of MP in such samples.

Author Contributions

Conceptualization, J.G., S.D. and B.T.; methodology, J.G., B.T., R.D., C.A., S.D. and N.B.; writing—original draft preparation, N.B.; writing—review and editing, J.G., B.T., R.D., C.A. and S.D.; supervision, J.G., B.T., R.D. and S.D.; project administration, J.G., B.T. and S.D.; funding acquisition, J.G. All authors have read and agreed to the published version of the manuscript.

Funding

This study was carried out in the framework of the Sedi-Plast research program funded by the French Research Agency (ANR-19-CE34-0012).

Institutional Review Board Statement

Not applicable.

Informed Consent Statement

Not applicable.

Data Availability Statement

Data is contained within the article.

Conflicts of Interest

The authors declare no conflict of interest. The funders had no role in the design of the study; in the collection, analyses, or interpretation of data; in the writing of the manuscript, or in the decision to publish the results.

References

  1. Käppler, A.; Fischer, M.; Scholz-Böttcher, B.M.; Oberbeckmann, S.; Labrenz, M.; Fischer, D.; Eichhorn, K.-J.; Voit, B. Comparison of μ-ATR-FTIR spectroscopy and py-GCMS as identification tools for microplastic particles and fibers isolated from river sediments. Anal. Bioanal. Chem. 2018, 410, 5313–5327. [Google Scholar] [CrossRef] [PubMed]
  2. Löder, M.G.J.; Kuczera, M.; Mintenig, S.; Lorenz, C.; Gerdts, G. Focal plane array detector-based micro-Fourier-transform infrared imaging for the analysis of microplastics in environmental samples. Environ. Chem. 2015, 12, 563–581. [Google Scholar] [CrossRef]
  3. Anbumani, S.; Kakkar, P. Ecotoxicological effects of microplastics on biota: A review. Environ. Sci. Pollut. Res. 2018, 25, 14373–14396. [Google Scholar] [CrossRef] [PubMed]
  4. Simon, M.; van Alst, N.; Vollertsen, J. Quantification of microplastic mass and removal rates at wastewater treatment plants applying Focal Plane Array (FPA)-based Fourier Transform Infrared (FT-IR) imaging. Water Res. 2018, 142, 1–9. [Google Scholar] [CrossRef] [PubMed]
  5. Primpke, S.; Fischer, M.; Lorenz, C.; Gerdts, G.; Scholz-Böttcher, B.M. Comparison of pyrolysis gas chromatography/mass spectrometry and hyperspectral FTIR imaging spectroscopy for the analysis of microplastics. Anal. Bioanal. Chem. 2020, 412, 8283–8298. [Google Scholar] [CrossRef]
  6. Beiras, R.; Schönemann, A.M. Currently monitored microplastics pose negligible ecological risk to the global ocean. Sci. Rep. 2020, 10, 22281. [Google Scholar] [CrossRef]
  7. Fries, E.; Dekiff, J.H.; Willmeyer, J.; Nuelle, M.-T.; Ebert, M.; Remy, D. Identification of polymer types and additives in marine microplastic particles using pyrolysis-GC/MS and scanning electron microscopy. Environ. Sci. Process. Impacts 2013, 15, 1949. [Google Scholar] [CrossRef] [PubMed] [Green Version]
  8. Hermabessiere, L.; Himber, C.; Boricaud, B.; Kazour, M.; Amara, R.; Cassone, A.-L.; Laurentie, M.; Paul-Pont, I.; Soudant, P.; Dehaut, A.; et al. Optimization, performance, and application of a pyrolysis-GC/MS method for the identification of microplastics. Anal. Bioanal. Chem. 2018, 410, 6663–6676. [Google Scholar] [CrossRef] [Green Version]
  9. Dierkes, G.; Lauschke, T.; Becher, S.; Schumacher, H.; Földi, C.; Ternes, T. Quantification of microplastics in environmental samples via pressurized liquid extraction and pyrolysis-gas chromatography. Anal. Bioanal. Chem. 2019, 411, 6959–6968. [Google Scholar] [CrossRef]
  10. Fischer, M.; Scholz-Böttcher, B.M. Simultaneous Trace Identification and Quantification of Common Types of Microplastics in Environmental Samples by Pyrolysis-Gas Chromatography–Mass Spectrometry. Environ. Sci. Technol. 2017, 51, 5052–5060. [Google Scholar] [CrossRef]
  11. Gomiero, A.; Øysæd, K.B.; Agustsson, T.; van Hoytema, N.; van Thiel, T.; Grati, F. First record of characterization, concentration and distribution of microplastics in coastal sediments of an urban fjord in south west Norway using a thermal degradation method. Chemosphere 2019, 227, 705–714. [Google Scholar] [CrossRef] [PubMed]
  12. Okoffo, E.D.; Ribeiro, F.; O’Brien, J.W.; O’Brien, S.; Tscharke, B.J.; Gallen, M.; Samanipour, S.; Mueller, J.F.; Thomas, K.V. Identification and quantification of selected plastics in biosolids by pressurized liquid extraction combined with double-shot pyrolysis gas chromatography–mass spectrometry. Sci. Total Environ. 2020, 715, 136924. [Google Scholar] [CrossRef]
  13. Castelvetro, V.; Corti, A.; La Nasa, J.; Modugno, F.; Ceccarini, A.; Giannarelli, S.; Vinciguerra, V.; Bertoldo, M. Polymer Identification and Specific Analysis (PISA) of Microplastic Total Mass in Sediments of the Protected Marine Area of the Meloria Shoals. Polymers 2021, 13, 796. [Google Scholar] [CrossRef] [PubMed]
  14. Okoffo, E.D.; O’Brien, S.; O’Brien, J.W.; Tscharke, B.J.; Rauert, C.; Rødland, E.S.; Ribeiro, F.; Burrows, S.D.; Toapanta, T.; Mueller, J.F.; et al. Does size matter? Quantification of plastics associated with size fractionated biosolids. Sci. Total Environ. 2022, 811, 152382. [Google Scholar] [CrossRef] [PubMed]
  15. Hurley, R.; Woodward, J.; Rothwell, J.J. Microplastic contamination of river beds significantly reduced by catchment-wide flooding. Nat. Geosci. 2018, 11, 251–257. [Google Scholar] [CrossRef]
  16. Fabbri, D.; Trombini, C.; Vassura, I. Analysis of Polystyrene in Polluted Sediments by Pyrolysis–Gas Chromatography–Mass Spectrometry. J. Chromatogr. Sci. 1998, 36, 600–604. [Google Scholar] [CrossRef] [Green Version]
  17. Dümichen, E.; Barthel, A.-K.; Braun, U.; Bannick, C.G.; Brand, K.; Jekel, M.; Senz, R. Analysis of polyethylene microplastics in environmental samples, using a thermal decomposition method. Water Res. 2015, 85, 451–457. [Google Scholar] [CrossRef]
  18. Dehaut, A.; Hermabessiere, L.; Duflos, G. Microplastics Detection Using Pyrolysis-GC/MS-Based Methods. In Handbook of Microplastics in the Environment; Rocha-Santos, T., Costa, M., Mouneyrac, C., Eds.; Springer International Publishing: Cham, Germany, 2020; pp. 1–35. ISBN 978-3-030-10618-8. [Google Scholar]
  19. Crawford, C.B.; Quinn, B. Microplastic separation techniques. In Microplastic Pollutants; Elsevier: Amsterdam, The Netherlands, 2017; pp. 203–218. ISBN 978-0-12-809406-8. [Google Scholar]
  20. Nakajima, R.; Tsuchiya, M.; Lindsay, D.J.; Kitahashi, T.; Fujikura, K.; Fukushima, T. A new small device made of glass for separating microplastics from marine and freshwater sediments. PeerJ 2019, 7, e7915. [Google Scholar] [CrossRef] [Green Version]
  21. Primpke, S.; Cross, R.K.; Mintenig, S.M.; Simon, M.; Vianello, A.; Gerdts, G.; Vollertsen, J. Toward the Systematic Identification of Microplastics in the Environment: Evaluation of a New Independent Software Tool (siMPle) for Spectroscopic Analysis. Appl. Spectrosc. 2020, 74, 1127–1138. [Google Scholar] [CrossRef]
  22. Fischer, M.; Scholz-Böttcher, B.M. Microplastics analysis in environmental samples-recent pyrolysis-gas chromatography-mass spectrometry method improvements to increase the reliability of mass-related data. Anal. Methods 2019, 11, 2489–2497. [Google Scholar] [CrossRef]
  23. Tsuge, S.; Ohtani, H.; Watanabe, C. Pyrolysis-GC/MS Data Book of Synthetic Polymers: Pyrograms, Thermograms and MS of Pyrolyzates; Elsevier: Amsterdam, The Netherlands, 2011; ISBN 978-0-444-53893-2. [Google Scholar]
  24. Funck, M. Identification of microplastics in wastewater after cascade filtration using Pyrolysis-GCMS. MethodsX 2020, 7, 100778. [Google Scholar] [CrossRef] [PubMed]
  25. Steinmetz, Z.; Kintzi, A.; Muñoz, K.; Schaumann, G.E. A simple method for the selective quantification of polyethylene, polypropylene, and polystyrene plastic debris in soil by pyrolysis-gas chromatography/mass spectrometry. J. Anal. Appl. Pyrolysis 2020, 147, 104803. [Google Scholar] [CrossRef]
  26. Nip, M.; Tegelaar, E.W.; Brinkhuis, H.; De Leeuw, J.W.; Schenck, P.A.; Holloway, P.J. Analysis of modern and fossil plant cuticles by Curie point Py-GC and Curie point Py-GC-MS: Recognition of a new, highly aliphatic and resistant biopolymer. Org. Geochem. 1986, 10, 769–778. [Google Scholar] [CrossRef]
  27. Tegelaar, E.W.; Hollman, G.; Van Der Vegt, P.; De Leeuw, J.W.; Holloway, P.J. Chemical characterization of the periderm tissue of some angiosperm species: Recognition of an insoluble, non-hydrolyzable, aliphatic biomacromolecule (Suberan). Org. Geochem. 1995, 23, 239–251. [Google Scholar] [CrossRef]
  28. Tegelaar, E.W.; Matthezing, R.M.; Jansen, J.B.H.; Horsfield, B.; de Leeuw, J.W. Possible origin of n-alkanes in high-wax crude oils. Nature 1989, 342, 529–531. [Google Scholar] [CrossRef]
  29. Almendros, G.; Zancada, M.C.; González-Vila, F.J.; Lesiak, M.A.; Álvarez-Ramis, C. Molecular features of fossil organic matter in remains of the Lower Cretaceous fern Weichselia reticulata from Przenosza basement (Poland). Org. Geochem. 2005, 36, 1108–1115. [Google Scholar] [CrossRef] [Green Version]
  30. Han, Z.; Kruge, M.A.; Crelling, J.C.; Bensley, D.F. Classification of torbanite and cannel coal: I. Insights from petrographic analysis of density fractions. Int. J. Coal Geol. 1999, 38, 181–202. [Google Scholar] [CrossRef]
  31. Saiz-Jimenez, C. Applications of pyrolysis-gas chromatography/mass spectrometry to the study of humic substances: Evidence of aliphatic biopolymers in sedimentary and terrestrial humic acids. Sci. Total Environ. 1992, 117–118, 13–25. [Google Scholar] [CrossRef]
  32. Schmidt, M.W.I.; Knicker, H.; Hatcher, P.G.; Kögel-Knabner, I. Impact of brown coal dust on the organic matter in particle-size fractions of a Mollisol. Org. Geochem. 1996, 25, 29–39. [Google Scholar] [CrossRef]
  33. Fabbri, D.; Tartari, D.; Trombini, C. Analysis of poly(vinyl chloride) and other polymers in sediments and suspended matter of a coastal lagoon by pyrolysis-gas chromatography-mass spectrometry. Anal. Chim. Acta 2000, 413, 3–11. [Google Scholar] [CrossRef]
  34. Gallois, N.; Templier, J.; Derenne, S. Pyrolysis-gas chromatography–mass spectrometry of the 20 protein amino acids in the presence of TMAH. J. Anal. Appl. Pyrolysis 2007, 80, 216–230. [Google Scholar] [CrossRef]
  35. Tsuge, S.; Matsubara, H. High-resolution pyrolysis-gas chromatography of proteins and related materials. J. Anal. Appl. Pyrolysis 1985, 8, 49–64. [Google Scholar] [CrossRef]
  36. Van Smeerdijk, D.G.; Boon, J.J. Characterisation of subfossil Sphagnum leaves, rootlets of ericaceae and their peat by pyrolysis-high-resolution gas chromatography-mass spectrometry. J. Anal. Appl. Pyrolysis 1987, 11, 377–402. [Google Scholar] [CrossRef]
  37. Dignac, M.-F.; Houot, S.; Francou, C.; Derenne, S. Pyrolytic study of compost and waste organic matter. Org. Geochem. 2005, 36, 1054–1071. [Google Scholar] [CrossRef]
  38. El Hayany, B.; El Fels, L.; Dignac, M.-F.; Quenea, K.; Rumpel, C.; Hafidi, M. Pyrolysis-GCMS as a Tool for Maturity Evaluation of Compost from Sewage Sludge and Green Waste. Waste Biomass Valorization 2020, 12, 2639–2652. [Google Scholar] [CrossRef]
  39. Çoban-Yıldız, Y.; Chiavari, G.; Fabbri, D.; Gaines, A.F.; Galletti, G.; Tuğrul, S. The chemical composition of Black Sea suspended particulate organic matter: Pyrolysis-GC/MS as a complementary tool to traditional oceanographic analyses. Mar. Chem. 2000, 69, 55–67. [Google Scholar] [CrossRef]
  40. Fabbri, D.; Chiavari, G.; Galletti, G.C. Characterization of soil humin by pyrolysis(/methylation)-gas chromatography/mass spectrometry: Structural relationships with humic acids. J. Anal. Appl. Pyrolysis 1996, 37, 161–172. [Google Scholar] [CrossRef]
  41. Dignac, M.-F.; Pechot, N.; Thevenot, M.; Lapierre, C.; Bahri, H.; Bardoux, G.; Rumpel, C. Isolation of soil lignins by combination of ball-milling and cellulolysis: Evaluation of purity and isolation efficiency with pyrolysis/GC/MS. J. Anal. Appl. Pyrolysis 2009, 85, 426–430. [Google Scholar] [CrossRef]
  42. González-Pérez, J.A.; Almendros, G.; de la Rosa, J.M.; González-Vila, F.J. Appraisal of polycyclic aromatic hydrocarbons (PAHs) in environmental matrices by analytical pyrolysis (Py–GC/MS). J. Anal. Appl. Pyrolysis 2014, 109, 1–8. [Google Scholar] [CrossRef] [Green Version]
  43. Dimitrov, N.; Kratofil Krehula, L.; Ptiček Siročić, A.; Hrnjak-Murgić, Z. Analysis of recycled PET bottles products by pyrolysis-gas chromatography. Polym. Degrad. Stab. 2013, 98, 972–979. [Google Scholar] [CrossRef]
  44. Challinor, J.M. A rapid simple pyrolysis derivatisation gas chromatography-mass spectrometry method for profiling of fatty acids in trace quantities of lipids. J. Anal. Appl. Pyrolysis 1996, 37, 185–197. [Google Scholar] [CrossRef]
  45. Espitalie, J.; Madec, M.; Tissot, B. Role of Mineral Matrix in Kerogen Pyrolysis: Influence on Petroleum Generation and Migration1. AAPG Bull. 1980, 64, 59–66. [Google Scholar] [CrossRef]
  46. Bu, H.; Yuan, P.; Liu, H.; Liu, D.; Liu, J.; He, H.; Zhou, J.; Song, H.; Li, Z. Effects of complexation between organic matter (OM) and clay mineral on OM pyrolysis. Geochim. Cosmochim. Acta 2017, 212, 1–15. [Google Scholar] [CrossRef]
  47. Ainali, N.M.; Kalaronis, D.; Kontogiannis, A.; Evgenidou, E.; Kyzas, G.Z.; Yang, X.; Bikiaris, D.N.; Lambropoulou, D.A. Microplastics in the environment: Sampling, pretreatment, analysis and occurrence based on current and newly-exploited chromatographic approaches. Sci. Total Environ. 2021, 794, 148725. [Google Scholar] [CrossRef] [PubMed]
  48. La Nasa, J.; Biale, G.; Fabbri, D.; Modugno, F. A review on challenges and developments of analytical pyrolysis and other thermoanalytical techniques for the quali-quantitative determination of microplastics. J. Anal. Appl. Pyrolysis 2020, 149, 104841. [Google Scholar] [CrossRef]
  49. Jung, S.; Cho, S.-H.; Kim, K.-H.; Kwon, E.E. Progress in quantitative analysis of microplastics in the environment: A review. Chem. Eng. J. 2021, 422, 130154. [Google Scholar] [CrossRef]
  50. Gomiero, A.; Øysæd, K.B.; Palmas, L.; Skogerbø, G. Application of GCMS-pyrolysis to estimate the levels of microplastics in a drinking water supply system. J. Hazard. Mater. 2021, 416, 125708. [Google Scholar] [CrossRef]
  51. Goßmann, I. Car and truck tire wear particles in complex environmental samples—A quantitative comparison with “traditional” microplastic polymer mass loads. Sci. Total Environ. 2021, 773, 145667. [Google Scholar] [CrossRef]
  52. Unice, K.M.; Kreider, M.L.; Panko, J.M. Use of a Deuterated Internal Standard with Pyrolysis-GC/MS Dimeric Marker Analysis to Quantify Tire Tread Particles in the Environment. Int. J. Environ. Res. Public. Health 2012, 9, 4033–4055. [Google Scholar] [CrossRef]
  53. Lauschke, T.; Dierkes, G.; Schweyen, P.; Ternes, T.A. Evaluation of poly(styrene-d5) and poly(4-fluorostyrene) as internal standards for microplastics quantification by thermoanalytical methods. J. Anal. Appl. Pyrolysis 2021, 159, 105310. [Google Scholar] [CrossRef]
Figure 1. Calibration curves for PP indicator compounds (a) PP-P1 and (b) PP-P2 with quartz wool (inert matrix) and in the presence of 8 mg of sediment matrix.
Microplastics 01 00016 g001
Figure 2. Calibration curves for PS indicator compounds (a) PS-P2 and (b) PS-P3 with quartz wool (inert matrix) and with 8 mg of the sediment matrix.
Microplastics 01 00016 g002
Figure 3. (a) PVC and (b) PET analyzed in the presence of increasing amount of sediment matrix (1–10 mg).
Microplastics 01 00016 g003
Table 1. Indicator compounds used for the identification and quantification of the five most abundant polymers in the environment according to the literature data. * compound only formed upon thermochemolysis with TMAH. n.c.: not considered for quantification.
PolymersIndicator Compound(s)Abbreviation Indicator Fragments (m/z)References
IdentificationQuantification
PEdec-1-ene (C10) 83, 97, 111, 14083[12]
1,12-tridecadiene (C13) 55, 81, 67, 95unspecified[24]
1,13-tetradecadiene (C14) 81, 95, 109unspecified
1-pentadecene (C15) 9797[9]
1,14-pentadecadiene (C15) 8181
55, 81, 95, 109unspecified[24]
1,16-heptadecadiene (C17) 82, 95unspecified[25]
1,17-octadecadiene (C18) 82, 95unspecified
1-tetradecene (C14) 8383[11]
alkanes (e.g., C20) 99, 8585[10]
alk-1-enes (e.g., C20) 97, 8383
α, ω-alkadienes (n-C16-26) 95, 8282[22]
PP2,4-dimethyl-1-hept-1-enePP-P170, 83, 126126[12]
126[9]
126, 7070[10,22]
unspecified[25]
2,4,6,8-tetramethyl-1-undecene PP-P2111, 69n.c.[10,22]
69, 21069[11]
PSstyrenePS-P151, 78, 104104[24]
104104[9,15,33]
78, 104unspecified[25]
3-buten-1,3-diyldibenzene
(styrene dimer)
PS-P291, 208208[11]
n.c.[10,22]
91, 104, 130, 208unspecified[24]
5-hexen-1,3,5-triyltribenzene
(styrene trimer)
PS-P3117, 194, 91, 31291[12]
207, 91[10,22]
91, 117, 194, 207unspecified[24]
PVCbenzenePVC-P178, 74, 5278[12]
78[10,22]
[33]
1-methylnaphthalenePVC-P2142142[11]
chlorobenzenePVC-P3112, 77n.c.[10,22]
PETDimethylterephtalate *PET-T1194, 163163[10,11,22]
vinyl benzoatePET-D1105, 77, 148, 51105[12]
Publisher’s Note: MDPI stays neutral with regard to jurisdictional claims in published maps and institutional affiliations.

