Communication

Do We Speak the Same Language for Reference Particles in Microplastic Research?

1
Department of Environmental, Process & Energy Engineering, MCI-The Entrepreneurial School, 6020 Innsbruck, Austria
2
Department of Biotechnology & Food Engineering, MCI-The Entrepreneurial School, 6020 Innsbruck, Austria
3
ecolymer GmbH, 6971 Hard, Austria
*
Author to whom correspondence should be addressed.
Microplastics 2022, 1(1), 221-228; https://doi.org/10.3390/microplastics1010015
Submission received: 30 December 2021 / Revised: 7 February 2022 / Accepted: 3 March 2022 / Published: 9 March 2022

Abstract

:
Despite the high number of scientific publications on related topics, such as sustainability, pollution control, etc., research on microplastic (MP) is still in its infancy. To advance the quality of future MP investigations, scientists have recently called for harmonization regarding the definition and categorization of MP, as well as for consensus in sampling and investigations methodologies. The application of standardized and fully characterized MP particles, which are commercially available on a large scale but rarely characterized by manufacturers, could add another piece to that mosaic. This publication aims to introduce ten low-priced MP powders that can be used as reference particles in future MP studies. The physical parameters shape, particle density and particle size distribution were examined, and results compared to technical information reports and data sheets, available. Particle densities were almost in line with the manufacturer’s information. However, significant leaks could be revealed for particle size specifications, thus underlining the demand for an accurate description of the particle size distribution, e.g., D50 or D90.

Graphical Abstract

1. Introduction

Recently, plastic pollution has become a global environmental threat. Since the 1940s, when mass production began, plastic-based products have become cheap, lightweight, durable and persistent, leading to a numerous range of applications and extensive use in all areas of our daily life [1]. Microplastics (MPs), a collective term for solid plastic particles in the range of 1 to 1000 µm [2], may either be released as primary MPs, such as specially produced microscale particles such as additives in cosmetics, toothpaste, facial cleansers, deodorants, baby products, peelings, sunscreen, body washes, hair colors, nail polish and bath gels, or other technical products, e.g., paintings. Alternatively, these particles can arise from the degradation or decay of various-sized plastic debris over time in terrestrial and marine environments (secondary MPs) [3,4]. These particles are destructed continuously into smaller fragments by mechanical action, oxidation, hydrolysis, chemical processes or photo- and biodegradation [5,6]. Environmental factors, such as temperature, humidity or salinity, and polymer properties such as morphology, size, shape, density and biogeographic conditions, may influence this fragmentation [4].
Due to their persistence and size, MPs are transported in water flows and through atmospheric fallouts, wind advection or stormwater runoffs over long distances [7] MPs have the capability to access food chains when consumed by primary organisms [4] and pose a potential health risk for all organisms, including humans. A recent study [8] predicted median MP (1–5000 μm) intake rates of 553 particles/capita/day (184 ng/capita/day) and 883 particles/capita/day (583 ng/capita/day) for children and adults, respectively, pointing out the omnipresence of MPs in daily-consumed food and beverages. Besides physical damage, the release of polymer additives and hazardous compounds, such as heavy metals, PAHs, pesticides and/or pathogens attached to the particle surface, poses severe risks [5].
In recent decades, investigations on MPs have seen a large increase, thus founding a novel field of research, ranging from the exploration of MP sources and pathways, establishing methodologies, to the identification of global hotspots of microplastic accumulation to effect assessments on ecosystems and potential impacts on habitats and species [9]. Among the proposed challenges of environmental MP research, including sampling, extraction, isolation/separation, identification and quantification [4,10,11], particular attention should be paid to representative reference materials [12,13], e.g., particle simulations (e.g., injection via RRSB distribution), test method validation or laboratory case studies. Polymeric materials arise from a multitude of sources, comprise different materials and additives and reveal distinct physicochemical characteristics, which make the choice of reference particles (RPs) complicated and costly [14].
In this publication, ten important, commercially available and low-cost MP bulk solids were investigated by examining particle density, particle size distribution (PSD) and shape, and the results were compared to publicly available manufacturer data sheets and/or requested information for adjustment and direct comparison with other manufacturers. The authors propose that the future application of standardized and fully characterized RPs increases the comparability, and this may help to harmonize future MP research. The introduction of the presented particles will set a first source in respect to this harmonization process. Hopefully, many more will follow. The goal is to be able to better conquer pending solid waste management problems and the development of economically competitive separation processes.

2. Materials and Methods

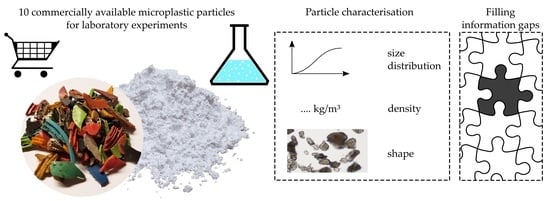
2.1. Material Selection and Characterization

The following plastics or elastomers, listed with their respective trade names, were investigated in this study: two high-density-polyethylene (HDPE) powders RP1 (Rowalit N100-20) and RP2 (ET306010), one low-density-polyethylene (LDPE) powder RP3 (Rowalit H70), one polyamide (PA) powder RP4 (Vestosint 2158), two polyethylene terephthalate (PET) powders RP5 (ES306030) and RP6 (ES3060301), one polypropylene (PP) powder RP7 (Eltex P KS001PF), one polystyrol (PS) powder RP8 (PrimeCast 101), one polyurethane (PUT) powder RP9 (Rowalit 500-9H) and one polyvinylchloride (PVC) powder RP10 (CV316010) were obtained from five different companies. Basic information on material, color, density and particle size distribution was taken from technical information reports and data sheets, provided by the manufacturers (Table 1).

2.2. Physical Particle Properties

Examined physical particles properties are shown in Table 2. Particle density was measured with a gas pycnometer with constant volume Quantachrome Ultrapyc 1200e (Quantachrome Instruments-Anton Paar QuantaTec Inc., Boynton Beach, FL, USA) in medium cell size (58.2392 cm3), with helium gas (flow purge 1 min). To determine the particle size distributions (cumulative sum, density distribution), laser diffraction measurements were conducted in a Malvern Mastersizer 2000E (Malvern Panalytical Ltd., Malvern, UK) with diffraction indexes of 1.54, 1.54, 1.52, 1.53, 1.52, 1.52, 1.49, 1.59, 1.55 and 1.54 for RP1 to RP10, respectively. To reveal the particle shape (Table 2), RPs were examined under a Nikon Eclipse 50i microscope (Nikon, Tokyo, Japan), connected to a DS-Fi1c digital camera (Nikon, Tokyo, Japan).
Based on the cumulative PSD, standard distribution fitting (power distribution DIN 66143), logarithmic normal distribution (DIN 66144) and RRSB distribution (DIN 66145) were evaluated. Nonlinear multivariable regression was used to describe the PSD as a mathematical function. As a first step, data fitting was tested for RP3 by investigating the regression coefficient (R2) and root mean square error (RMSE). As shown in the Supplementary Materials, polynomial fit in Grade 5 was assumed as sufficient because R2 and RMSE did not significantly change within Grade 6 (Table 3).

3. Results and Discussion

3.1. Particle Density

The density ratio between the fluid and solid phases is a key parameter in the-evaluation of liquid–solid separation processes. Since this type of separation involves very low-density ratios, it is all the more important to have precise data for the evaluation of the respective bulk material. Determined average particle densities (Table 4) were almost in line with manufacturer reports. For PE particles, average densities of −0.52%, +1.03% and −0.27% were measured for RP1 to RP3, respectively, when compared to data available by manufacturers. PET particle densities varied between +0.11% (RP5) and +0.62% (RP6). Slightly lower densities were detected for RP7 (−1.46%) and slightly higher densities for RP10 (+0.99%). Particle densities for RP9, RP4 and RP8 were found underestimated by manufacturers, revealing density changes of +2.39%, +4.18% and +25.7%, respectively. Particle density was previously reported to be one of the most crucial parameters in MP research. Accurate information on particle densities is required to convert particle abundance to mass concentration and to predict or estimate routes of particles in aquatic systems and in the atmosphere [10,15].

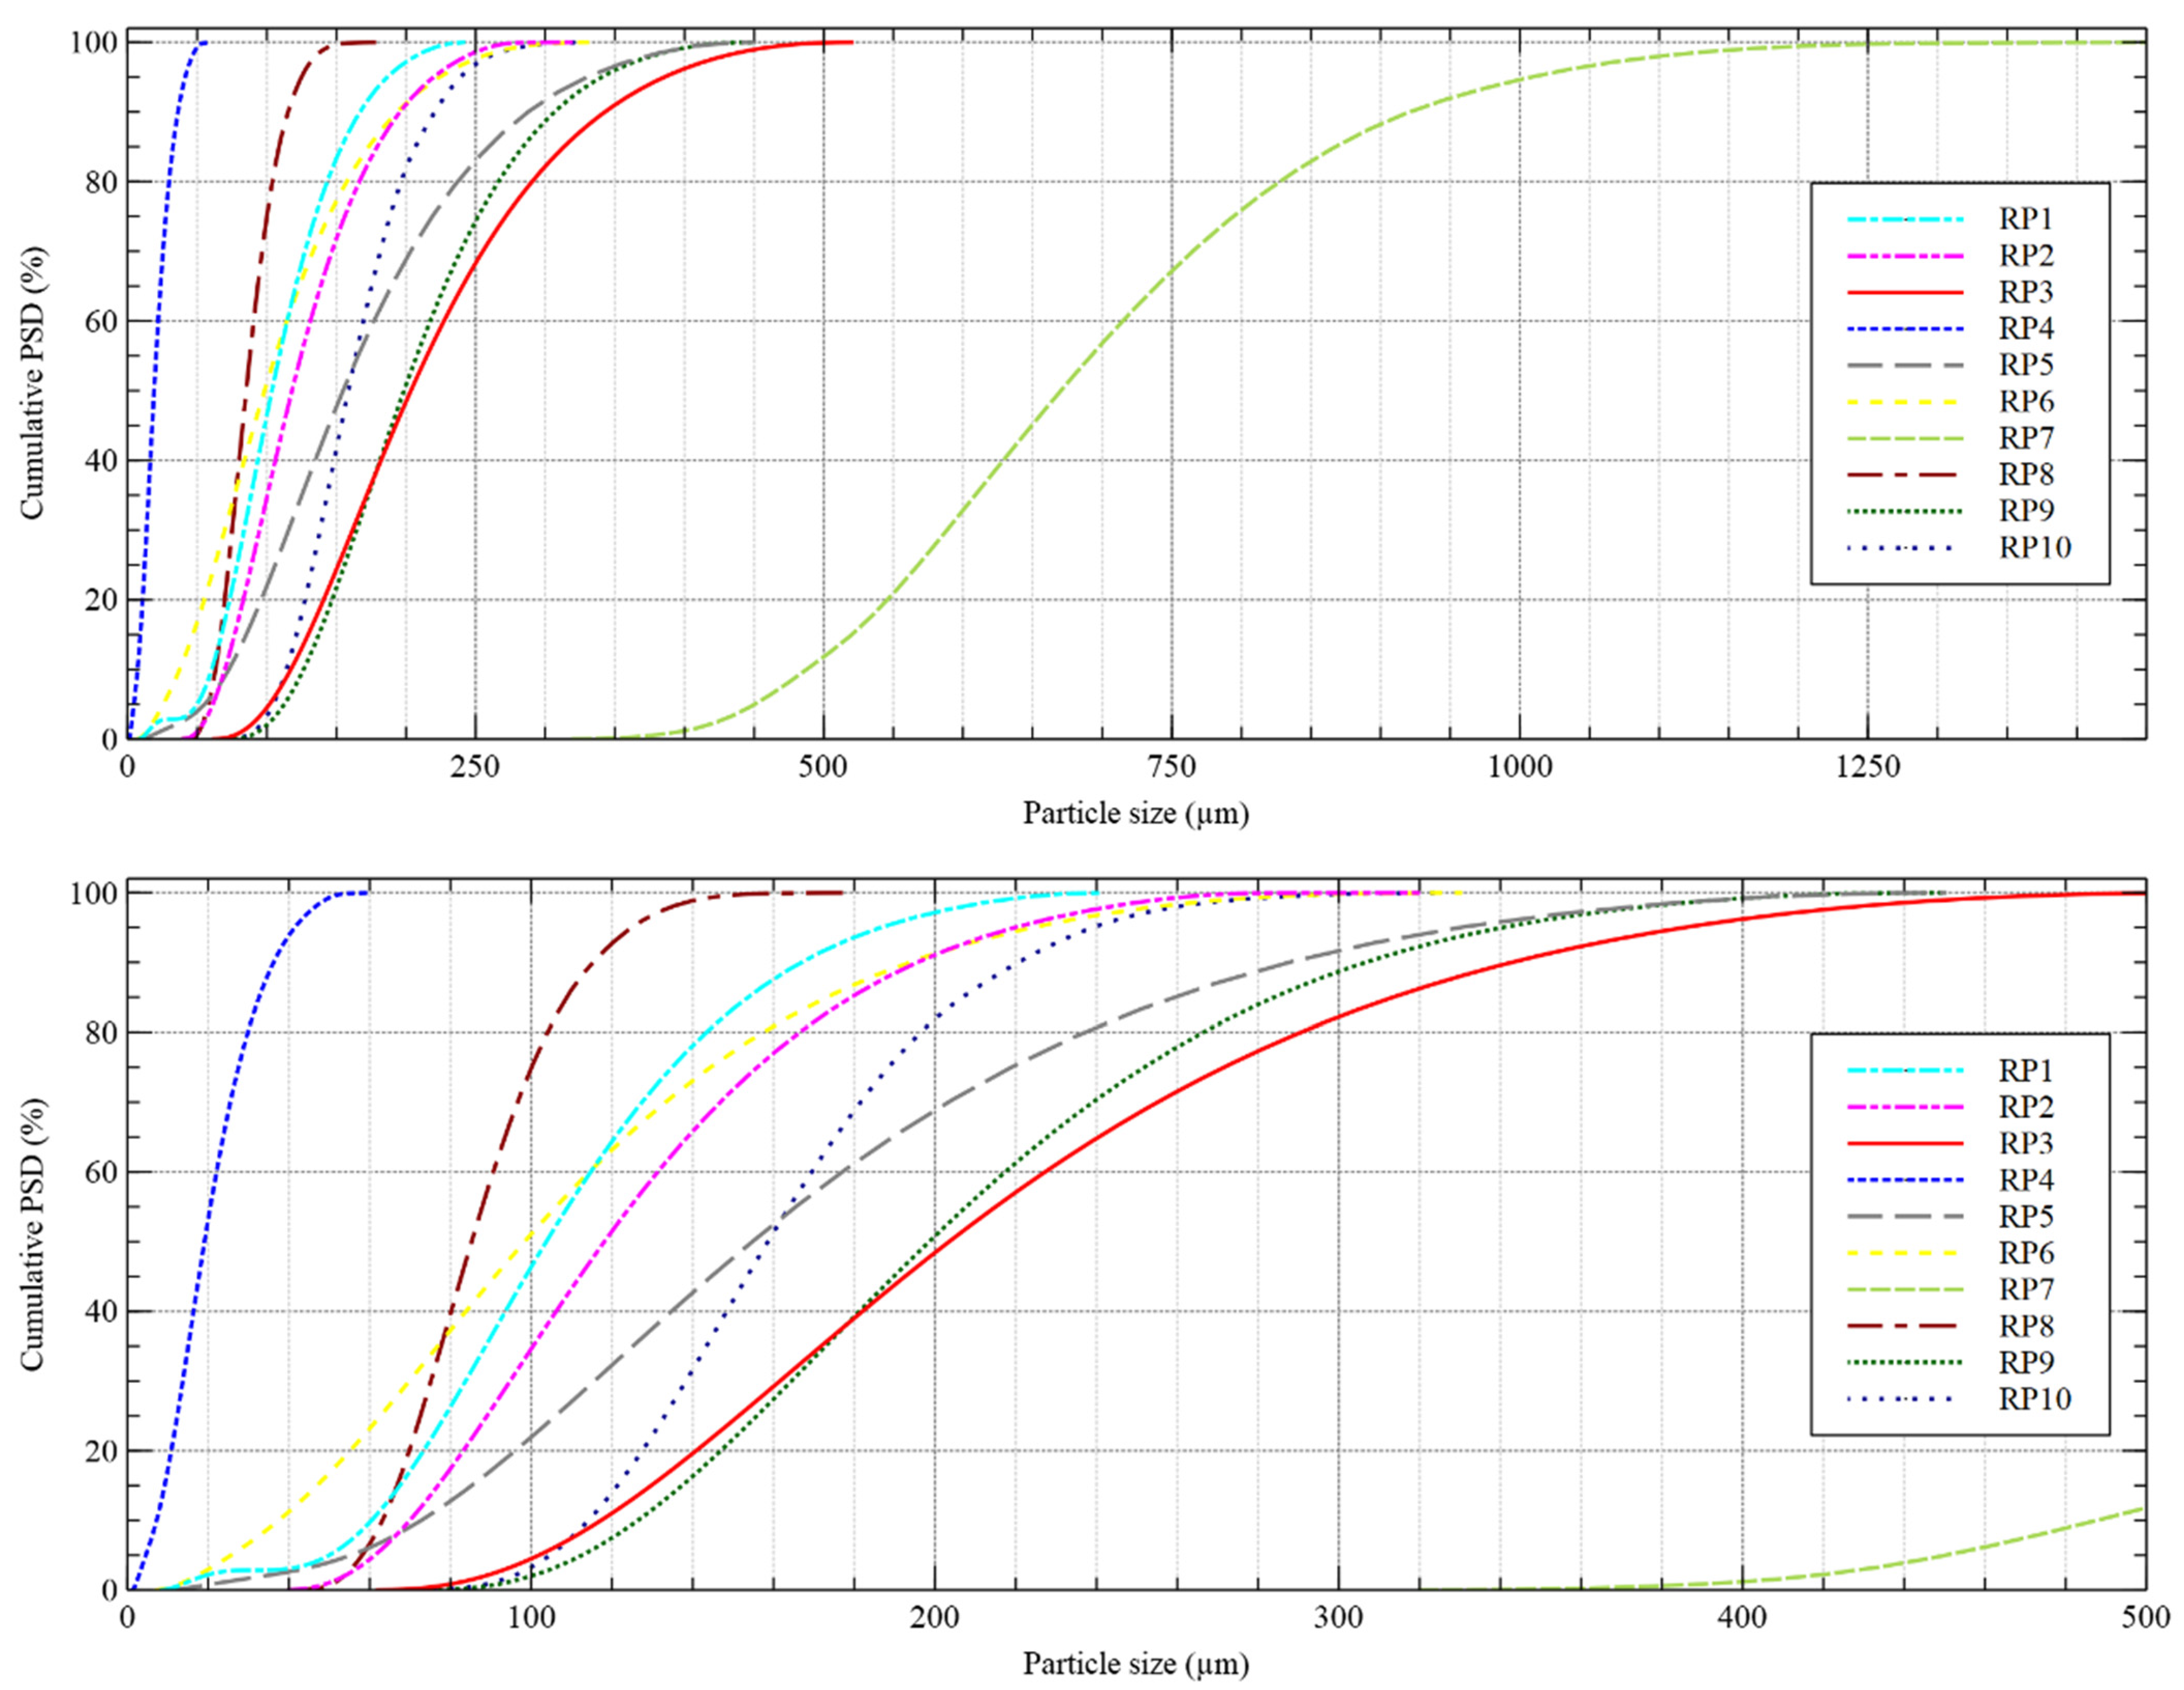
3.2. Particle Size Distribution
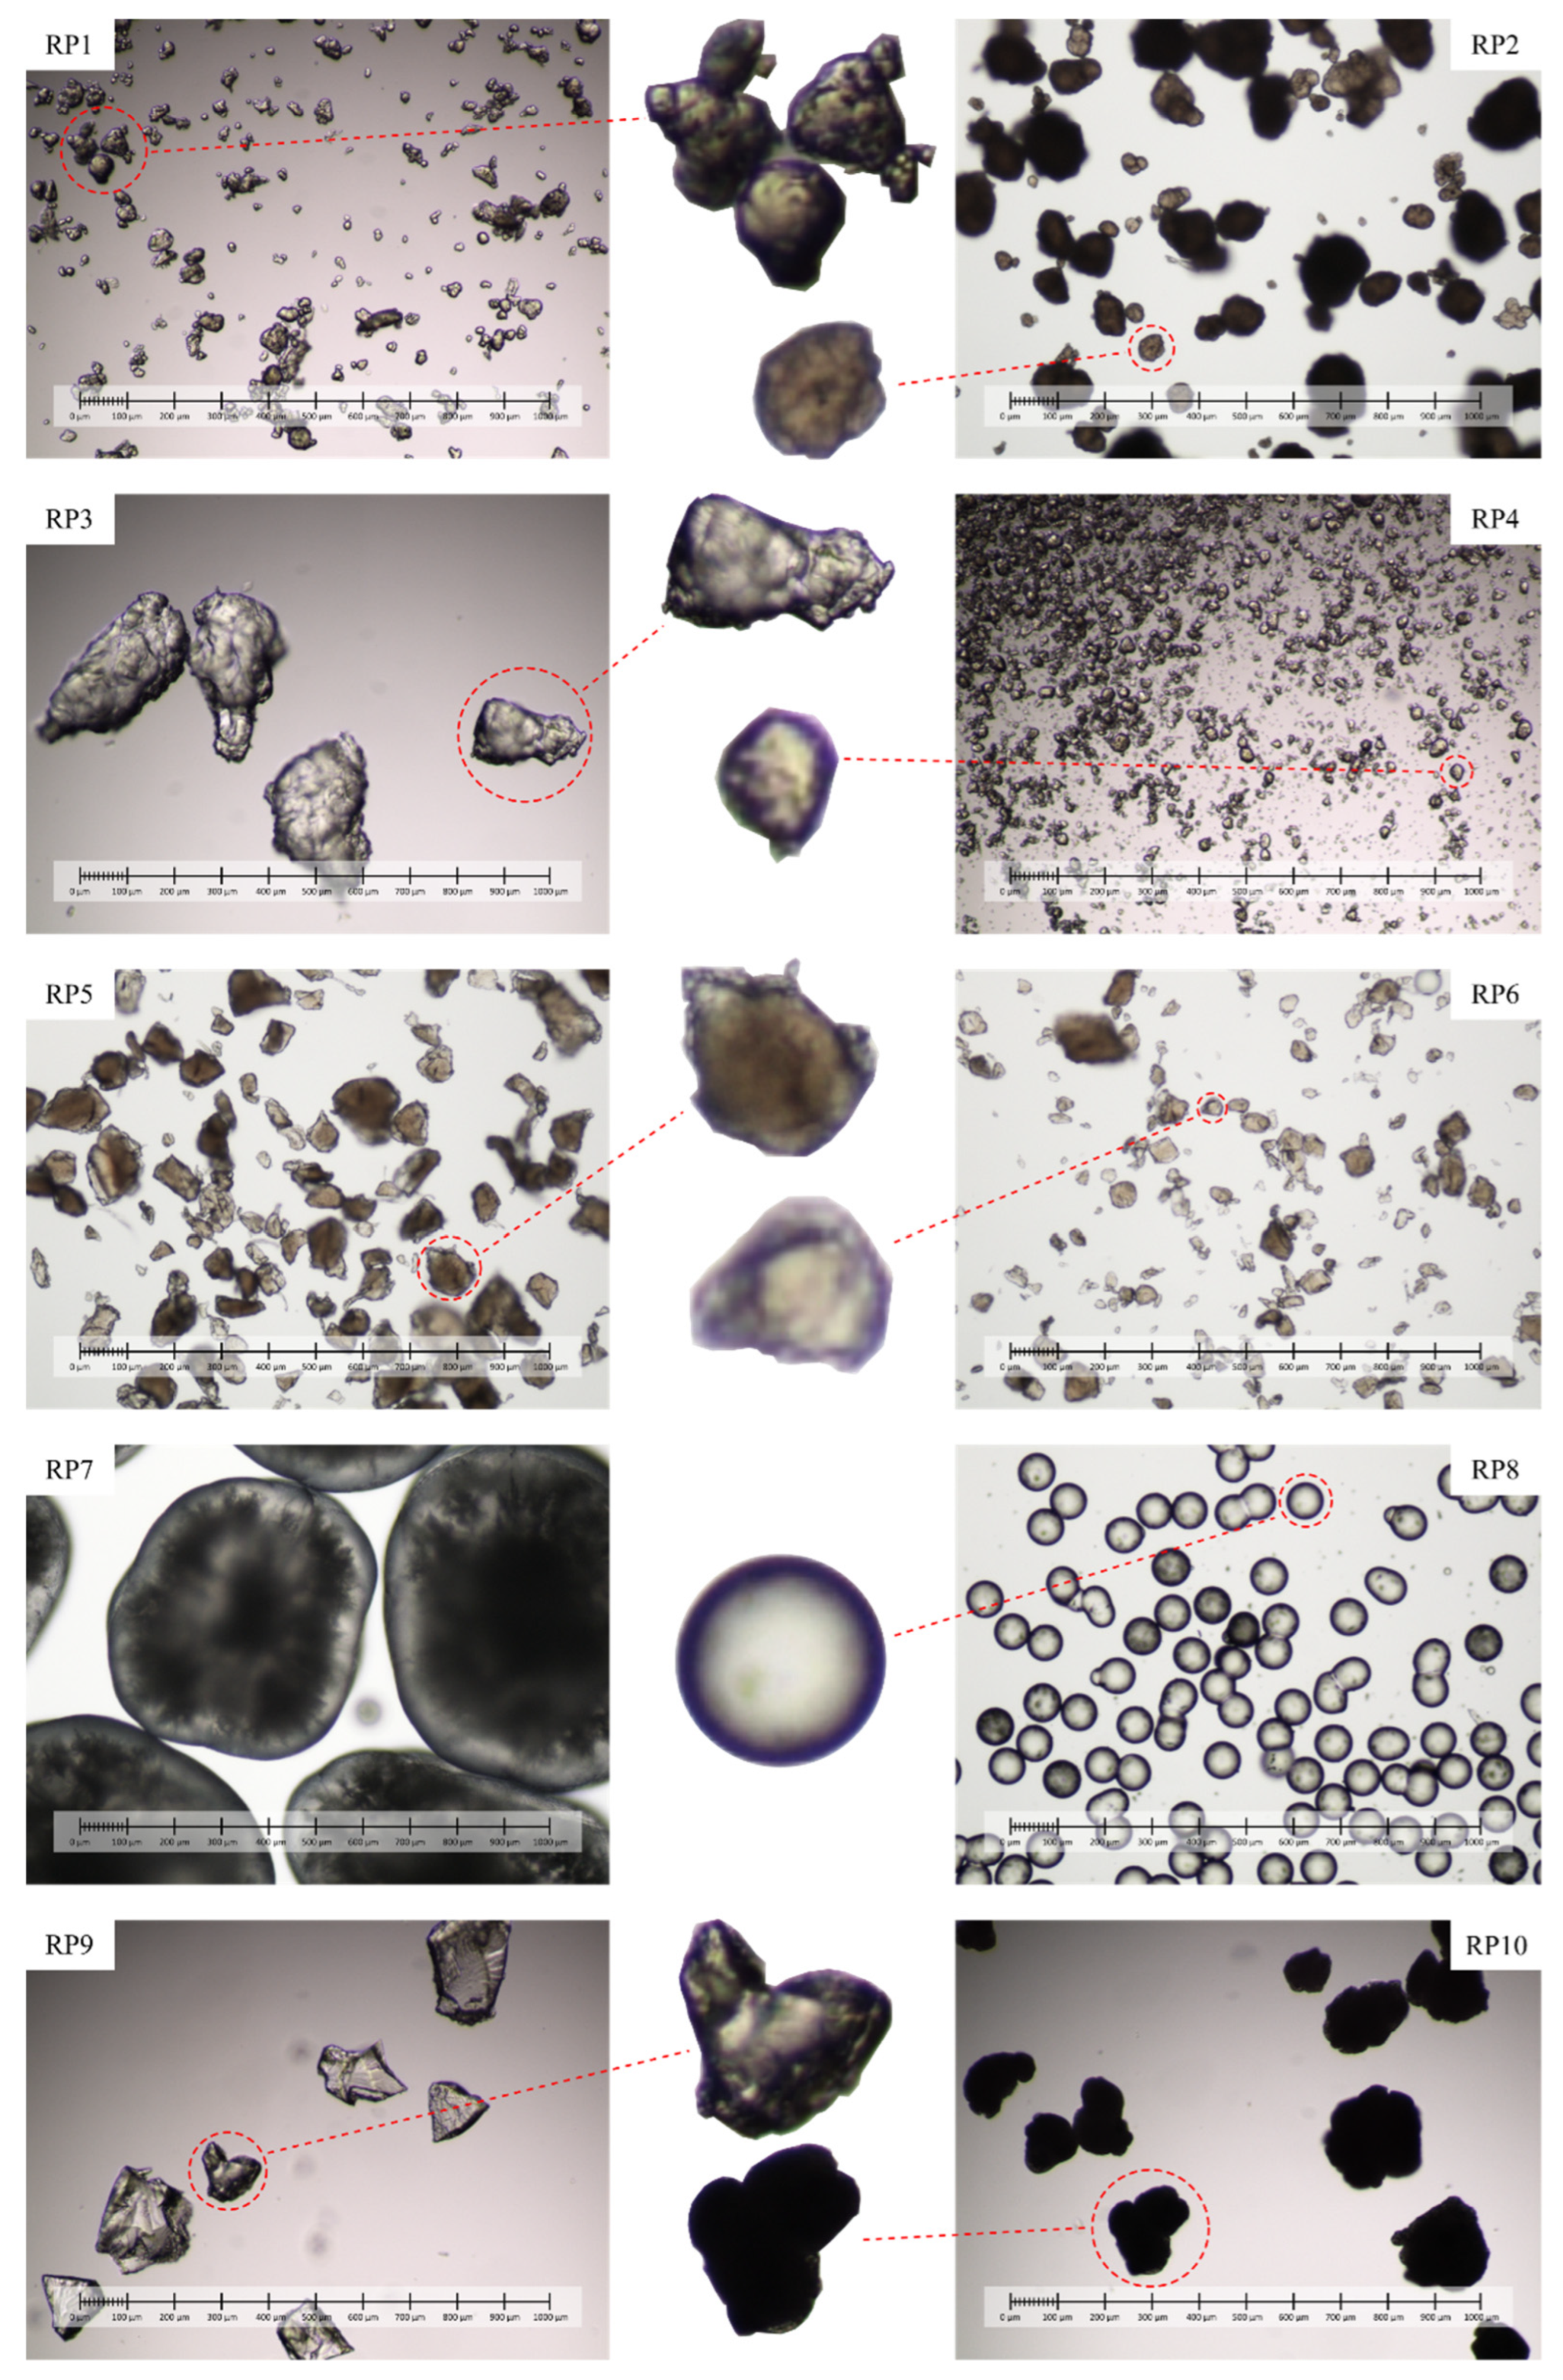
Generally, in bulk solids, particle collectives of varying particle sizes occur. PSD provides the basis for process design. PSD, determined by laser diffraction measurements, revealed Gaussian distributions (Supplementary Materials), where Dmin, Dmax, D10, D50 and D90 could be extrapolated thereafter (Table 2, Figure 1). Reported particle size distribution was found neither stringent nor accurate. Four manufacturers presented mean particle sizes (D50), and five reported maximal particle sizes (Dmax), exclusively (Table 1). One manufacturer, INEOS, reported specifications on D60 (500–700 µm) and D90 (350–1000 µm) (according to the data sheet). No D50 and Dmax results were found in line with manufacturer reports. RP8 (+6.5%) and RP7 (+11.7%) were found to have increased, and RP2 (−21.3%) and RP4 (9.05%) decreased, respectively. For Dmax, even greater divergences could be detected, ranging from +10% (RP6), +30% (RP10), +50% (RP5) up to +101% (RP1), +160% (RP3) and 400% in RP9. These results underline the importance of literarily referring to D values, which are all thoroughly presented in this publication (Table 2) but were rarely found in the manufacturer information (Table 1). In principle, particle size and PSD, as well as particle shape and electrokinetic potential, impact particle transport and retention time in ecosystems along the food chain or even between tissues and cells of organisms [10,15].

3.3. Particle Shape

The nomenclature following the stringent classification of [2], who proposed a definition and a categorization framework to achieve consensus in MP research, was used. Visual inspection (Figure 2) revealed irregular MP structures in all RPs, despite RP8, which were found spherical. Images of all RPs are shown in Figure 2. As proposed before, particle shape strongly influences the behavior of plastic particles in fluid media [16]. It can have an effect on how particles are processed in the separation apparatus. The strong deviation from the ideal sphere shapes makes it difficult in the correct dimensioning and in the equipment design, as well as, for example, the correct determination of retention times. To evaluate the particle shape of the MP fractions we used optical inspection to get exact nondestructive impressions of individual particles. Additionally, MP shape and color may affect whether an animal ingests MPs or not [15].

4. Conclusions

The results of this study will set a new source to future harmonize the application of RPs in MP research to further develop economically competitive separation processes. It was shown that the publicly available manufacturers and requested specifications lack information on detailed particle sizes and size distributions, a crucial parameter to describe particle transport and retention time. It can be shown that by expanding the publicly available and requested data, a systematic evaluation of relevant low-cost MP bulk solids can be given, which creates added value for the design and selection of a process engineering separation strategy. With these basic data, one is now able to selectively choose the relevant material, as well as the physical properties needed, for the respective application and thus develop existing separation processes or implement new process designs. Considering the diversity and complexity of secondary MPs, full and representative characterization of primary MPs should be encouraged in publications, particularly when used as reference particles in MP research. More commercially available particles should be investigated in depth to increase the portfolio of RPs, including standardized techniques, e.g., weathering, swelling and aging of MPs, to provide insights close to the effects at environmental settings. Shaping our methodical and analytical tools will facilitate the prediction and accurate evaluation of the long-term impacts of MPs on the biosphere.

Supplementary Materials

The following supporting information can be downloaded at: https://www.mdpi.com/article/10.3390/microplastics1010015/s1, Table S1: Values for polynomial regression coefficients a 1 a 6 for the particle size distributions of RP1–RP10 including R2 and RMSE. Figure S1: Distribution density of RP1-RP10. Figure S2: Particle size distribution (PSD; cumulative) of the microplastic particles.

Author Contributions

Conceptualization, T.S., M.P., L.D. and F.A.; methodology, T.S., L.D. and F.A.; validation, T.S., M.P., L.D., F.A. and A.W.; investigation, T.S. and A.W.; resources, M.P. and L.D.; writing-original draft preparation, T.S., F.A. and A.W.; writing—review and editing, T.S., A.W., M.P., L.D. and F.A.; visualization, T.S.; supervision, T.S.; project administration, T.S. and L.D.; funding acquisition, T.S. and L.D. All authors have read and agreed to the published version of the manuscript.

Funding

This research received no external funding.

Institutional Review Board Statement

Not applicable.

Informed Consent Statement

Not applicable.

Data Availability Statement

Data is contained within the article.

Acknowledgments

We would like to thank Benedikt Stern for laboratory assistance. Moreover, thanks go to Christian Mayerl, who supported with measurements and data analysis in this study.

Conflicts of Interest

The authors declare no conflict of interest.

References

  1. Mitrano, D.M.; Wohlleben, W. Microplastic regulation should be more precise to incentivize both innovation and environmental safety. Nat. Commun. 2020, 11, 5324. [Google Scholar] [CrossRef]
  2. Hartmann, N.B.; Huffer, T.; Thompson, R.C.; Hassellöv, M.; Verschoor, A.; Daugaard, A.E.; Rist, S.; Karlsson, T.; Brennholt, N.; Cole, M. Are We Speaking the Same Language? Recommendations for a Definition and Categorization Framework for Plastic Debris; ACS Publications: Washington, DC, USA, 2019. [Google Scholar]
  3. Shim, W.J.; Hong, S.H.; Eo, S.E. Identification Methods in Microplastic Analysis: A Review. Anal. Methods 2017, 9, 1384–1391. [Google Scholar] [CrossRef]
  4. Ahmed, M.B.; Rahman, M.S.; Alom, J.; Hasan, M.S.; Johir, M.A.H.; Mondal, M.I.H.; Lee, D.-Y.; Park, J.; Zhou, J.L.; Yoon, M.-H. Microplastic particles in the aquatic environment: A systematic review. Sci. Total Environ. 2021, 775, 145793. [Google Scholar] [CrossRef] [PubMed]
  5. Kowalski, N.; Reichardt, A.M.; Waniek, J.J. Sinking rates of microplastics and potential implications of their alteration by physical, biological, and chemical factors. Mar. Pollut. Bull. 2016, 109, 310–319. [Google Scholar] [CrossRef] [PubMed]
  6. Albertsson, A. Degradable Polymers, Recycling, and Plastics Waste Management; CRC Press: Boca Raton, FL, USA, 1995. [Google Scholar]
  7. Mason, S.A.; Garneau, D.; Sutton, R.; Chu, Y.; Ehmann, K.; Barnes, J.; Fink, P.; Papazissimos, D.; Rogers, D.L. Microplastic pollution is widely detected in US municipal wastewater treatment plant effluent. Environ. Pollut. 2016, 218, 1045–1054. [Google Scholar] [CrossRef] [PubMed]
  8. Mohamed Nor, N.H.; Kooi, M.; Diepens, N.J.; Koelmans, A.A. Lifetime accumulation of microplastic in children and adults. Environ. Sci. Technol. 2021, 55, 5084–5096. [Google Scholar] [CrossRef] [PubMed]
  9. Frias, J.; Nash, R. Microplastics: Finding a consensus on the definition. Mar. Pollut. Bull. 2019, 138, 145–147. [Google Scholar] [CrossRef] [PubMed]
  10. Connors, K.A.; Dyer, S.D.; Belanger, S.E. Advancing the quality of environmental microplastic research. Environ. Toxicol. Chem. 2017, 36, 1697–1703. [Google Scholar] [CrossRef] [PubMed]
  11. da Costa, J.P.; Reis, V.; Paço, A.; Costa, M.; Duarte, A.C.; Rocha-Santos, T. Micro (nano) plastics—Analytical challenges towards risk evaluation. TrAC Trends Anal. Chem. 2019, 111, 173–184. [Google Scholar] [CrossRef]
  12. Potthoff, A.; Oelschlägel, K.; Schmitt-Jansen, M.; Rummel, C.D.; Kühnel, D. From the sea to the laboratory: Characterization of microplastic as prerequisite for the assessment of ecotoxicological impact. Integr. Environ. Assess. Manag. 2017, 13, 500–504. [Google Scholar] [CrossRef] [PubMed]
  13. Seghers, J.; Stefaniak, E.A.; La Spina, R.; Cella, C.; Mehn, D.; Gilliland, D.; Held, A.; Jacobsson, U.; Emteborg, H. Preparation of a reference material for microplastics in water—Evaluation of homogeneity. Anal. Bioanal. Chem. 2022, 414, 385–397. [Google Scholar] [CrossRef] [PubMed]
  14. Ogonowski, M.; Gerdes, Z.; Gorokhova, E. What we know and what we think we know about microplastic effects—A critical perspective. Curr. Opin. Environ. Sci. Health 2018, 1, 41–46. [Google Scholar] [CrossRef]
  15. Rochman, C.M.; Brookson, C.; Bikker, J.; Djuric, N.; Earn, A.; Bucci, K.; Athey, S.; Huntington, A.; McIlwraith, H.; Munno, K. Rethinking microplastics as a diverse contaminant suite. Environ. Toxicol. Chem. 2019, 38, 703–711. [Google Scholar] [CrossRef] [PubMed] [Green Version]
  16. Rosal, R. Morphological description of microplastic particles for environmental fate studies. Mar. Pollut. Bull. 2021, 171, 112716. [Google Scholar] [CrossRef] [PubMed]
Figure 1. Particle size distribution (PSD; cumulative) of the microplastic particles for comparison. The upper figure describes the distribution sum over the entire measuring range up to 1450 µm. The lower figure shows a magnification for the particle size range up to 500 µm.
Microplastics 01 00015 g001
Figure 2. Microscope photos for evaluation of particle shape of reference particles RP1–RP10. The scale shown indicates the particle size from 0–1000 µm.
Microplastics 01 00015 g002
Table 1. Overview of powders obtained and manufacturer-provided particle properties (10 December 2021).
NameTypeProduct NameManufacturerDensity (kg/m3)Size (µm)Price Range (USD/kg)Order Quantity (kg)
RP1HDPERowalit N100-20ROWAK AG9560–120 *101–3000.5
RP2HDPEET306010GOODFELLOW CORP.940150 **301–5000.5
RP3LDPERowalit H70ROWAK AG9180–200 *101–3000.5
RP4PAVestosint 2158EVONIK INDUSTRIES AG101621 **0–10020
RP5PETES306030GOODFELLOW CORP.1300–1400<300 ***301–5000.5
RP6PETES306031GOODFELLOW CORP.1300–1400<300 ***301–5000.5
RP7PPEltex P KS001PFINEOS OLEFINS & POLYMERS EUROPE895600 **-25
RP8PSPrimeCast 101EOS GMBH700–85080 **0–1002
RP9PURRowalit 500-9HROWAK AG11900–90 *101–3000.5
RP10PVCCV316010GOODFELLOW CORP.1400<250101–3002
* Data available on request; ** Mean particle size distribution (D50); *** Provided on website (not available on data sheet); USD: US-Dollar; RP: reference particles; HDPE: High Density Polyethylene; LDPE: Low Density Polyethylene; PA: Polyamide; PET: Polyethylene Terephthalate; PP: Polypropylene; PS: Polystyrene; PUR: Polyurethane; PVC: Polyvinyl Chloride.
Table 2. Physical parameters determined in this study for reference particle RP1 to RP10.
NameTypeDensity (kg/m3)Particle Size Distribution (µm)Shape *
DminD10D50D90Dmax
RP1HDPE951961104167241Irregular particles
RP2HDPE9504070118196320Irregular particles
RP3LDPE91662117203343520Irregular particles
RP4PA10591719.13660Irregular particles
RP5PET14021073155288450Irregular particles
RP6PET140973898194330Irregular particles
RP7PP8823204886709211450Irregular particles
RP8PS1069406385115177Spheres
RP9PUT121871126199307450Irregular particles
RP10PVC141472114159221325Irregular particles
* Parameters were obtained with a Nikon Eclipse 50i microscope, depicted in Figure 2; D: characteristic diameter in particle size distribution.
Table 3. Polynomial data regression for reference particles RP3. Same procedure was conducted for all reference particles (not shown).
Polynom *R2RMSE
Q ( d ) = a 1 d + a 2 0.928210.17
Q ( d ) = a 1 d 2 + a 2 d + a 3 0.98824.146
Q ( d ) = a 1 d 3 + a 2 d 2 + a 3 d + a 4 0.99283.206
Q ( d ) = a 1 d 4 + a 2 d 3 + a 3 d 2 + a 4 d + a 5 0.99911.184
Q ( d ) = a 1 d 5 + a 2 d 4 + a 3 d 3 + a 4 d 2 + a 5 d + a 6 1.0000.220
Q ( d ) = a 1 d 6 + a 2 d 5 + a 3 d 4 + a 4 d 3 + a 5 d 2 + a 6 d + a 7 1.0000.184
* Values for the polynomial regression coefficients a 1 a 6 for the particle size distributions of RP1-RP10, including R2 and RMSE, can be found in the Supplementary Materials.
Table 4. Measurement data for particle density of reference particles RP1-RP10.
NameAverage Particle Density (kg/m3)Number of Measurements (−)Standard Deviation (kg/m3)Var. Coefficient (%)
RP195170.10.0089
RP2949.7100.20.0209
RP3915.5900.0050
RP41058.51200.0047
RP51401.6100.30.0180
RP61408.7100.50.0323
RP7881.9100.90.1025
RP81068.7100.40.0407
RP91218.4100.10.0099
RP101413.8120.40.0303
Publisher’s Note: MDPI stays neutral with regard to jurisdictional claims in published maps and institutional affiliations.

