Article

Evaluating AlphaFold 3 Folding of the Intrinsically Disordered Human DNA Topoisomerase IIα C-Terminal Domain

by
Charisse M. Nartey
1 and
Joseph E. Deweese
2,3,*
1
Independent Researcher, Dallas, TX 75226, USA
2
Department of Biological, Physical, and Human Sciences, Freed-Hardeman University, Henderson, TN 38340, USA
3
Department of Biochemistry, Vanderbilt University School of Medicine, Nashville, TN 37204, USA
*
Author to whom correspondence should be addressed.
Submission received: 13 June 2025 / Revised: 14 August 2025 / Accepted: 17 September 2025 / Published: 25 September 2025

Abstract

Background/Objectives: Intrinsically disordered protein regions (IDRs) are difficult to study due to their flexible nature and transient interactions. Computational folding using AlphaFold may offer one way to explore potential folding of these regions under various conditions. Human DNA topoisomerase IIα (TOP2A) is an essential enzyme involved in regulating DNA topology during replication and cell division. TOP2A has an IDR at the C-terminal domain (CTD) that has been shown to be important for regulating TOP2A function, but little is known about potential conformations that it may undertake. Methods: Utilizing the AlphaFold 3 (AF3) model by way of AlphaFold Server, TOP2A was folded as a dimer first without and then with 29 literature-supported post-translational modifications (PTMs) and DNA to observe whether there is predicted folding. Results: TOP2A CTD does not fold in the absence of PTMs. With the addition of PTMs, however, the CTD is predicted to fold into a globular bundle of loops and α-helices. While DNA alone did not induce folding, in the presence of PTMs, DNA ligands increased helicity of the folded CTD and caused it to interact at different core domain interfaces. In addition, DNA is predicted to enable folding of the TOP2A CTD in the presence of fewer PTMs when compared to the absence of DNA. Conclusions: AF3 predicts the folding of TOP2A CTD in the presence of specific PTMs, and this folding appears to shift to allow binding to DNA in functionally relevant regions. These studies provide predicted folding patterns that can be tested by biochemical approaches. AF3 may support the development of testable hypotheses regarding IDRs and enables researchers to model protein-DNA interactions.

1. Introduction

Intrinsically disordered regions (IDRs) within proteins are a growing theme in biochemistry and structural biology [1,2,3,4,5]. An increasing number of proteins have been found to have unstructured domains or regions that take shape in the presence of other proteins, nucleic acids, post-translational modifications, and other interactions [1,2,3,4,5,6,7]. While amino acid sequence predictions can identify likely IDRs, the conformations of these regions are hard to capture in X-ray crystallographic and cryo-electron microscopy structures [8].
Advancements in computational protein folding using tools such as AlphaFold have really advanced the ability to examine folding in proteins that do not have solved structures [9]. In addition, the release of AlphaFold 3 (AF3) and the ability to access the model directly via AlphaFold Server allows researchers to input specific amino acid sequences along with post-translational modifications, ions, nucleotides, DNA or RNA sequences, or even additional proteins, which AF3 then proceeds to fold into the predicted most stable conformations [10]. This tool can be used to study proteins that are dimers or multimers or are found in complex with other proteins [10]. Further, it also allows researchers to explore what might happen with unstructured protein domains [11]. Recently, we applied AF3 to a key protein of interest, DNA topoisomerase II.
Human DNA topoisomerase IIα (TOP2A) is a nuclear enzyme involved in regulating and maintaining DNA topology during processes such as replication and mitosis [12]. TOP2A utilizes a transient, enzyme-linked double-strand break to pass another segment of DNA through the break to relax supercoiled plasmid or to unlink catenated chromosomes [12]. Eukaryotic TOP2 enzymes are homodimers consisting of several complex domains that coordinate during the catalytic cycle. The C-terminal domain (CTD) of TOP2A (Figure 1A) is an IDR that is also the site of many post-translational modifications (PTMs), two Nuclear Localization Sequences (NLS), and several known protein–protein interactions [8,13,14,15,16,17,18,19,20,21,22,23,24,25,26,27,28,29,30,31]. Despite its relative lack of sequence conservation across organisms, the CTD of TOP2A is known to have functional impacts including influencing catalytic activity, determining substrate specificity, and directing cellular localization and function [21,22,31,32,33,34,35,36].
TOP2A and the other isoform found in mammals, topoisomerase IIβ (TOP2B), are targets for several widely used anticancer agents [37,38]. Compounds known as TOP2 poisons cause the enzyme to be trapped in a cleaved DNA state, which causes an increase in overall strand breaks [38,39]. These strand breaks can overwhelm a cell and lead to cell death [39]. In some cases, treatment with these agents can lead to other issues such as treatment-induced leukemias caused by etoposide or cardiotoxicity associated with anthracyclines [40,41]. These adverse events have both been linked to the action of TOP2B, which generally functions to regulate topology during transcription [37,42]. As a result, there is interest in identifying ways to specifically target TOP2A and avoid TOP2B [38]. However, the primary region where these two isoforms differ is in the CTD. Unfortunately, the CTD structure is not known due to the disordered nature of this region [8]. We have been examining point mutations in the CTD to try to map out regions that impact biochemical function using a purified enzyme system [32,33,35,36]. This work has demonstrated several regions that appear to play roles in modulating activity [36]. Research by other labs has demonstrated that the CTD is involved in liquid–liquid phase separation and preliminary evidence points toward a role of the CTD in chromatin condensation [13,43].
To extend this work, we have employed AF3 to examine whether the IDR is predicted to fold under various circumstances. Our results demonstrate that various factors influence the predicted structure of the CTD, but the single most important factor appears to be the presence of post-translational modifications (PTMs). Here we present AF3-predicted models for how the CTD of TOP2A may fold in the presence of PTMs and DNA.

2. Materials and Methods

Structure prediction using AF3. The original sequence of WT Human TOP2A residues 1–1531 was obtained from the Uniprot database (P11388) [44]. This sequence was then used as input in the AF3 model provided by AlphaFold Server (https://alphafoldserver.com/). The only protein sequence entered was P11388, and the option for two copies was selected, which generated the homodimeric structure. No other settings were altered from the default. All folding was carried out using the AlphaFold Server cloud-based folding. For the sequences with post translational modifications, the specific sites for phosphoserine and phosphothreonine were manually added to the sequence (Figure 1A). Magnesium ions, ATP molecules and DNA substrates were also added to their respective predictions using the AF3 interface. DNA sequences were derived from pBR322 (Table A1). The quality of the predicted models was assessed by comparing the plDDT (predicted local distance difference) values across the sequence, calculating RMSD values, and examining panels and overlays of the 5 predicted structures. Also, AF3 provides additional quality values that are included in Table A2. Visualization and analysis of AlphaFold predictions was performed using Pymol 3.1 or images exported from Alphafold Server [45]. Graphs and statistical analysis performed using Graphpad Prism 10 (https://www.graphpad.com/).

3. Results

3.1. Post-Translational Modifications Are Sufficient to Induce Predicted Folding

The original AlphaFold structure of TOP2A shows the CTD as an unfolded strand wrapping around a monomer of TOP2A [9]. Interestingly, AF3 yields a very similar structure even in the dimeric form with the CTDs from each protomer twisting around the folded core (Figure 1B). Also worth noting is that the extreme amino-terminal domain (NTD) also appears unfolded, which is consistent with the predicted disordered nature. Analysis of the CTD has identified several important phosphorylation sites, which have been the focus of studies in the past [16]. Lotz et al. utilized mass spectrometry to identify PTMs observed on human TOP2A [16]. AF3 allows the addition of PTMs such as phosphorylation into the model. Thus, we utilize the data of Lotz et al. and added 29 phosphorylation sites into the model including two in the core of the enzyme and another 27 in or near the CTD (Figure 1A). Intriguingly, the addition of a relatively small number of PTMs appears to be sufficient to enable the folding of the CTD by AF3 (Figure 1C). Most of the predicted CTD structure takes the form of helices and extended loop regions.
While in this structure the CTD is folded, it should be mentioned that the confidence level of this portion of the structure is very low (<50 on the predicted Local Distance Difference Test or plDDT). In addition, this is not a conformation that is likely to be found when DNA is bound. As can be seen in Figure 1C, the CTD wraps into the inner structure of the enzyme within a cavity that is the “upper gate” or N-gate region, which holds the DNA substrate prior to strand passage. It is possible that the enzyme samples this conformation in the absence of DNA, but it is outcompeted for the site when DNA is present.

3.2. DNA Substrates Alter Folding and Interact with the CTD

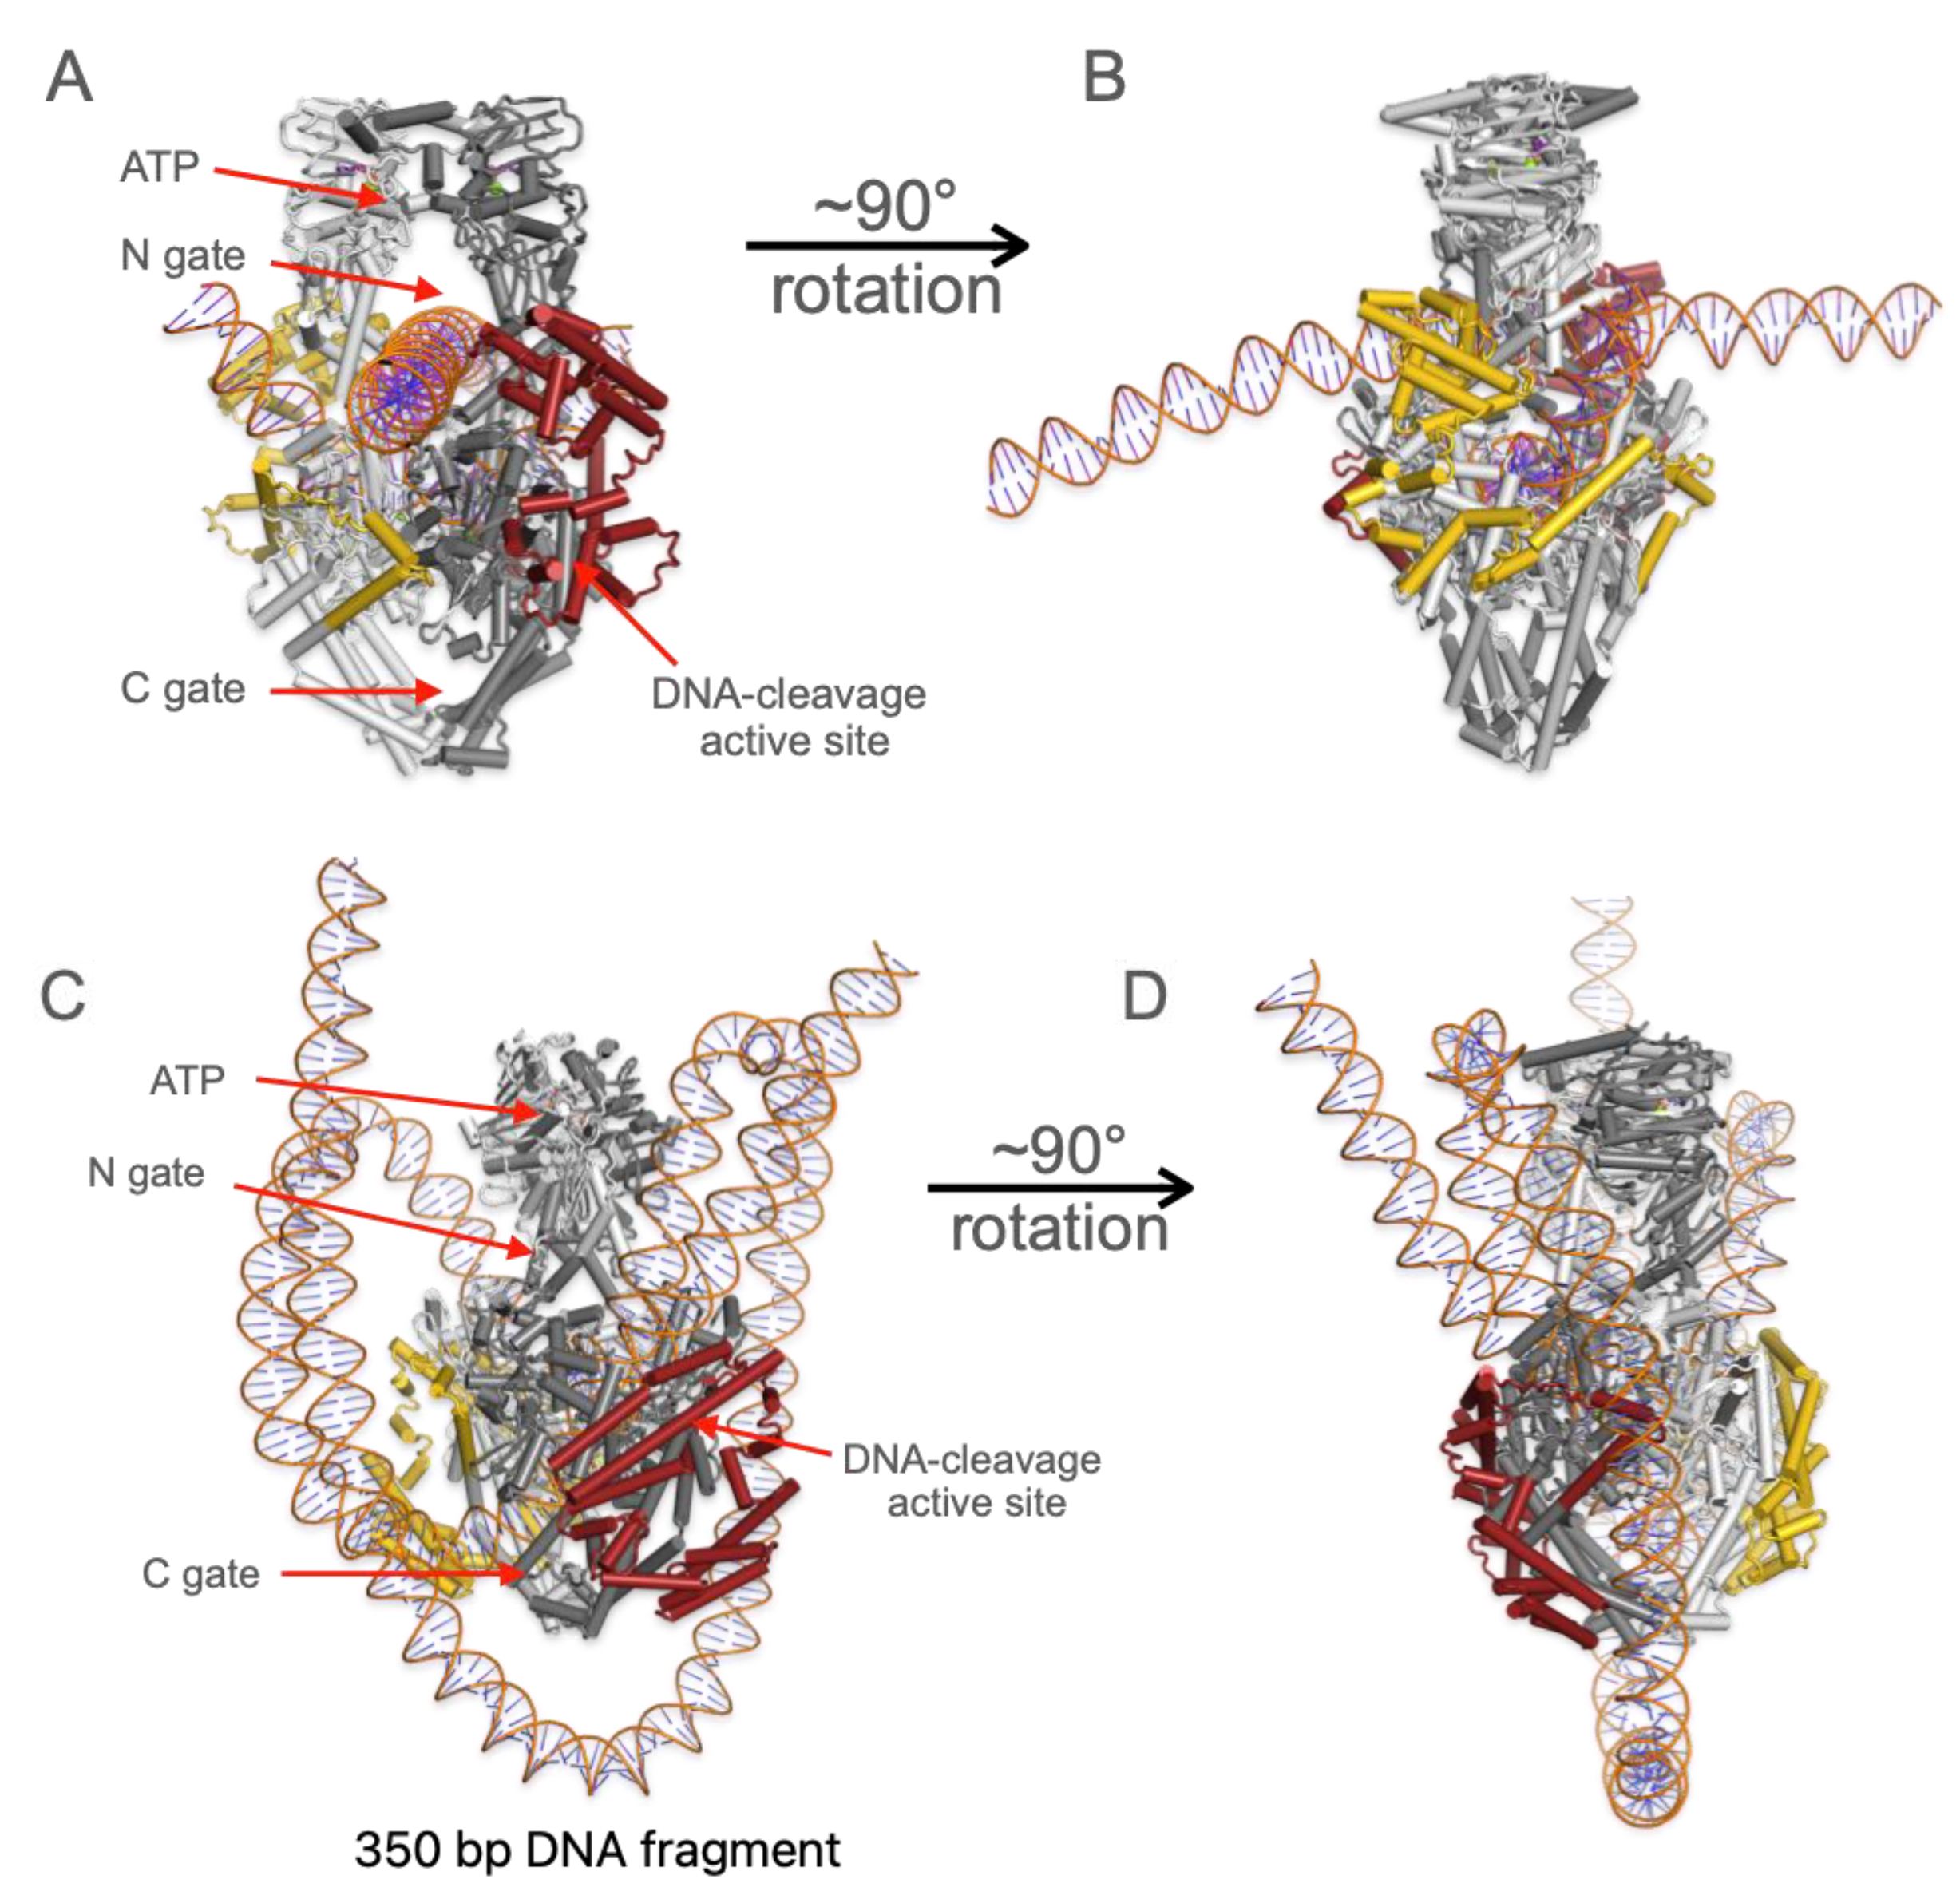
While PTMs are significant, topoisomerase II operates on DNA substrates. Therefore, we added DNA fragments into the analysis to see if this altered predicted folding. Using DNA sequence from the pBR322 plasmid where TOP2A is known to bind and be active, we added fragments of various sizes to determine whether CTD folding would be impacted [46]. As seen in Figure 2, the addition of DNA molecules does alter the folded structure as anticipated. In this model, two segments of DNA, a 50 bp double helix and a 75 bp double helix (TOP2+50/75 bp fragments), are included. One segment of DNA is found bent in the active site region while a second segment is found in the upper gate region, and its helical axis viewed from the top of the enzyme is rotated approximately 64° to the plane containing the bent helical axis of the segment in the active site.
With the DNA helices in the structure, the CTD moves out of the upper gate region and moves to the outside of the protein. The two CTDs wrap around the enzyme in a clockwise fashion when viewed from the top. The secondary structural elements continue to appear to be loops and helices. Also included in the structure were two ATP molecules and four Mg2+ ions. The ATP molecules and two of the Mg2+ ions are bound in the ATP binding pockets of the ATPase domain (Figure S1A). The other two Mg2+ are bound in the TOPRIM metal binding domains of the enzyme (Figure S1B). Because there are two active sites, one Mg2+ is in each TOPRIM domain. Yet again, as mentioned above, the CTD is still a very low confidence fold (plDDT < 50) within the AlphaFold metrics. By contrast, the core cleavage/ligation domain of the enzyme has a plDDT > 70. This provides confidence that AF3 can indeed accurately predict structure in this model, but that some parts, like the CTD and DNA oligomer, are less well constrained. The TOP2A predicted structure with the 350 bp fragment and PTMs does fold (Figure 2C,D). The CTD remains lower down around the lower gate for most of the models, and the position of the DNA is highly variable as discussed below.
It should be noted that the folding of these structures appears to be dependent upon the PTMs not the DNA. When structures were generated without PTMs but with either of the DNA substrates used, the CTD remained unstructured in the AF3 predictions (Figure S2). This may not be true of all possible DNA substrates, but at least these options were not sufficient to enable the model to predict CTD folding.

3.3. The CTD Fold Predictions Do Appear to Move Based upon the Substrate

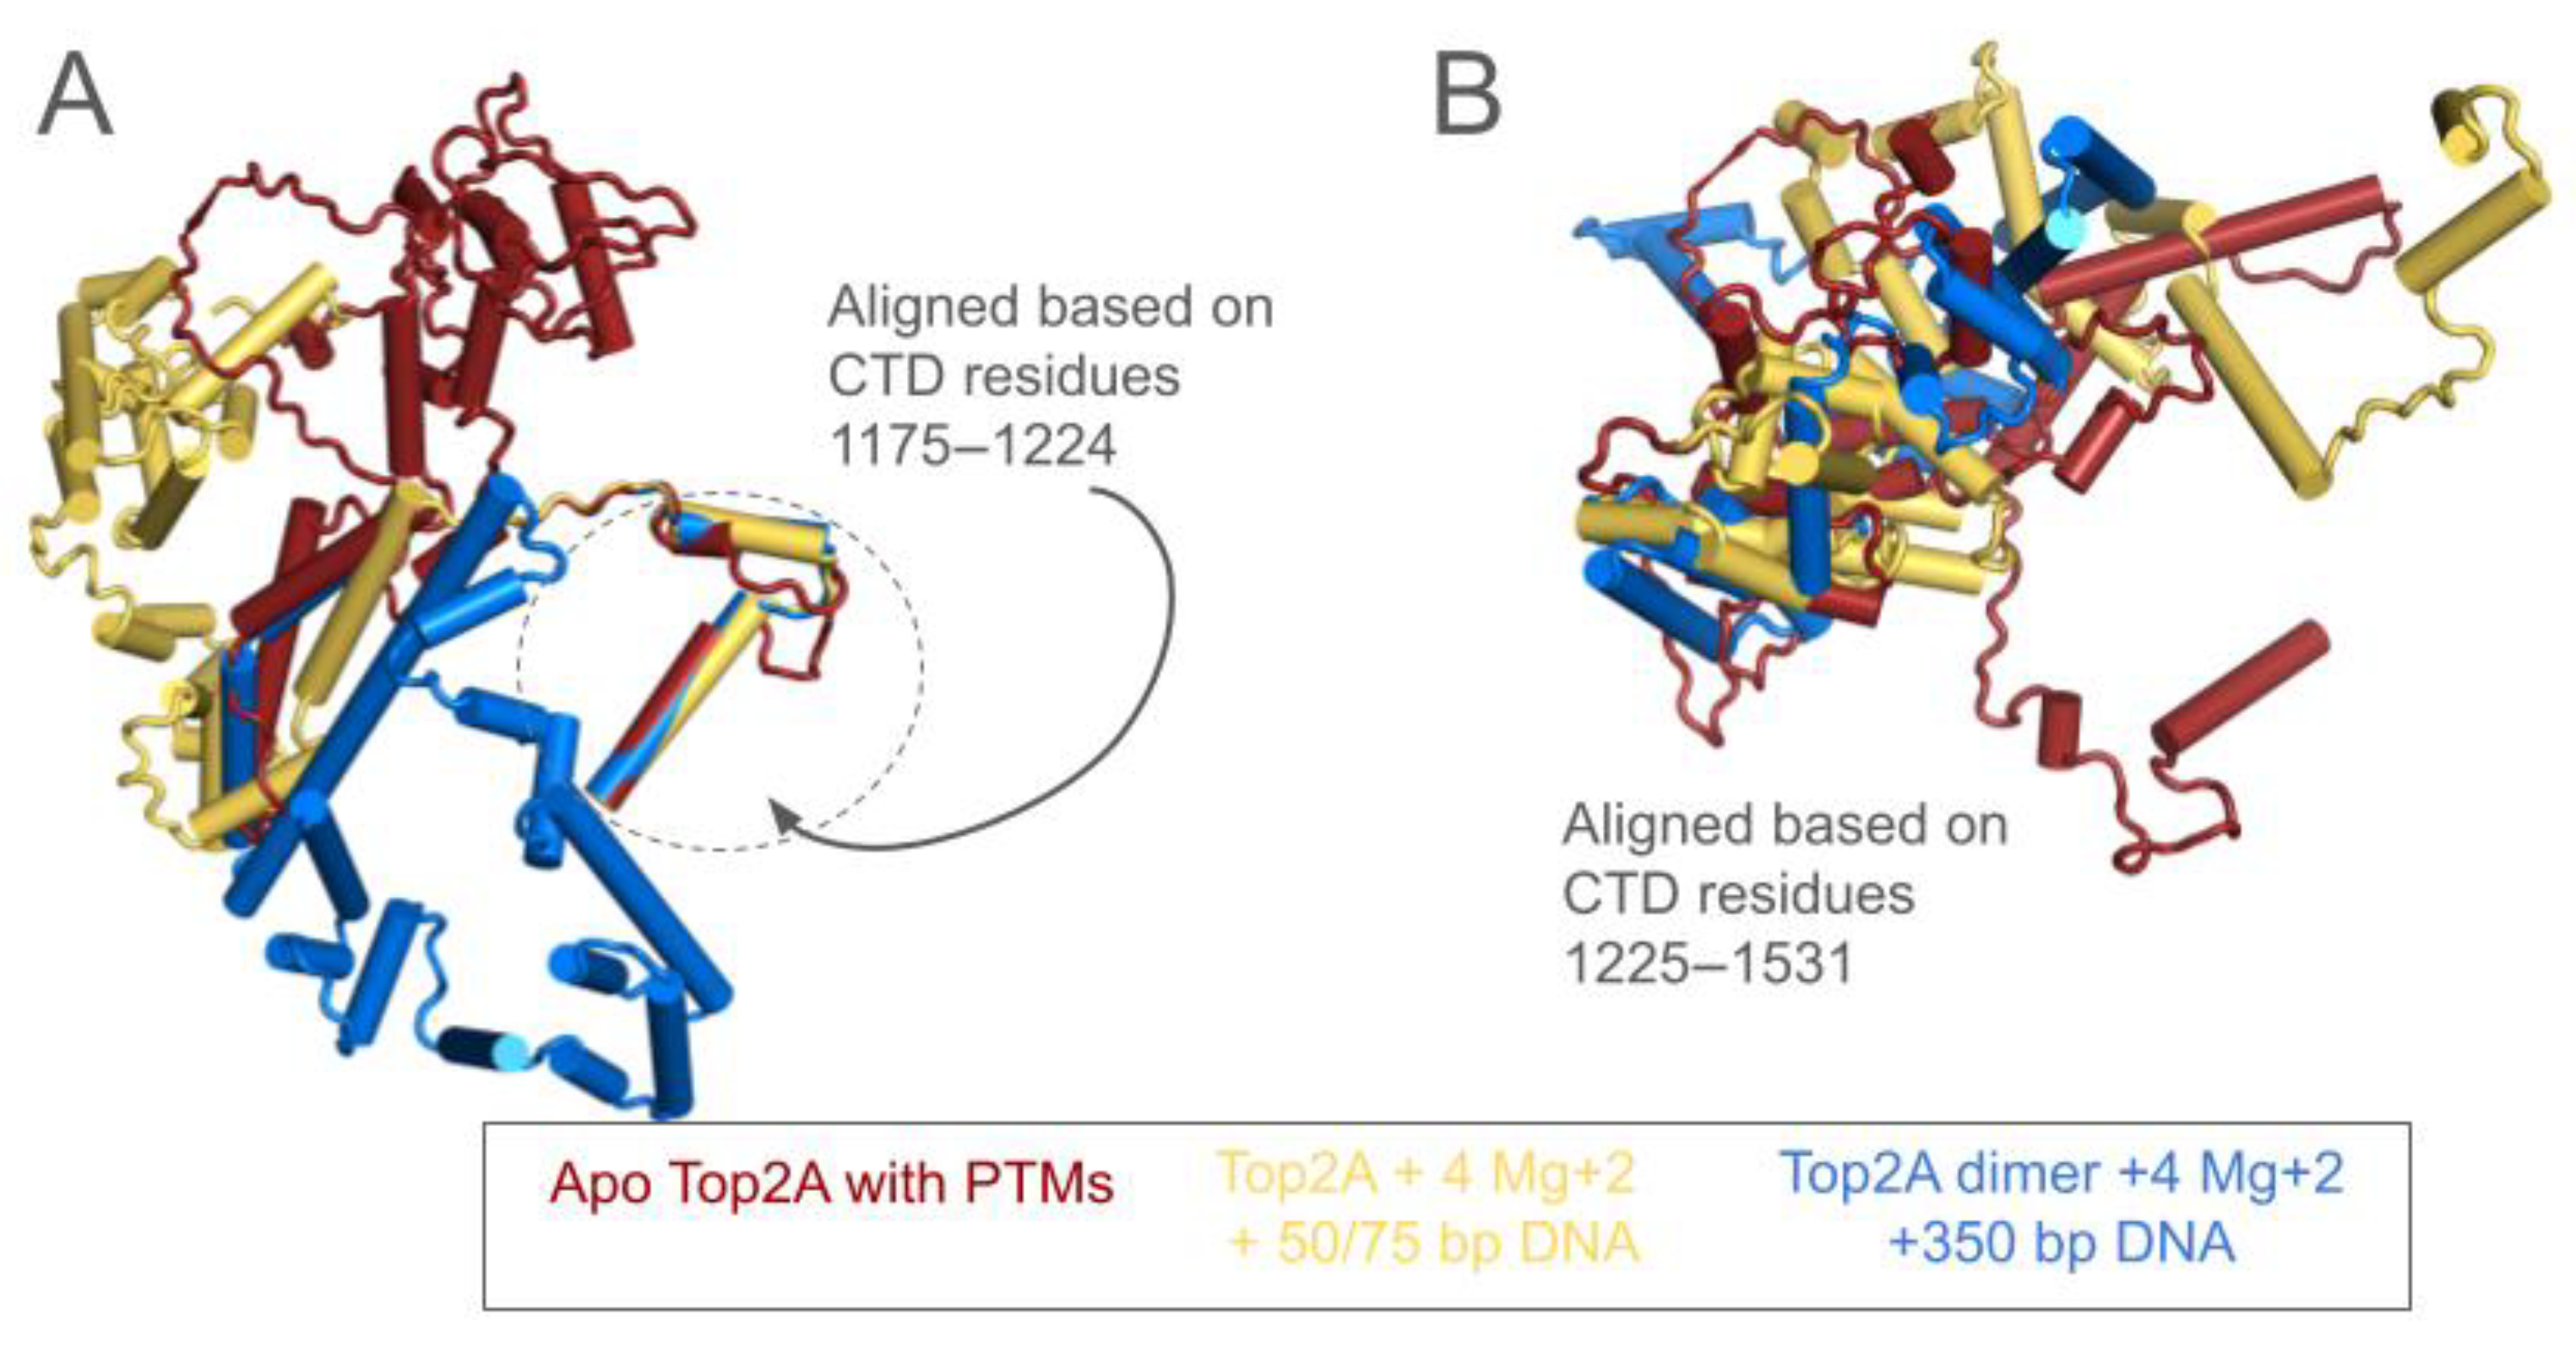
As seen in Figure 3A, the CTD shifts in response to both the addition of DNA to the model and changing the size of the DNA substrate within the model. In the models provided by AF3, there appear to be interactions between the CTD and both the Gate segment (G-segment, in the cleavage/ligation active site) and the Transport segment (T-segment, in the N-gate region). The portion that moves the least is the region most proximal in sequence to the folded domains of TOP2A (amino acids 1175–1224), which includes some interaction with the transport-segment of DNA. This region takes on a very similar conformation as that seen in the cryo-electronmicroscropy structure previously published [8]. Using these residues as the basis for an alignment highlights the large shifts in position for the folded CTD as DNA oligomers are added to the model.
Interestingly, the region that moves in response to the DNA substrate does not move as a rigid body, as seen in Figure 3B. The segment from 1225 to 1531 was aligned using Pymol, and the poor alignment demonstrates that the CTD does not move as a rigid body rather the relative positions of the loops and helices are rearranged in 3D space, consistent with the disordered nature of this region.
Given the low confidence scores for the CTD, we wanted to rule out flexible noise amongst the models as the explanation for this observed CTD movement across the complexes. To test for statistical significance, we first did all by all comparisons of RMSD values for the five models of each complex, A (TOP2 alone), B (TOP2+50/75bp) or C (TOP2+350bp). To capture any variation in interaction interfaces between the CTD and core domains, we used one monomer (Chain A, residues 1–1531) and excluded any DNA (Figure S3A). This analysis revealed a very tight set of models with most RMSDs < 4 Å. Next, we compared all models of each structure with the models of the other structures. This analysis revealed that structure C is significantly different from either A or B, even considering flexible noise amongst models. This difference is not explained away by changes to the core domains (Residues 1–1174), as the RMSD values considering just the core domains are ~6 or 7, as opposed to ~12 or 13 when the core + CTD are used for the calculation (compare Figure S3A,B).
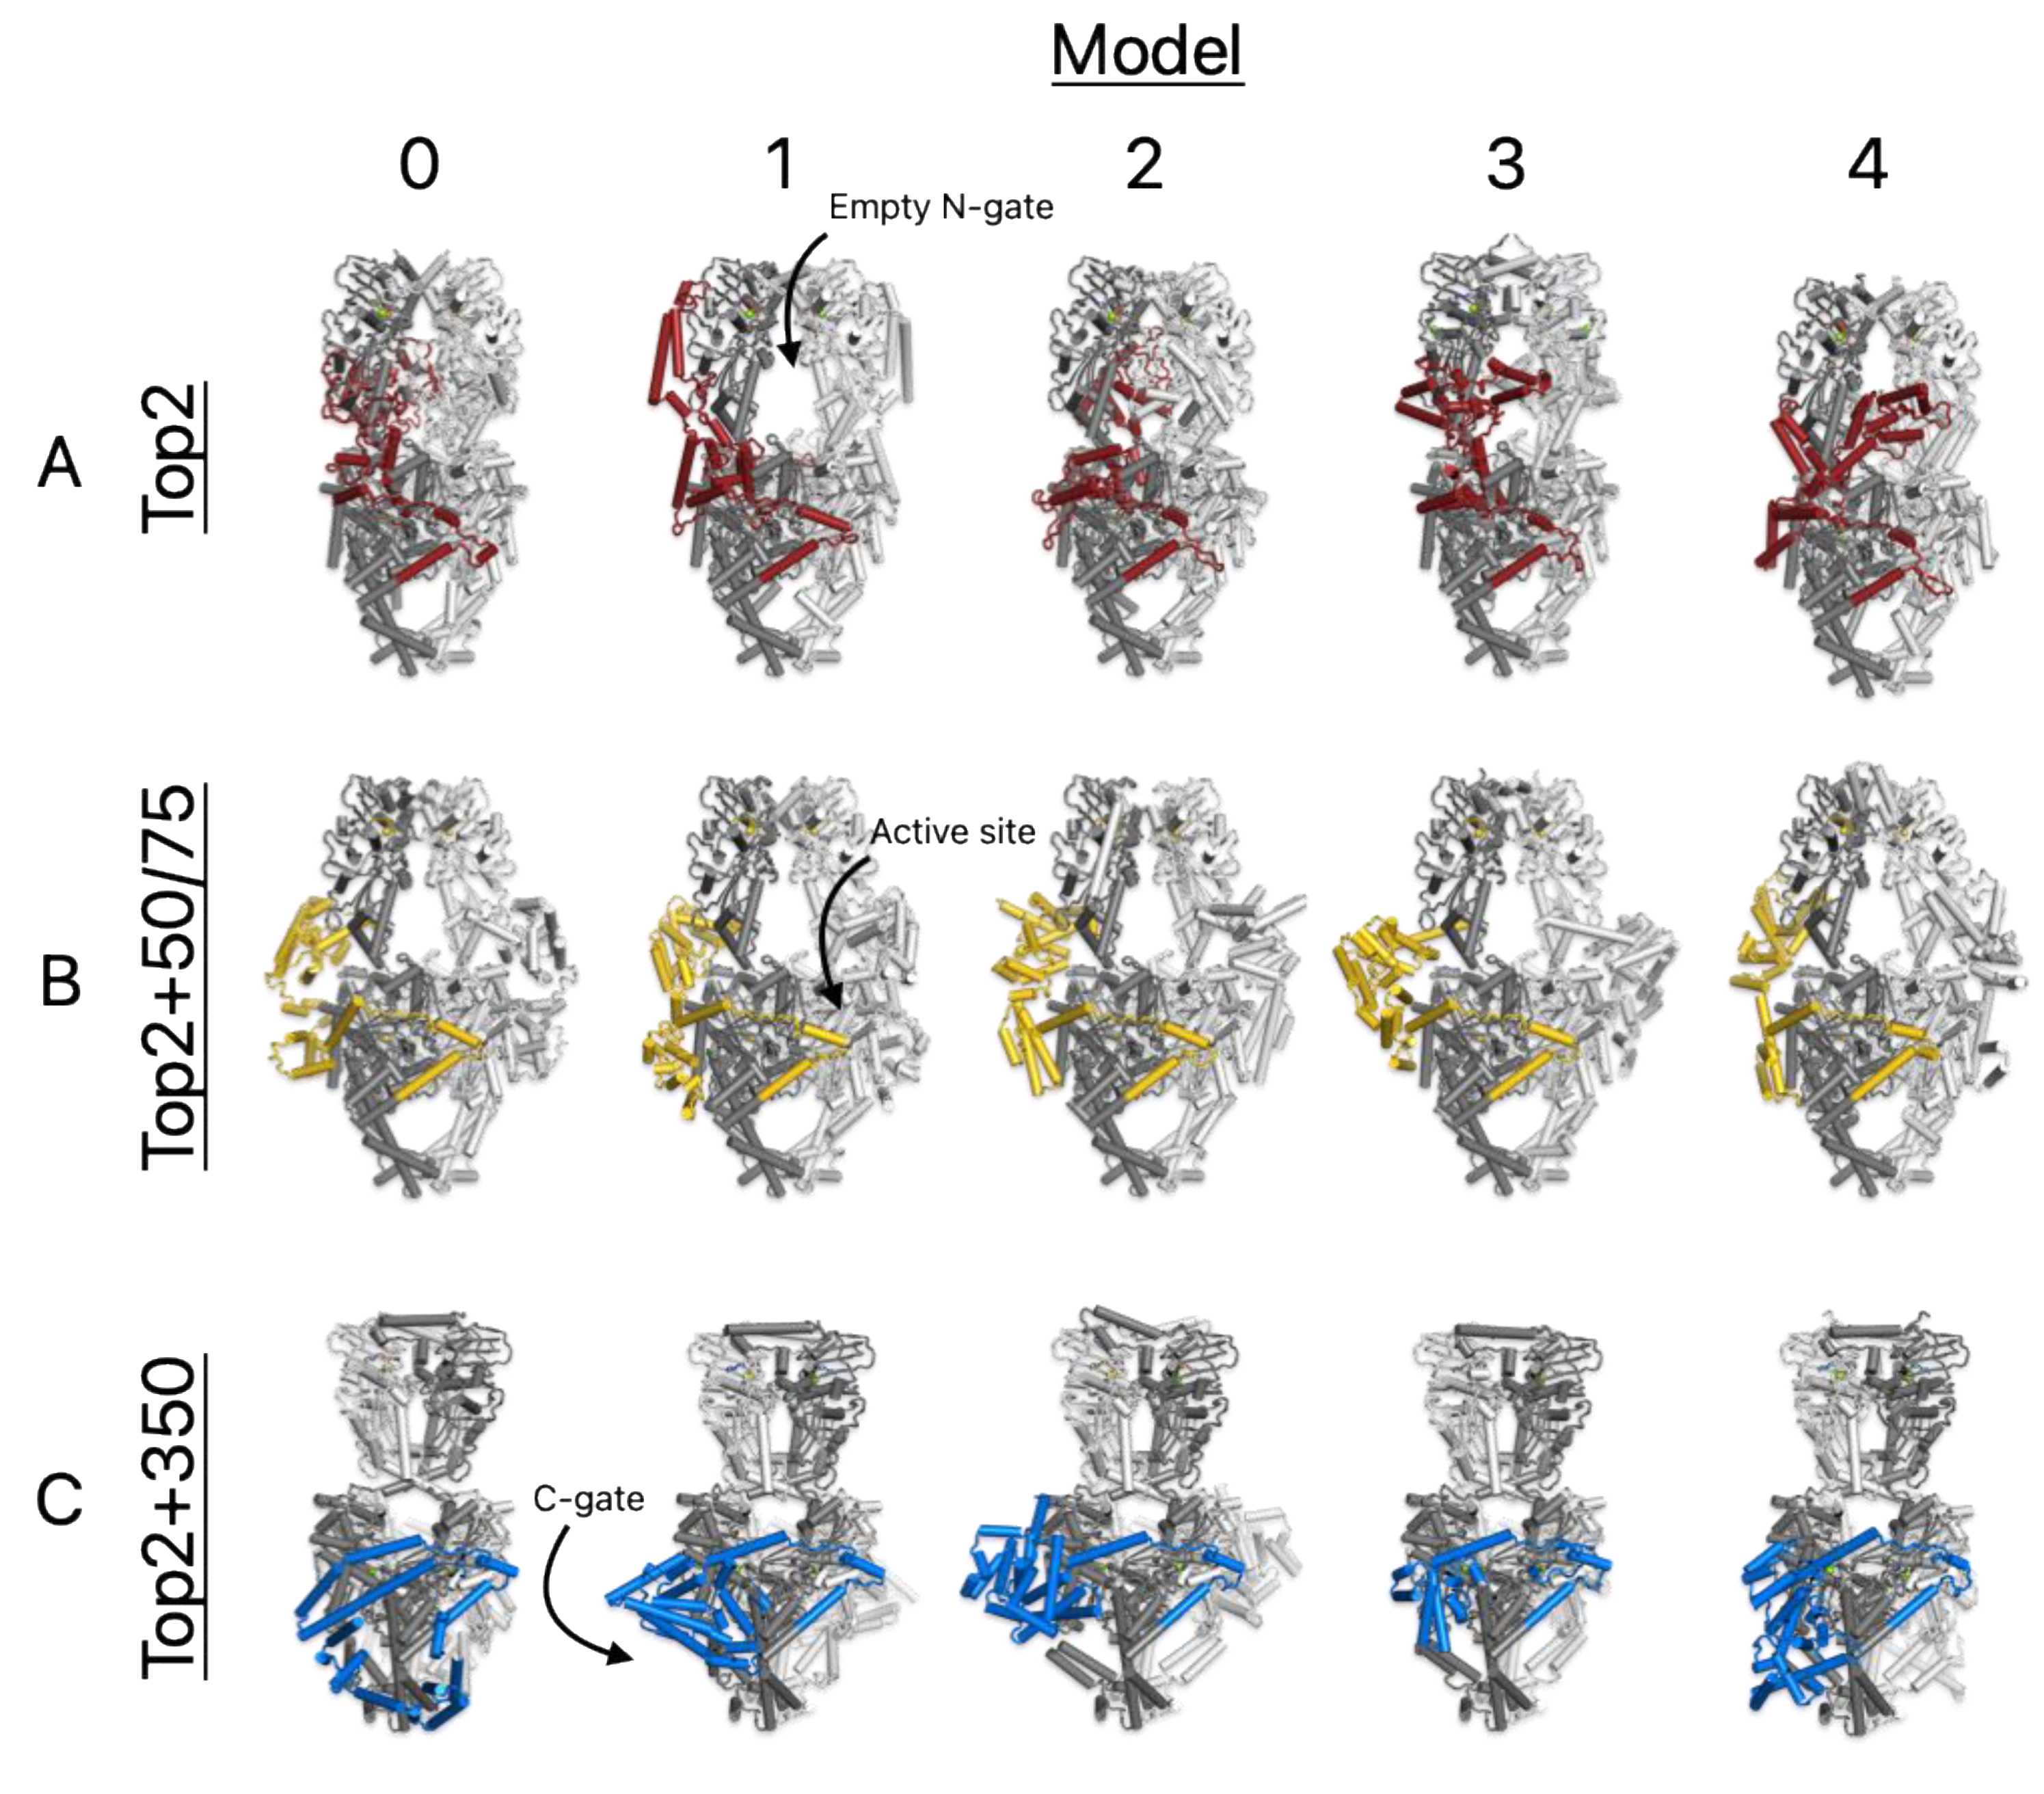
While the significance of complex C’s divergence from the others is captured well by the RMSD analysis, the differences between the CTDs of A and B may be more subtle and thus obscured by movements in the core domain. To clarify this picture, we generated images of each model of structures A, B and C to visually compare their locations and the consistency thereof across models. Figure 4 shows that where the CTDs of structures A and B interact with the core domains is indeed consistently different, despite the flexible noise across models. In structure A (top row), the CTD often is found in the N-gate, whereas it is never found in the N-gate in structure B; it has been outcompeted for this site by the 75 bp DNA fragment (removed from figures for clarity). Instead, the CTD of structure B is consistently found to interact with both segments of the DNA adjacent to the active site region and TOPRIM domain. The CTD of structure C is also consistently bound lower down near the C-gate. Based on these analyses, we hypothesize that the locations where the CTDs and core domains interact could be biologically meaningful and are worth further investigation through biochemical testing.
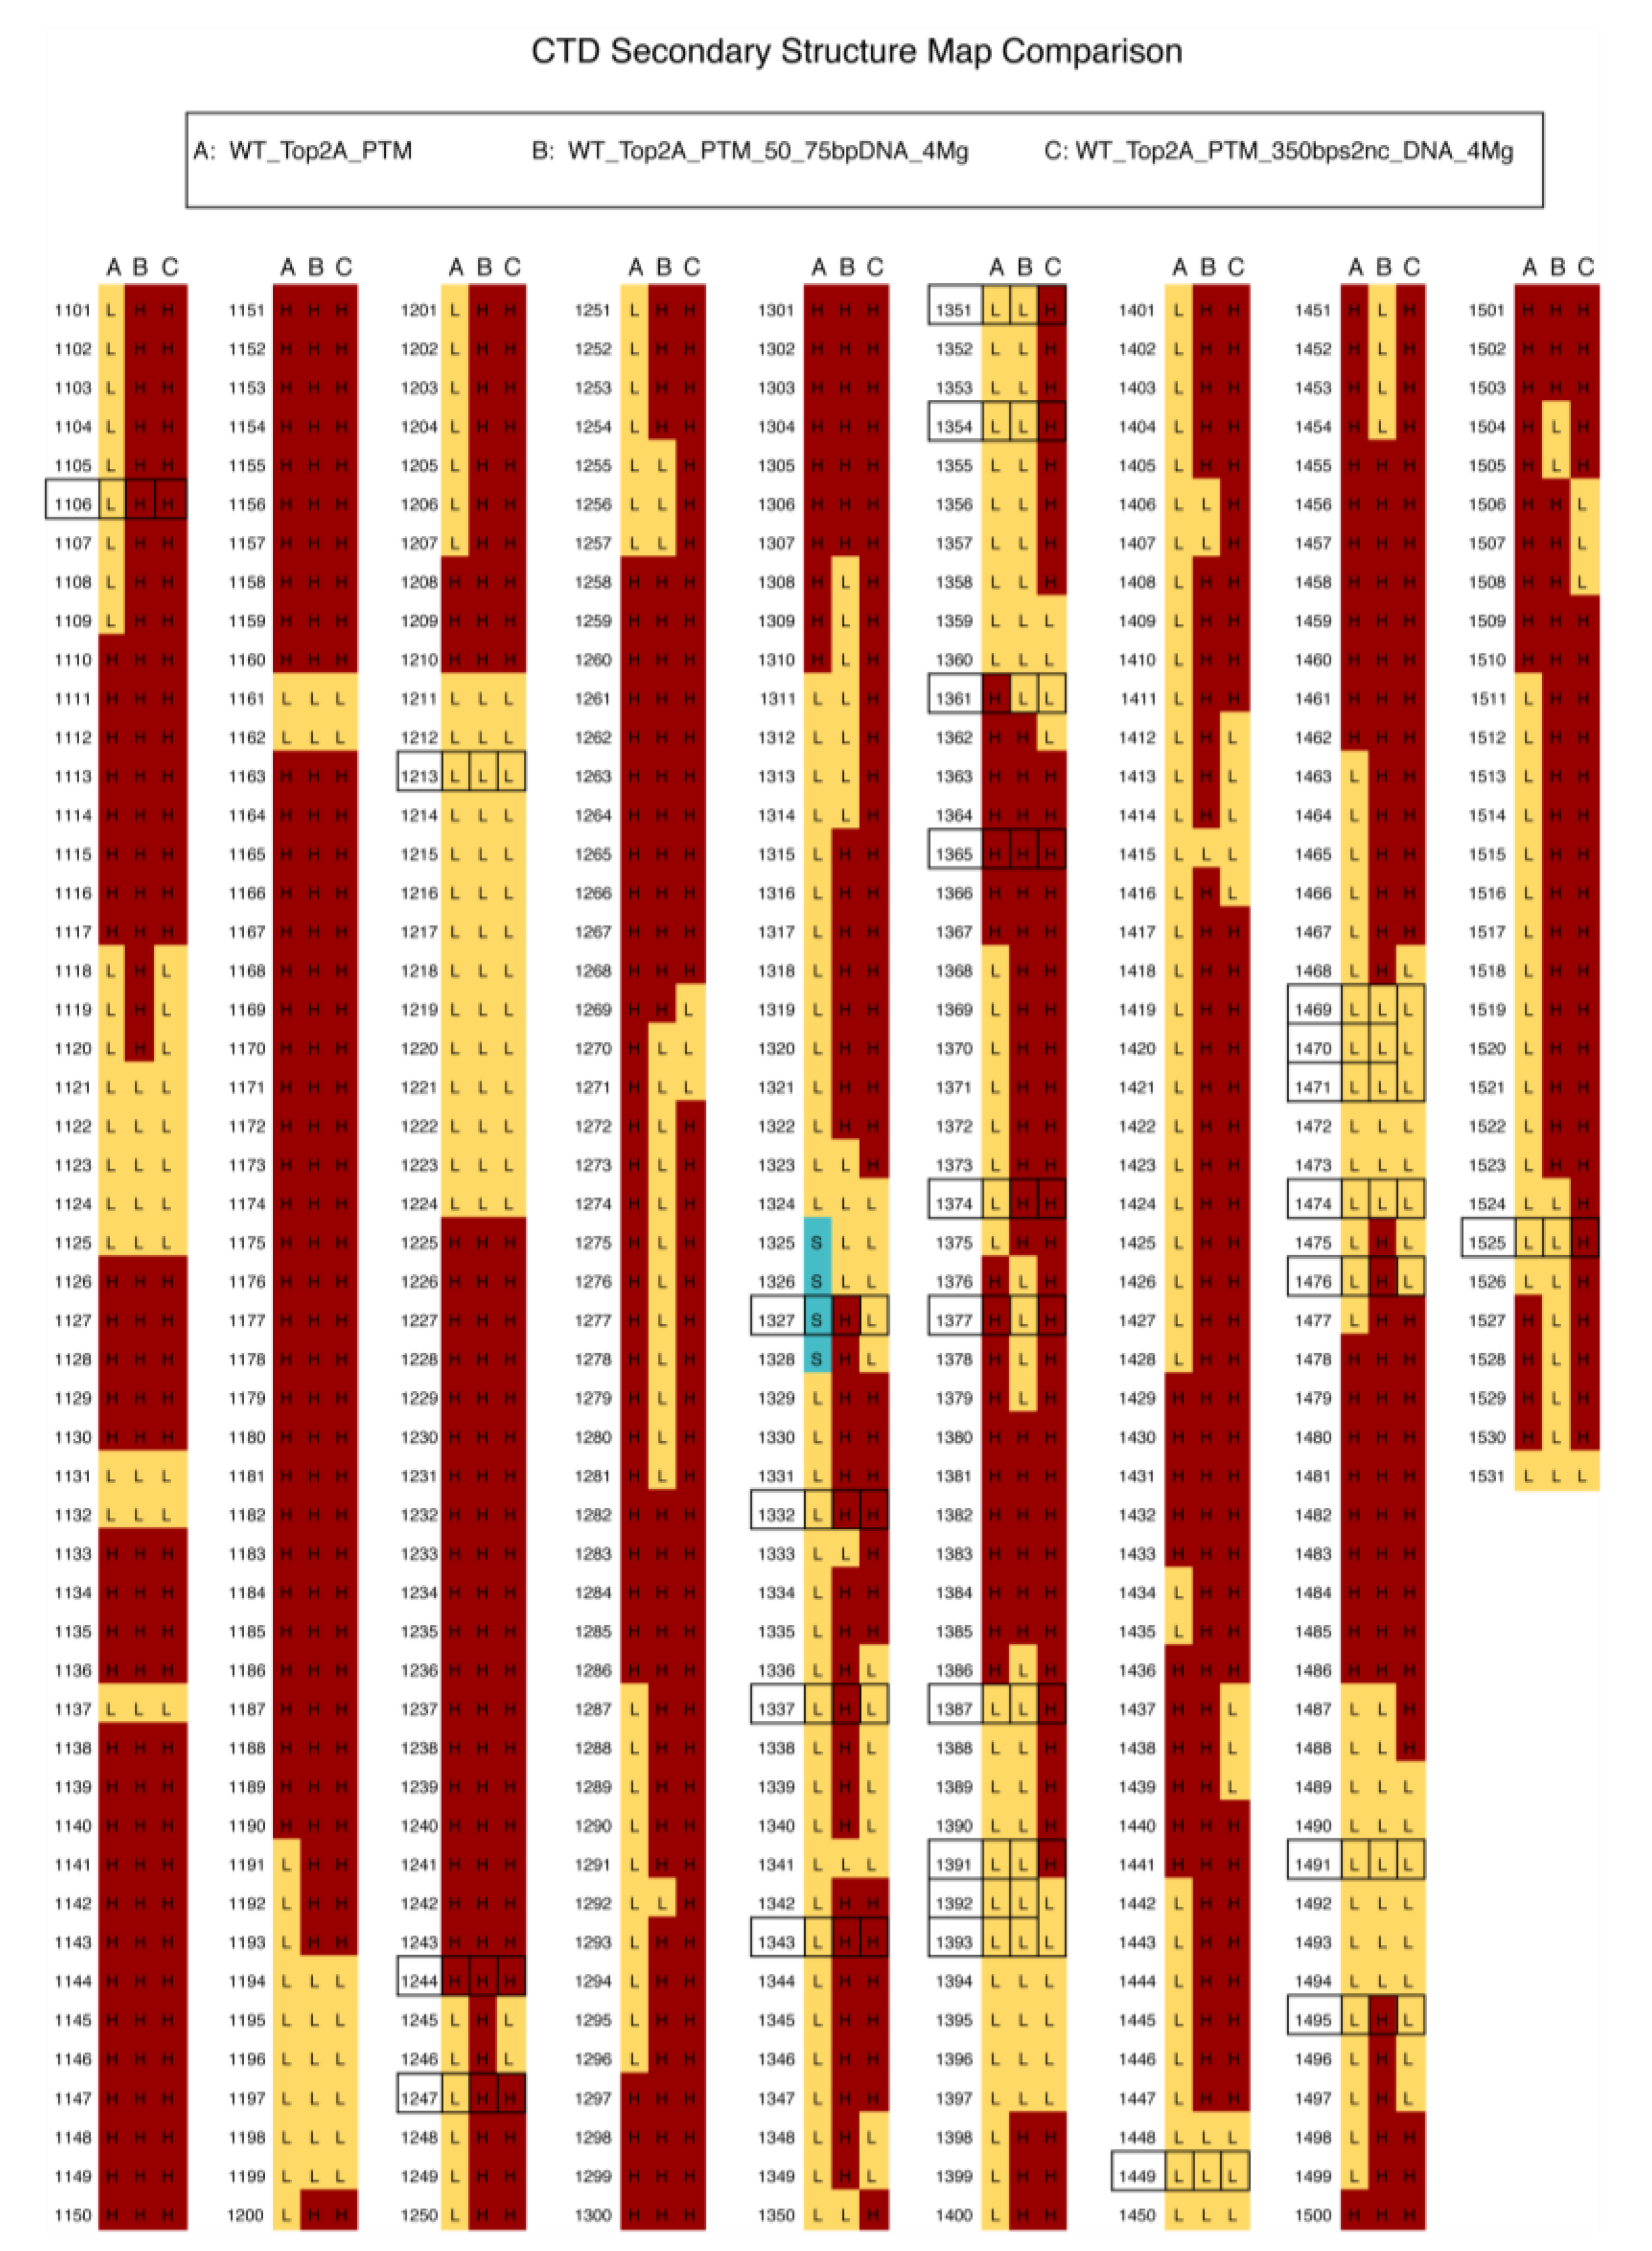
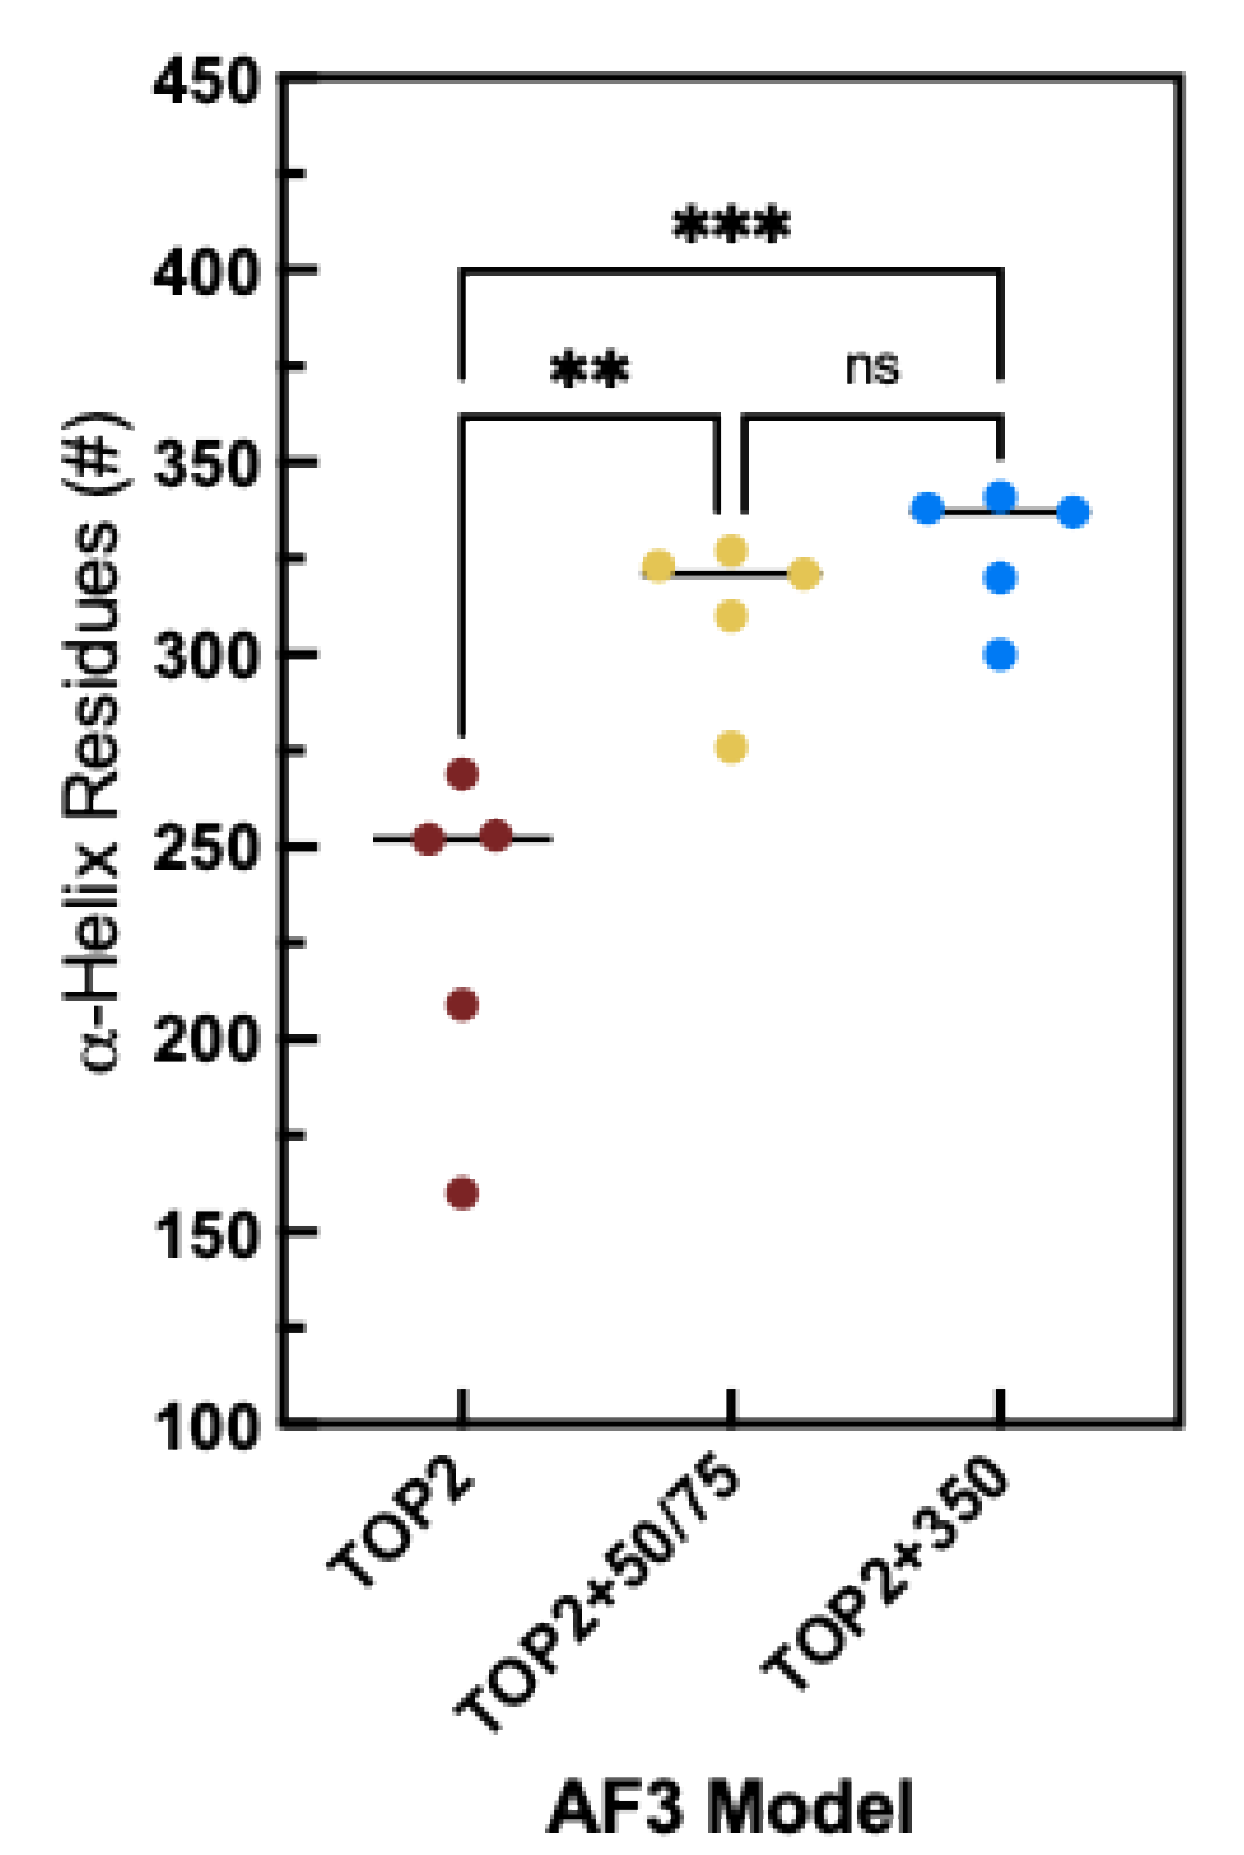
While there is significant change in the 3D conformation of the CTD across the three versions of the analysis (TOP2, TOP2+50/75 bp fragments, TOP2+350 bp fragment), the predicted secondary structure remains relatively consistent (Figure 5). For these three complexes, we tracked per residue secondary structure and found that most of the sites remain part of an α-helix or a loop regardless of the substrate, while a fraction of sites change in response to substrate binding. Notably, these changes result in an overall increase in α-helicity from 46% for TOP2 (A) to 72% and 78% for the TOP2+50/75 bp (B) fragments and TOP2+350 bp (C) fragment complexes, respectively. As seen in Figure 6, the change in the number of helix residues is statistically significant when comparing TOP2 alone versus either the TOP2+50/75 or TOP2+350 models. The positions that are phosphorylated within this region are also denoted and do not show a clear pattern in response to DNA binding. While most maintain either alpha-helical or looping form, around 16 of 29 positions change in response to one or both DNA substrates. Taken together, these analyses suggest that PTMs are required for predicted folding of the CTD, but the addition of DNA substrates further orders its secondary structure.

3.4. AlphaFold Model Predictions for CTD in the Presence of Metal Ions

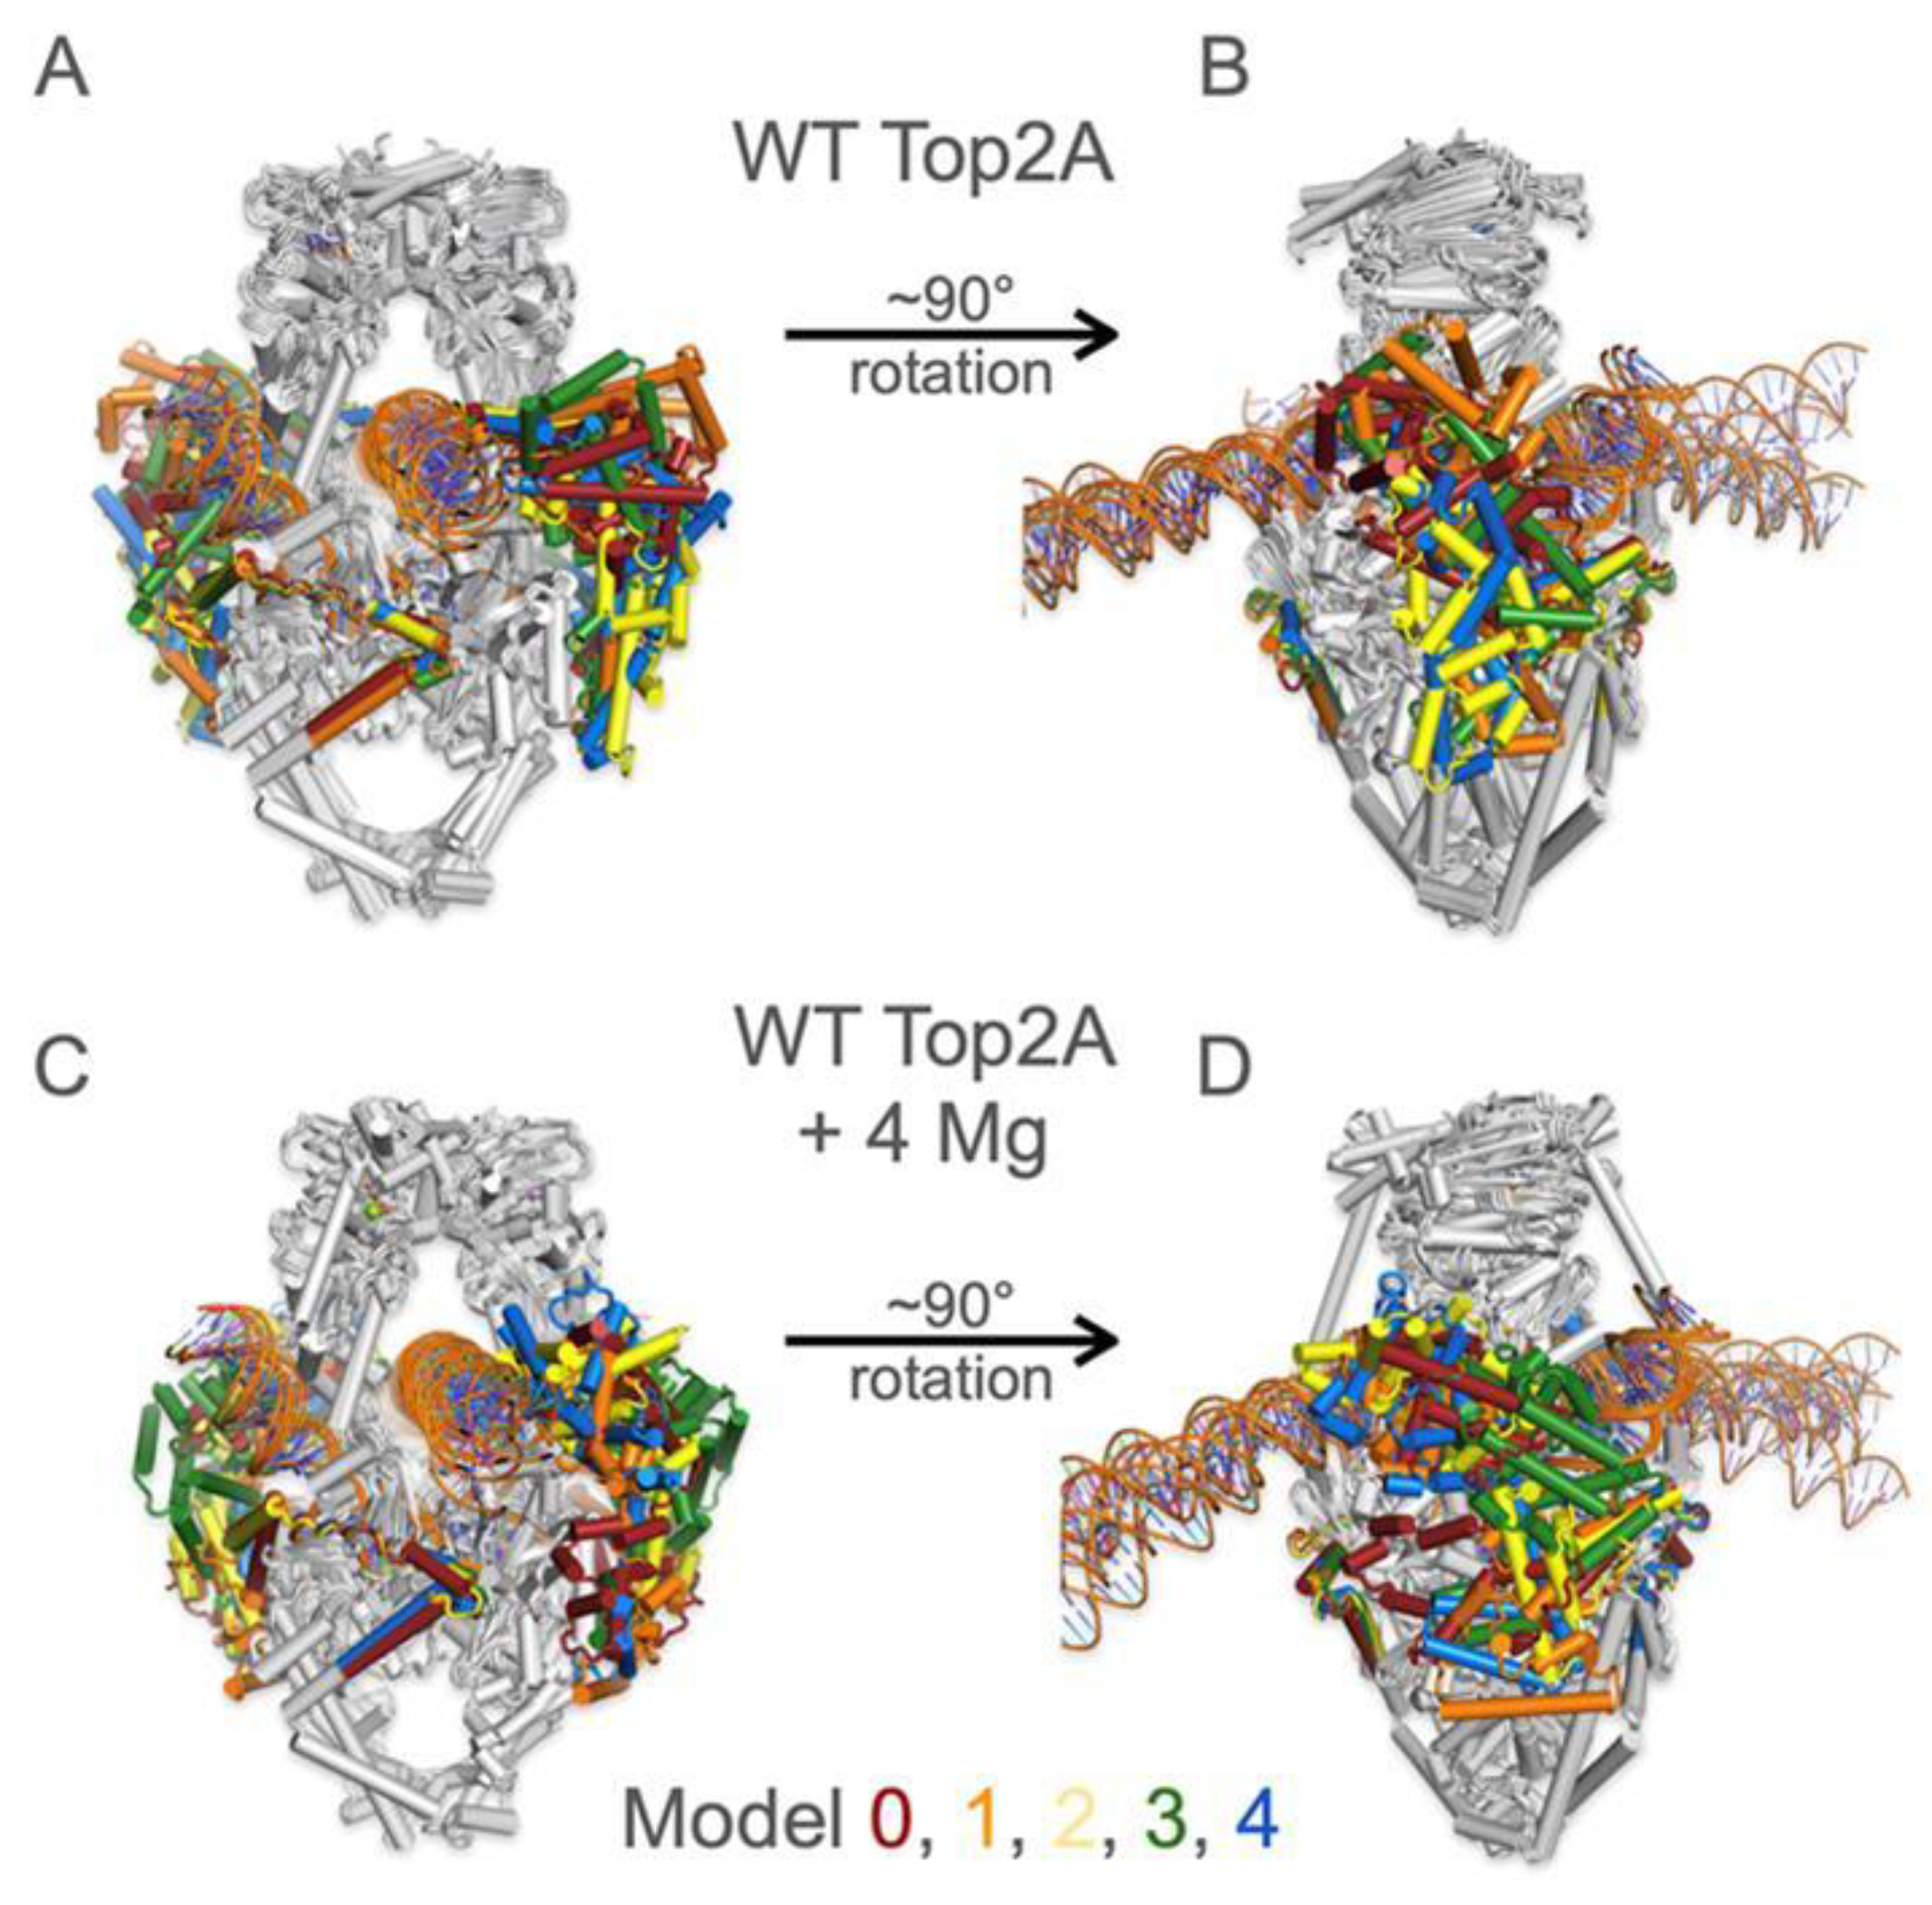
Given that the confidence level of the predicted fold for the CTD is low even with the PTMs, we decided to further compare the alternative models generated by AF3. Each run outputs five different models (0–4). We generated predictions of TOP2A bound to the 50/75 bp fragments in the absence of Mg2+ (Figure 7A,B). Superposition of the 5 alternative models reveals that the predictions cluster in the same general area relative to the core domain, despite there being poor alignment of individual secondary structural elements. For instance, all models predict the counter-clockwise (when viewed from the top) wrapping of the CTD around the outside of the protein. The addition of 4 Mg2+ ions does not reduce the variance among the predicted structures (Figure 7C,D). Interestingly, even though the DNA also has low or very low confidence values (plDDT 50–70 or <50, respectively), the two strands overlap quite well among the predicted models. For example, the strands are bound at the same region along the DNA sequence within the upper gate (50 bp strand) and the active site region (75 bp strand).

3.5. Folding of the CTD Decreases as PTMs Are Removed

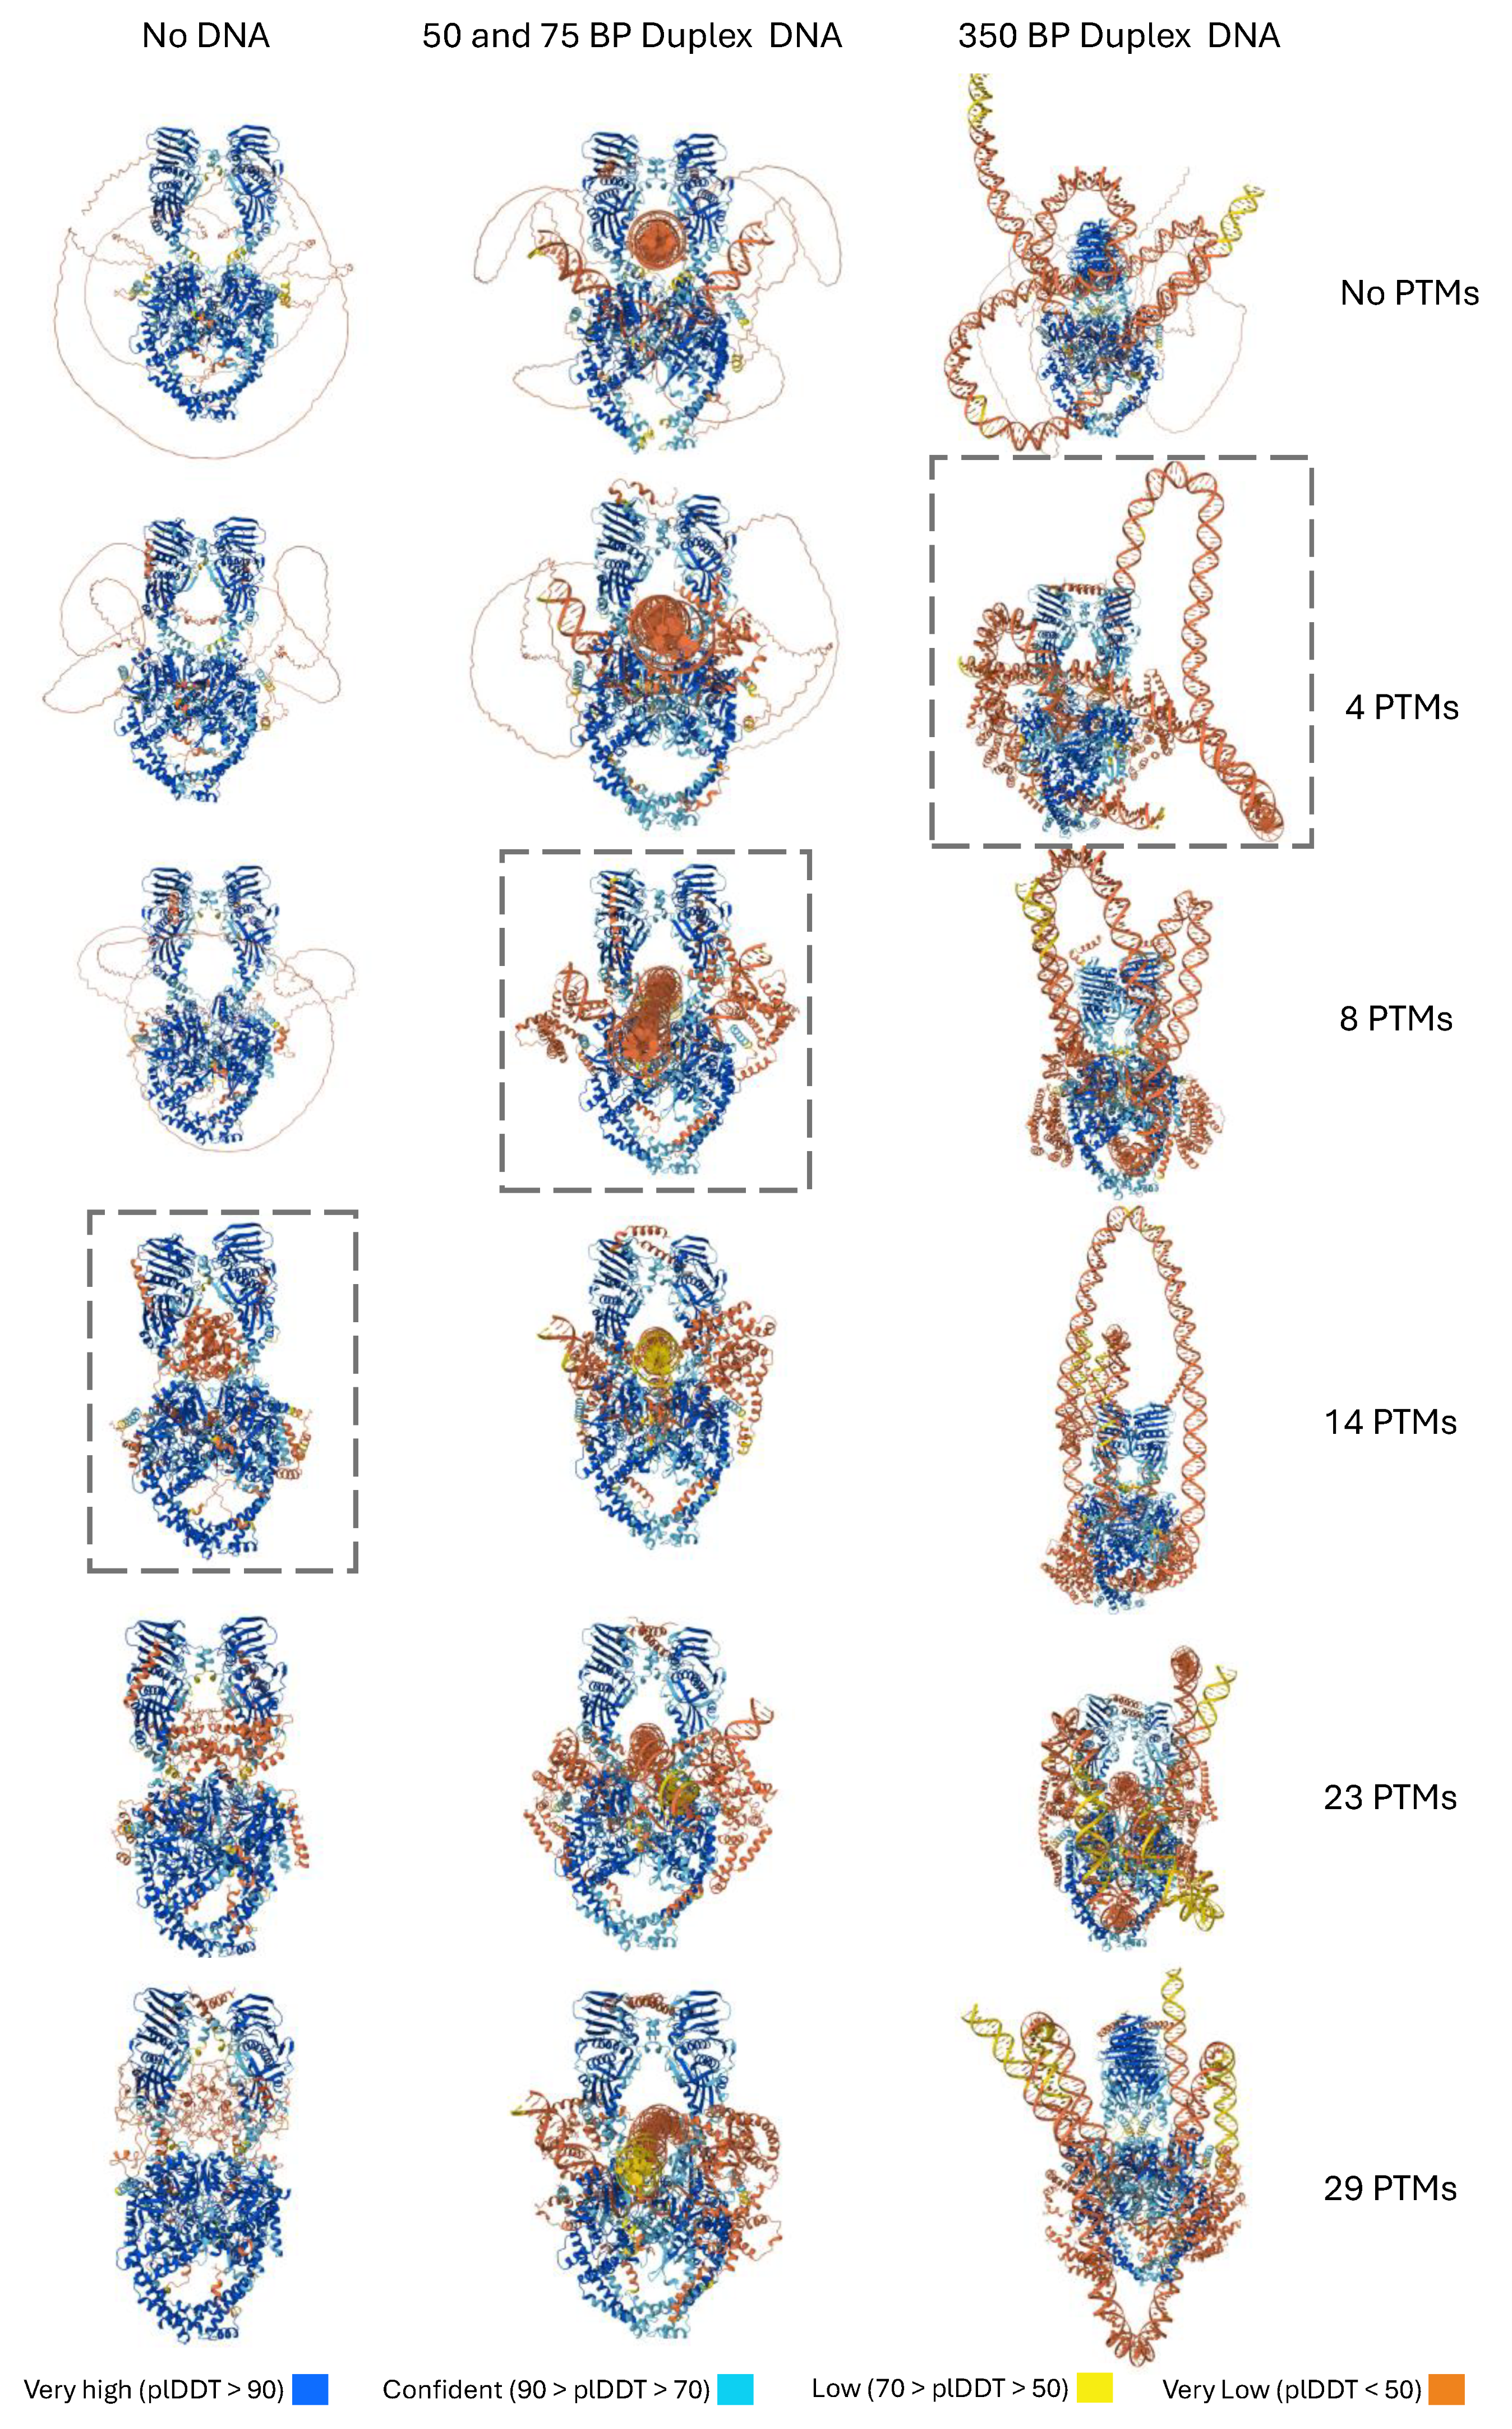
Thus far, we only tested a single combination of PTMs at 29 sites, but would folding prediction be robust given different subsets of PTMs? To explore this question, we used information from Phosphosite about the sites with the highest level of evidence for PTMs, and we removed PTMs selectively from the list starting with those with the least evidence (Figure 8, Table A3). By going down from 29 to 23, 14, 8, and 4, AF3 demonstrated changes in folding as fewer PTMs were present. In the absence of DNA, folding fails below about 14 PTMs. In contrast, for the models with DNA, folding fails below 8 PTMs and below 4 PTMs for the 50/75 bp model and the 350 bp model, respectively. This appears to indicate that while the DNA is not required for folding, it helps with folding in the context of the PTMs.
As can be seen in Figure 8, the conformation of the 350 bp DNA segment is highly variable. In addition, the 350 bp segment in some cases will form steric clashes (models 0 and 4). Examples of one such structure are shown in Figure S4 where the end of the DNA weaves into the DNA in the active site. These interactions are not observed with the 50/75 bp models. This appears to suggest that AF3 continues to need refinement regarding DNA structure prediction, particularly for longer DNA fragments.

4. Discussion

AlphaFold algorithms have increased the ability of researchers to explore structures–especially for proteins without experimentally determined homologous structures. Further, the increasing confidence and speed with which structural information can be predicted has facilitated quick advances in research [47]. Yet, there still appear to be limitations to the accuracy of AF3 that require caution in interpreting models generated [48,49]. In this study, we utilized the AF3 model to fold the essential nuclear enzyme, DNA topoisomerase IIα (TOP2A). As expected, the intrinsically disordered CTD did not fold into an ordered structure. However, a folded structure was predicted when 29-PTMs were added to the protein. These PTMs represent sites known to be phosphorylated on TOP2A [16]. While the confidence level is generally very low (plDDT < 50), AF3 consistently generated models with these regions folded into mostly alpha-helical and loop structures. In comparison, the core domains of the protein are either Very High (plDDT > 90) or Confident (90 > plDDT > 70). Given the extremely poor sequence conservation of the CTD across species, it is remarkable that AF3 could predict any folded structure, and its low confidence is expected.
In the TOP2A alone predicted structure, the CTD occupies the upper gate region, precluding DNA substrate from binding, but addition of DNA to the model shifts the location of the CTD, forming an interface on the outside of the core domain and allowing DNA to occupy the upper gate. While there is variability between the models generated by AlphaFold in the absence or presence of DNA, there is consistency among them regarding the general topology of these regions. For example, the looping or helical nature of the CTD is maintained between structures with no DNA versus those with smaller oligonucleotide fragments or a larger segment of DNA. Notably, we observe that DNA binding encourages several loops to fold into α-helices, thereby increasing the overall secondary structure from 46% to ~72–78% α-helicity. That the CTD structure is predicted to be sensitive to the presence of a DNA substrate is consistent with its role in regulating catalytic function [35].
Structures generated using two separate oligonucleotide segments coincide well with other published structures with one segment in the DNA-Gate while another is in the N-Gate region [50,51,52]. In addition, the DNA-Gate segment is bent as is seen in other structures [50,51,52]. This bending is thought to help facilitate DNA cleavage, and the models appear to be consistent with known structures. When the 350 bp DNA fragment is used, DNA generally loops through the active site and then loops through the lower gate region or remains outside of the enzyme. However, it should be noted that unrealistic DNA conformations, including quadruple helices and steric clashes, emerge in two models with the 350 bp helix. The DNA appears to loop through the active site twice in these cases. This is not observed with the smaller fragments of DNA used in this modeling. Indeed, the plDDT of the DNA, even when it displays reasonable conformations, is as low as the folded CTD. Thus, AF3 needs refinement regarding DNA interactions, as has been reported elsewhere [47].
Despite the relatively low confidence of the folds, the structures do provide information that may help interpret previous data and provide predictions about interactions between the CTD and specific portions of the core domain that could be tested in future experiments. It should be noted that these regions are expected to be flexible and may take several conformations, and we should interpret this information with caution [53]. Researchers are developing tools to enable the construction of ensembles of structures from AF models and other structure prediction tools, which may provide more realistic views into the biologically relevant conformations [54,55,56].
Recent work by our (JED) lab group has demonstrated the importance both of the phosphorylation sites and of several areas of the sequence of the CTD to biochemical function [35,36]. The CTD appears to influence both plasmid DNA relaxation and kinetoplast DNA decatenation and is involved in DNA substrate selection [23,33,35,36]. Perhaps AF3 will eventually be able to model positively- and negatively supercoiled DNA substrates, which may provide insights into the DNA substrate selectivity of TOP2A. As noted above, the confidence level of the DNA folds was very low, and it may be that additional refinement may increase the confidence of these predictions. It is also possible that the addition of other proteins or ions will help increase confidence in DNA fold predictions. Further, the DNA appears to stabilize the CTD folds, especially as PTMs are removed from the model.
As an intrinsically disordered region, the CTD is involved in interactions with both chromatin and other proteins [18,19,20]. Yet, databases such as TheBioGrid (TheBioGrid.org) indicate that TOP2A may have hundreds of potential interactions with other proteins [15,57,58]. We propose that the CTD may help mediate some of these interactions because of the inherent flexibility of this domain, similar to the interaction between p53 and various binding partners [6]. While phosphorylation of the CTD is known to impact biochemical function and activity of the enzyme, it remains to be explored whether these PTMs impact the interactions of TOP2A with other proteins. Other protein interactions are known to be influenced by phosphorylation of disordered regions [59,60]. It may be that AlphaFold will enable researchers to visualize possible interactions, which will enable hypotheses to be generated and tested using biochemical and cellular experiments.

5. Conclusions

In conclusion, these predicted structures provide some glimpse, though tentative, of what the TOP2A CTD may be doing in terms of folding. While the CTD can fold in the presence of DNA, the PTMs and not the DNA substrates were found to be the essential factor in predicted folding. DNA influences and stabilizes the folding, which results in folds that appear consistent with the expected protein-DNA interaction regions. These predictions should aid additional studies and allow researchers to generate hypotheses regarding regions that need to be explored to more clearly define the roles of the CTD of TOP2A. Given that PTMs also occur in the core of the protein, understanding how these sites influence or relate to the CTD modifications and the regulation of overall function will be important. The functional and biochemical mapping of the CTD of TOP2A may enable researchers to devise more targeted therapeutic strategies for treating cancer.

Supplementary Materials

The following supporting information can be downloaded at: https://www.mdpi.com/article/10.3390/dna5040046/s1, Supplementary Figure S1: Predicted location of Mg2+ ions in AlphaFold structure of TOP2A with DNA; Figure S2: Predicted structure of TOP2A without any post-translational modifications; Figure S3: RMSD values compared for models of each structure; and Figure S4: Example of a steric clash within a DNA structure model of a 350 bp segment with TOP2A. Datasets are available at: https://doi.org/10.17605/OSF.IO/UE9DQ.

Author Contributions

Conceptualization, J.E.D.; methodology, C.M.N. and J.E.D.; validation, C.M.N. and J.E.D.; investigation, C.M.N. and J.E.D.; data curation, C.M.N. and J.E.D.; writing—original draft preparation, C.M.N. and J.E.D.; writing—review and editing, C.M.N. and J.E.D.; visualization, C.M.N. and J.E.D.; project administration, J.E.D. All authors have read and agreed to the published version of the manuscript.

Funding

This research received no external funding.

Institutional Review Board Statement

Not applicable.

Informed Consent Statement

Not applicable.

Data Availability Statement

AF3 datasets are available at the following https://doi.org/10.17605/OSF.IO/UE9DQ.

Acknowledgments

We are thankful to James Dewar for helpful discussions regarding AlphaFold.

Conflicts of Interest

The authors declare no conflicts of interest.

Abbreviations

The following abbreviations are used in this manuscript:
AF3AlphaFold 3
CTDC-terminal domain
IDRIntrinsically disordered region
NLSNuclear Localization Sequence
plDDTPredicted Local Distance Difference Test (also pLDDT)
PTMPost-translational modification
TOP2ATopoisomerase IIα
TOP2BTopoisomerase IIβ
WTWild type

Appendix A. DNA Sequences Used in Modeling and Quality Metrics from Structures

Table A1. DNA Sequences Used in AlphaFold Analyses.
Sequence
50 base pair forward strandTTGGTATCTGCGCTCTGCTGAAGCCAGTTACCTTCGAAAAAGAGTTGGT
75 base pair forward strandTCGGCTGCGGCGAGCGGTATCAGCTCACTCAAAGGCGGTAATACGGTTATCCACAG AATCAGGGGATAACGCAGG
350 base pair forward strandCGTTCAGCCCGACCGCTGCGCCTTATCCGGTAACTATC GTCTTGAGTCCAACCCGGTAAGACACGACTTATCGCCACTGGCAGCAGCCACT GGTAACAGGATTAGCAGAGCGAGGTATGTAGGCGGTGCTACAGAG TTCTTGAAGTGGTGGCCTAACTACGGCTACACTAGAAGGACAGTAT TTGGTATCTGCGCTCTGCTGAAGCCAGTTACCTTCGGAAAAAGAGT TGGTAGCTCTTGATCCGGCAAACAAACCACCGCTGGTAGCGGTGGT TTTTTTGTTTGCAAGCAGCAGATTACGCGCAGAAAAAAAGGATCT CAAGAAGATCCTTTGATCTTTTCTACGGGGT
Table A2. Quality Scores from AF3 Predicted Structures.
StructureipTM *pTM **
TOP2A only0.590.61
TOP2A with PTM0.570.59
TOP2A with PTM and 50/75 bp duplexes0.580.62
TOP2A with PTM and 350 bp duplex0.550.59
* ipTM = interface predicted template modeling measures the entire structure accuracy; values below 0.6 are considered to be failed predictions according to AlphaFold. ** pTM = predicted template modeling predicts whether the overall fold may be similar to actual structure; scores above 0.5 are favorable.
Table A3. Post-Translational Modification Sites Used to Examine CTD Folding.
Number of PTMsPTM Sites
4S1469, S1470, S1471, S1474
8S1213, S1247, S1377, S1469, S1470, S1471, S1474, S1476
14S1106, S1213, S1247, S1332, S1337, S1354, S1374, S1377, S1469, S1470, S1471, S1474, S1476, S1525
23S1106, S1213, S1244, S1247, S1332, S1337, S1343, S1351, S1354, S1374, S1377, S1387, S1391, S1392, S1393, S1449, S1469, S1470, S1471, S1474, S1476, S1495, S1525
29S390, S709, S1106, S1213, S1244, S1247, S1332, S1337, S1343, S1351, S1354, S1361, S1365, S1374, S1377, S1387, S1391, S1392, S1393, S1449, S1469, S1470, S1471, S1474, S1476, S1491, S1495, S1525

References

  1. Holehouse, A.S.; Kragelund, B.B. The molecular basis for cellular function of intrinsically disordered protein regions. Nat. Rev. Mol. Cell Biol. 2024, 25, 187–211. [Google Scholar] [CrossRef] [PubMed]
  2. Zhao, B.; Katuwawala, A.; Oldfield, C.J.; Hu, G.; Wu, Z.; Uversky, V.N.; Kurgan, L. Intrinsic Disorder in Human RNA-Binding Proteins. J. Mol. Biol. 2021, 433, 167229. [Google Scholar] [CrossRef]
  3. Musselman, C.A.; Kutateladze, T.G. Characterization of functional disordered regions within chromatin-associated proteins. iScience 2021, 24, 102070. [Google Scholar] [CrossRef]
  4. Biesaga, M.; Frigolé-Vivas, M.; Salvatella, X. Intrinsically disordered proteins and biomolecular condensates as drug targets. Curr. Opin. Chem. Biol. 2021, 62, 90–100. [Google Scholar] [CrossRef]
  5. Fuxreiter, M. Classifying the Binding Modes of Disordered Proteins. Int. J. Mol. Sci. 2020, 21, 8615. [Google Scholar] [CrossRef]
  6. Chillemi, G.; Kehrloesser, S.; Bernassola, F.; Desideri, A.; Dotsch, V.; Levine, A.J.; Melino, G. Structural Evolution and Dynamics of the p53 Proteins. Cold Spring Harb. Perspect. Med. 2017, 7, a028308. [Google Scholar] [CrossRef]
  7. Kriwacki, R.W.; Hengst, L.; Tennant, L.; Reed, S.I.; Wright, P.E. Structural studies of p21Waf1/Cip1/Sdi1 in the free and Cdk2-bound state: Conformational disorder mediates binding diversity. Proc. Natl. Acad. Sci. USA 1996, 93, 11504–11509. [Google Scholar] [CrossRef]
  8. Vanden Broeck, A.; Lotz, C.; Drillien, R.; Haas, L.; Bedez, C.; Lamour, V. Structural basis for allosteric regulation of Human Topoisomerase IIalpha. Nat. Commun. 2021, 12, 2962. [Google Scholar] [CrossRef]
  9. Jumper, J.; Evans, R.; Pritzel, A.; Green, T.; Figurnov, M.; Ronneberger, O.; Tunyasuvunakool, K.; Bates, R.; Zidek, A.; Potapenko, A.; et al. Highly accurate protein structure prediction with AlphaFold. Nature 2021, 596, 583–589. [Google Scholar] [CrossRef]
  10. Abramson, J.; Adler, J.; Dunger, J.; Evans, R.; Green, T.; Pritzel, A.; Ronneberger, O.; Willmore, L.; Ballard, A.J.; Bambrick, J.; et al. Accurate structure prediction of biomolecular interactions with AlphaFold 3. Nature 2024, 630, 493–500. [Google Scholar] [CrossRef]
  11. Ecsédi, P.; Érfalvy, D.; Kovács, Z.J.; Katran, V.; Pálinkás, J.; Cervenak, M.; Pancsa, R.; Harami, G.M.; Smeller, L.; Kovács, M. Selective engineering of condensation properties of single-stranded DNA binding (SSB) protein via its intrinsically disordered linker region. Nucleic Acids Res. 2025, 53, gkaf481. [Google Scholar] [CrossRef]
  12. Nitiss, J.L. DNA topoisomerase II and its growing repertoire of biological functions. Nat. Rev. Cancer 2009, 9, 327–337. [Google Scholar] [CrossRef]
  13. Jeong, J.; Lee, J.H.; Carcamo, C.C.; Parker, M.W.; Berger, J.M. DNA-Stimulated Liquid-Liquid phase separation by eukaryotic topoisomerase ii modulates catalytic function. eLife 2022, 11, e81786. [Google Scholar] [CrossRef]
  14. Lotz, C.; Lamour, V. The interplay between DNA topoisomerase 2α post-translational modifications and drug resistance. Cancer Drug Resist. 2020, 3, 149–160. [Google Scholar] [CrossRef] [PubMed]
  15. Hoang, K.G.; Menzie, R.A.; Rhoades, J.H.; Fief, C.A.; Deweese, J.E. Reviewing the Modification, Interactions, and Regulation of the C-terminal Domain of Topoisomerase IIα as a Prospect for Future Therapeutic Targeting. EC Pharmacol. Toxicol. 2020, 8, 27–43. [Google Scholar]
  16. Bedez, C.; Lotz, C.; Batisse, C.; Broeck, A.V.; Stote, R.H.; Howard, E.; Pradeau-Aubreton, K.; Ruff, M.; Lamour, V. Post-translational modifications in DNA topoisomerase 2alpha highlight the role of a eukaryote-specific residue in the ATPase domain. Sci. Rep. 2018, 8, 9272. [Google Scholar] [CrossRef]
  17. Kozuki, T.; Chikamori, K.; Surleac, M.D.; Micluta, M.A.; Petrescu, A.J.; Norris, E.J.; Elson, P.; Hoeltge, G.A.; Grabowski, D.R.; Porter, A.C.G.; et al. Roles of the C-terminal domains of topoisomerase IIalpha and topoisomerase IIbeta in regulation of the decatenation checkpoint. Nucleic Acids Res. 2017, 45, 5995–6010. [Google Scholar] [CrossRef]
  18. Clarke, D.J.; Azuma, Y. Non-Catalytic Roles of the Topoisomerase IIalpha C-Terminal Domain. Int. J. Mol. Sci. 2017, 18, 2438. [Google Scholar] [CrossRef]
  19. Lane, A.B.; Gimenez-Abian, J.F.; Clarke, D.J. A novel chromatin tether domain controls topoisomerase IIalpha dynamics and mitotic chromosome formation. J. Cell Biol. 2013, 203, 471–486. [Google Scholar] [CrossRef]
  20. Gilroy, K.L.; Austin, C.A. The impact of the C-terminal domain on the interaction of human DNA topoisomerase II alpha and beta with DNA. PLoS ONE 2011, 6, e14693. [Google Scholar] [CrossRef]
  21. Luo, K.; Yuan, J.; Chen, J.; Lou, Z. Topoisomerase IIalpha controls the decatenation checkpoint. Nat. Cell Biol. 2009, 11, 204–210. [Google Scholar] [CrossRef]
  22. Meczes, E.L.; Gilroy, K.L.; West, K.L.; Austin, C.A. The impact of the human DNA topoisomerase II C-terminal domain on activity. PLoS ONE 2008, 3, e1754. [Google Scholar] [CrossRef]
  23. McClendon, A.K.; Gentry, A.C.; Dickey, J.S.; Brinch, M.; Bendsen, S.; Andersen, A.H.; Osheroff, N. Bimodal recognition of DNA geometry by human topoisomerase II alpha: Preferential relaxation of positively supercoiled DNA requires elements in the C-terminal domain. Biochemistry 2008, 47, 13169–13178. [Google Scholar] [CrossRef]
  24. Linka, R.M.; Porter, A.C.; Volkov, A.; Mielke, C.; Boege, F.; Christensen, M.O. C-terminal regions of topoisomerase IIα and IIβ determine isoform-specific functioning of the enzymes in vivo. Nucleic Acids Res. 2007, 35, 3810–3822. [Google Scholar] [CrossRef]
  25. McClendon, A.K.; Osheroff, N. The geometry of DNA supercoils modulates topoisomerase-mediated DNA cleavage and enzyme response to anticancer drugs. Biochemistry 2006, 45, 3040–3050. [Google Scholar] [CrossRef]
  26. McClendon, A.K.; Dickey, J.S.; Osheroff, N. Ability of viral topoisomerase II to discern the handedness of supercoiled DNA: Bimodal recognition of DNA geometry by type II enzymes. Biochemistry 2006, 45, 11674–11680. [Google Scholar] [CrossRef][Green Version]
  27. Dickey, J.S.; Osheroff, N. Impact of the C-terminal domain of topoisomerase IIα on the DNA cleavage activity of the human enzyme. Biochemistry 2005, 44, 11546–11554. [Google Scholar] [CrossRef] [PubMed]
  28. Shaiu, W.L.; Hu, T.; Hsieh, T.S. The hydrophilic, protease-sensitive terminal domains of eucaryotic DNA topoisomerases have essential intracellular functions. Pac. Symp. Biocomput. 1999, 4, 578–589. [Google Scholar] [CrossRef]
  29. Mirski, S.E.; Gerlach, J.H.; Cole, S.P. Sequence determinants of nuclear localization in the alpha and beta isoforms of human topoisomerase II. Exp. Cell Res. 1999, 251, 329–339. [Google Scholar] [CrossRef] [PubMed]
  30. Mirski, S.E.; Gerlach, J.H.; Cummings, H.J.; Zirngibl, R.; Greer, P.A.; Cole, S.P. Bipartite nuclear localization signals in the C terminus of human topoisomerase IIa. Exp. Cell Res. 1997, 237, 452–455. [Google Scholar] [CrossRef]
  31. Adachi, N.; Miyaike, M.; Kato, S.; Kanamaru, R.; Koyama, H.; Kikuchi, A. Cellular distribution of mammalian DNA topoisomerase II is determined by its catalytically dispensible C-terminal domain. Nucleic Acids Res. 1997, 25, 3135–3142. [Google Scholar] [CrossRef]
  32. Endsley, C.E.; Moore, K.A.; Townsley, T.D.; Durston, K.K.; Deweese, J.E. Bioinformatic Analysis of Topoisomerase IIalpha Reveals Interdomain Interdependencies and Critical C-Terminal Domain Residues. Int. J. Mol. Sci. 2024, 25, 5674. [Google Scholar] [CrossRef] [PubMed]
  33. Musselman, J.R.; England, D.C.; Fielding, L.A.; Durham, C.T.; Baxter, E.; Jiang, X.; Lisic, E.C.; Deweese, J.E. Topoisomerase IIα C-terminal Domain Mutations and Catalytic Function. bioRxiv 2023. [Google Scholar] [CrossRef]
  34. Townsley, T.D.; Wilson, J.T.; Akers, H.; Bryant, T.; Cordova, S.; Wallace, T.L.; Durston, K.K.; Deweese, J.E. PSICalc: A novel approach to identifying and ranking critical non-proximal interdependencies within the overall protein structure. Bioinform. Adv. 2022, 2, vbac058. [Google Scholar] [CrossRef] [PubMed]
  35. Dougherty, A.C.; Hawaz, M.G.; Hoang, K.G.; Trac, J.; Keck, J.M.; Ayes, C.; Deweese, J.E. Exploration of the Role of the C-Terminal Domain of Human DNA Topoisomerase IIalpha in Catalytic Activity. ACS Omega 2021, 6, 25892–25903. [Google Scholar] [CrossRef]
  36. Chang, J.W.; O’Brian, A.K.; Thomas, A.J.; Hardin, M.R.; Latham, B.D.; Ngabonziza, D.; Simpson, L.G.; Wade, B.D.; Kuhnhenrich, L.; Thompson, N.M.; et al. Mutagenesis of Intrinsically Disordered Domain Impacts Topoisomerase IIalpha Catalytic Activity. Int. J. Mol. Sci. 2025, 26, 3604. [Google Scholar] [CrossRef]
  37. Pommier, Y.; Sun, Y.; Huang, S.N.; Nitiss, J.L. Roles of eukaryotic topoisomerases in transcription, replication and genomic stability. Nat. Rev. Mol. Cell Biol. 2016, 17, 703–721. [Google Scholar] [CrossRef]
  38. Murphy, M.B.; Mercer, S.L.; Deweese, J.E. Inhibitors and Poisons of Mammalian Type II Topoisomerases. In Advances in Molecular Toxicology; Fishbein, J.C., Heilman, J., Eds.; Academic Press: Cambridge, MA, USA, 2017; Volume 11, pp. 203–240. [Google Scholar]
  39. Deweese, J.E.; Osheroff, N. The DNA cleavage reaction of topoisomerase II: Wolf in sheep’s clothing. Nucleic Acids Res. 2009, 37, 738–749. [Google Scholar] [CrossRef]
  40. Pendleton, M.; Lindsey, R.H., Jr.; Felix, C.A.; Grimwade, D.; Osheroff, N. Topoisomerase II and leukemia. Ann. N. Y. Acad. Sci. 2014, 1310, 98–110. [Google Scholar] [CrossRef]
  41. McGowan, J.V.; Chung, R.; Maulik, A.; Piotrowska, I.; Walker, J.M.; Yellon, D.M. Anthracycline Chemotherapy and Cardiotoxicity. Cardiovasc. Drugs Ther. 2017, 31, 63–75. [Google Scholar] [CrossRef]
  42. Cowell, I.G.; Casement, J.W.; Austin, C.A. To Break or Not to Break: The Role of TOP2B in Transcription. Int. J. Mol. Sci. 2023, 24, 14806. [Google Scholar] [CrossRef]
  43. Wu, M.; Beck, C.; Lee, J.H.; Fulbright, R.M.; Jeong, J.; Inman, J.T.; Woodhouse, M.V.; Berger, J.M.; Wang, M.D. Human Topoisomerase IIα Promotes Chromatin Condensation Via a Phase Transition. bioRxiv 2024. [Google Scholar] [CrossRef]
  44. Consortium, T.U. UniProt: The Universal Protein Knowledgebase in 2025. Nucleic Acids Res. 2024, 53, D609–D617. [Google Scholar] [CrossRef] [PubMed]
  45. Schrödinger, L.; DeLano, W. PyMOL. 2020. Available online: http://www.pymol.org/pymol (accessed on 16 December 2024).
  46. Deweese, J.E.; Burgin, A.B.; Osheroff, N. Using 3′-bridging phosphorothiolates to isolate the forward DNA cleavage reaction of human topoisomerase IIα. Biochemistry 2008, 47, 4129–4140. [Google Scholar] [CrossRef] [PubMed]
  47. Mamun, Y.; Aguado, A.; Preza, A.; Kadel, A.; Mogallur, A.; Gonzalez, B.; De La Rosa, J.; Diaz, D.; Evdokimova, P.; Karki, U.; et al. Substrate binding of human and bacterial type IA topoisomerase: An experimentation with AlphaFold 3.0. Comput. Struct. Biotechnol. J. 2025, 27, 1342–1349. [Google Scholar] [CrossRef] [PubMed]
  48. Cortes, M., Jr.; Sun, X.; Anusha; Batchelder-Schwab, E.J.; Li, J.; Siraj, N.; Jampana, R.; Zhang, Y.; Bai, Y.; Mao, C. AlphaFold 3 modeling of DNA nanomotifs: Is it reliable? Nanoscale Horiz. 2025, 10, 1428–1435. [Google Scholar] [CrossRef]
  49. Lin, P.Y.; Huang, S.C.; Chen, K.L.; Huang, Y.C.; Liao, C.Y.; Lin, G.J.; Lee, H.; Chen, P.Y. Analysing protein complexes in plant science: Insights and limitation with AlphaFold 3. Bot. Stud. 2025, 66, 14. [Google Scholar] [CrossRef]
  50. Wendorff, T.J.; Schmidt, B.H.; Heslop, P.; Austin, C.A.; Berger, J.M. The structure of DNA-bound human topoisomerase IIα: Conformational mechanisms for coordinating inter-subunit interactions with DNA cleavage. J. Mol. Biol. 2012, 424, 109–124. [Google Scholar] [CrossRef]
  51. Schmidt, B.H.; Osheroff, N.; Berger, J.M. Structure of a topoisomerase II-DNA-nucleotide complex reveals a new control mechanism for ATPase activity. Nat. Struct. Mol. Biol. 2012, 19, 1147–1154. [Google Scholar] [CrossRef]
  52. Schmidt, B.H.; Burgin, A.B.; Deweese, J.E.; Osheroff, N.; Berger, J.M. A novel and unified two-metal mechanism for DNA cleavage by type II and IA topoisomerases. Nature 2010, 465, 641–644. [Google Scholar] [CrossRef]
  53. Ruff, K.M.; Pappu, R.V. AlphaFold and Implications for Intrinsically Disordered Proteins. J. Mol. Biol. 2021, 433, 167208. [Google Scholar] [CrossRef] [PubMed]
  54. Pajkos, M.; Clerc, I.; Zanon, C.; Bernadó, P.; Cortés, J. AFflecto: A web server to generate conformational ensembles of flexible proteins from AlphaFold models. J. Mol. Biol. 2025, 437, 169003. [Google Scholar] [CrossRef] [PubMed]
  55. Özmen, Z.A.; Çaylı, F.N.; Uversky, V.N.; Woo, J.A.; Kang, D.E.; Coskuner-Weber, O. Effects of pathological mutations on the CHCHD2 monomer structure: A study by AlphaFold3 linked to the generation of conformational ensembles. Comput. Biol. Med. 2025, 196, 110810. [Google Scholar] [CrossRef] [PubMed]
  56. Majila, K.; Ullanat, V.; Viswanath, S. A deep learning method for predicting interactions for intrinsically disordered regions of proteins. bioRxiv 2025. [Google Scholar] [CrossRef]
  57. Oughtred, R.; Stark, C.; Breitkreutz, B.J.; Rust, J.; Boucher, L.; Chang, C.; Kolas, N.; O’Donnell, L.; Leung, G.; McAdam, R.; et al. The BioGRID interaction database: 2019 update. Nucleic Acids Res. 2019, 47, D529–D541. [Google Scholar] [CrossRef]
  58. Oughtred, R.; Rust, J.; Chang, C.; Breitkreutz, B.J.; Stark, C.; Willems, A.; Boucher, L.; Leung, G.; Kolas, N.; Zhang, F.; et al. The BioGRID database: A comprehensive biomedical resource of curated protein, genetic, and chemical interactions. Protein Sci. 2021, 30, 187–200. [Google Scholar] [CrossRef]
  59. Guo, Y.E.; Manteiga, J.C.; Henninger, J.E.; Sabari, B.R.; Dall’Agnese, A.; Hannett, N.M.; Spille, J.H.; Afeyan, L.K.; Zamudio, A.V.; Shrinivas, K.; et al. Pol II phosphorylation regulates a switch between transcriptional and splicing condensates. Nature 2019, 572, 543–548. [Google Scholar] [CrossRef]
  60. Cho, W.K.; Spille, J.H.; Hecht, M.; Lee, C.; Li, C.; Grube, V.; Cisse, I.I. Mediator and RNA polymerase II clusters associate in transcription-dependent condensates. Science 2018, 361, 412–415. [Google Scholar] [CrossRef]
Figure 1. (A) Schematic of human TOP2A showing the regions that bind ligands including ATP, magnesium ions and DNA. The post translational phosphorylation sites are shown in red. (B) Alphafold predicted structure of human TOP2A dimer shown as cartoon with alpha-helices as cylinders. The core domains of each monomer are well-folded and colored light and dark grey, while the largely unstructured CTD of each monomer is shown as gold and maroon, respectively. (C) Upon adding post translational modifications, the CTD folds into a globular, alpha-helical bundle that occupies the N-gate in the predicted structure.
Dna 05 00046 g001
Figure 2. Predicted structure of TOP2A with post-translational modifications, 2 ATP molecules, 4 Mg2+ cations, and DNA. CTDs are shown in gold and maroon, while the core of TOP2A is shown in grey. (A,B) The 50 base pair DNA fragment is bound in the DNA-cleavage site, while the 75 base pair fragment is positioned in the N-gate. (C,D) The 350 base pair fragment loops around TOP2A and goes through the active site and the lower gate region, but also has steric clashes as discussed later.
Dna 05 00046 g002
Figure 3. (A) Monomeric TOP2A CTD from three structures are shown. Red is the apo structure with post-translational modifications (as in Figure 1B). Yellow is the complex of this same structure with 50- and 75 bp DNA fragments, Mg and ATP, while blue is the same except with a 350 bp, non-circular DNA fragment. CTDs have been aligned based on two alpha helices spanning residues 1175–1224 which appeared to have stable positions relative to the core domains, each aligning with less than 1 Å RMSD to the PTM alone structure (red). This depiction highlights the gross movements of the remaining CTD structure. (B) The CTD of TOP2A was aligned using only residues 1225–1531, resulting in minimal alignment, indicating that the CTDs across these structures are not related by a rigid body movement.
Dna 05 00046 g003
Figure 4. Images of all 5 models for each TOP2A + PTMs structure prediction. (A) TOP2A apo structure; (B) TOP2A + 50bp and 75 bp DNA fragments; (C) TOP2A + 350 bp DNA fragment. Each column 0-4 represents AF3 predicted models for each complex. DNA is excluded from images for clarity. The CTD sequences of chain A are colored as in Figure 3. Images generated using Pymol.
Dna 05 00046 g004
Figure 5. Schematic comparing the predicted secondary structures of (A) human Top2A with post-translational modifications (PTM) as shown in Figure 1, (B) is the same as A, but with ATP, 4 Mg2+ and 50 and 75 base pair DNA molecules added, and (C) the same as B but with a 350 base pair, non-circular DNA fragment instead of the shorter fragments. Secondary structural elements were obtained using Pymol’s get_model function. The C-terminal domain sequence of Monomer A is colored according to whether each residue is modeled as a loop (L, yellow), α-helix (H, maroon), or β-strand (S, teal). Monomer B secondary structure is nearly identical to that of A. The addition of DNA substrates increases the alpha helicity of the CTD (residues 1101–1531) from 46% to 72% for complex B and to 78% for complex C. Boxed positions indicate PTM locations.
Dna 05 00046 g005
Figure 6. Comparison of the number of α-helical positions between AF3 models of the CTD. Human TOP2A with PTM (TOP2), with 50 and 75 base pair DNA molecules (TOP2+50/75), and with 350 base pair DNA fragment (TOP2+350). Dots represent the number of a-helix residues for models 0–4 generated by AF3 for each condition. Results from ANOVA with Tukey’s post-test analysis are shown (ns = no significant difference; ** p < 0.005; *** p <0.001). Graph and analyses were completed using Graphpad Prism 10.
Dna 05 00046 g006
Figure 7. Superpositions of the five structural predictions of TOP2A dimers with PTMs bound to 50/75 bp DNA and ATP with (A,B) and without (C,D) the addition of 4 Mg2+ cations. Core domains are in grey while the CTDs are colored in a rainbow from model 0 to model 4. Despite some variance across the predicted models, the positions of the CTD are relatively consistent whether Mg2+ are bound or not.
Dna 05 00046 g007
Figure 8. Effect of decreasing numbers of PTMs on AF3 folding of TOP2A CTD with and without DNA. A series of structures were generated using decreasing numbers of PTMs with TOP2A in the absence of presence of DNA with 2 ATP and 4 Mg2+. Boxes highlight the last complex with predicted CTD folding. Images represent Model 0 for each case and were output by the AF3 web server. Structures are colored according to their plDDT scores as seen in the legend.
Dna 05 00046 g008
Disclaimer/Publisher’s Note: The statements, opinions and data contained in all publications are solely those of the individual author(s) and contributor(s) and not of MDPI and/or the editor(s). MDPI and/or the editor(s) disclaim responsibility for any injury to people or property resulting from any ideas, methods, instructions or products referred to in the content.