1. Introduction
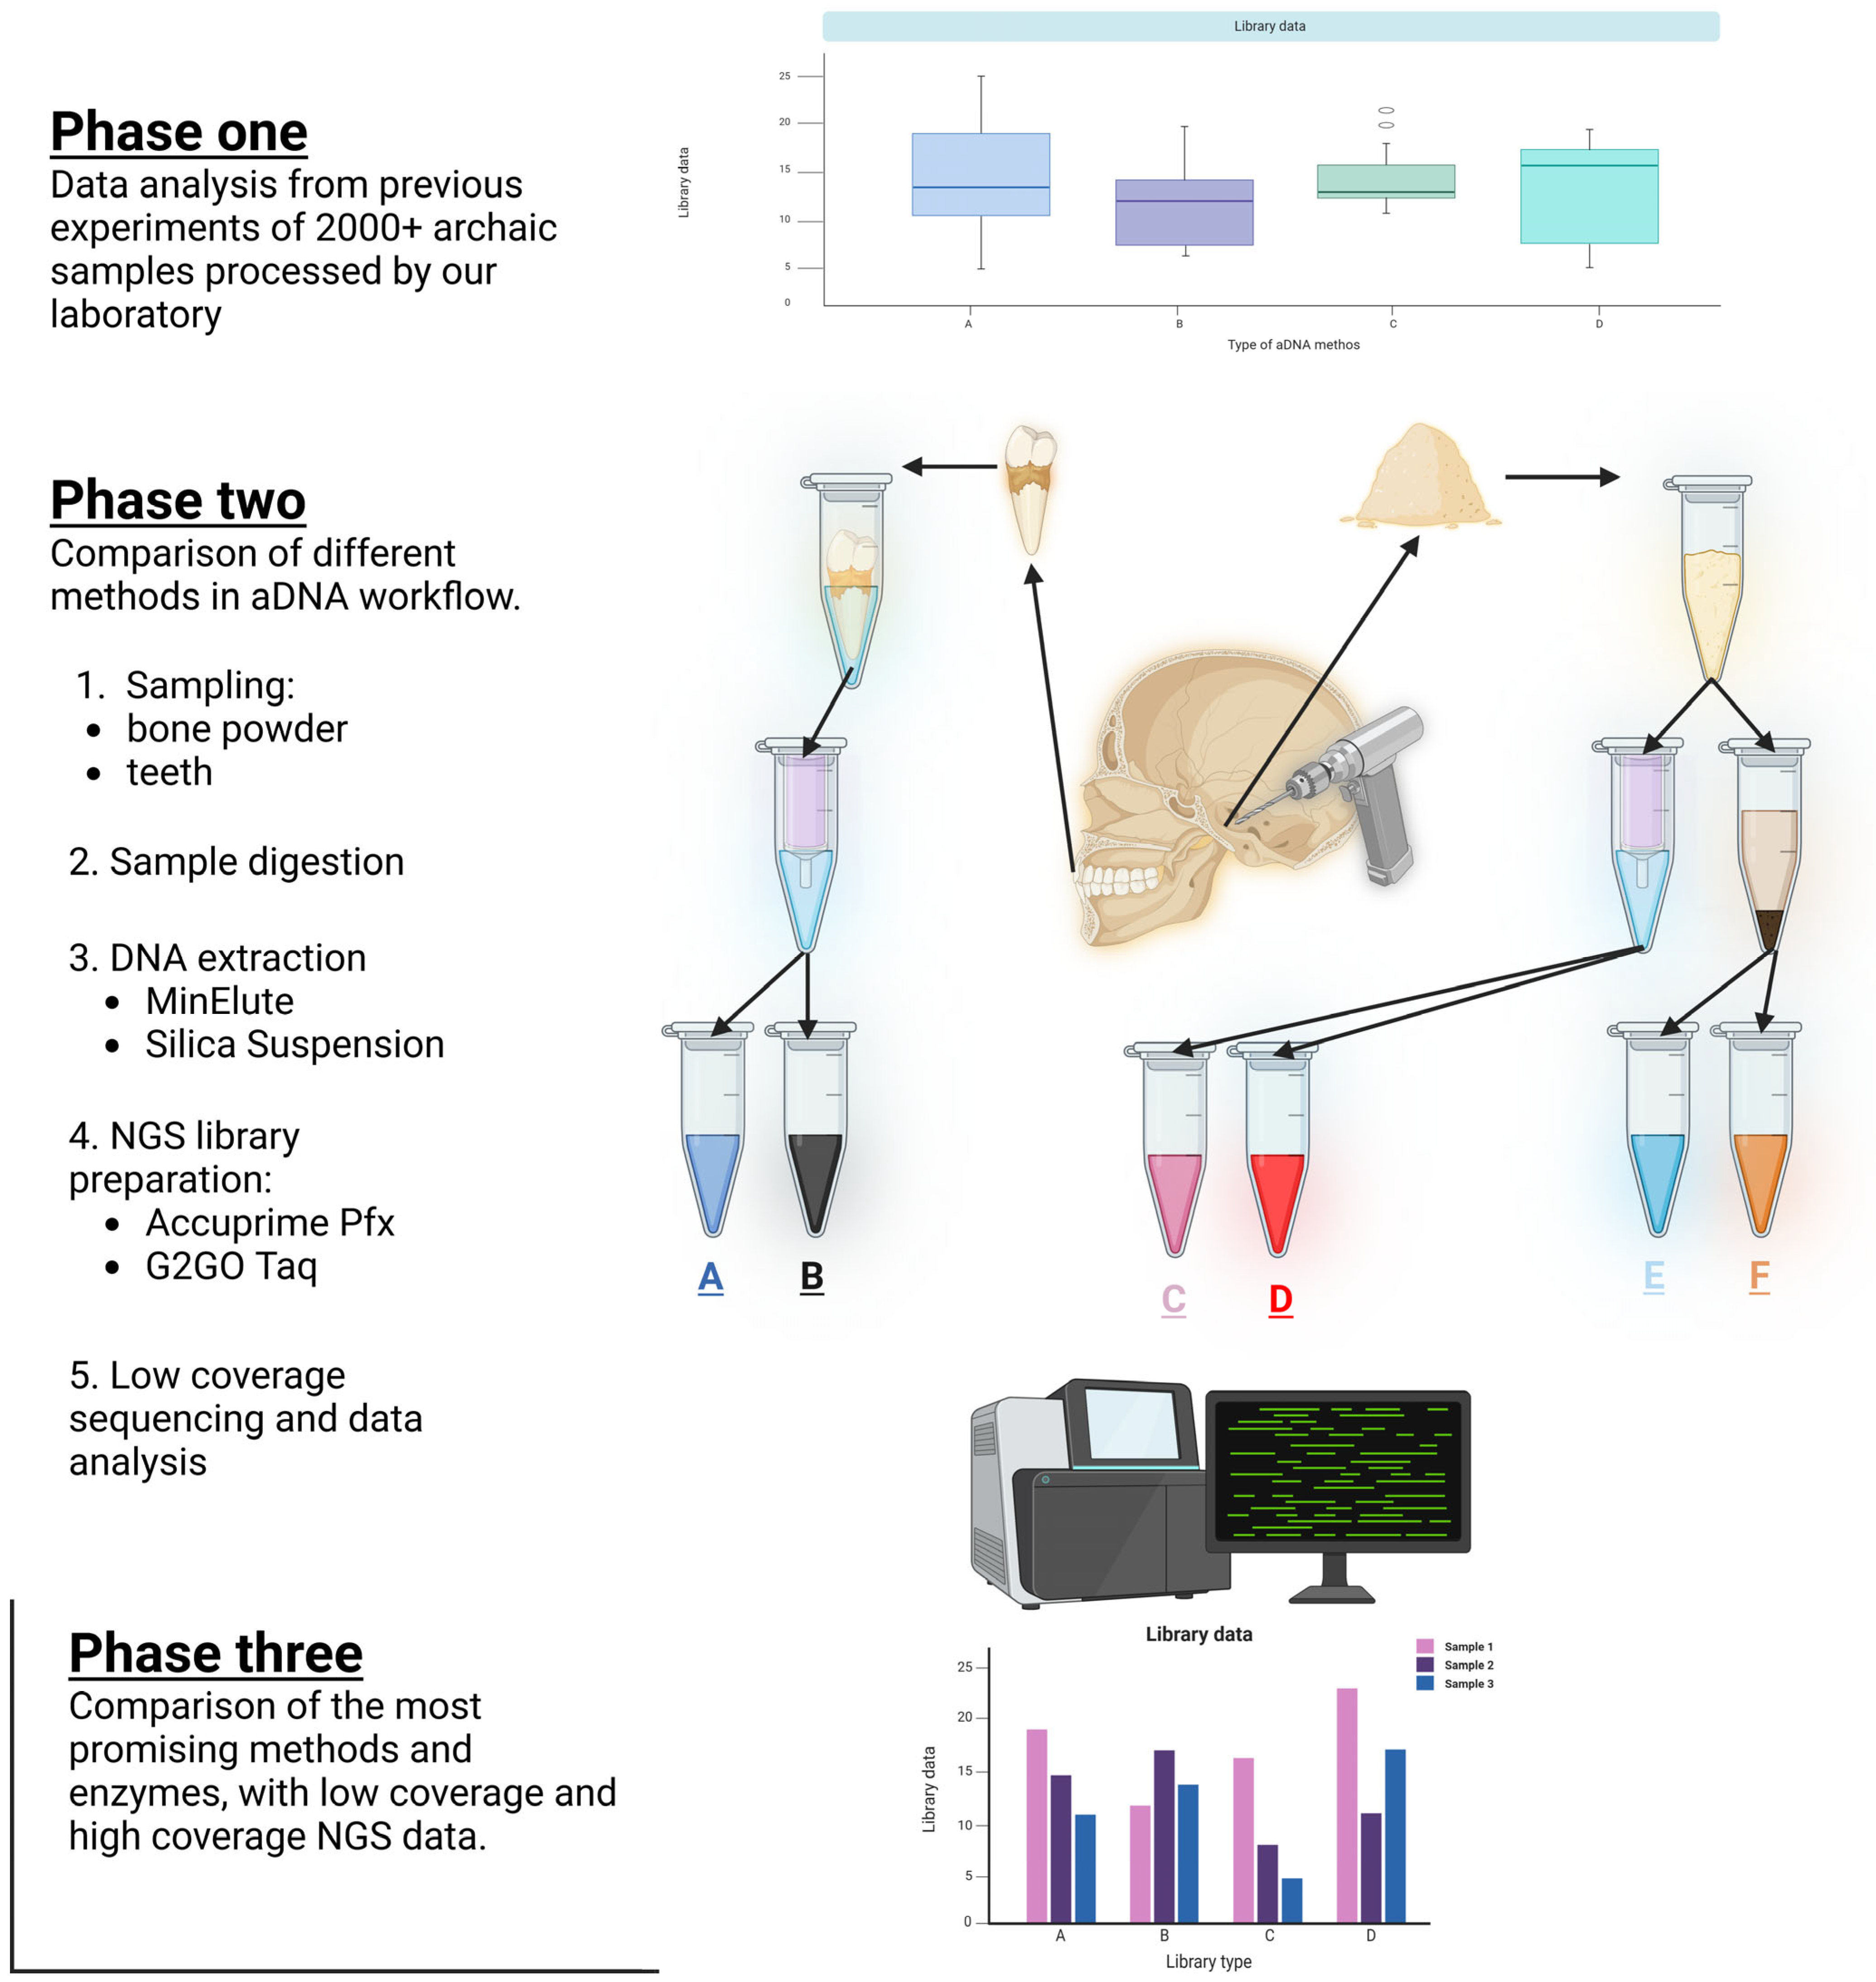
Archaeogenetics is a rapidly growing and evolving field. Since the beginning of aDNA research, many protocols have been developed, ranging from sampling to sequencing. Groups working in this field must consider a variety of factors and options, such as where to collect bone samples, the best method for aDNA extraction, how to construct NGS libraries, and what data must be analyzed to assist with these decisions. Although the cost of NGS is rapidly decreasing, a carefully planned and executed wet-lab workflow is essential for maximizing the extraction of optimal sequence data. During the years, we processed and worked with thousands of samples in our laboratory and generated a great amount of data. From these data, we made conclusions reflecting on the quality of the sequencing to understand the different methodologies. Also, we compared some aDNA workflows in the field, regarding the source of the DNA, and what DNA extraction and NGS library preparation methods were used.
DNA from ancient remains can persist in bones for more than 100,000 years [
1], making ancient aDNA a powerful tool for understanding our past. However, working with aDNA is extremely delicate due to the highly degraded nature of the samples, necessitating specialized laboratory environments and strict protocols to avoid contamination [
2]. Given the limited availability and irreplaceable nature of ancient bone materials, it is essential to develop and compare protocols that maximize the recovery of authentic ancient DNA.
In the past, our laboratory worked with a great number of samples from multiple archaic periods. As technology progressed, we adapted new methods and gathered a great amount of information.
The primary goal of this study was to evaluate and compare various DNA extraction and NGS library preparation methods used in aDNA research. Specifically, we aimed to determine which method offers the best outcomes in terms of key metrics such as endogenous DNA content, average fragment size, or library complexity. These factors are critical for maximizing the quality and quantity of valuable genetic information extracted from highly degraded ancient samples [
1,
3].
Additionally, due to the complex nature of aDNA, specialized bioinformatic analyses are required to handle the data effectively [
4]. We used Picard Tools software v1.113 [
5] for estimating endogenous DNA content and library complexity from low-coverage shallow shotgun sequencing data and in some cases compared these results with high-coverage whole-genome sequencing of the same libraries. By identifying the most effective protocols for DNA extraction and NGS library preparation, as well as evaluating the accuracy of library complexity estimates from low-coverage data, this study aims to provide clear recommendations for researchers working with aDNA.
2. Materials and Methods
2.1. Archeological Sample Collection and Sample Preparation
The anthropological collection in the Department of Biological Anthropology, University of Szeged, Hungary, has bone samples from multiple historical periods, allowing us to precisely identify and resample these remains.
The Department of Genetics at the University of Szeged used bone powder or teeth from the studied samples in order to construct NGS sequencing libraries. Our aim was to collect bone samples with minimal obvious harm to the ancient materials. The bone powder was extracted from the petrous bone on the skull’s base. For tooth samples, incisors were utilized.
The samples were prepared in the specialized bone laboratory of The Department of Genetics at the University of Szeged. During the preparation we followed the strict rules of aDNA work in a separated space for each step [
2]. After bringing every bone sample in the laboratory, we used sodium hypochlorite and ultra-pure water to clean the surfaces, and after that procedure, we applied a short, 2 times 30-min UV treatment on each side of the bone materials [
6]. This way we could minimize the amount of unwanted external DNA.
2.2. DNA Extraction Workflow
Work on ancient DNA was done in the specialized clean room in the aDNA facilities of the Department of Genetics at the University of Szeged, Hungary.
Due to the characteristics of aDNA and the high risk of contamination, working with aDNA necessitates adherence to specific guidelines. The preamplification work is performed in a sterile laboratory (aDNA lab) that is as far away as possible from the post-PCR (molecular) lab [
7].
As in any well-executed experiment, it is essential to monitor our work, which is why we established controls for each approach we employed. At each extraction step, we used negative control, containing only the reaction buffers. As we handled samples containing a substance, each procedure was carried out identically in the negative control. This way, if any DNA is detected in the negative control, we may rerun the experiment and trace the error back to its source.
In the case of tubular bone, DNA is extracted from the compact tissue, as osteocytes trapped between collagen fibers preserve DNA the best. Endogenous DNA is best preserved in the pars petrosa of the spongy bone, but the cementum layer of the tooth root is also a good source [
8,
9].
In the case of an intact skull, we employ a technique developed by [
10] that involves drilling the petrous bone. This technique does not cause significant skull damage. If the skull has disintegrated and the pars petrosa is easily accessible, or if the pars petrosa is broken, we cut around the portion of the bone that corresponds to the inner ear.
To further refine the drilled or cut bone samples to create fine bone dust—which is a recommended step to help to solubilize the aDNA more effectively—we used the StarBeater (VWR®, Radnor, PA, USA, Beater Mixer Mill, Catalog #412-0167) at low speed to preserve aDNA integrity by minimizing heat generation.
To prepare the teeth samples, we wrapped the crown part in parafilm; this way, the majority of the extracted DNA came from the cementum of the root [
11].
2.3. Predigesting the Bone Materials and Solubillizing the aDNA
To eliminate external contamination and increase the concentration of human endogenous DNA in our DNA samples, we predigested each one [
12,
13]. In the instance of bone powder, we began with 200 mg of finely ground petrous or tubular bone. In the case of tooth samples, we wrapped the crown section snugly and firmly with parafilm to maintain the crown’s integrity [
11]. This way, the predigestion and extraction will not affect the surface of the tooth, and it can be returned and investigated later for anthropologists and archeologists.
In anEppendorf® ThermoMixer® F2.0 (Eppendorf, Hamburg, Germany, Catalog Number 5387000013), with the Eppendorf® ThermoTop attachment (Eppendorf, Germany, Catalog Number 5308000003), 1 mL of 0.5 M EDTA and 100 µg/mL of Proteinase-K were predigested at 48 °C for 30 min. After 1 min of centrifuging the samples at 13,000 rpm, the largely contaminated supernatant was carefully pipetted and discarded.
A 72-h long DNA solubilization was performed. In the case of silica suspension, DNA extraction in 1 mL of extraction buffer was performed, and for the QIAGEN MinElute column, we conducted a DNA cleaning method in 1.5 mL extraction buffer containing 0.45 M EDTA, 250 µg/mL Proteinase K, 1% Triton X-100, and 50 mM DTT. To prevent the evaporation of the solution, we wrapped it in Eppendorf tubes with parafilm. The samples were placed in an Eppendorf Thermomixer operating at 1500 rpm at a temperature of 48 °C.
2.4. Creating the Silica Suspension
To create the silica suspension, 2.4 g of silicon dioxide powder (Sigma-Aldrich (SIGALD), St. Louis, MO, USA, CAS No. 14808-80-7) was suspended in 20 mL of DNA-free water and then allowed to settle for one hour at room temperature in the dark (silica is sensitive to light). Then, 19.5 mL of the supernatant was pipetted into a clean falcon tube, and the mixture was settled in the dark at room temperature for an additional four hours. An amount of 17 mL of the supernatant was pipetted and discarded. By doing this, we removed the silica particles that were too large or too small. We continued working with the 2.5 mL of sediment that remained. After adjusting the pH of the suspension with 24 µL of 30% hydrochloric acid, 850 µL of the suspension was measured and stored in the dark at room temperature until use.
2.5. DNA Extraction with Silica Suspension
To the 1 mL of digested and solubilized DNA, 6 mL binding buffer (5.83 M GuHCl, 105 mM NaOAc, 46.8% isopropanol, 0.06% Tween-20, and 150 µL silica suspension) were added, and the pH was adjusted between 4 and 6 with HCl. After 3 h of room temperature binding, silica was pelleted and washed twice with 80% ethanol before DNA was eluted in 100 µL TE buffer. We measured the concentration of the extracted DNA with Invitrogen™ Qubit™ 3 Fluorometer (Thermo Fisher Scientific, Waltham, MA, USA, Catalog No. Q33216) using the Qubit™ dsDNA HS Assay Kit (Thermo Fisher Scientific, USA, Catalog number Q32851).
2.6. DNA Extraction with QIAGEN MinElute Columns
The digested DNA was cleaned according to the QIAGEN protocol. We employed a vacuum manifold system to avoid and reduce the possibility of contamination between the samples. Because the original column capacity was insufficient, we created a larger volume column in the lab using the QIAGEN MinElute column and medical-grade infusion accessories by attaching them using parafilm. The DNA was eluted using 50 µL of EB elution buffer. We measured the concentration of the extracted DNA with Qubit dsDNA HS Assay Kit.
2.7. NGS Library Construction
We handled the DNA extract in the same manner in order to facilitate an accurate comparison of the various NGS library construction techniques [
14,
15]. However, we did make crucial modifications to several important steps. Because of this, we were able to generate 6 NGS double-stranded, dual-indexed libraries from each individual bone sample, generating a total of 36 libraries in phase two of the study.
In the third phase of the study, we created 2 sets of libraries from 10 ancient individuals, generating a total of 20 libraries.
An amount of 30 µL of DNA extracts went through UDG (Uracil DNA glycosylase) treatment, as described in [
16]. The treatment was performed with 1.8 µL USER
® (1 U/µL, New England Biolabs, Ipswich, MA, USA, Catalog number M5505S) enzyme in a mixture of 6 ul Buffer Tango (10×), 0.24 µL dNTPs (25 mM each), and 0.6 µL of ATP (100 mM) in a final volume of 60 µL with 21.36 µL of gamma ray treated Milli-Q ultra-pure H
2O added. The reaction was incubated at 37 °C for 30 min and 40 °C lid temperature in PCR machine.
To stop the reaction, 1.8 µL UGI (Uracil Glycosylase Inhibitor, 2 U/µL NEB) was added to the reaction, and the samples were incubated further at 37 °C for 30 min and 40 °C lid temperature in PCR machine.
As the next step, we performed blunt-end repair by adding 3 µL of T4 polynucleotide kinase (10 U/μL) and 1.2 µL of T4 DNA polymerase-t (5 U/μL) to each sample and incubated them in a PCR machine for 25 °C for 15 min, then 12 °C for 5 min, and cooled them down to 4 °C.
To clean the prepared samples, we used QIAGEN MinElute columns using the protocol provided by the manufacturer. For the final elution step, we used 20 µL of EB prewarmed to 55 °C.
2.8. Optional Preamplification
This is an optional step in which the libraries are amplified with a low-cycle PCR reaction prior to indexing so that sufficient quantities are preserved for potential future studies. In the reaction, we employ universal primers that bind to the adapters and a polymerase enzyme that can also transcribe the remaining uracils in the molecules. Only libraries prepared prior to this study with the KAPA HiFi enzyme utilized this step.
The reaction mixture per sample contained 15 µL ddH2O, 15 µL GoTaq buffer (5×), 7.5 µL MgCl2 (25 mM), 7.5 µL dNTP mix (deoxynucleotide mix (dATP, dCTP, dGTP, and dTTP)) (2.5 mM each), 3.75 µL BSA (bovine serum albumin) (10 mg/mL), 0.375 µL G2GoTaq enzyme (5 U/µL), 4.5 µL IS7 (10 µM) and 4.5 µL IS8 (10 µM) primers, and 15 µL of DNA template, resulting in a final reaction volume of 75 µL per sample. This was then evenly distributed into three PCR tubes with 25 µL in each. The set program was as follows: 96 °C for 6 min, 94 °C for 30 s, 58 °C for 30 s, 72 °C for 30 s, 64 °C for 10 min, then hold at 4 °C. The three 30-s steps were repeated for 12 cycles.
The contents of the tubes containing identical samples were combined, and the samples were then purified on MinElute columns in the manner described previously. An amount of 25 µL of EB buffer was used to dissolve DNA. The concentration of the samples was then determined by using the Qubit dsDNA HS Assay Kit.
2.9. Adapter Ligation and Adapter Fill-In
Adapter ligation and adapter fill-in were executed as described in [
17]. Starting from blunt-end DNA fragments, the adapters were ligated to the ends of the DNA molecules. The adapters are short oligonucleotides that contain priming sites for PCR amplification during indexing and binding to the sequencing flow cell. After ligation, an adapter fill-in reaction was carried out to complete the synthesis of the complementary strand across the adapter region.
2.10. Double Indexing with Different Enzymes
During this step, adapters with unique index combinations for each sample were attached to both ends of DNA fragments. Indexes are unique, known sequences of 7 nucleotides that allow us to identify and separate the DNA sequence readings of an individual during sequencing. The available indexes may be combined as desired; however, each sample to be sequenced must have a distinct index combination. Using a PCR reaction, the adapters containing the index are attached to the ends of the molecules. We used two different enzymes in this study: AccuPrime™ Pfx SuperMix (Thermo Fisher Scientific, Invitrogen™, USA, Catalog Number: 12344040) and GoTaq® G2 DNA Polymerase (Promega Corporation, USA, Catalog Number: M7841). We selected the two enzymes based on their relevance in aDNA research laboratory workflows. The high cost of AccuPrime Pfx can be a significant barrier for laboratories with limited resources, especially when processing large number of samples. To address this problem and to find a more accessible alternative, we tested GoTaq G2 DNA Polymerase, as it is a widely available and cost-effective enzyme. By directly comparing the two enzymes, we aimed to evaluate whether GoTaq G2 could serve as a reliable and economical substitute for AccuPrime Pfx in certain workflows.
2.11. Double Indexing by Using AccuPrime Pfx Supermix
AccuPrime Pfx is a DNA polymerase that is widely used in the field of archaeogenetics due to its high fidelity and proofreading activity. These properties ensure the precise amplification of aDNA fragments. AccuPrime Pfx is well established in the field for producing reliable results with highly degraded and limited amounts of ancient material [
16,
18].
We did not perform any preamplification prior to indexing the library after filling-in the adapters when utilizing this enzyme. In a PCR reaction, DNA molecules are amplified and marked with different indexes.
Per sample, the reaction mixture included 58.5 µL of AccuPrime Pfx Supermix, 3 µL of BSA (10 mg/mL), 1.5 µL P5, 1.5 µL P7 index (primer), and 10.5 µL of DNA template. The final volume per sample was 75 µL, which was evenly distributed among three PCR tubes and placed in the PCR machine. The PCR conditions were as follows: 95 °C for 5 min, 95 °C for 15 s, 60 °C for 30 s, 68 °C for 30 s, 68 °C for 5 min, and hold at 4 °C. Twelve cycles of the 15–30 s steps were performed. At the conclusion of the program, the 3 reactions with the same index combination were combined and then purified on MinElute columns using the above-described protocol. The elution was performed with 20 µL of EB buffer. We determined the concentration of the libraries using the above-described Qubit method and then froze them at −20 °C for future use.
2.12. Double Indexing by Using G2GO Taq Polimerase
GoTaq G2 lacks 3′→5′ exonuclease proofreading activity, making it a lower-fidelity enzyme compared to AccuPrime Pfx. It is a robust and commonly used enzyme in various molecular biology applications, including some aDNA workflows. By directly comparing the two enzymes, we aimed to evaluate whether GoTaq G2 could serve as a reliable and economical substitute for AccuPrime Pfx in certain workflows.
No preamplification took place in this case either; the indexing was executed right after the adapter fill-in.
The reaction mixture consisted of the following components per sample: 28.5 µL ddH2O, 20 µL GoTaq buffer (5×), 10 µL MgCl2 (25 mM), 10 µL dNTP mix (each 2.5 mM), 5 µL BSA (10 mg/mL), 0.5 µL G2GoTaq enzyme (5 U/µL), 6 µL P5 (10 µM), 6 µL P7 (10 µM) primers, and 14 µL DNA template. The final volume per sample was 100 µL, which was evenly distributed among four PCR tubes. The PCR protocol was as follows: 96 °C for 6 min, 94 °C for 30 s, 58 °C for 30 s, 72 °C for 30 s, 64 °C for 10 min, and hold at 4 °C. Twelve cycles of the three 30-s steps were performed. At the end of the program, the contents of the tubes containing identical samples were combined, and then the samples were purified on MinElute columns as described previously. An amount of 20 µL of EB buffer was used to elute the DNA. After measuring the concentration of the libraries using the Qubit method, as described previously, they were stored at −20 °C until further use.
2.13. Average Fragment Length Determination
Before sequencing the libraries, it is necessary to determine the fragment size distribution of the samples. To measure this, we used the Agilent Tapestation 4200 (Agilent Technologies, Santa Clara, CA, USA, Catalog Number: G2991BA) instrument, which can determine this information using high-sensitivity DNA screen tape. The significance of this lies in the fact that if the size distribution of the DNA fragments in a sample is determined, the DNA content in nM of the sample can be estimated, and the desired number of sequencing reads from the sample can be calculated.
We diluted 1 µL of DNA libraries with known concentrations already measured with Qubit to 1:10, to 1:100, and to 1:1000 so that their DNA concentration was 10–1000 pg/µL. Then, 2 µL of the diluted samples was transferred to an instrument-compatible plate into which 2 µL of fluorescent buffer had previously been measured. We vortexed the samples at 2000 rpm for one minute and then placed them in the machine, which performed the run independently and then determined the fragment distribution of the individual libraries.
2.14. Sequencing
In our laboratory, all samples were sequenced using the single-channel Illumina iSeq 100 sequencer (Illumina, Inc., San Diego, CA, USA, Catalog Number: 20021535) of the third generation. We performed shotgun sequencing, which provided us with information such as endogenous/exogenous DNA concentration and estimated library complexity, among others. The essence of shotgun sequencing is sequencing a large number of random genome fragments and then aligning them to the reference genome.
For sequencing, we utilized the Illumina-manufactured iSeq 100 i1 Reagent v2 single kit (Illumina, Inc. USA, Catalog Number: 20031371), which included a cartridge prefilled with the necessary running reagents and a flow cell. The flow cell was kept at 4 °C, while the cartridge was kept at −20 °C. They were brought to room temperature and left to stand for a day before use.
To determine the endogenous DNA content, all extracted sequence fragments are aligned to the human reference genome. The proportion of sequences that can be aligned gives the endogenous human DNA ratio, whereas the sequences that cannot be aligned are from an exogenous pollutant source.
The sample with the greatest endogenous content was sent to the NovaSeq6000 (Illumina, Inc., USA, Catalog Number: 20012850) device for high-coverage whole-genome sequencing.
First, the samples were diluted to 1 nM based on the Qubit concentration and the Tapestation-determined fragment distribution. To accomplish this, we utilized 1.5 µL of samples with a concentration equal to or greater than 100 ng/ µL and 3 µL of samples with a lower concentration. Then, 10 µL of each sample was weighed and placed in a single microcentrifuge tube, where it was thoroughly vortexed before being diluted with 84 µL ddH2O and 16 µL of pooled libraries. An amount of 20 µL of the diluted mixture was then sequenced.
The following parameters were entered into the machine’s programming: generate fastq module with index reads of 2, paired-end reads of 151, and a custom library preparation kit. In total, 150 nucleotides were read per cycle, for a total of 8 million paired-end reads during the run.
The remaining adapter parts were removed from the raw sequences using the Cut Adapt software,
https://cutadapt.readthedocs.io/en/stable/, and the sequence reads were aligned to the human reference genome using the Burrows–Wheeler Aligner application. This allowed us to calculate the sample’s endogenous DNA content. Picard Tools was utilized to eliminate PCR duplicates and extract additional data in order to calculate library complexity.
2.15. NGS Library Complexity Estimation Using Picard Tools Software
With Picard Tools, it is possible to specify a quality metric that estimates the number of distinct molecules in the library, i.e., the library’s complexity [
5]. In case of low complexity, the number of PCR duplicates increases significantly, resulting in a large number of identical reads from the sequencing reaction, while other parts of the genome will be underrepresented. Thus, the complexity value is a very useful metric, signifying the actual sequence information present in the library.
The estimation is based on the number of unique and duplicated reads. Poor quality and unpaired readings are filtered out and disregarded by the program. If the difference between two molecules is less than 3%, they are considered duplicates. Then, to refine the result, additional filters are applied to the data.
The calculation utilizes the Lander–Waterman equation:
C = the number of unique reads examined (the number of unique fragments observed in read pairs—PCR and optical duplicates); X = the number of unique molecules in the library; N = the total number of read pairs—optical duplicates.
4. Discussion
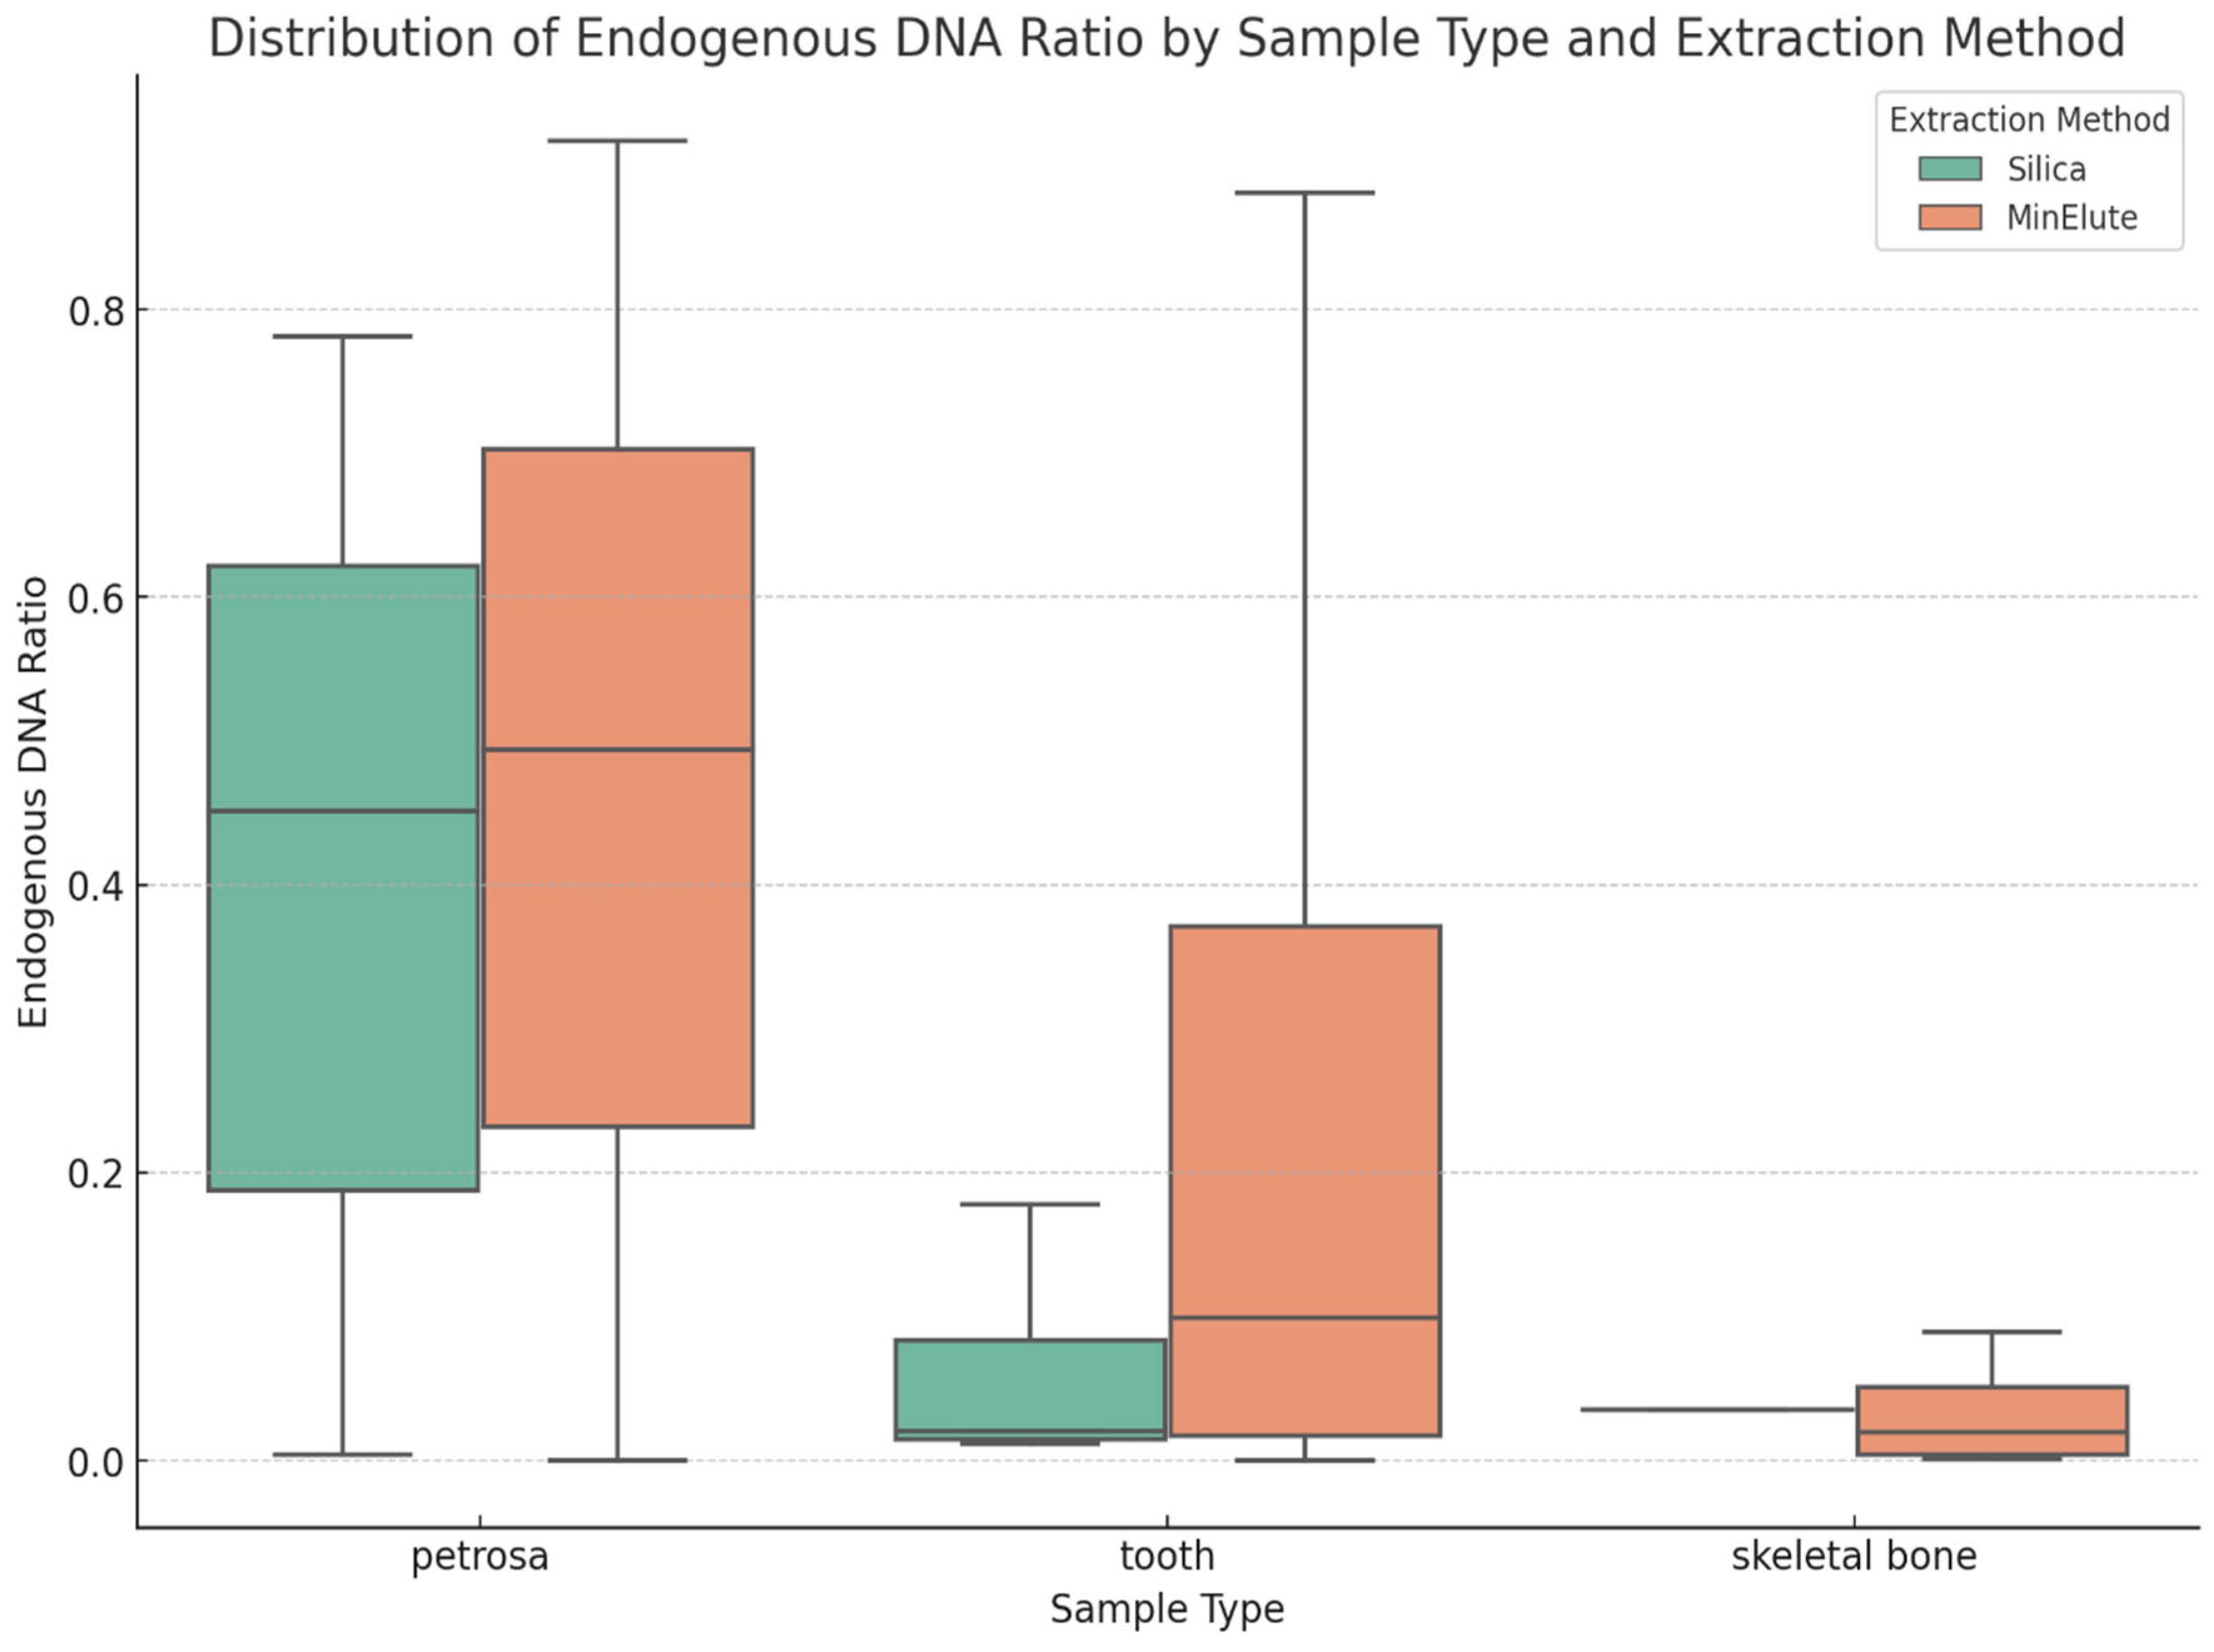
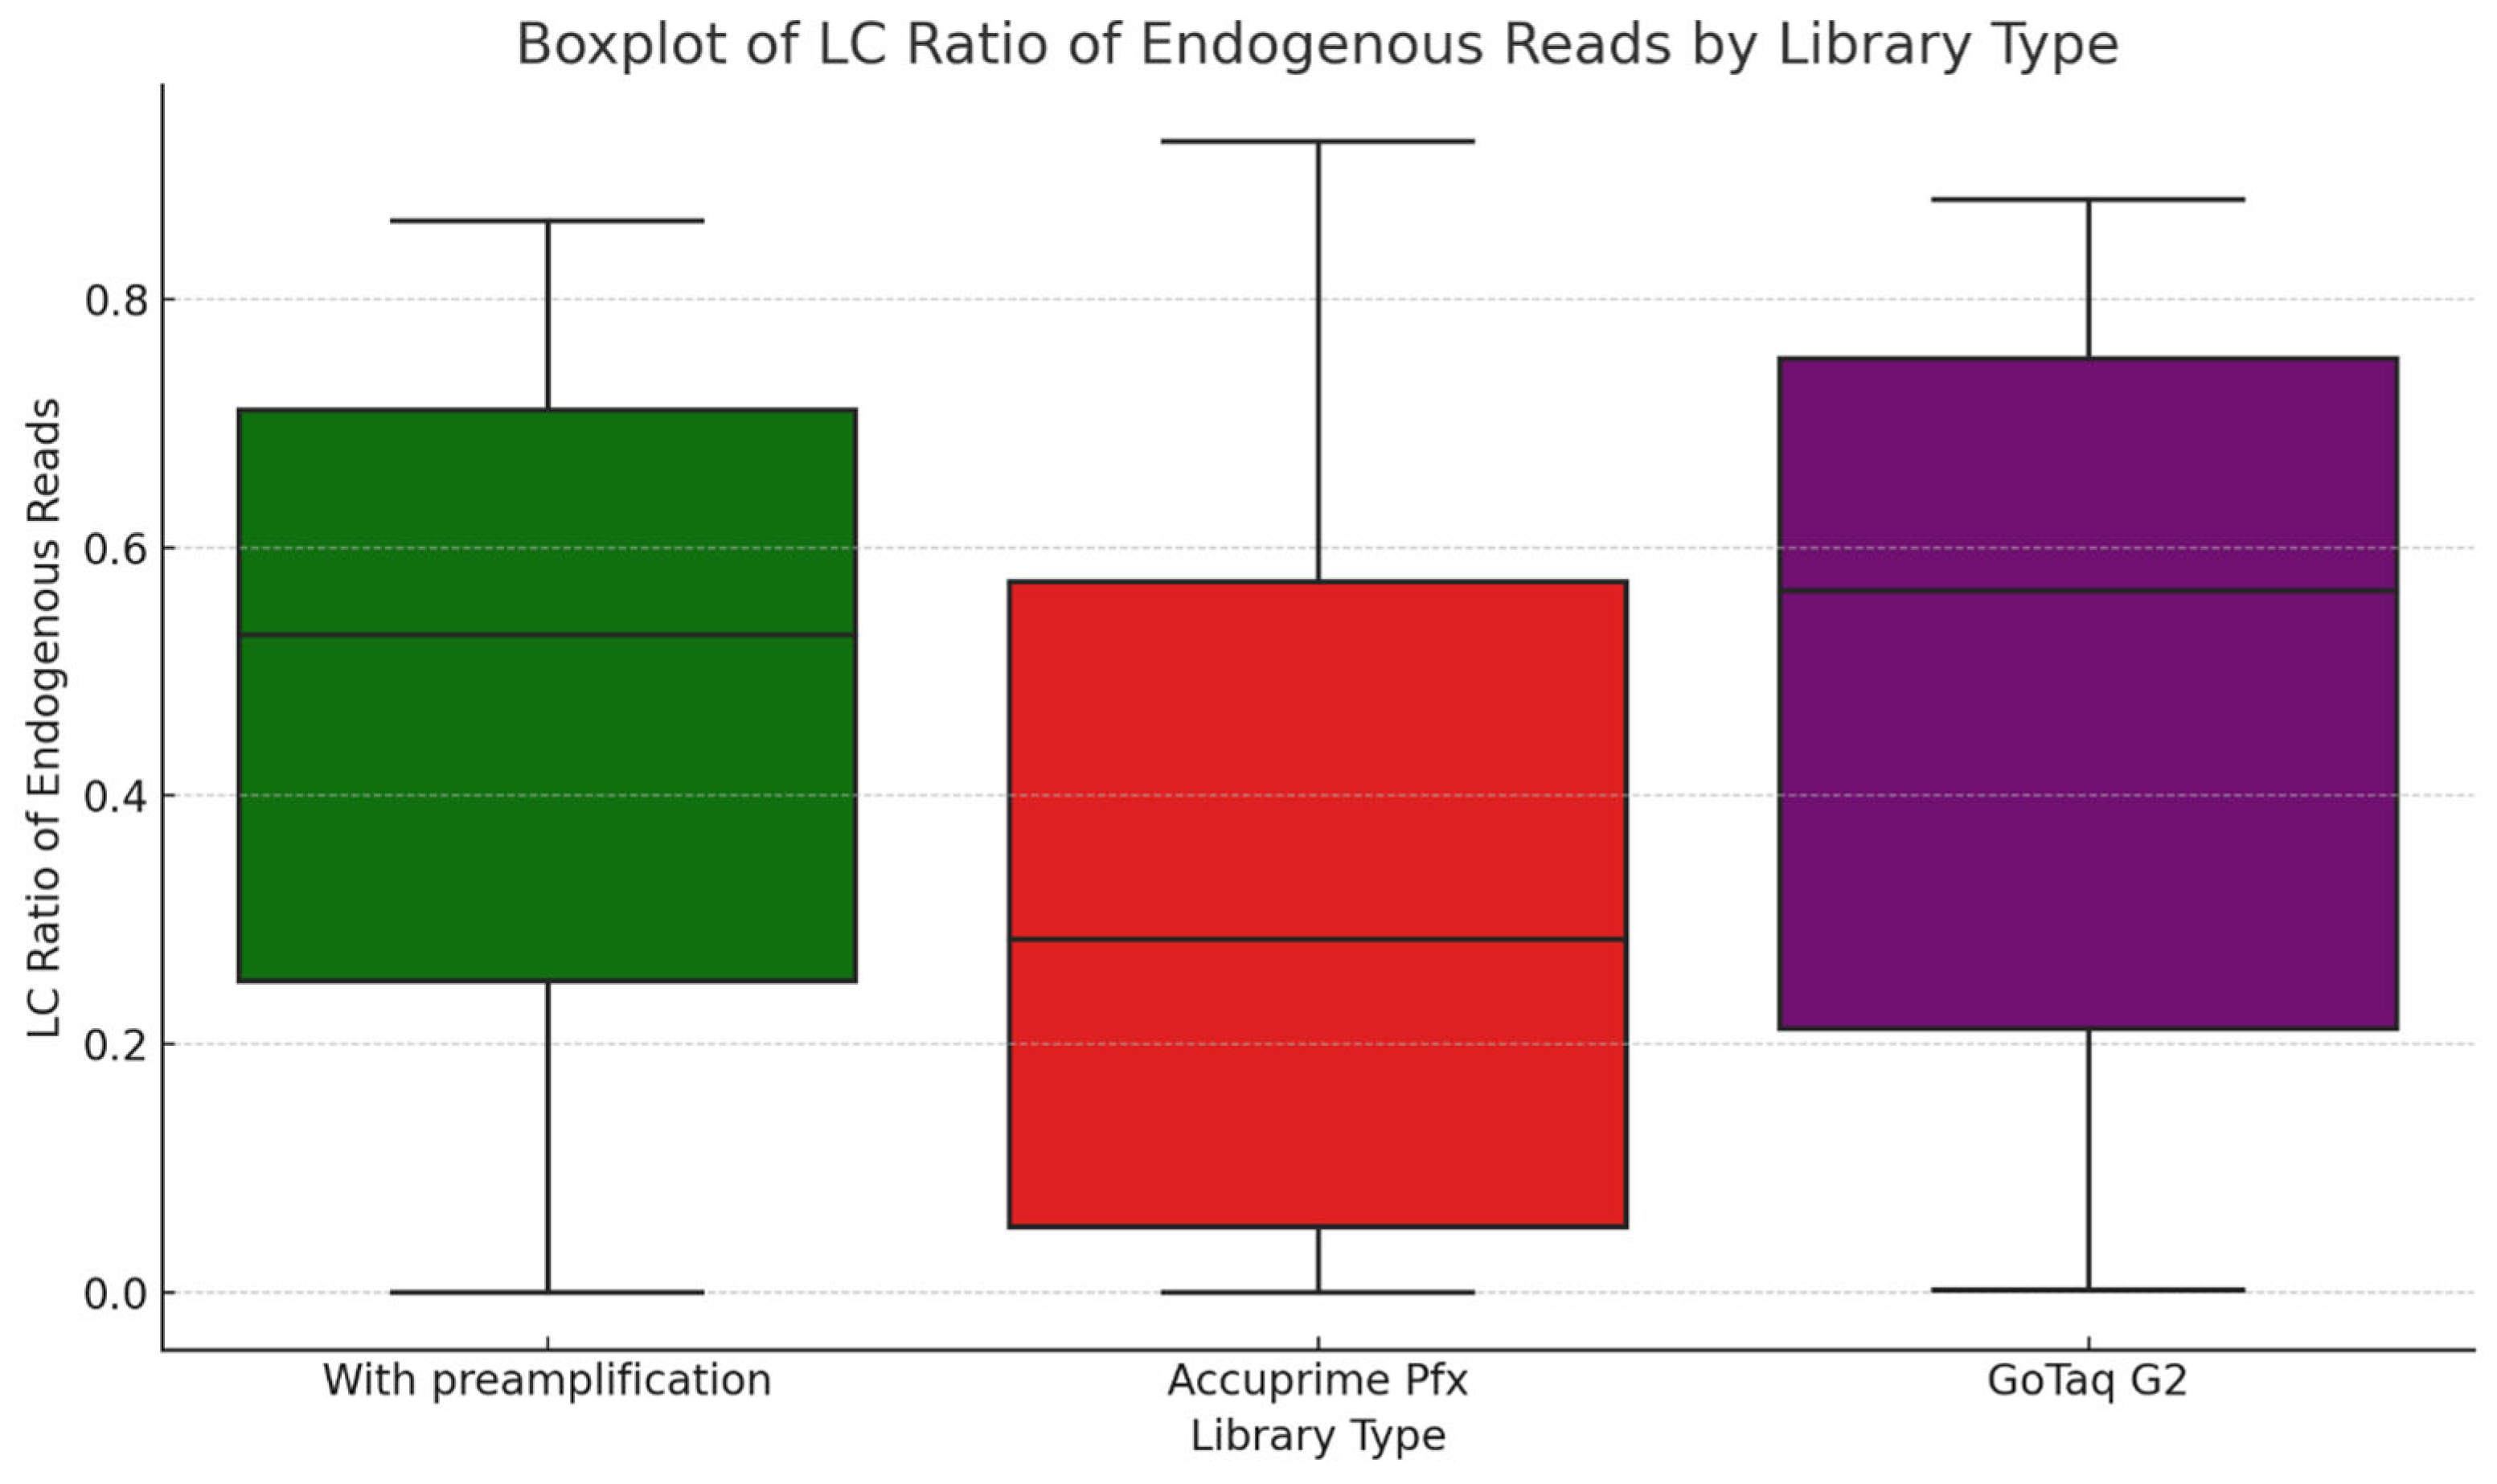
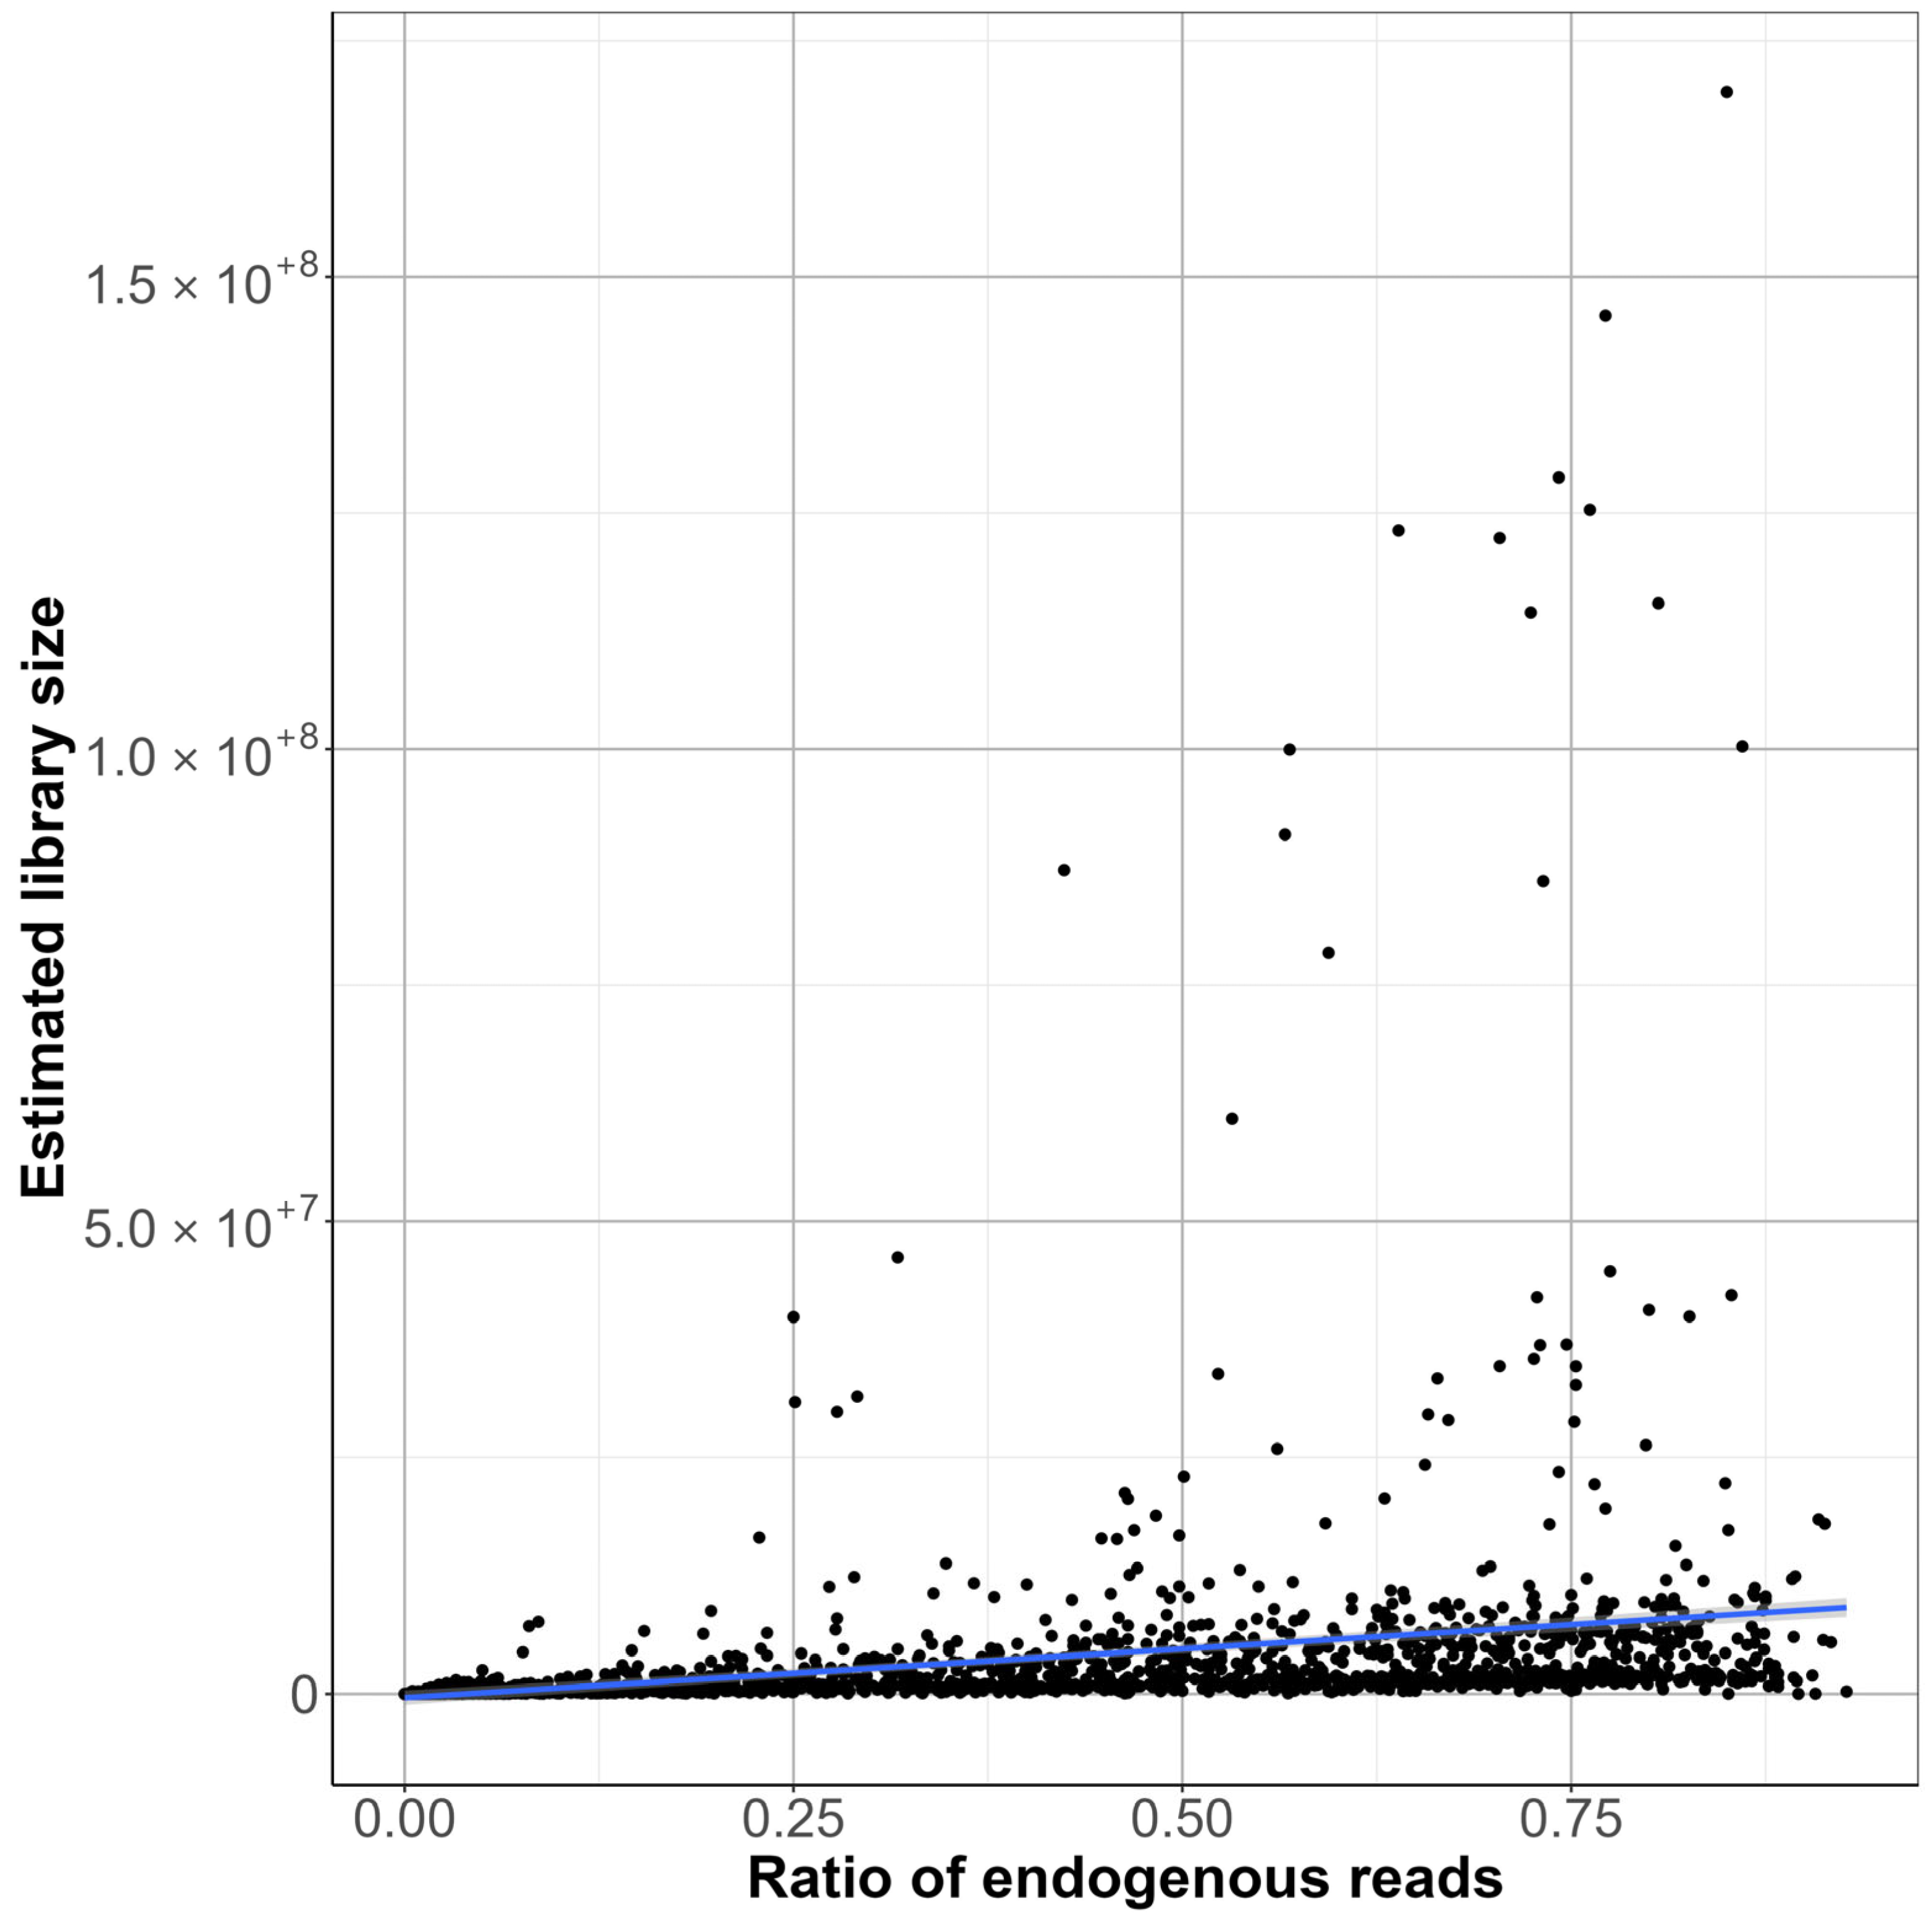
In the first phase of the study, we analyzed the data we generated by working with more than 2000 archaic samples. We explored LC and HC data for the ratio of endogenous DNA, which is a key metric indicating sample preservation. Our findings validate the use of LC data to assess sample quality and prioritize samples for further analysis. We demonstrated, as previous studies showed, that the petrosa bone is the superior source of aDNA in terms of endogenous DNA. While we did not see big significant differences, and all the libraries ranged mostly in the same range of endogenous DNA, we can observe that the highest means of endogenous DNA ratio can be observed in the libraries made by GoTaq G2 enzyme, followed by libraries made with the extra preamplification step and then libraries made with the Accuprime Pfx enzyme. It is not necessary to create immortalized libraries anymore, so preamplification can be eliminated from the library preparation.
Library complexity is an important metric for the quality of a library. Our results indicated that LC data can provide only a very rough approximation of library complexity trends. This is a valuable insight into sample quality before HC sequencing. However, relying only on LC data, we would not recommend estimating HC library complexity. While the LC ratio of endogenous reads provides a reliable measure of sample authenticity even for HC sequencing, the LC library complexity may not reflect properly on the actual genomic diversity and complexity of the aDNA libraries.
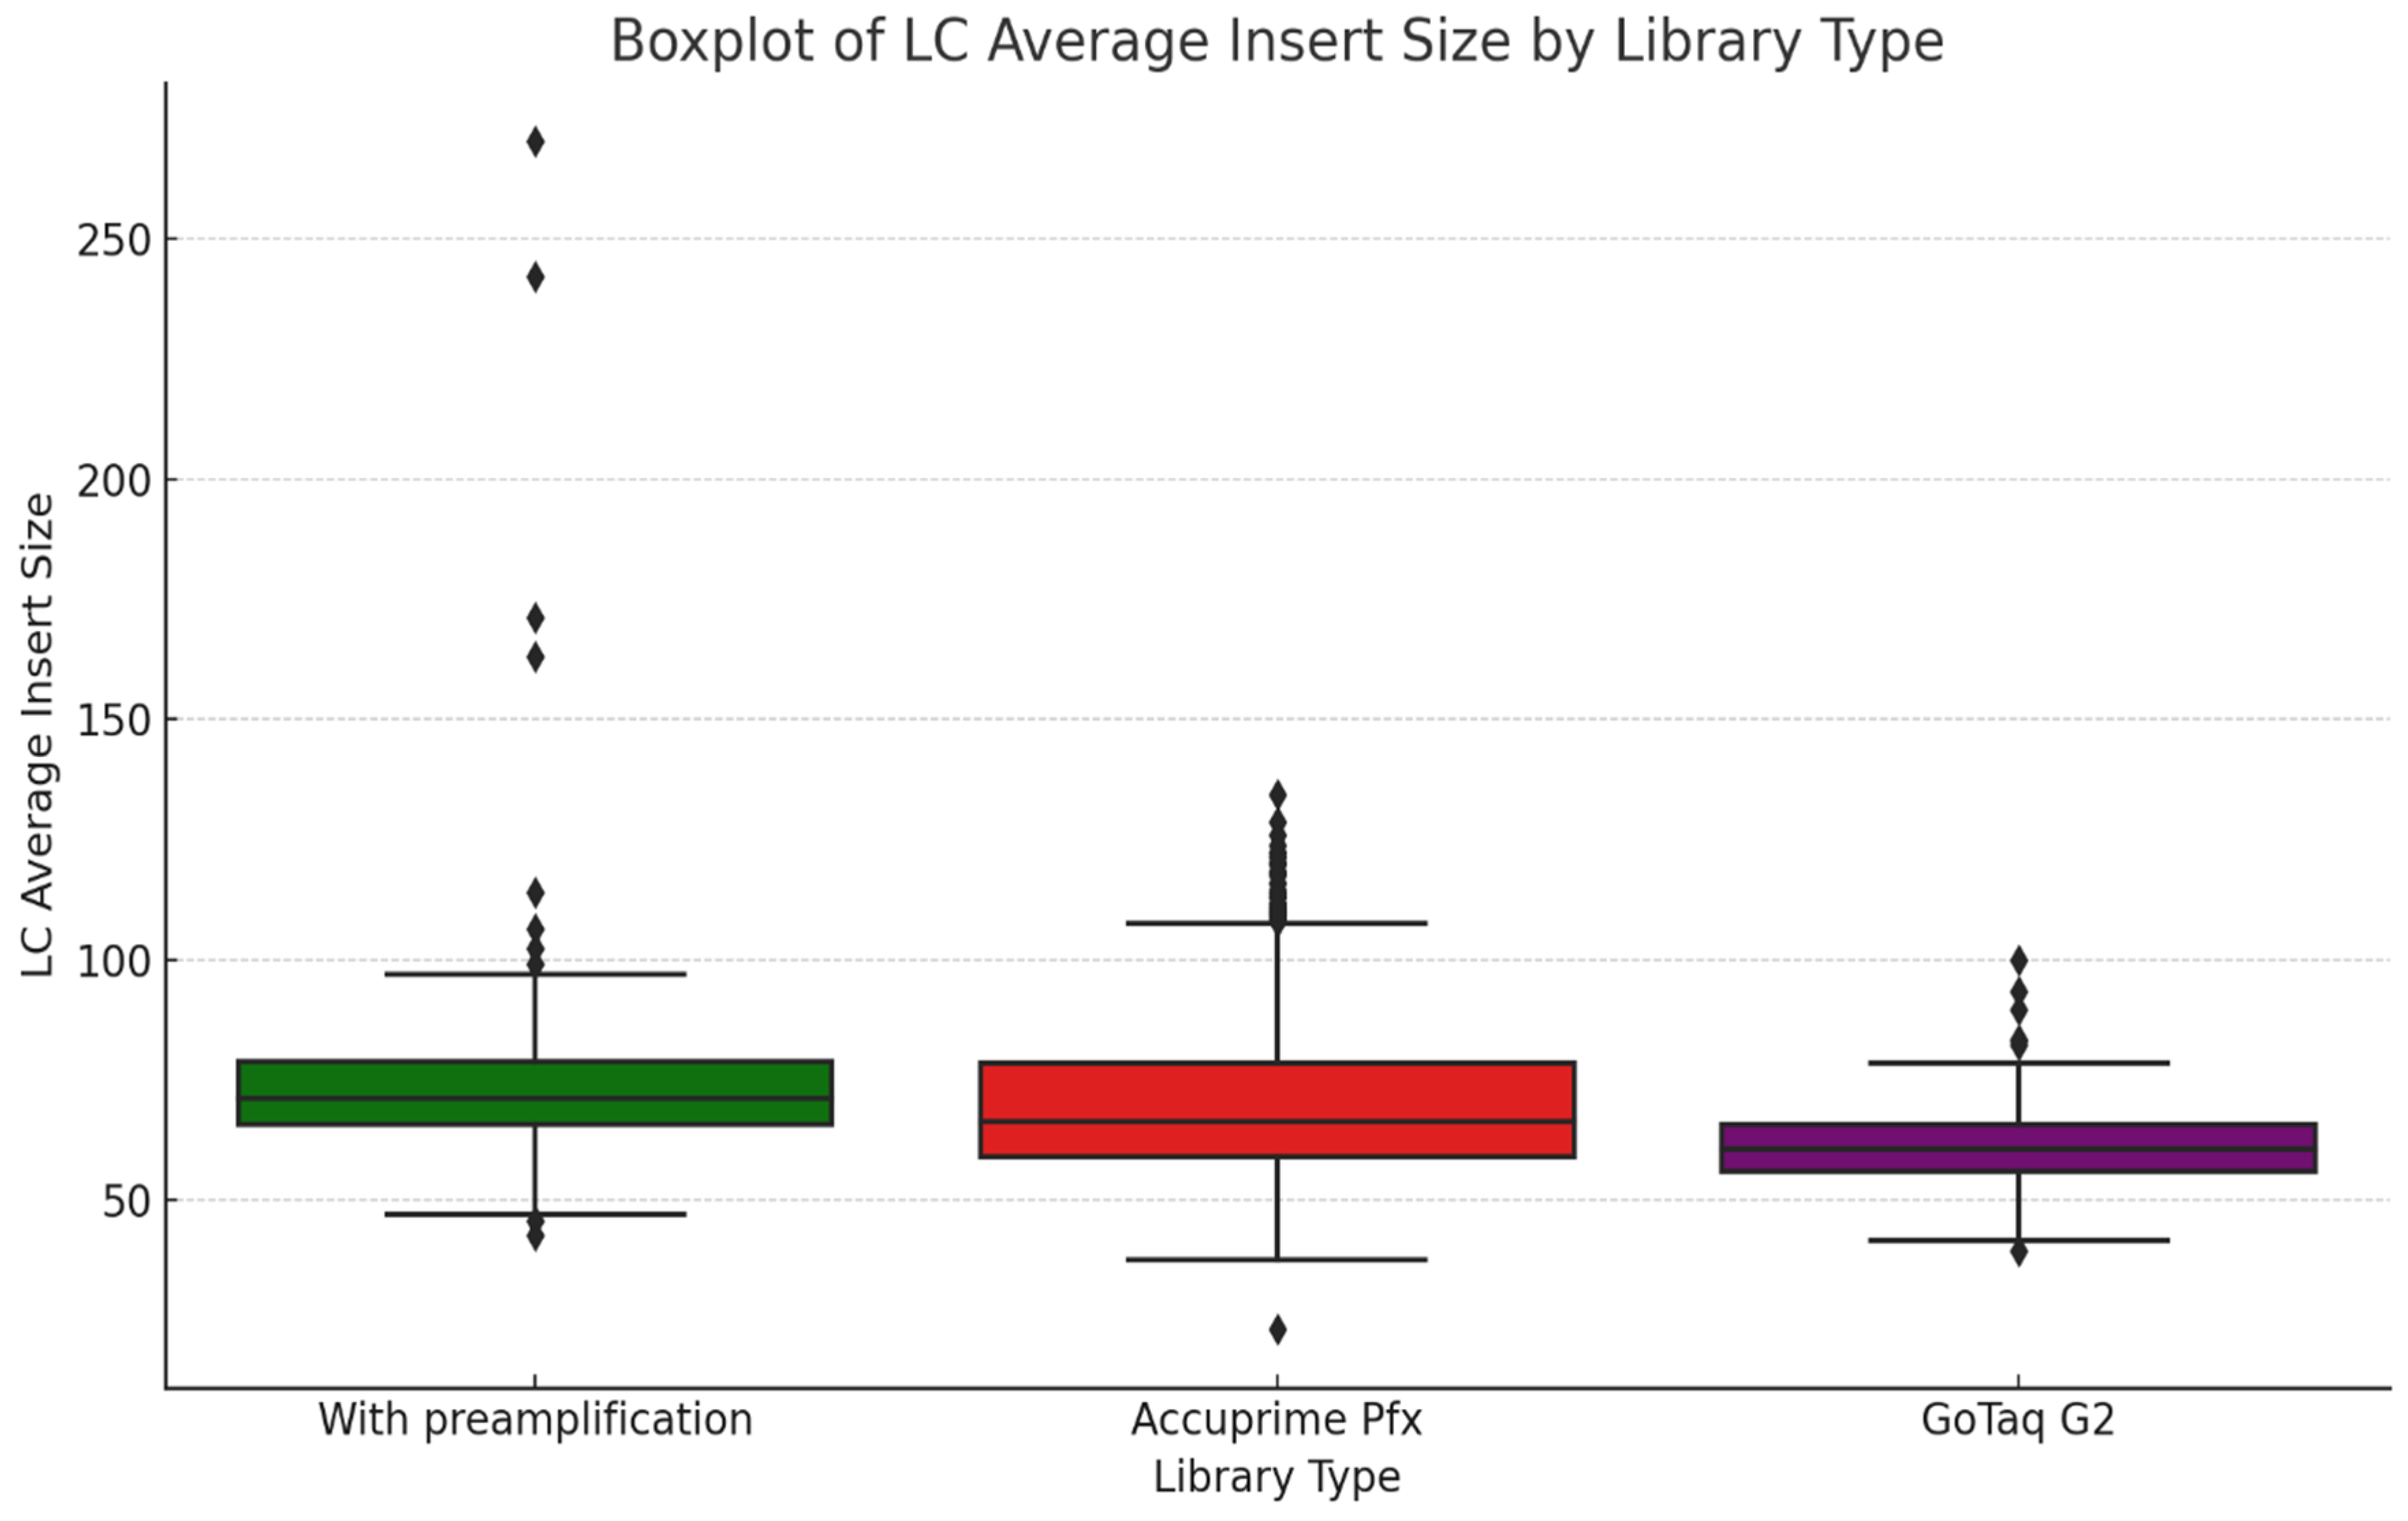
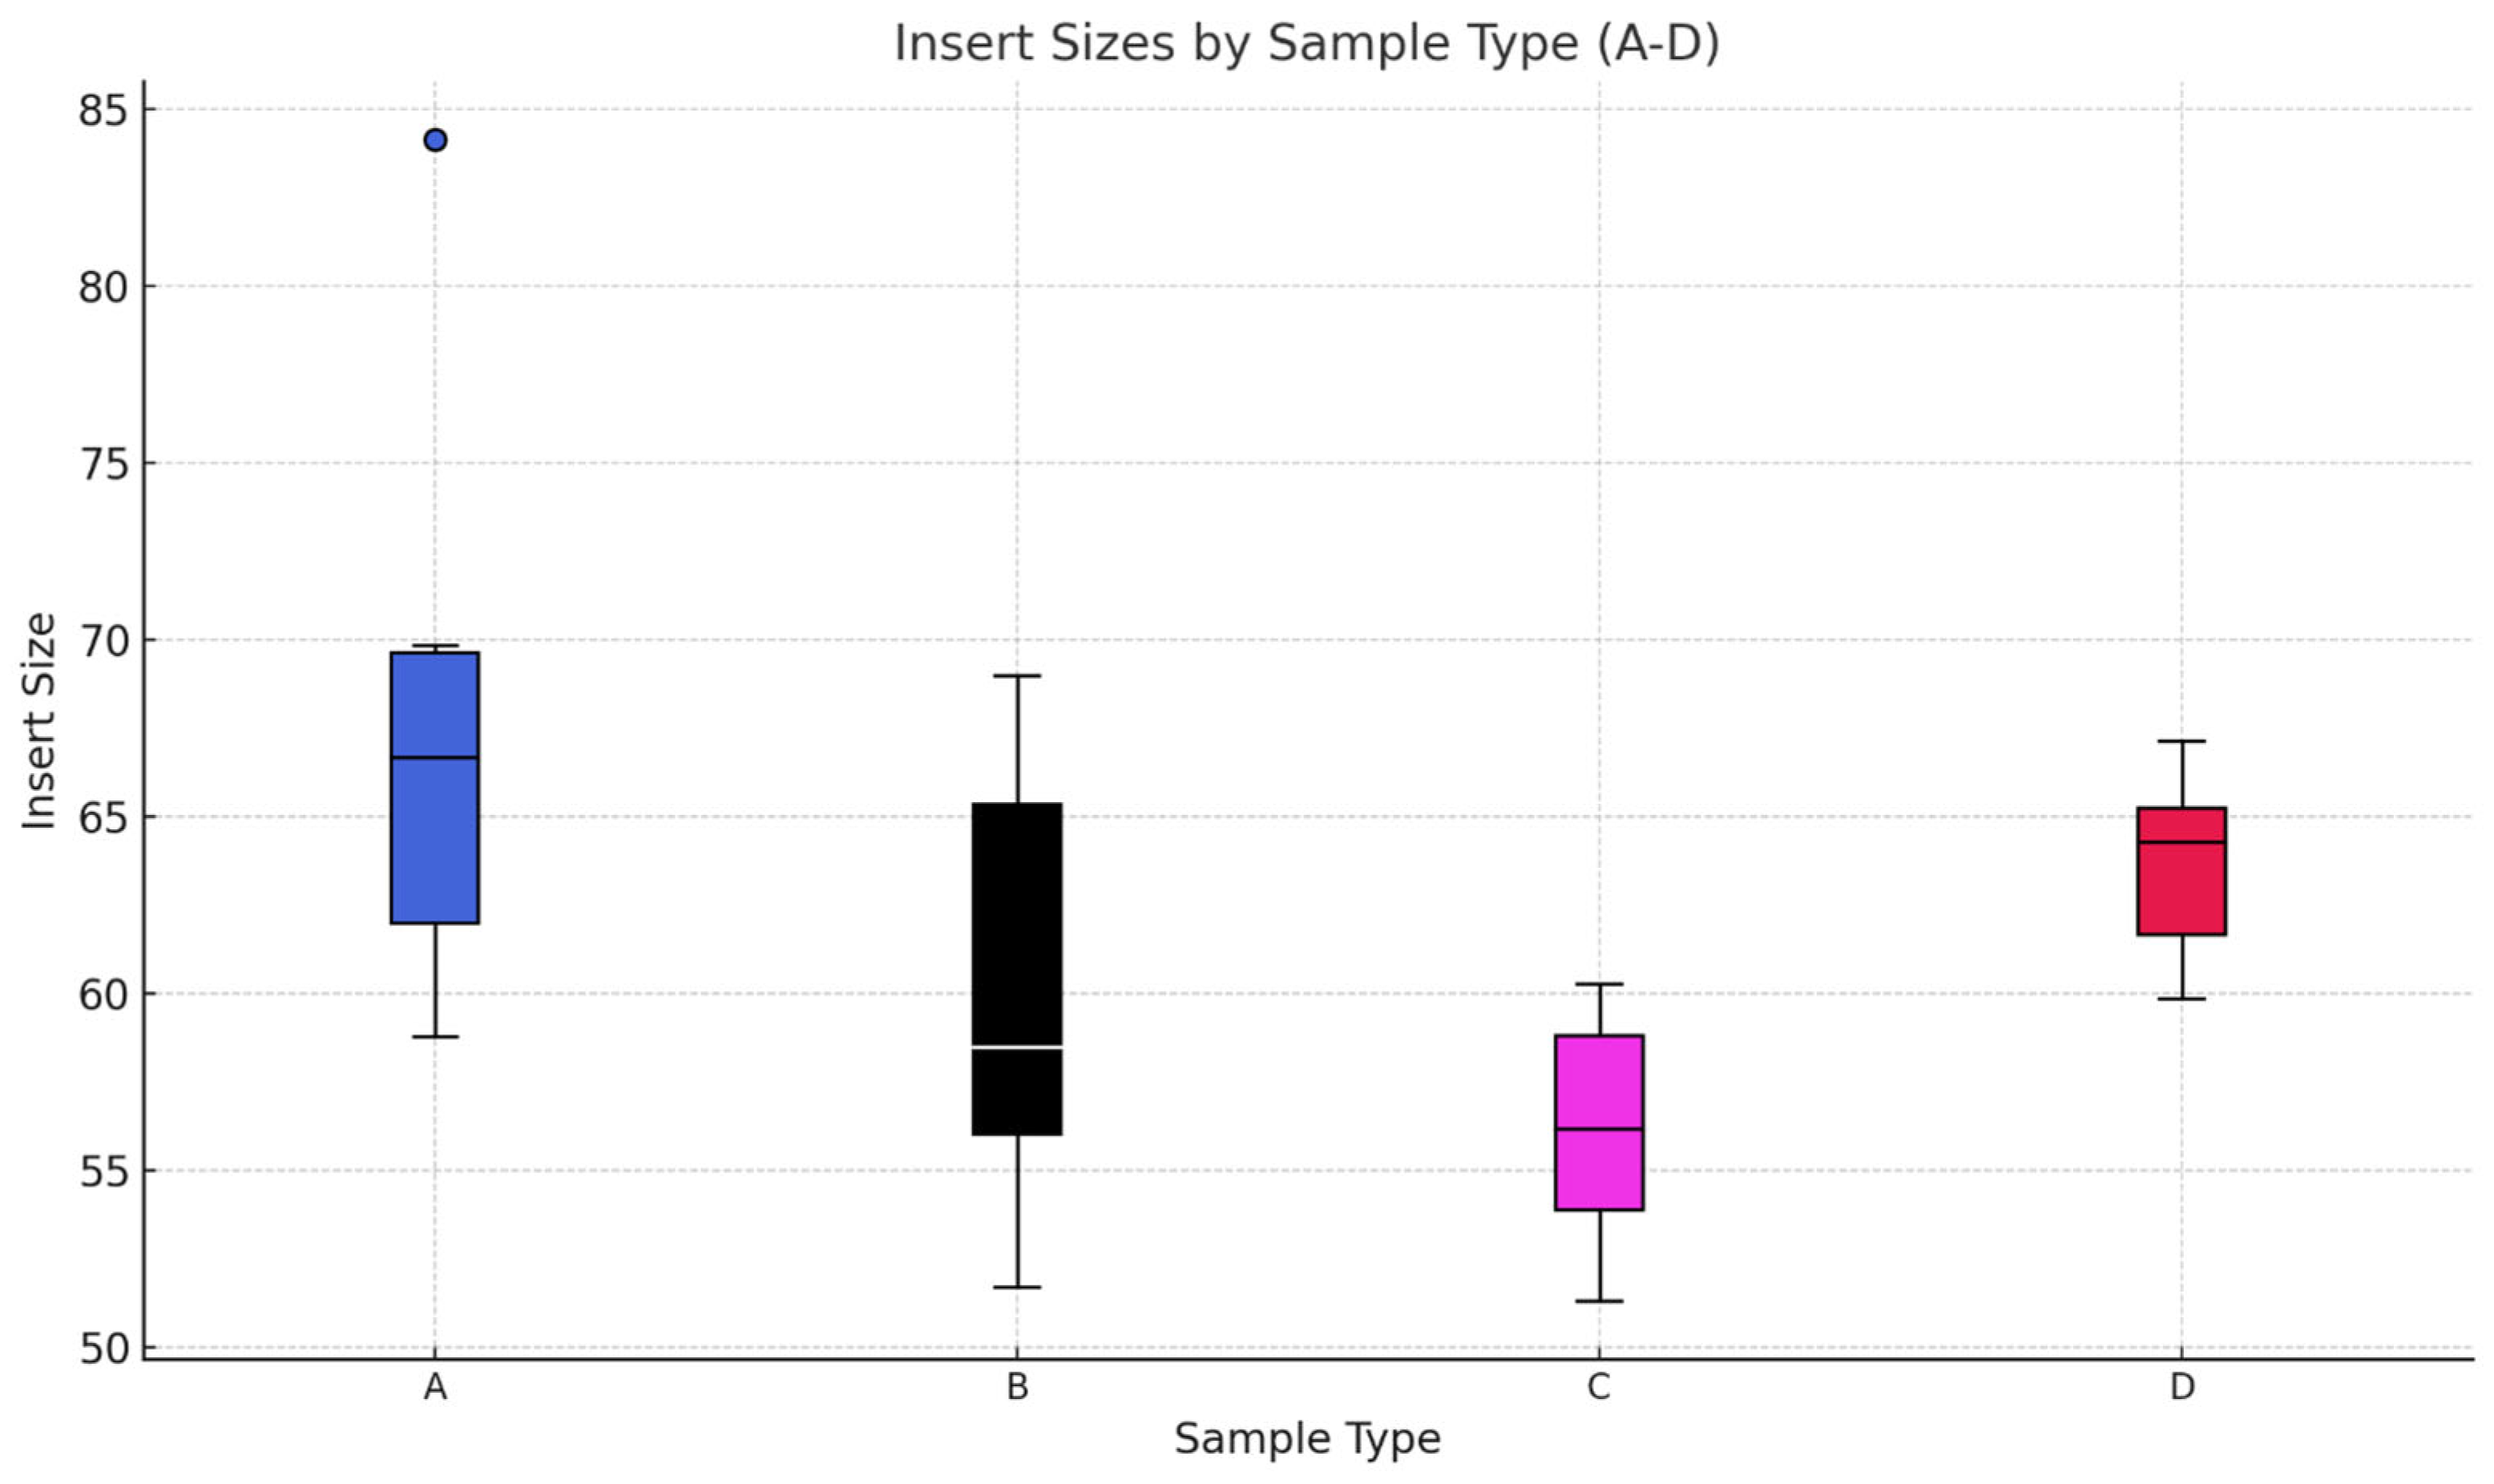
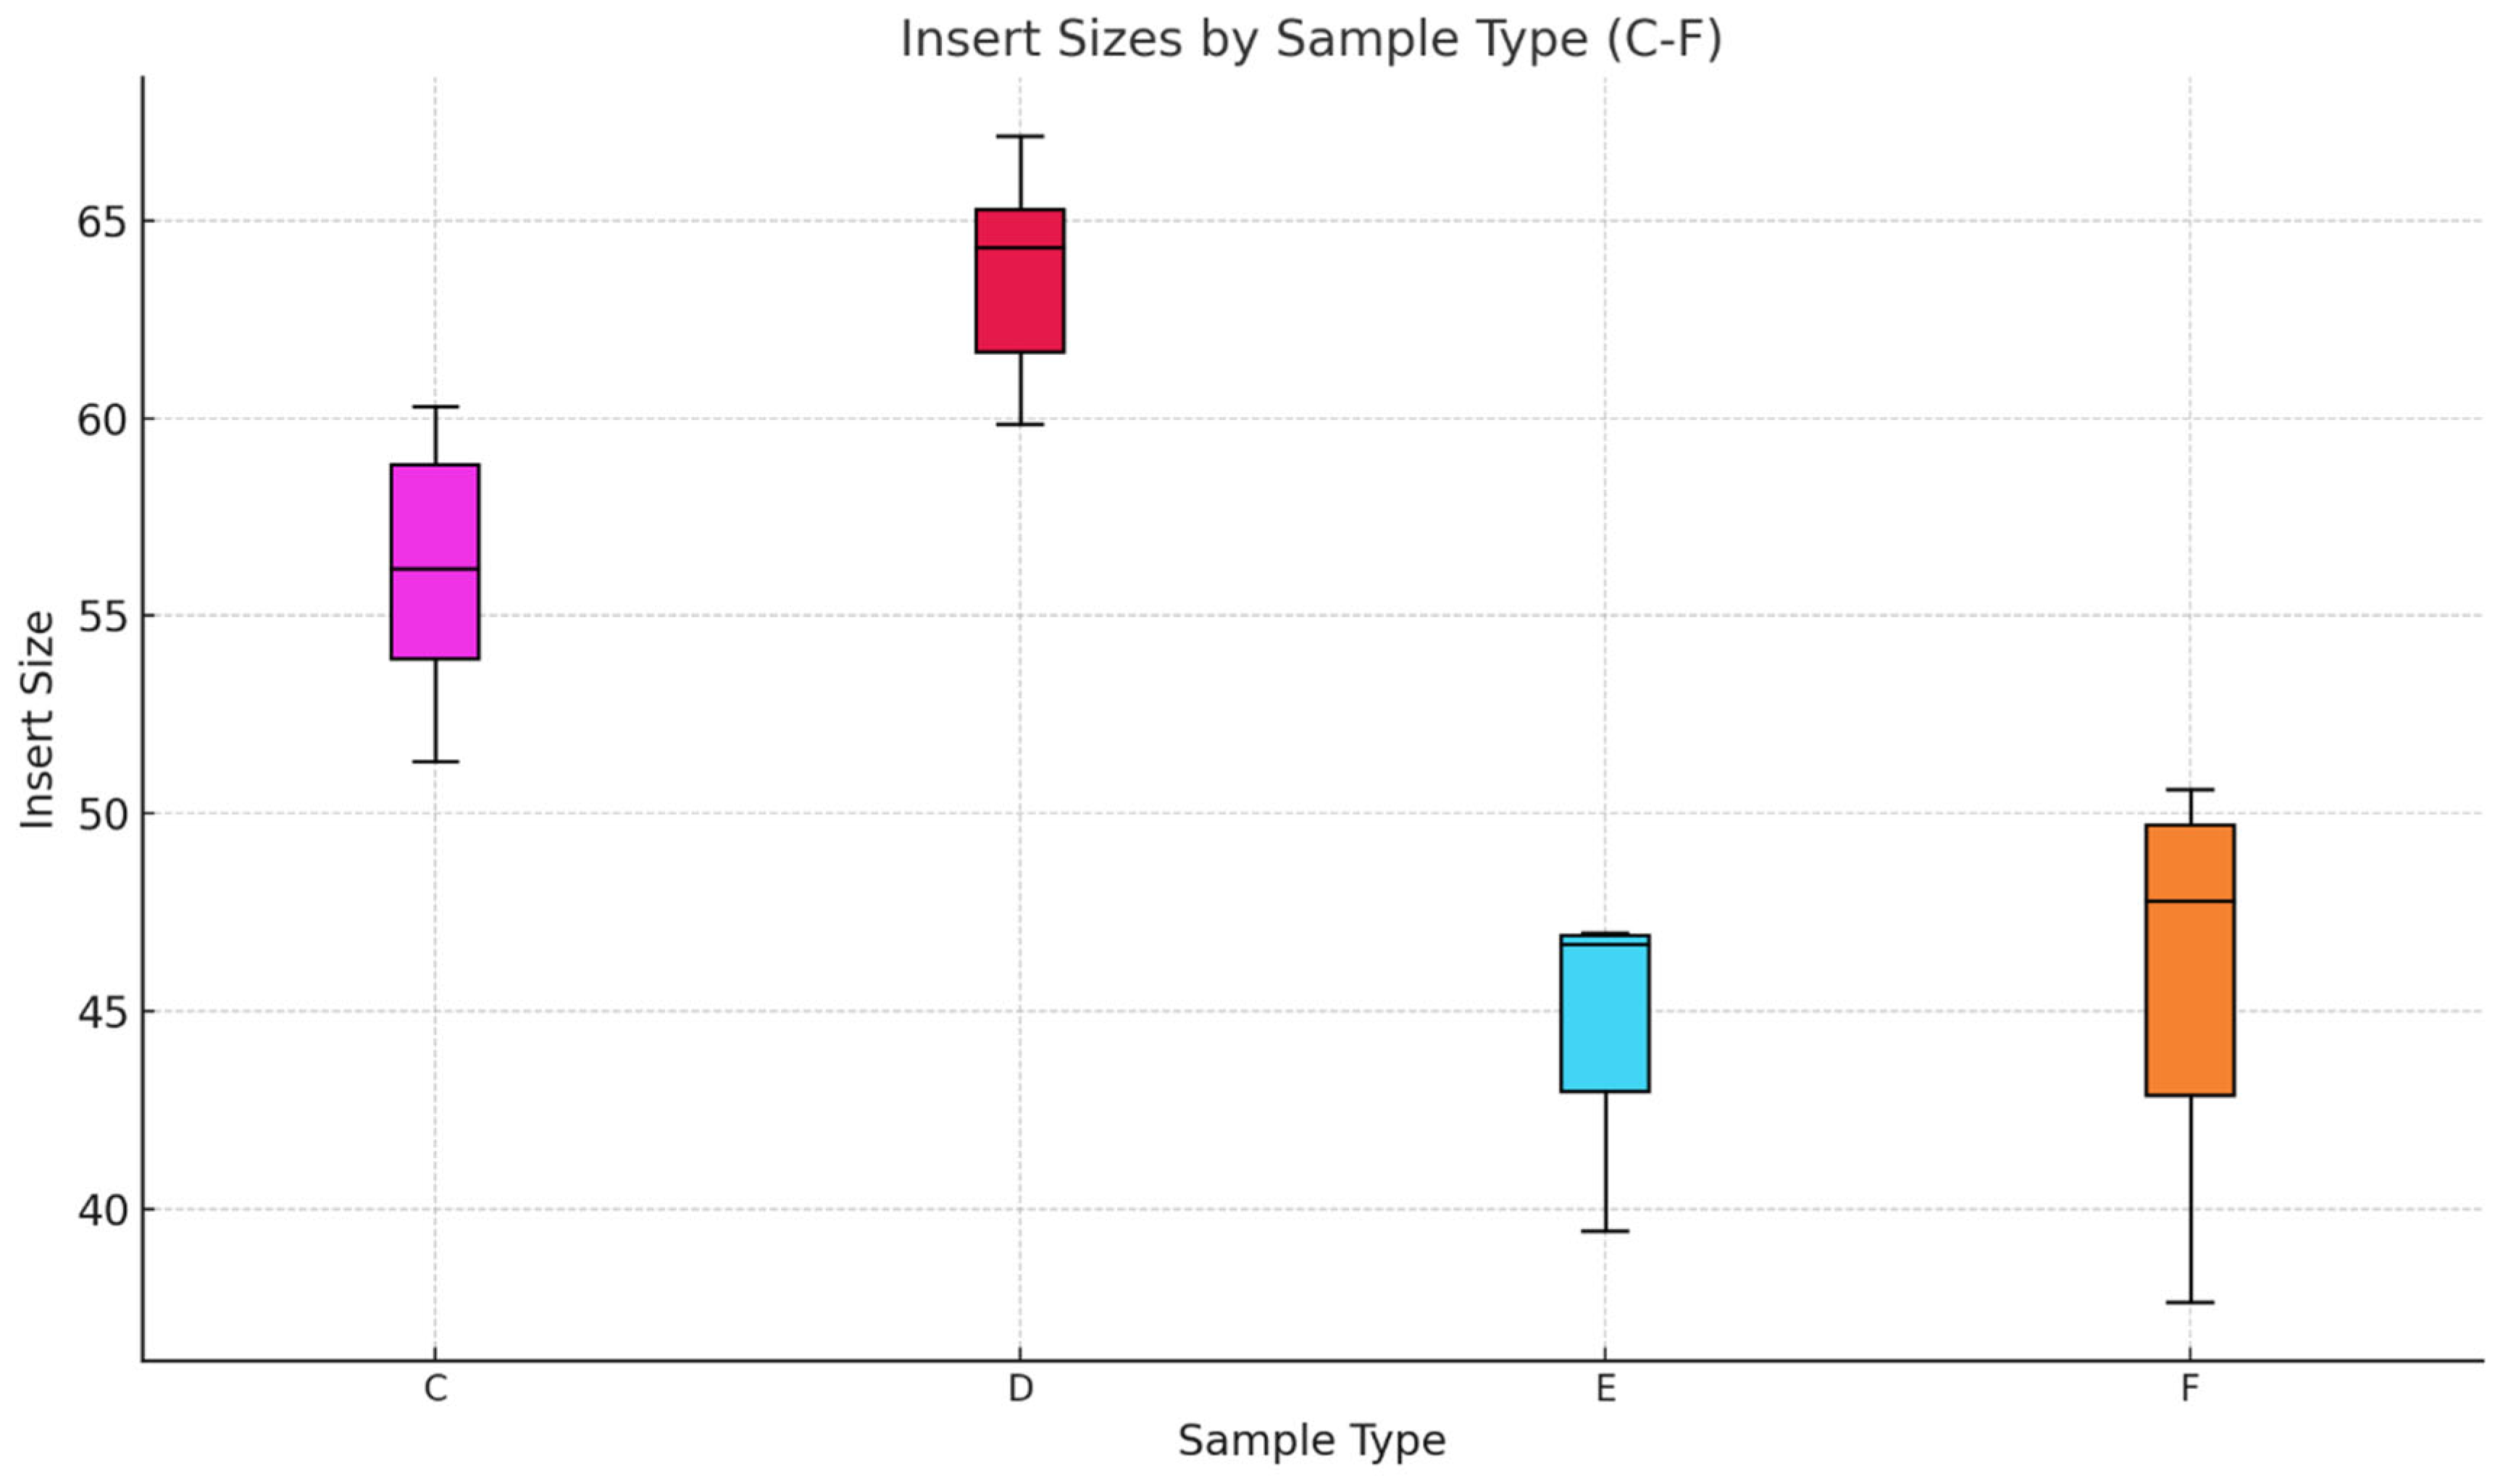
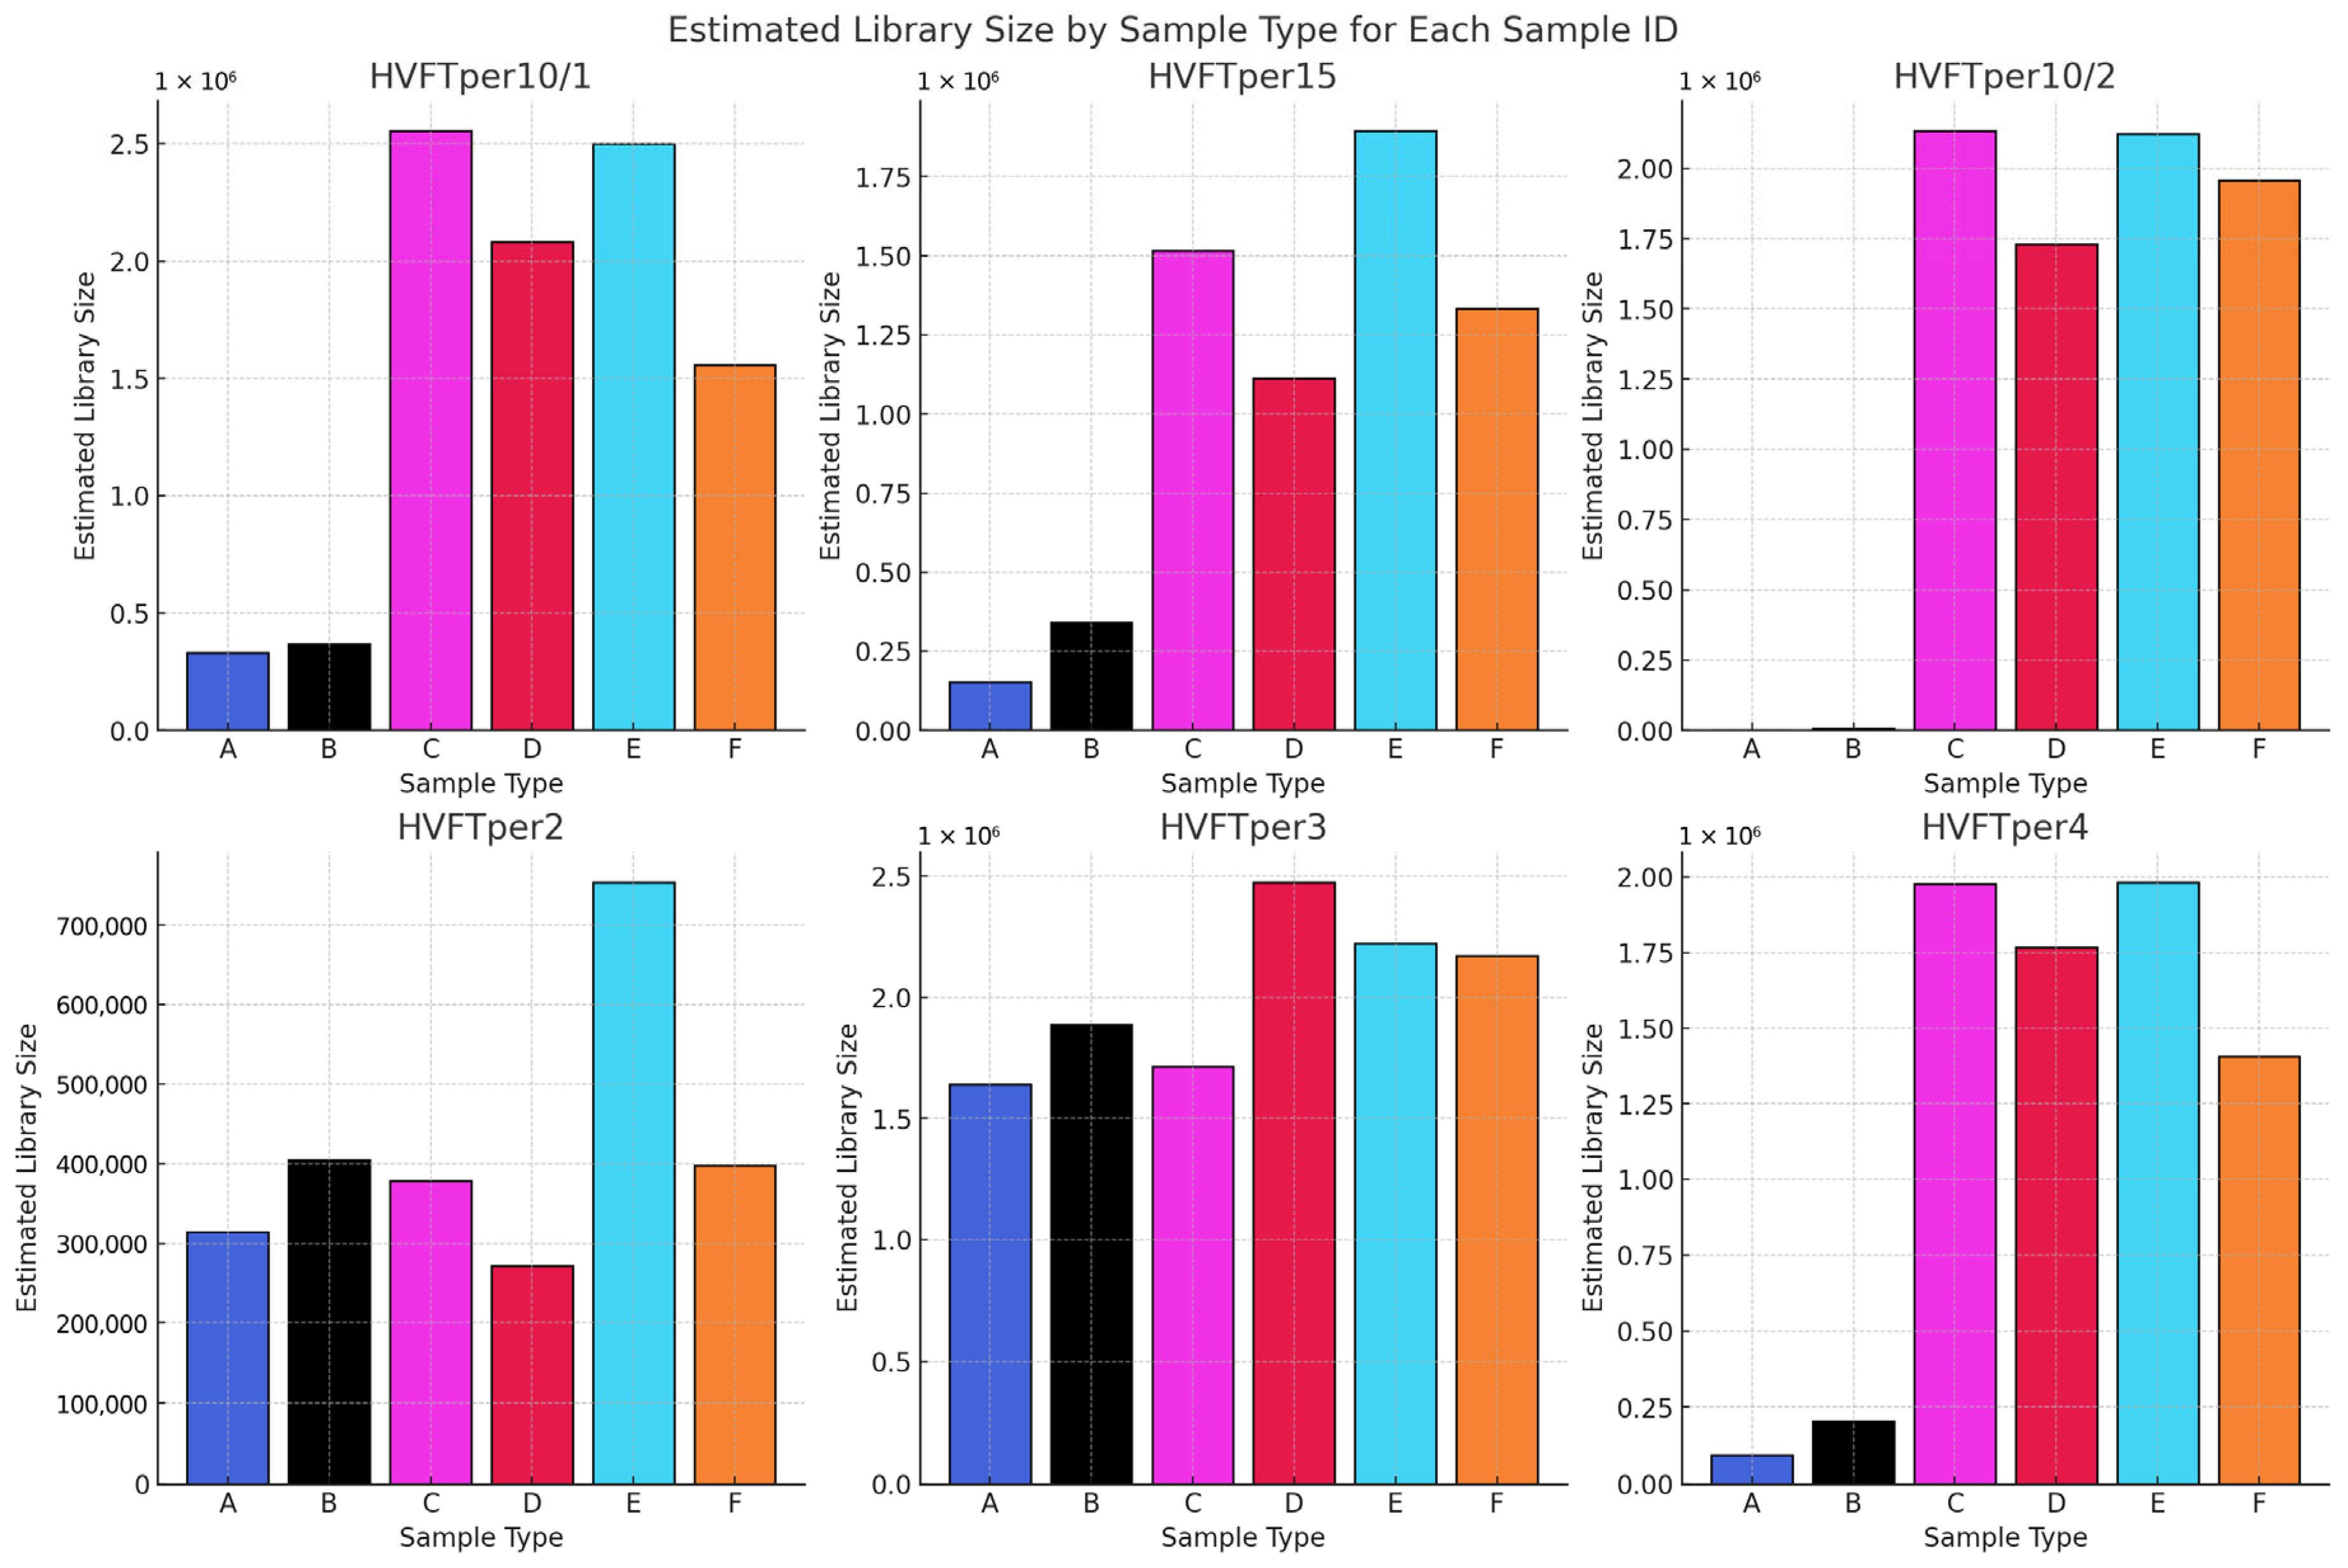
Phase two of the study suggests that AccuPrime Pfx and GoTaq G2 polymerases perform similarly in the context of ancient DNA workflow, offering comparable levels of efficiency and reliability. The choice of the sample source and the purification method, however, can impact the success and result of the downstream analysis. Pars petrosa’s consistently higher yield compared to teeth suggests its superior preservation potential for aDNA. Furthermore, the MinElute purification method proved to recover longer DNA fragments compared to the handmade silica methods, which purify shorter DNA fragments.
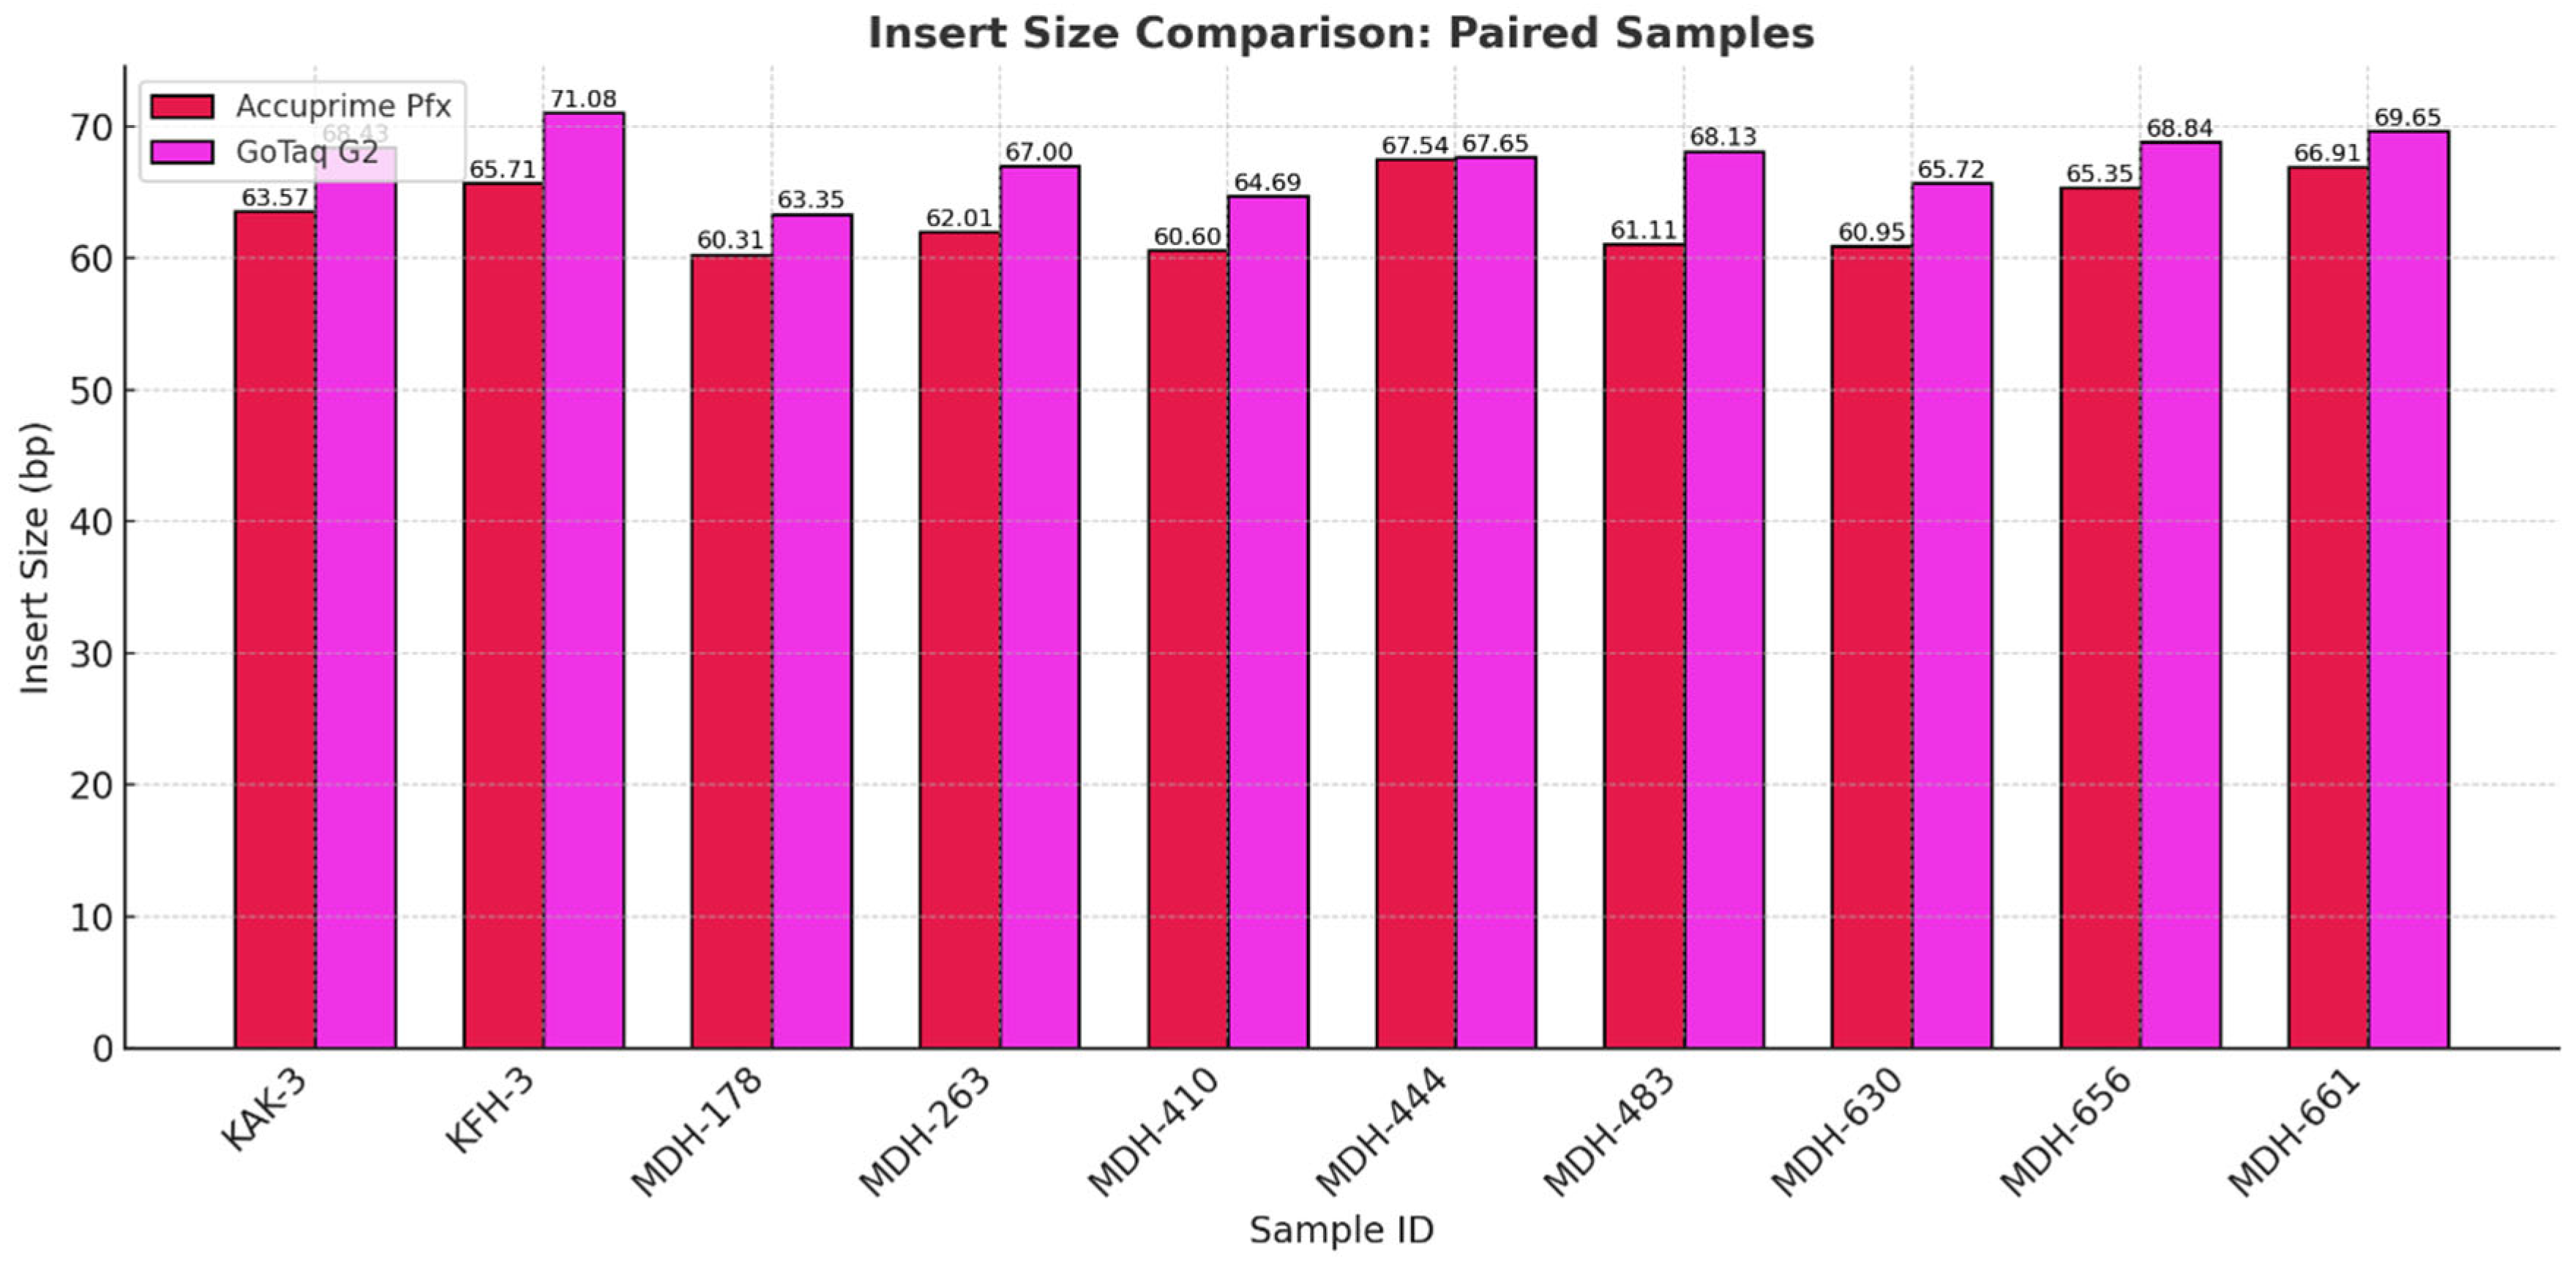
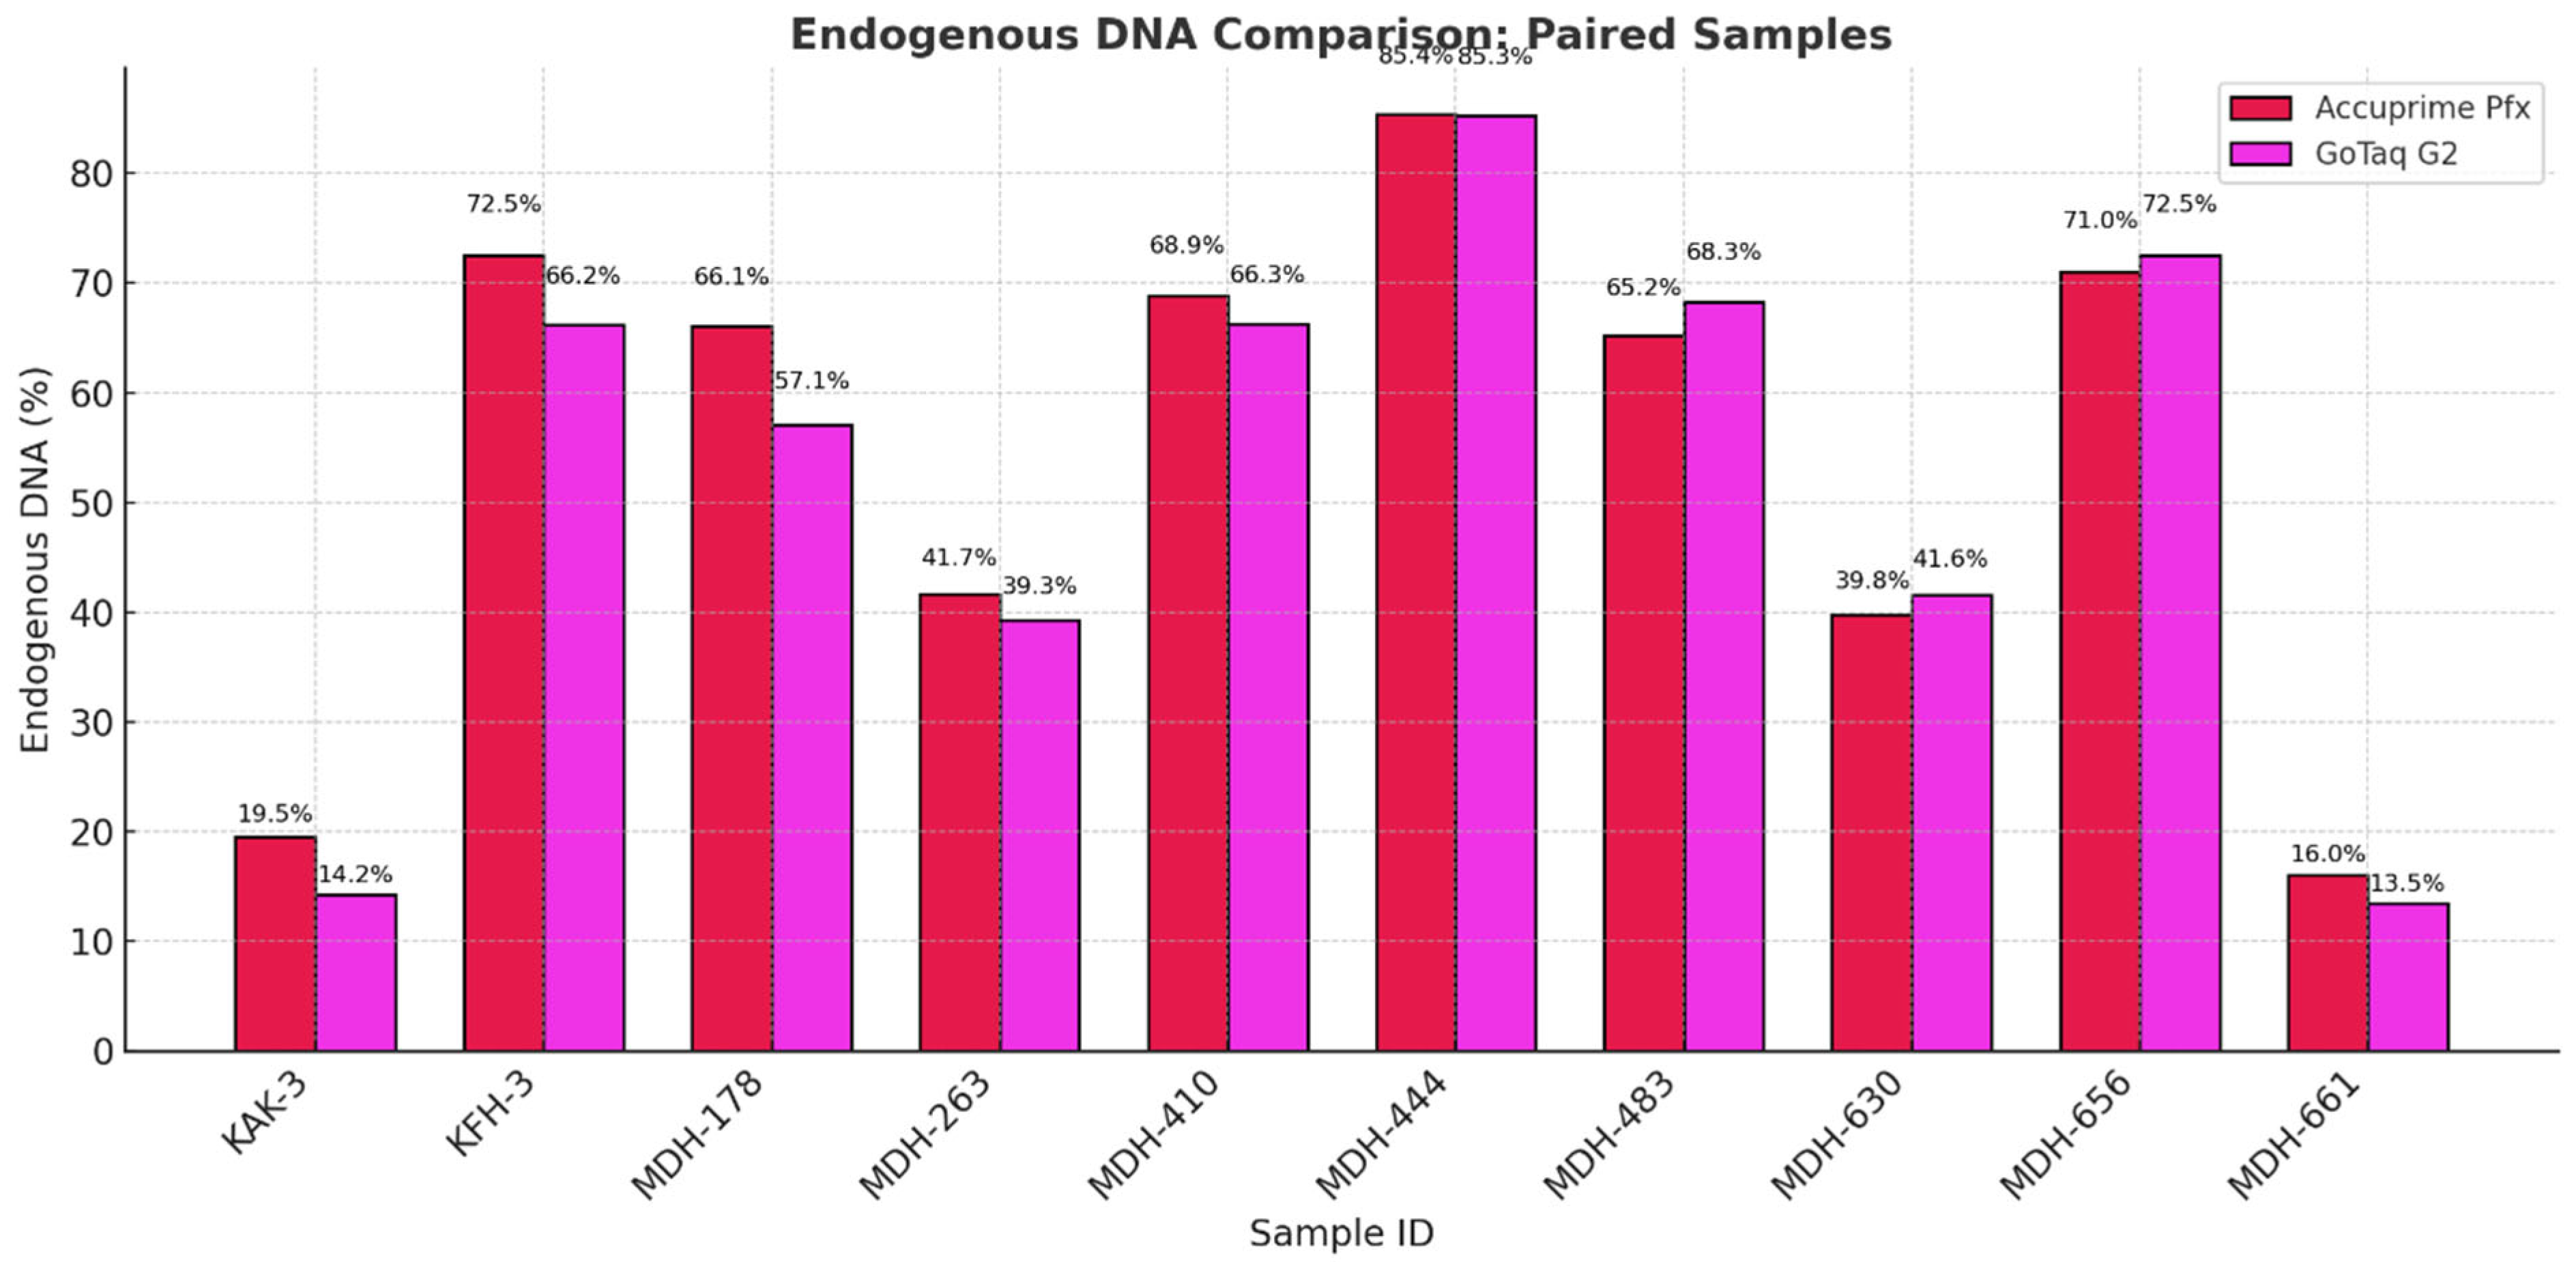
In the last phase of the study, the performance of AccuPrime Pfx and GoTaq G2 polymerases was investigated, focusing on their relative efficiency and cost-effectiveness in aDNA workflows. Both enzymes resulted in a similar endogenous DNA recovery with minor differences in their fragment length distribution. AccuPrime Pfx generated slightly shorter and more consistent fragments, while GoTaq G2 produced slightly larger ones. Given the significant cost difference of these two enzymes, GoTaq G2 offers an economical alternative for routine studies without compromising performance. AccuPrime Pfx remains valuable for projects demanding higher precision where ancient samples are degraded or limited. The choice between the two depends on the project’s budget and specific requirements.


 ,
, 


