Abstract
Background/Objectives: Ancient DNA (aDNA) research workflows heavily depend on efficient aDNA extraction and NGS library preparation. In this study, we compared some of the commonly used laboratory protocols and compared the source of the bone material for sufficient and reliable results. Methods: We executed a three-phase study. First, we analyzed about 2000 previously processed archaic bone samples and conducted a comparative analysis. The second phase involved a controlled experiment of five ancient individuals, with internal control, to further investigate the efficiency of some of the methods. In the third phase, we made a comparison between the efficiency of two enzymes used for library preparation. Results: Samples made from Pars petrosa resulted in the highest yield of endogenous DNA and longer fragment sizes compared to tooth or skeletal samples. DNA extraction made by MinElute columns preserved slightly longer fragments than the handmade silica suspension. NGS libraries indexed using AccuPrime Pfx produced slightly more consistent insert sizes compared to GoTaq G2. Samples prepared with GoTaq G2 contained slightly more unique molecules. The duplication rates showed no significant impact from enzyme choice. Conclusions: Pars petrosa remains the most reliable source of aDNA, with the extraction method using MinElute columns. While AccuPrime Pfx ensures precise NGS library preparation, a more economical choice of the GoTaq G2 enzyme is a viable alternative for degraded archaic samples.
1. Introduction
Archaeogenetics is a rapidly growing and evolving field. Since the beginning of aDNA research, many protocols have been developed, ranging from sampling to sequencing. Groups working in this field must consider a variety of factors and options, such as where to collect bone samples, the best method for aDNA extraction, how to construct NGS libraries, and what data must be analyzed to assist with these decisions. Although the cost of NGS is rapidly decreasing, a carefully planned and executed wet-lab workflow is essential for maximizing the extraction of optimal sequence data. During the years, we processed and worked with thousands of samples in our laboratory and generated a great amount of data. From these data, we made conclusions reflecting on the quality of the sequencing to understand the different methodologies. Also, we compared some aDNA workflows in the field, regarding the source of the DNA, and what DNA extraction and NGS library preparation methods were used.
DNA from ancient remains can persist in bones for more than 100,000 years [1], making ancient aDNA a powerful tool for understanding our past. However, working with aDNA is extremely delicate due to the highly degraded nature of the samples, necessitating specialized laboratory environments and strict protocols to avoid contamination [2]. Given the limited availability and irreplaceable nature of ancient bone materials, it is essential to develop and compare protocols that maximize the recovery of authentic ancient DNA.
In the past, our laboratory worked with a great number of samples from multiple archaic periods. As technology progressed, we adapted new methods and gathered a great amount of information.
The primary goal of this study was to evaluate and compare various DNA extraction and NGS library preparation methods used in aDNA research. Specifically, we aimed to determine which method offers the best outcomes in terms of key metrics such as endogenous DNA content, average fragment size, or library complexity. These factors are critical for maximizing the quality and quantity of valuable genetic information extracted from highly degraded ancient samples [1,3].
Additionally, due to the complex nature of aDNA, specialized bioinformatic analyses are required to handle the data effectively [4]. We used Picard Tools software v1.113 [5] for estimating endogenous DNA content and library complexity from low-coverage shallow shotgun sequencing data and in some cases compared these results with high-coverage whole-genome sequencing of the same libraries. By identifying the most effective protocols for DNA extraction and NGS library preparation, as well as evaluating the accuracy of library complexity estimates from low-coverage data, this study aims to provide clear recommendations for researchers working with aDNA.
2. Materials and Methods
2.1. Archeological Sample Collection and Sample Preparation
The anthropological collection in the Department of Biological Anthropology, University of Szeged, Hungary, has bone samples from multiple historical periods, allowing us to precisely identify and resample these remains.
The Department of Genetics at the University of Szeged used bone powder or teeth from the studied samples in order to construct NGS sequencing libraries. Our aim was to collect bone samples with minimal obvious harm to the ancient materials. The bone powder was extracted from the petrous bone on the skull’s base. For tooth samples, incisors were utilized.
The samples were prepared in the specialized bone laboratory of The Department of Genetics at the University of Szeged. During the preparation we followed the strict rules of aDNA work in a separated space for each step [2]. After bringing every bone sample in the laboratory, we used sodium hypochlorite and ultra-pure water to clean the surfaces, and after that procedure, we applied a short, 2 times 30-min UV treatment on each side of the bone materials [6]. This way we could minimize the amount of unwanted external DNA.
2.2. DNA Extraction Workflow
Work on ancient DNA was done in the specialized clean room in the aDNA facilities of the Department of Genetics at the University of Szeged, Hungary.
Due to the characteristics of aDNA and the high risk of contamination, working with aDNA necessitates adherence to specific guidelines. The preamplification work is performed in a sterile laboratory (aDNA lab) that is as far away as possible from the post-PCR (molecular) lab [7].
As in any well-executed experiment, it is essential to monitor our work, which is why we established controls for each approach we employed. At each extraction step, we used negative control, containing only the reaction buffers. As we handled samples containing a substance, each procedure was carried out identically in the negative control. This way, if any DNA is detected in the negative control, we may rerun the experiment and trace the error back to its source.
In the case of tubular bone, DNA is extracted from the compact tissue, as osteocytes trapped between collagen fibers preserve DNA the best. Endogenous DNA is best preserved in the pars petrosa of the spongy bone, but the cementum layer of the tooth root is also a good source [8,9].
In the case of an intact skull, we employ a technique developed by [10] that involves drilling the petrous bone. This technique does not cause significant skull damage. If the skull has disintegrated and the pars petrosa is easily accessible, or if the pars petrosa is broken, we cut around the portion of the bone that corresponds to the inner ear.
To further refine the drilled or cut bone samples to create fine bone dust—which is a recommended step to help to solubilize the aDNA more effectively—we used the StarBeater (VWR®, Radnor, PA, USA, Beater Mixer Mill, Catalog #412-0167) at low speed to preserve aDNA integrity by minimizing heat generation.
To prepare the teeth samples, we wrapped the crown part in parafilm; this way, the majority of the extracted DNA came from the cementum of the root [11].
2.3. Predigesting the Bone Materials and Solubillizing the aDNA
To eliminate external contamination and increase the concentration of human endogenous DNA in our DNA samples, we predigested each one [12,13]. In the instance of bone powder, we began with 200 mg of finely ground petrous or tubular bone. In the case of tooth samples, we wrapped the crown section snugly and firmly with parafilm to maintain the crown’s integrity [11]. This way, the predigestion and extraction will not affect the surface of the tooth, and it can be returned and investigated later for anthropologists and archeologists.
In anEppendorf® ThermoMixer® F2.0 (Eppendorf, Hamburg, Germany, Catalog Number 5387000013), with the Eppendorf® ThermoTop attachment (Eppendorf, Germany, Catalog Number 5308000003), 1 mL of 0.5 M EDTA and 100 µg/mL of Proteinase-K were predigested at 48 °C for 30 min. After 1 min of centrifuging the samples at 13,000 rpm, the largely contaminated supernatant was carefully pipetted and discarded.
A 72-h long DNA solubilization was performed. In the case of silica suspension, DNA extraction in 1 mL of extraction buffer was performed, and for the QIAGEN MinElute column, we conducted a DNA cleaning method in 1.5 mL extraction buffer containing 0.45 M EDTA, 250 µg/mL Proteinase K, 1% Triton X-100, and 50 mM DTT. To prevent the evaporation of the solution, we wrapped it in Eppendorf tubes with parafilm. The samples were placed in an Eppendorf Thermomixer operating at 1500 rpm at a temperature of 48 °C.
2.4. Creating the Silica Suspension
To create the silica suspension, 2.4 g of silicon dioxide powder (Sigma-Aldrich (SIGALD), St. Louis, MO, USA, CAS No. 14808-80-7) was suspended in 20 mL of DNA-free water and then allowed to settle for one hour at room temperature in the dark (silica is sensitive to light). Then, 19.5 mL of the supernatant was pipetted into a clean falcon tube, and the mixture was settled in the dark at room temperature for an additional four hours. An amount of 17 mL of the supernatant was pipetted and discarded. By doing this, we removed the silica particles that were too large or too small. We continued working with the 2.5 mL of sediment that remained. After adjusting the pH of the suspension with 24 µL of 30% hydrochloric acid, 850 µL of the suspension was measured and stored in the dark at room temperature until use.
2.5. DNA Extraction with Silica Suspension
To the 1 mL of digested and solubilized DNA, 6 mL binding buffer (5.83 M GuHCl, 105 mM NaOAc, 46.8% isopropanol, 0.06% Tween-20, and 150 µL silica suspension) were added, and the pH was adjusted between 4 and 6 with HCl. After 3 h of room temperature binding, silica was pelleted and washed twice with 80% ethanol before DNA was eluted in 100 µL TE buffer. We measured the concentration of the extracted DNA with Invitrogen™ Qubit™ 3 Fluorometer (Thermo Fisher Scientific, Waltham, MA, USA, Catalog No. Q33216) using the Qubit™ dsDNA HS Assay Kit (Thermo Fisher Scientific, USA, Catalog number Q32851).
2.6. DNA Extraction with QIAGEN MinElute Columns
The digested DNA was cleaned according to the QIAGEN protocol. We employed a vacuum manifold system to avoid and reduce the possibility of contamination between the samples. Because the original column capacity was insufficient, we created a larger volume column in the lab using the QIAGEN MinElute column and medical-grade infusion accessories by attaching them using parafilm. The DNA was eluted using 50 µL of EB elution buffer. We measured the concentration of the extracted DNA with Qubit dsDNA HS Assay Kit.
2.7. NGS Library Construction
We handled the DNA extract in the same manner in order to facilitate an accurate comparison of the various NGS library construction techniques [14,15]. However, we did make crucial modifications to several important steps. Because of this, we were able to generate 6 NGS double-stranded, dual-indexed libraries from each individual bone sample, generating a total of 36 libraries in phase two of the study.
In the third phase of the study, we created 2 sets of libraries from 10 ancient individuals, generating a total of 20 libraries.
An amount of 30 µL of DNA extracts went through UDG (Uracil DNA glycosylase) treatment, as described in [16]. The treatment was performed with 1.8 µL USER® (1 U/µL, New England Biolabs, Ipswich, MA, USA, Catalog number M5505S) enzyme in a mixture of 6 ul Buffer Tango (10×), 0.24 µL dNTPs (25 mM each), and 0.6 µL of ATP (100 mM) in a final volume of 60 µL with 21.36 µL of gamma ray treated Milli-Q ultra-pure H2O added. The reaction was incubated at 37 °C for 30 min and 40 °C lid temperature in PCR machine.
To stop the reaction, 1.8 µL UGI (Uracil Glycosylase Inhibitor, 2 U/µL NEB) was added to the reaction, and the samples were incubated further at 37 °C for 30 min and 40 °C lid temperature in PCR machine.
As the next step, we performed blunt-end repair by adding 3 µL of T4 polynucleotide kinase (10 U/μL) and 1.2 µL of T4 DNA polymerase-t (5 U/μL) to each sample and incubated them in a PCR machine for 25 °C for 15 min, then 12 °C for 5 min, and cooled them down to 4 °C.
To clean the prepared samples, we used QIAGEN MinElute columns using the protocol provided by the manufacturer. For the final elution step, we used 20 µL of EB prewarmed to 55 °C.
2.8. Optional Preamplification
This is an optional step in which the libraries are amplified with a low-cycle PCR reaction prior to indexing so that sufficient quantities are preserved for potential future studies. In the reaction, we employ universal primers that bind to the adapters and a polymerase enzyme that can also transcribe the remaining uracils in the molecules. Only libraries prepared prior to this study with the KAPA HiFi enzyme utilized this step.
The reaction mixture per sample contained 15 µL ddH2O, 15 µL GoTaq buffer (5×), 7.5 µL MgCl2 (25 mM), 7.5 µL dNTP mix (deoxynucleotide mix (dATP, dCTP, dGTP, and dTTP)) (2.5 mM each), 3.75 µL BSA (bovine serum albumin) (10 mg/mL), 0.375 µL G2GoTaq enzyme (5 U/µL), 4.5 µL IS7 (10 µM) and 4.5 µL IS8 (10 µM) primers, and 15 µL of DNA template, resulting in a final reaction volume of 75 µL per sample. This was then evenly distributed into three PCR tubes with 25 µL in each. The set program was as follows: 96 °C for 6 min, 94 °C for 30 s, 58 °C for 30 s, 72 °C for 30 s, 64 °C for 10 min, then hold at 4 °C. The three 30-s steps were repeated for 12 cycles.
The contents of the tubes containing identical samples were combined, and the samples were then purified on MinElute columns in the manner described previously. An amount of 25 µL of EB buffer was used to dissolve DNA. The concentration of the samples was then determined by using the Qubit dsDNA HS Assay Kit.
2.9. Adapter Ligation and Adapter Fill-In
Adapter ligation and adapter fill-in were executed as described in [17]. Starting from blunt-end DNA fragments, the adapters were ligated to the ends of the DNA molecules. The adapters are short oligonucleotides that contain priming sites for PCR amplification during indexing and binding to the sequencing flow cell. After ligation, an adapter fill-in reaction was carried out to complete the synthesis of the complementary strand across the adapter region.
2.10. Double Indexing with Different Enzymes
During this step, adapters with unique index combinations for each sample were attached to both ends of DNA fragments. Indexes are unique, known sequences of 7 nucleotides that allow us to identify and separate the DNA sequence readings of an individual during sequencing. The available indexes may be combined as desired; however, each sample to be sequenced must have a distinct index combination. Using a PCR reaction, the adapters containing the index are attached to the ends of the molecules. We used two different enzymes in this study: AccuPrime™ Pfx SuperMix (Thermo Fisher Scientific, Invitrogen™, USA, Catalog Number: 12344040) and GoTaq® G2 DNA Polymerase (Promega Corporation, USA, Catalog Number: M7841). We selected the two enzymes based on their relevance in aDNA research laboratory workflows. The high cost of AccuPrime Pfx can be a significant barrier for laboratories with limited resources, especially when processing large number of samples. To address this problem and to find a more accessible alternative, we tested GoTaq G2 DNA Polymerase, as it is a widely available and cost-effective enzyme. By directly comparing the two enzymes, we aimed to evaluate whether GoTaq G2 could serve as a reliable and economical substitute for AccuPrime Pfx in certain workflows.
2.11. Double Indexing by Using AccuPrime Pfx Supermix
AccuPrime Pfx is a DNA polymerase that is widely used in the field of archaeogenetics due to its high fidelity and proofreading activity. These properties ensure the precise amplification of aDNA fragments. AccuPrime Pfx is well established in the field for producing reliable results with highly degraded and limited amounts of ancient material [16,18].
We did not perform any preamplification prior to indexing the library after filling-in the adapters when utilizing this enzyme. In a PCR reaction, DNA molecules are amplified and marked with different indexes.
Per sample, the reaction mixture included 58.5 µL of AccuPrime Pfx Supermix, 3 µL of BSA (10 mg/mL), 1.5 µL P5, 1.5 µL P7 index (primer), and 10.5 µL of DNA template. The final volume per sample was 75 µL, which was evenly distributed among three PCR tubes and placed in the PCR machine. The PCR conditions were as follows: 95 °C for 5 min, 95 °C for 15 s, 60 °C for 30 s, 68 °C for 30 s, 68 °C for 5 min, and hold at 4 °C. Twelve cycles of the 15–30 s steps were performed. At the conclusion of the program, the 3 reactions with the same index combination were combined and then purified on MinElute columns using the above-described protocol. The elution was performed with 20 µL of EB buffer. We determined the concentration of the libraries using the above-described Qubit method and then froze them at −20 °C for future use.
2.12. Double Indexing by Using G2GO Taq Polimerase
GoTaq G2 lacks 3′→5′ exonuclease proofreading activity, making it a lower-fidelity enzyme compared to AccuPrime Pfx. It is a robust and commonly used enzyme in various molecular biology applications, including some aDNA workflows. By directly comparing the two enzymes, we aimed to evaluate whether GoTaq G2 could serve as a reliable and economical substitute for AccuPrime Pfx in certain workflows.
No preamplification took place in this case either; the indexing was executed right after the adapter fill-in.
The reaction mixture consisted of the following components per sample: 28.5 µL ddH2O, 20 µL GoTaq buffer (5×), 10 µL MgCl2 (25 mM), 10 µL dNTP mix (each 2.5 mM), 5 µL BSA (10 mg/mL), 0.5 µL G2GoTaq enzyme (5 U/µL), 6 µL P5 (10 µM), 6 µL P7 (10 µM) primers, and 14 µL DNA template. The final volume per sample was 100 µL, which was evenly distributed among four PCR tubes. The PCR protocol was as follows: 96 °C for 6 min, 94 °C for 30 s, 58 °C for 30 s, 72 °C for 30 s, 64 °C for 10 min, and hold at 4 °C. Twelve cycles of the three 30-s steps were performed. At the end of the program, the contents of the tubes containing identical samples were combined, and then the samples were purified on MinElute columns as described previously. An amount of 20 µL of EB buffer was used to elute the DNA. After measuring the concentration of the libraries using the Qubit method, as described previously, they were stored at −20 °C until further use.
2.13. Average Fragment Length Determination
Before sequencing the libraries, it is necessary to determine the fragment size distribution of the samples. To measure this, we used the Agilent Tapestation 4200 (Agilent Technologies, Santa Clara, CA, USA, Catalog Number: G2991BA) instrument, which can determine this information using high-sensitivity DNA screen tape. The significance of this lies in the fact that if the size distribution of the DNA fragments in a sample is determined, the DNA content in nM of the sample can be estimated, and the desired number of sequencing reads from the sample can be calculated.
We diluted 1 µL of DNA libraries with known concentrations already measured with Qubit to 1:10, to 1:100, and to 1:1000 so that their DNA concentration was 10–1000 pg/µL. Then, 2 µL of the diluted samples was transferred to an instrument-compatible plate into which 2 µL of fluorescent buffer had previously been measured. We vortexed the samples at 2000 rpm for one minute and then placed them in the machine, which performed the run independently and then determined the fragment distribution of the individual libraries.
2.14. Sequencing
In our laboratory, all samples were sequenced using the single-channel Illumina iSeq 100 sequencer (Illumina, Inc., San Diego, CA, USA, Catalog Number: 20021535) of the third generation. We performed shotgun sequencing, which provided us with information such as endogenous/exogenous DNA concentration and estimated library complexity, among others. The essence of shotgun sequencing is sequencing a large number of random genome fragments and then aligning them to the reference genome.
For sequencing, we utilized the Illumina-manufactured iSeq 100 i1 Reagent v2 single kit (Illumina, Inc. USA, Catalog Number: 20031371), which included a cartridge prefilled with the necessary running reagents and a flow cell. The flow cell was kept at 4 °C, while the cartridge was kept at −20 °C. They were brought to room temperature and left to stand for a day before use.
To determine the endogenous DNA content, all extracted sequence fragments are aligned to the human reference genome. The proportion of sequences that can be aligned gives the endogenous human DNA ratio, whereas the sequences that cannot be aligned are from an exogenous pollutant source.
The sample with the greatest endogenous content was sent to the NovaSeq6000 (Illumina, Inc., USA, Catalog Number: 20012850) device for high-coverage whole-genome sequencing.
First, the samples were diluted to 1 nM based on the Qubit concentration and the Tapestation-determined fragment distribution. To accomplish this, we utilized 1.5 µL of samples with a concentration equal to or greater than 100 ng/ µL and 3 µL of samples with a lower concentration. Then, 10 µL of each sample was weighed and placed in a single microcentrifuge tube, where it was thoroughly vortexed before being diluted with 84 µL ddH2O and 16 µL of pooled libraries. An amount of 20 µL of the diluted mixture was then sequenced.
The following parameters were entered into the machine’s programming: generate fastq module with index reads of 2, paired-end reads of 151, and a custom library preparation kit. In total, 150 nucleotides were read per cycle, for a total of 8 million paired-end reads during the run.
The remaining adapter parts were removed from the raw sequences using the Cut Adapt software, https://cutadapt.readthedocs.io/en/stable/, and the sequence reads were aligned to the human reference genome using the Burrows–Wheeler Aligner application. This allowed us to calculate the sample’s endogenous DNA content. Picard Tools was utilized to eliminate PCR duplicates and extract additional data in order to calculate library complexity.
2.15. NGS Library Complexity Estimation Using Picard Tools Software
With Picard Tools, it is possible to specify a quality metric that estimates the number of distinct molecules in the library, i.e., the library’s complexity [5]. In case of low complexity, the number of PCR duplicates increases significantly, resulting in a large number of identical reads from the sequencing reaction, while other parts of the genome will be underrepresented. Thus, the complexity value is a very useful metric, signifying the actual sequence information present in the library.
The estimation is based on the number of unique and duplicated reads. Poor quality and unpaired readings are filtered out and disregarded by the program. If the difference between two molecules is less than 3%, they are considered duplicates. Then, to refine the result, additional filters are applied to the data.
The calculation utilizes the Lander–Waterman equation:
C/X = 1 − exp(−N/X)
C = the number of unique reads examined (the number of unique fragments observed in read pairs—PCR and optical duplicates); X = the number of unique molecules in the library; N = the total number of read pairs—optical duplicates.
3. Results
3.1. Results—Phase One
We executed this study in multiple phases. First, we used the already existing data from the past from more than 2000 processed archaic bone material from multiple historical ages. Then, we analyzed these data focusing on key metrics such as library fragment sizes, endogenous DNA content, and library complexity.
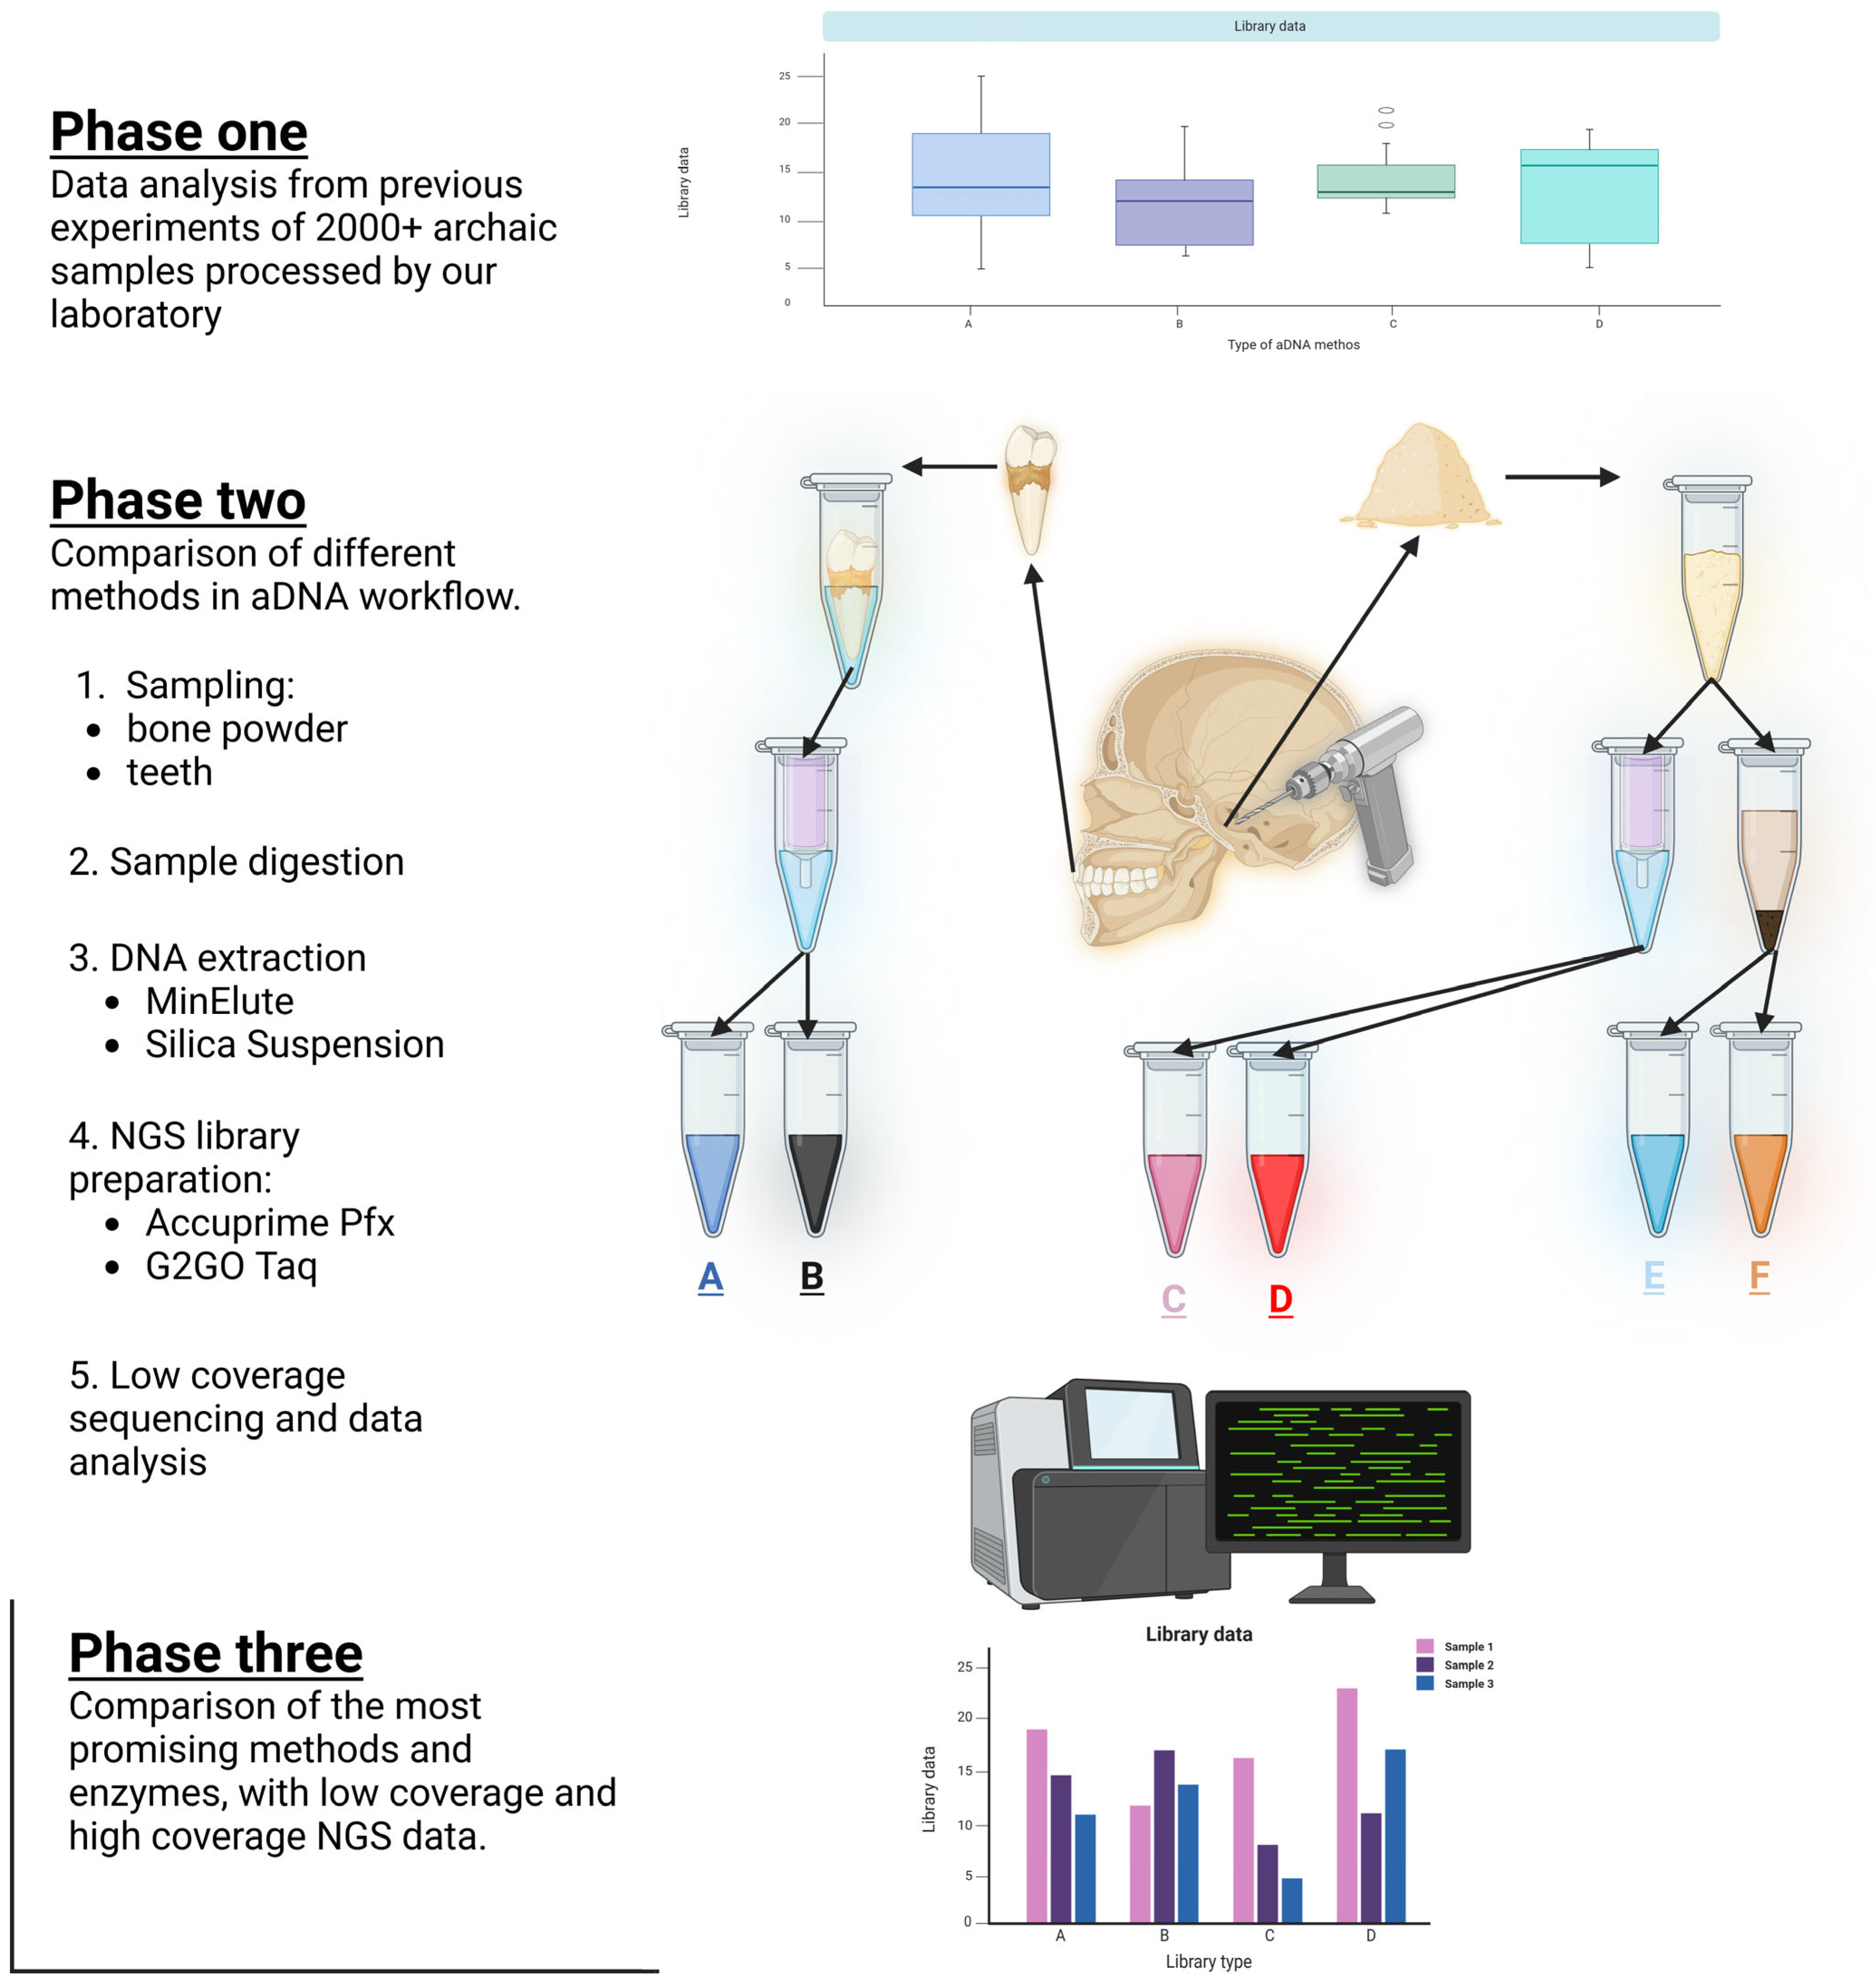
DNA was extracted from pars petrosa, teeth, or skeletal bone materials using either MinElute columns or silica powder suspension [19,20]. From the extractions, double-stranded NGS libraries were prepared according to [17] with or without preamplification [16], using G2GO Taq polymerase enzyme, and final library amplification was done with two different polymerases, as shown in Figure 1. To control contamination, we ran parallel negative controls in every experiment.
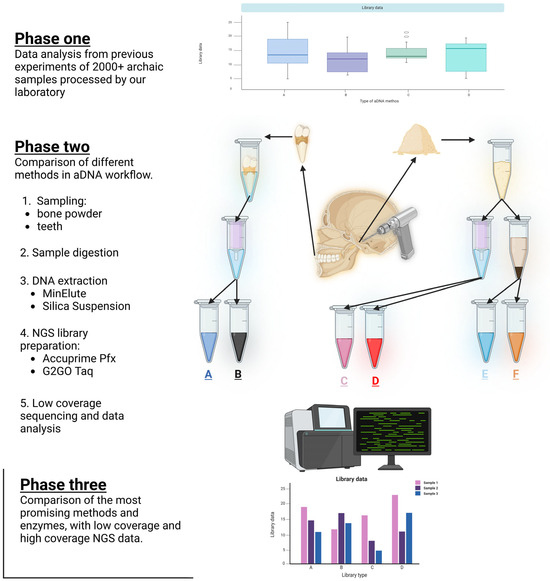
Figure 1.
A Schematic representation of the three phases of our study. Phase one: Data analysis of over 2000 ancient samples previously processed by our laboratory to evaluate existing methodologies. Phase two: Comparative analysis of various ancient DNA (aDNA) workflow steps, including sampling (bone powder and teeth), DNA extraction methods (MinElute and silica suspension), and NGS library preparation using AccuPrime Pfx and G2GO Taq enzymes, followed by low-coverage sequencing and data analysis. Phase three: Evaluation of the most promising methods and enzymes identified from phase two, incorporating both low-coverage and high-coverage sequencing data.
Detailed information about each sample that we processed can be found in the Supplementary Materials.
The sample quality is crucial information for drawing reliable conclusions from aDNA. In most research, low-coverage (LC) and high-coverage (HC) sequencing data have meaningful information about the degraded and fragmented aDNA samples [21]. Most of the time, LC data allow researchers to draw conclusions and predict the information of the HC data with smaller financial investment. This is why it is essential to validate whether the LC data can reliably reflect the HC data in certain metrics.
In Figure 2, we present an analysis focused on the ratio of endogenous DNA. Our findings support the use of LC data as a proxy for HC data. The ratio of endogenous DNA refers to the proportion of the sequencing reads that originate from human, rather than environmental contaminants. This metric is important, because in aDNA research, the amount of endogenous DNA can determine the further downstream analyses. A ratio of higher endogenous DNA indicates better preservation and can be an indicator of a more useful genetic information for analysis. In the case of endogenous DNA, we observed a strong correlation between the LC and HC data. This relationship shows that the LC data can reflect reliably on the endogenous content of a sample, and they can show the expected endogenous content for HC data.
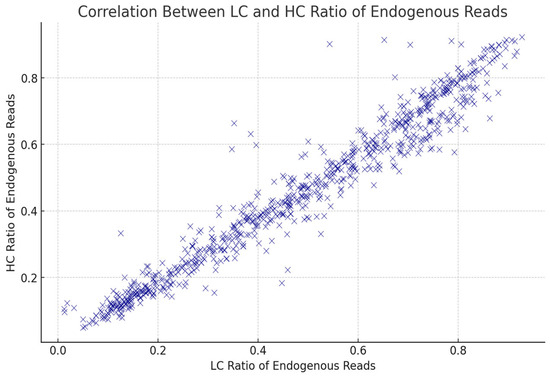
Figure 2.
Correlation between low-coverage (LC) and high-coverage (HC) ratios of endogenous reads across all analyzed samples. Each blue “×” represents an individual sample. The strong linear relationship indicates consistency between LC and HC sequencing results, validating the reliability of the LC ratio as a proxy for HC sequencing performance.
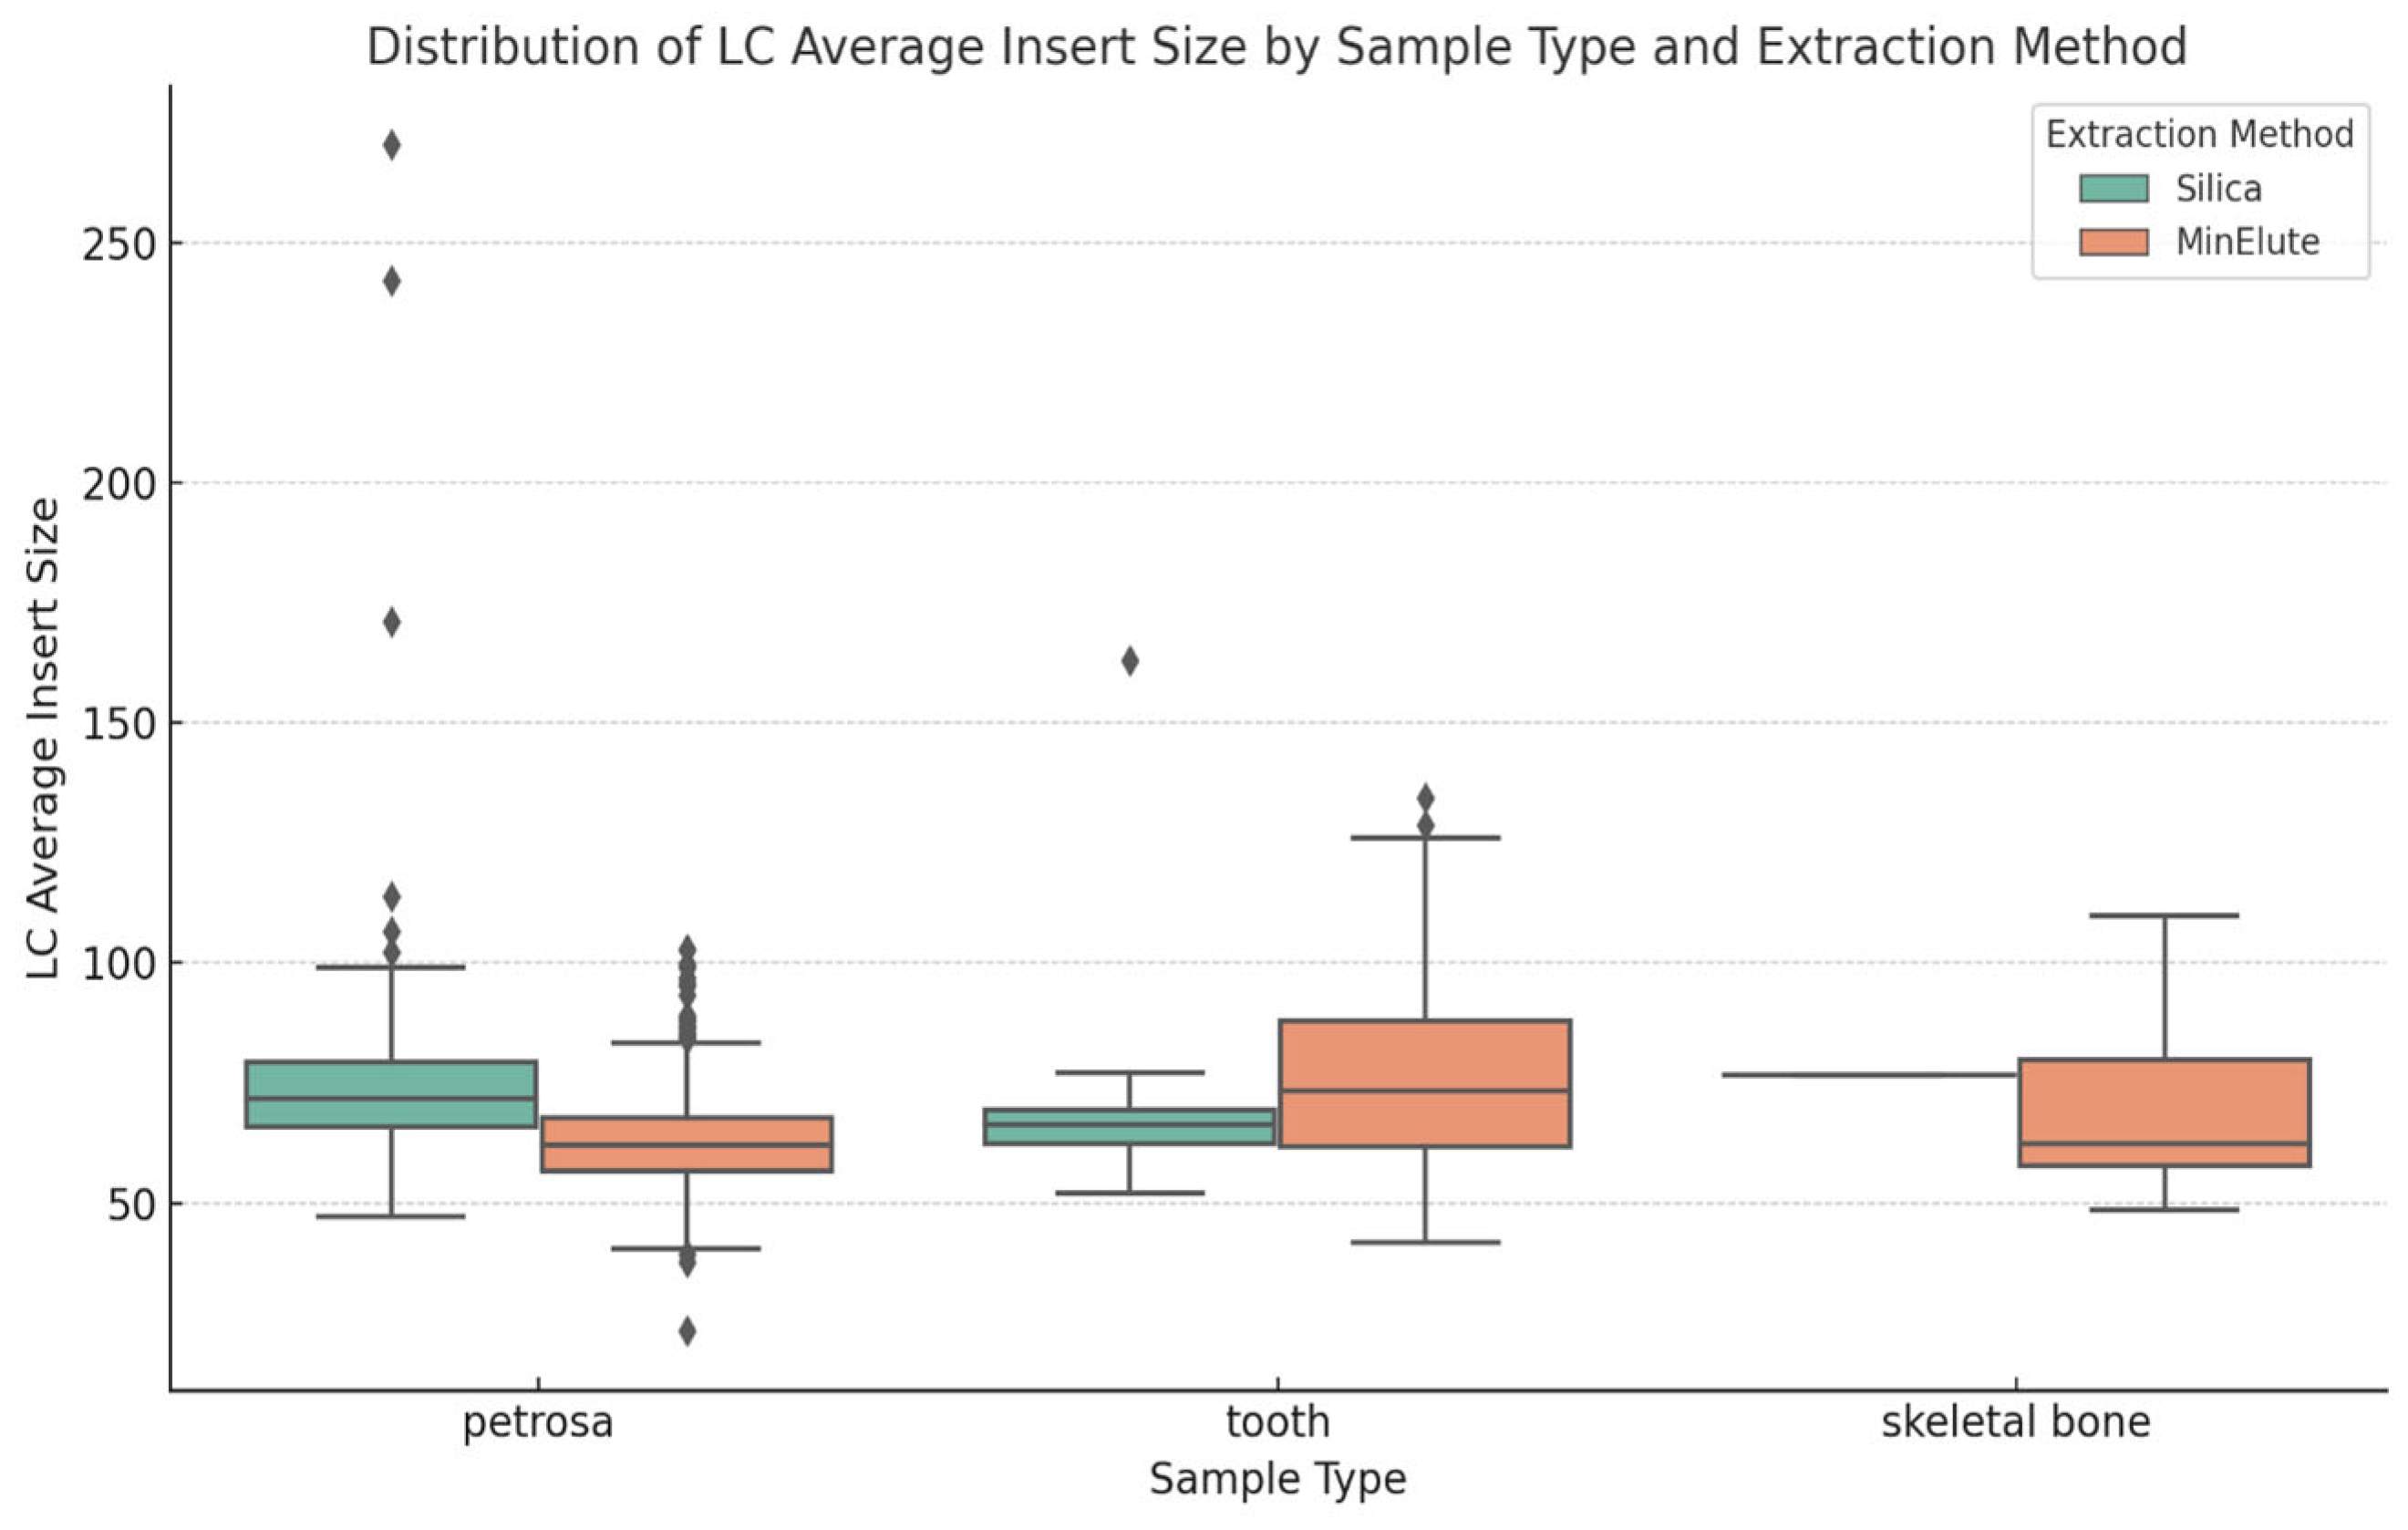
As seen in Figure 3, the average insert size as proxy for DNA fragment sizes showed no notable differences across the three sources of aDNA. Skeletal bone samples resulted in the smallest fragment sizes and the least variability, suggesting greater degradation relative to the other sources. The analysis also suggests that both of the methods are robust in their ability to recover degraded DNA fragments [22]. No significant differences were found in the average fragment size; therefore, researchers can select both methods based on other criteria, such as cost, availability, etc., without compromising aDNA recovery.
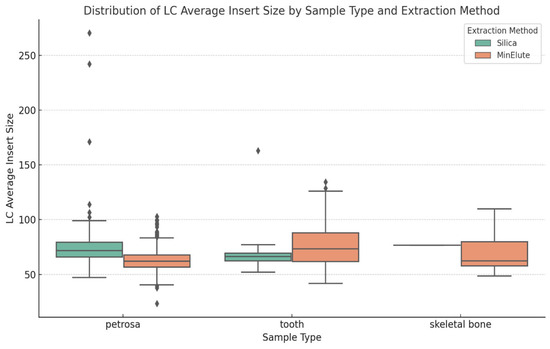
Figure 3.
Distribution of average insert sizes based on DNA source (petrosa, tooth, and skeletal bone) and DNA extraction method (silica and MinElute). The figure highlights the variability in insert sizes across different sample types and extraction methods. Diamond-shaped dots represent outliers in the dataset.
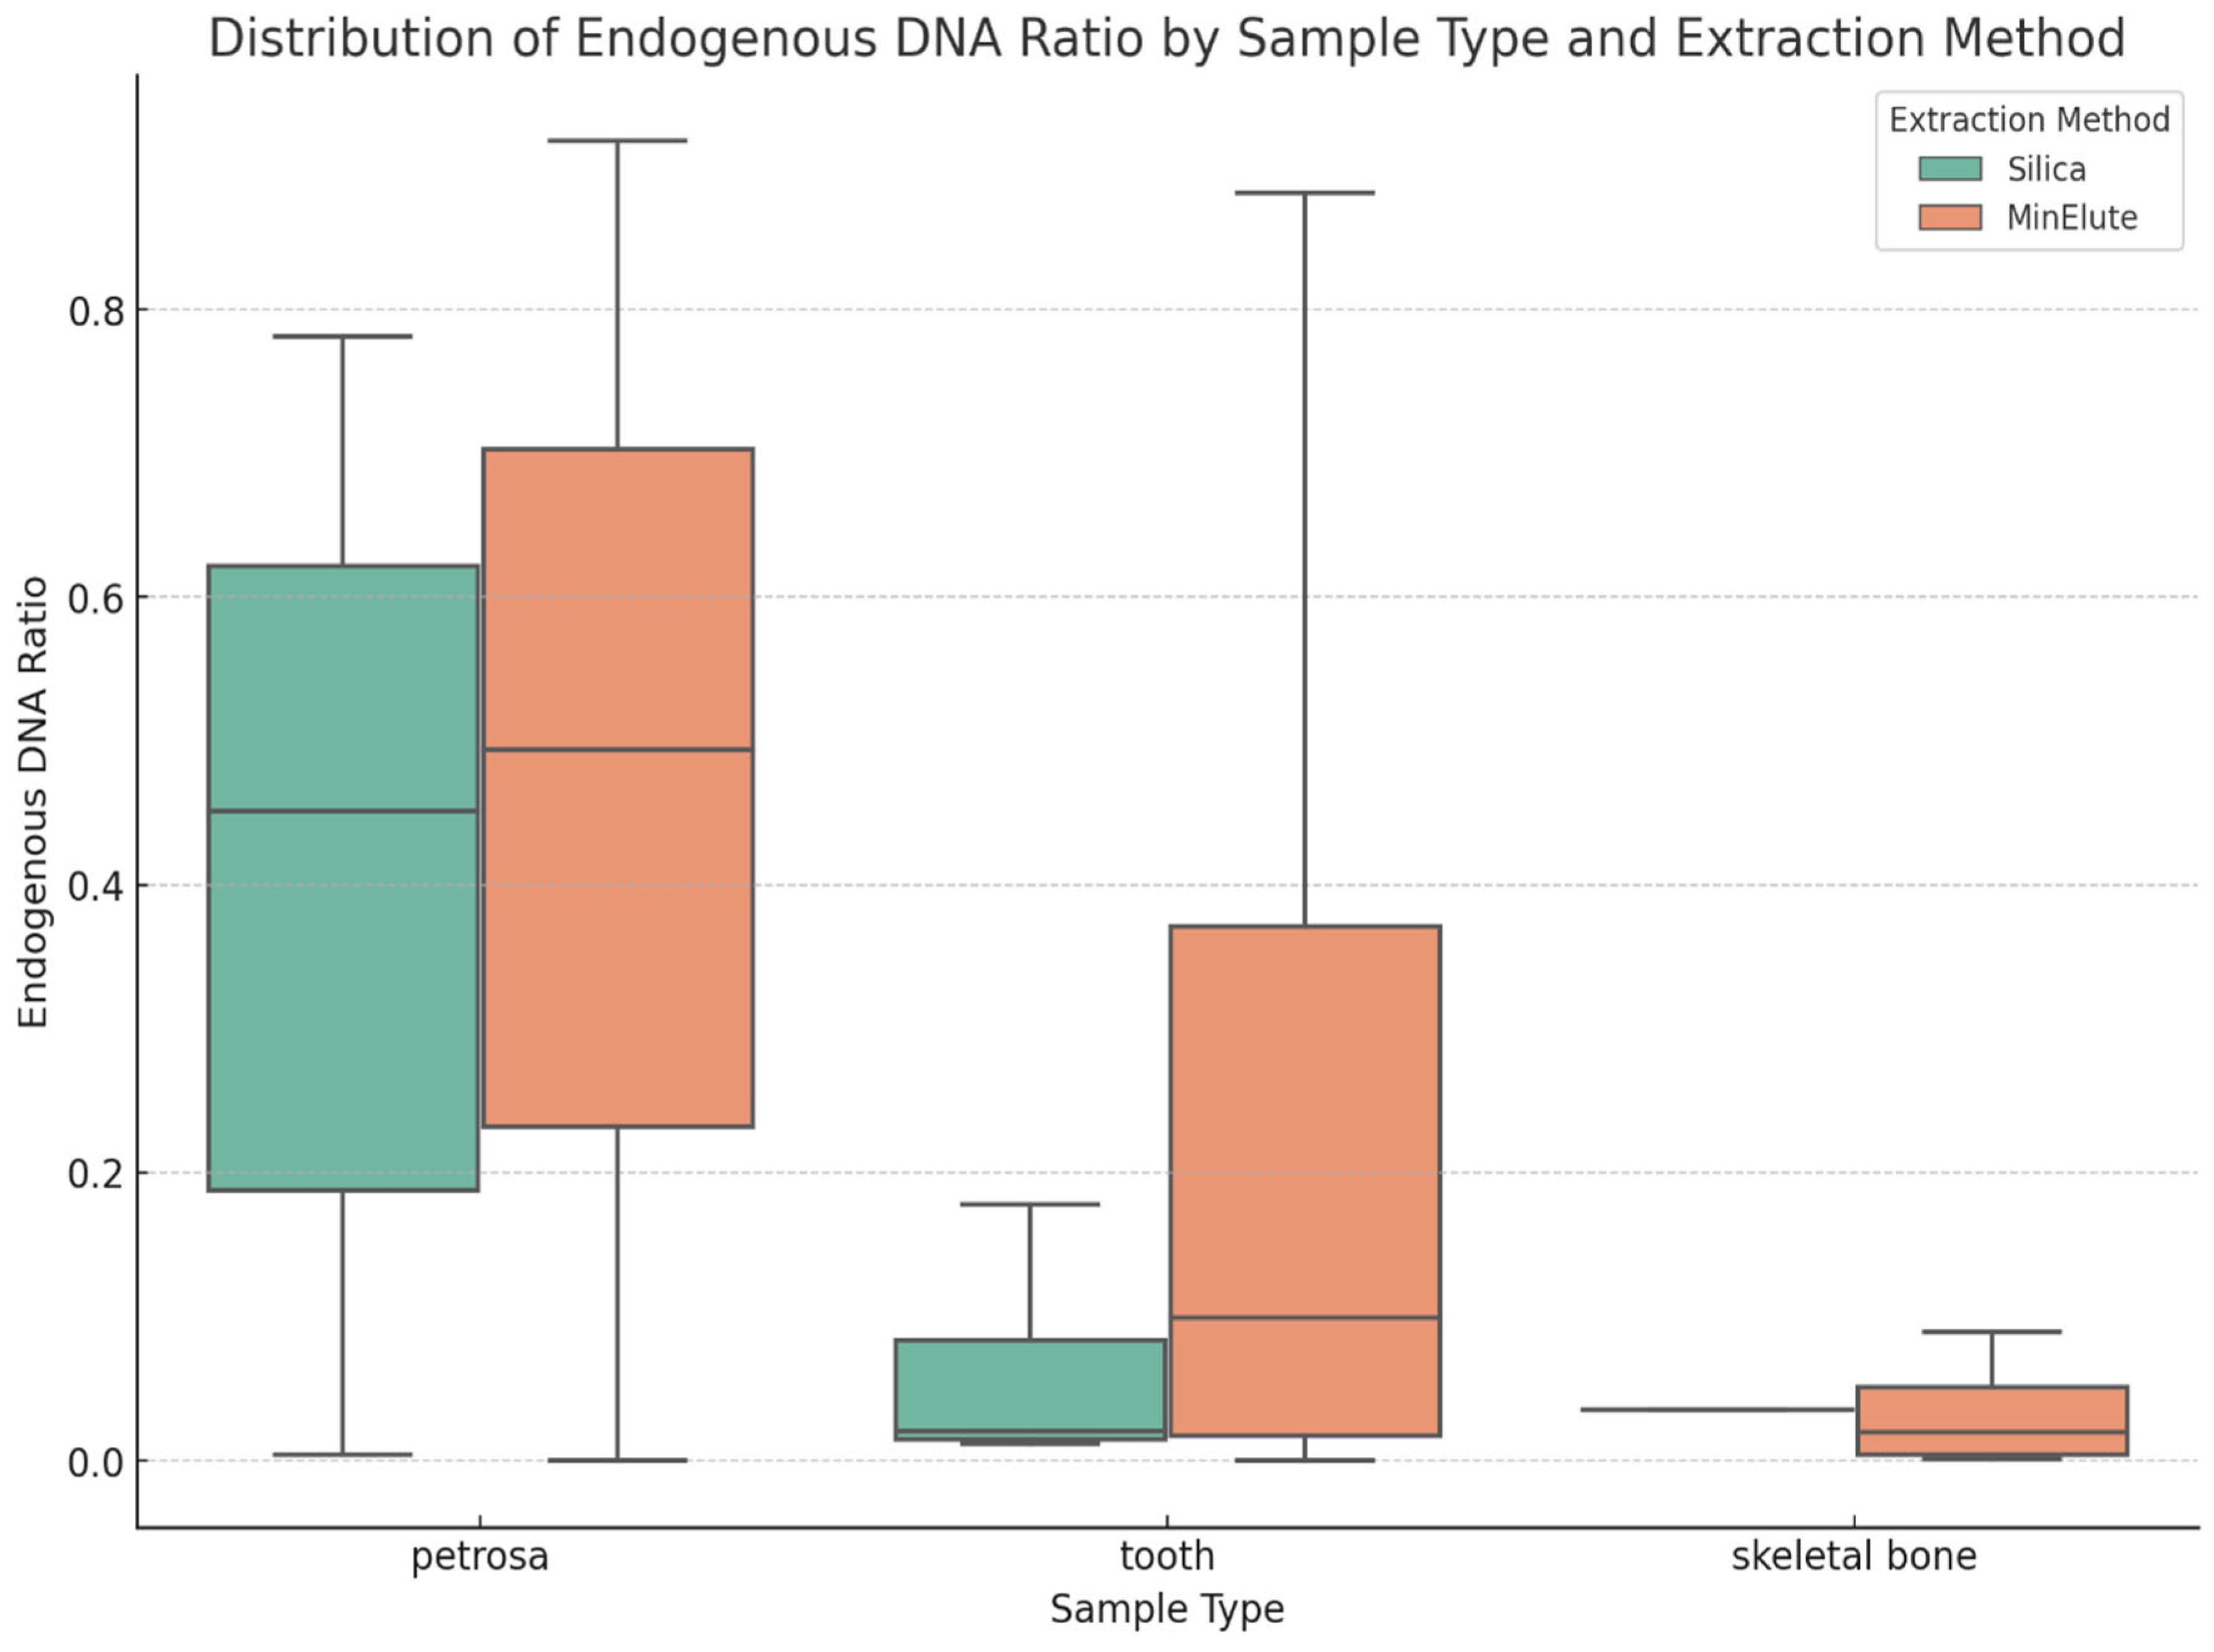
The endogenous DNA ratio varied significantly across the different aDNA sources. As shown in Figure 4, and as described previously in the literature [23], petrosa was the most robust source of aDNA, showing a constantly higher endogenous DNA, which makes it the gold standard for aDNA research where obtaining high-quality aDNA is necessary. While the tooth samples were less effective, they still provided a reliable alternative, yielding consistent results and making them suitable for a wide range of applications [22]. In contrast, skeletal bones had a lower endogenous DNA ratio, making them less ideal for studies that require high-quality aDNA recovery.

Figure 4.
Distribution of endogenous DNA ratios by DNA source (petrosa, tooth, and skeletal bone) and DNA extraction method (silica and MinElute). The figure illustrates the variation in endogenous DNA recovery.
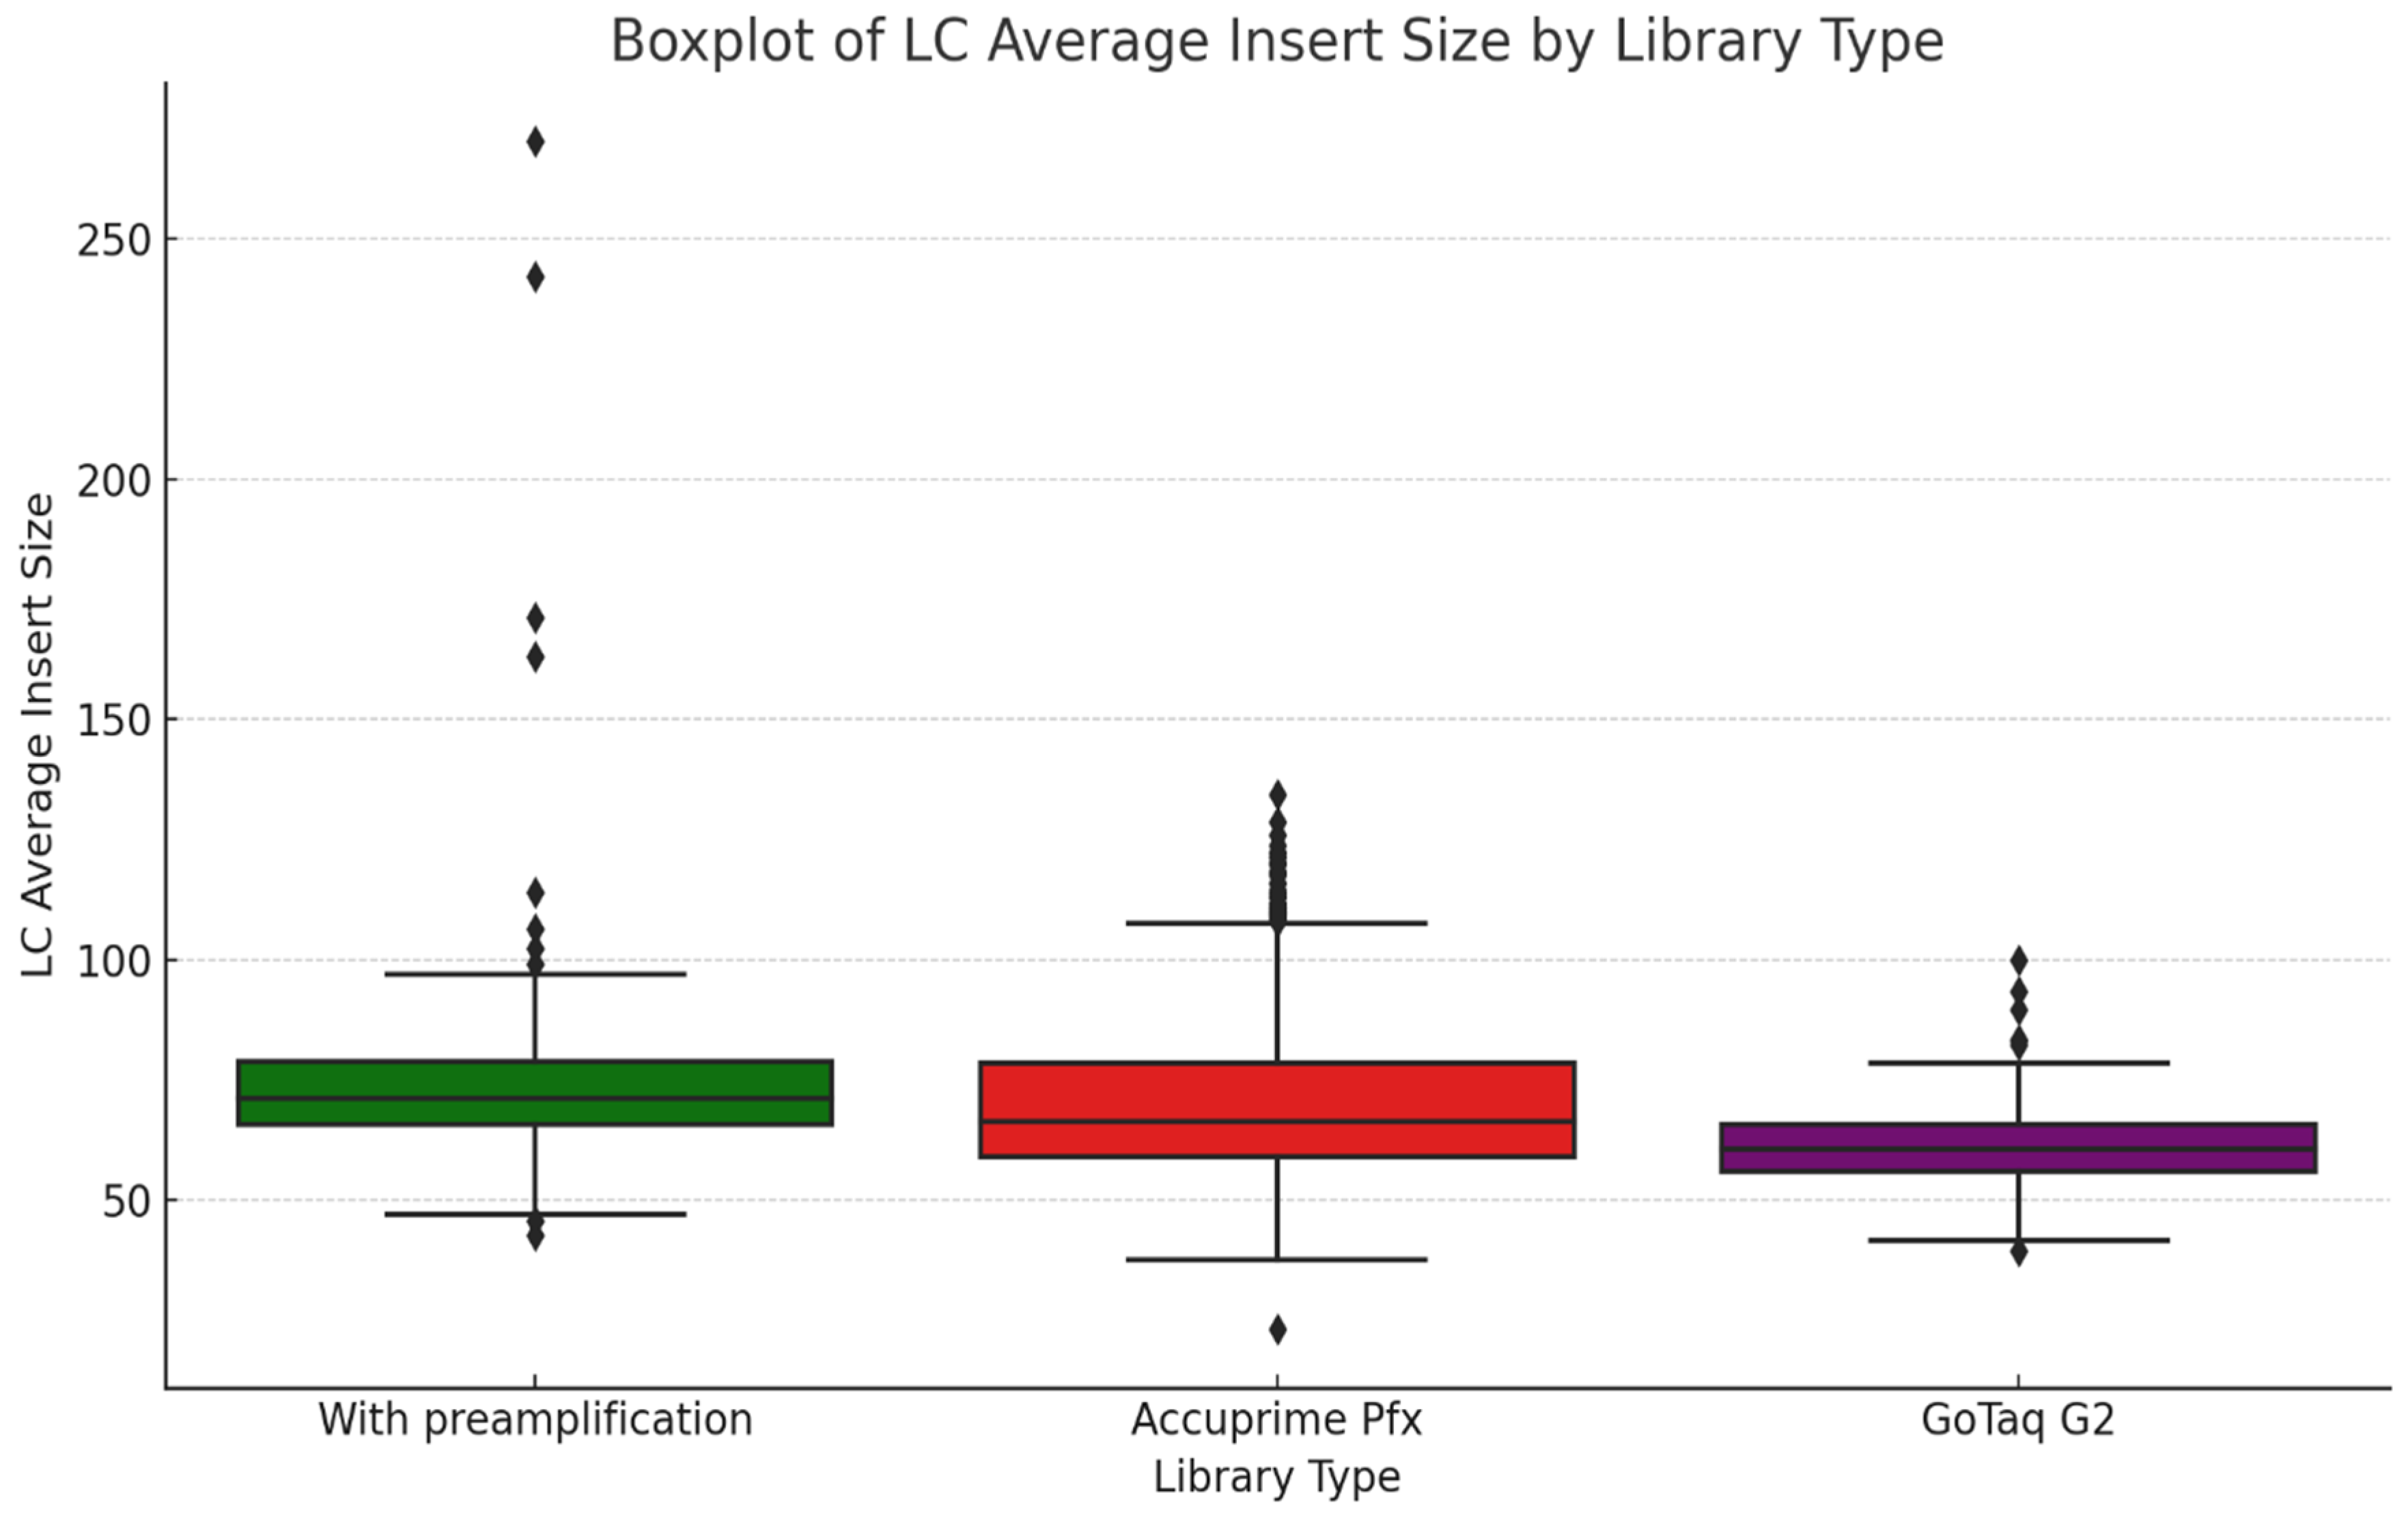
In Figure 5, we illustrate the LC average insert size of the three different library preparation methods: with preamplification, AccuPrime Pfx, and GoTaq G2. The preamplification step used to be a way to immortalize libraries when limited amounts of aDNA were available. This process is used to allow researchers to create a higher amount of the original DNA library to ensure that the genetic material can be used for multiple analyses without depleting the original source [23]. As more protocols with reliable results emerged, the need for preamplification diminished. This shortened the hands-on time in the laboratories and also decreased the costs of the wet-lab process. The preamplification method seemed to produce a somewhat narrower distribution of insert sizes than AccuPrime Pfx, with most values clustering around 70 bp. A few outliers extended beyond 150 bp. Libraries prepared using AccuPrime Pfx and GoTaq G2 showed similar distributions of insert sizes. Both methods yielded median insert sizes similar to preamplification, but the spread of values is slightly greater, with fewer extreme outliers. AccuPrime Pfx, as a high-fidelity polymerase, appears to better preserve size diversity, capturing a wide range of endogenous DNA fragments. This can be an advantage when we work on samples that contain longer aDNA fragments. GoTaq G2 on the other hand, showed a slightly tighter range in size and fewer outliers. This suggests that the amplification of the DNA fragments is more consistent. This can be also attributed to the lack of proofreading activity of the GoTaq enzymes.
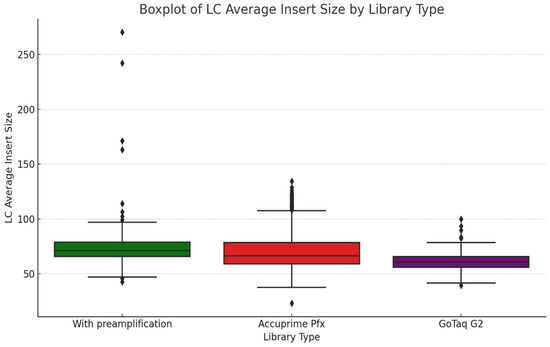
Figure 5.
The boxplot shows the average insert size of each sample types, focusing on the library preparation method. In the case of the first group of samples, an extra preamplification step was used before the indexing, while in the other two methods, we directly indexed the samples, as detailed in the methods and materials. Diamond-shaped dots represent outliers in the dataset.
In Figure 6, while we do not see significant differences, and all the libraries range mostly in the same range of endogenous DNA, we can observe that the highest mean of endogenous DNA ratio can be observed in the libraries made by the GoTaq G2 enzyme, followed by libraries made with the extra preamplification step and then libraries made with the AccuPrime Pfx enzyme. But as is known from multiple sources, endogenous content cannot be influenced by different enzymes, so the difference on the boxplot is due to sampling bias.
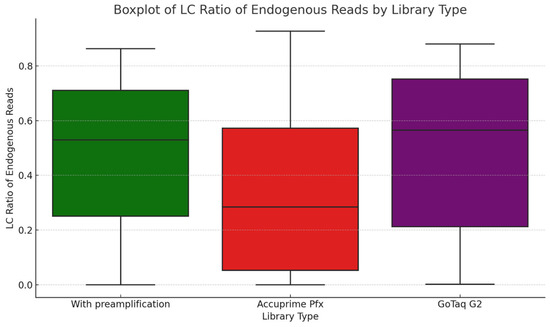
Figure 6.
The boxplot illustrates the LC ratio of endogenous reads for three library preparation methods: with preamplification, AccuPrime Pfx, and GoTaq G2.
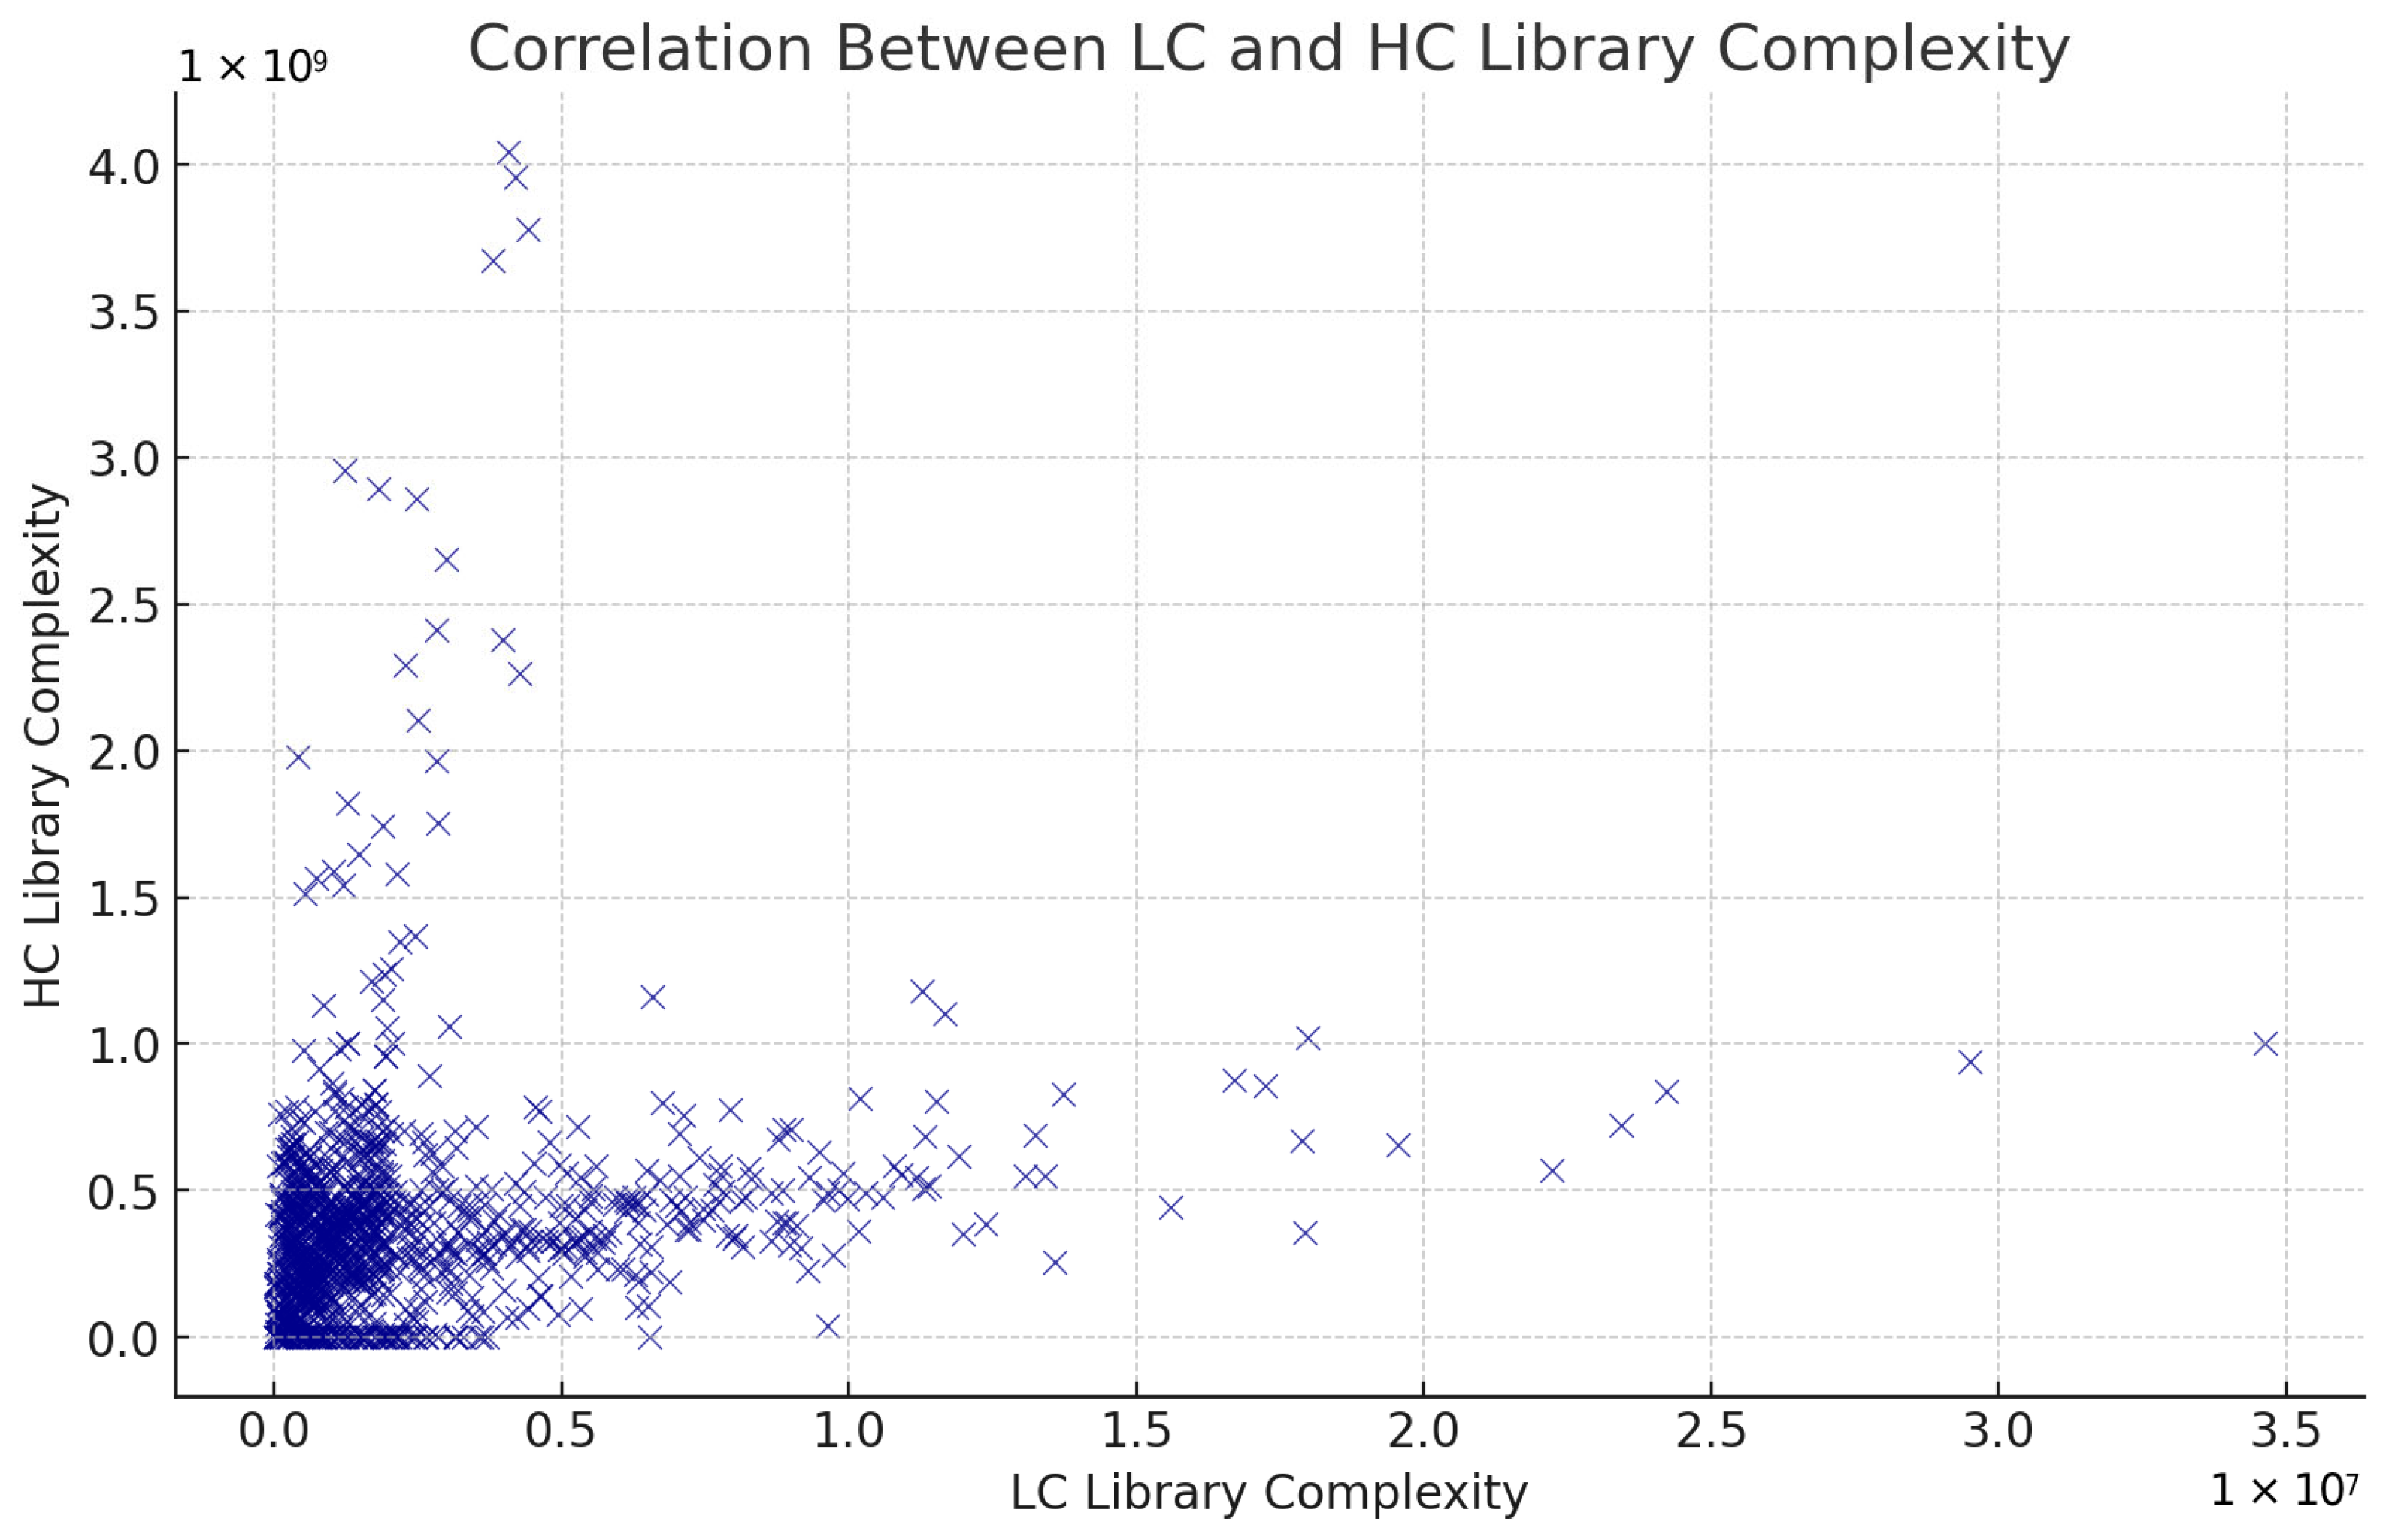
Library complexity represents the diversity of unique DNA molecules in a sequencing library. A high library complexity indicates minimal redundancy and is crucial for generating comprehensive genomic data from aDNA samples. Library complexity is an important metric for assessing the quality and efficiency of the library preparation process. This is valuable in initial assessments of sample quality before committing to HC sequencing. However, solely on LC data, we would not recommend to estimate HC library complexity. In order to assess if library complexity estimation depends on sequencing depth, we calculated the Pearson correlation coefficient between LC and HC library complexity. Using a dataset where both LC and HC data were available, Figure 7 shows the results of a weak positive correlation (ρ = 0.18, p < 0.05), indicating that LC data can provide only a very rough approximation of library complexity values.
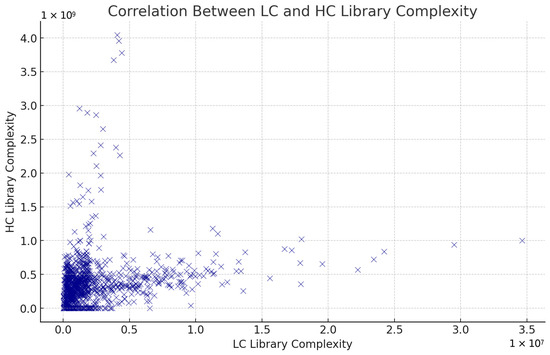
Figure 7.
Library complexity (estimated library size) correlation between LC and HC sequencing data.
The regression line demonstrates a positive but weak correlation between the LC ratio of endogenous reads and the LC estimated library size in Figure 8. This suggests that as the proportion of endogenous DNA increases, the estimated library size or complexity of the libraries does too. However, the high variability in the data points indicates a not very robust relationship. This indicates great inconsistency in how the library size can affect the aDNA diversity. Since the LC estimated library size, or complexity, is calculated by only using the DNA fragments that can be mapped to the human genome, it excludes DNA of microbial or environmental contaminants. This ensures that the metric focuses only on the target aDNA, and it shows limitations of the library complexity for a metric to assess the sample quality. While most of the samples with higher endogenous DNA tend to produce more complex libraries, this trend is not consistent. In conclusion, while the LC ratio of endogenous reads does provide a reliable measure of sample authenticity, the LC estimated library size may not consistently reflect the actual genomic diversity of ancient DNA libraries. Researchers should be cautious in interpreting library size as a standalone metric and consider additional parameters.
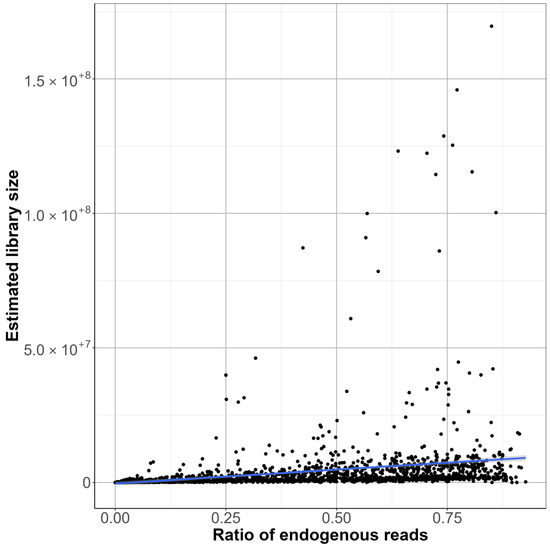
Figure 8.
Correlation between LC library complexity and LC endogenous reads, with the regression line showing correlation between the two values.
3.2. Results—Phase Two
To compare the different library preparation methods in a controlled way, we prepared new libraries from the same samples using the different methods. In this way, we directly compared the different library preparation methods on the same samples and checked the key metrics. In the second phase of the study, we worked with five ancient individuals. We used one of the samples twice as an internal control, so we worked with a total sample number of six.
Overall, we built a total of 36 aDNA NGS Illumina-specific libraries from 18 distinct DNA extracts using the combinations presented in Table 1. We estimated the endogenous DNA content, insert sizes, and library sizes using Picard Tools from low-coverage shallow shotgun sequencing on Illumina iSeq100.

Table 1.
This table contains all the different methodology we used for the experiment, detailing the source of the DNA, the type of DNA extraction, and the list of the enzymes we used.
In the second phase, we excluded skeletal bone as the source of aDNA, and we excluded library preparation methods that applied extra preamplification steps. All DNA was extracted from pars petrosa and teeth using both MinElute columns and a silica powder suspension. From the extractions, double-stranded NGS libraries were prepared without preamplification, and the final library amplification was done with two different polymerases. To control contamination, we ran parallel negative controls.
As presented in Table 1, we used the following combinations of the different protocols. Method A: DNA was extracted from tooth samples according to [11]; after digestion, the DNA was purified with MinElute columns and indexed with AccuPrime Pfx enzyme. Method B: DNA was extracted from tooth samples using MinElute columns, and the NGS library indexing was made with G2GO Taq polymerase. Method C: DNA was extracted from pars petrosa using MinElute columns, and the NGS library indexing was made with G2GO Taq polymerase. Method D: aDNA was extracted from pars petrosa using MinElute columns, and the NGS library indexing was made with AccuPrime Pfx Supermix. Method E: DNA was extracted from pars petrosa using silica suspension, and the NGS library indexing was made with G2GO Taq polymerase. Method F: DNA was extracted from pars petrosa using silica suspension, and the NGS library indexing was made with AccuPrime Pfx enzyme. Table 2 presents the key metrics from the second phase of the study.
Table 2.
Key metrics of the library types used in the second phase of the study. All the samples in a library type were merged into one calculation. For clarity, we used rounded numbers. Detailed calculations can be found in the Supplementary Materials.
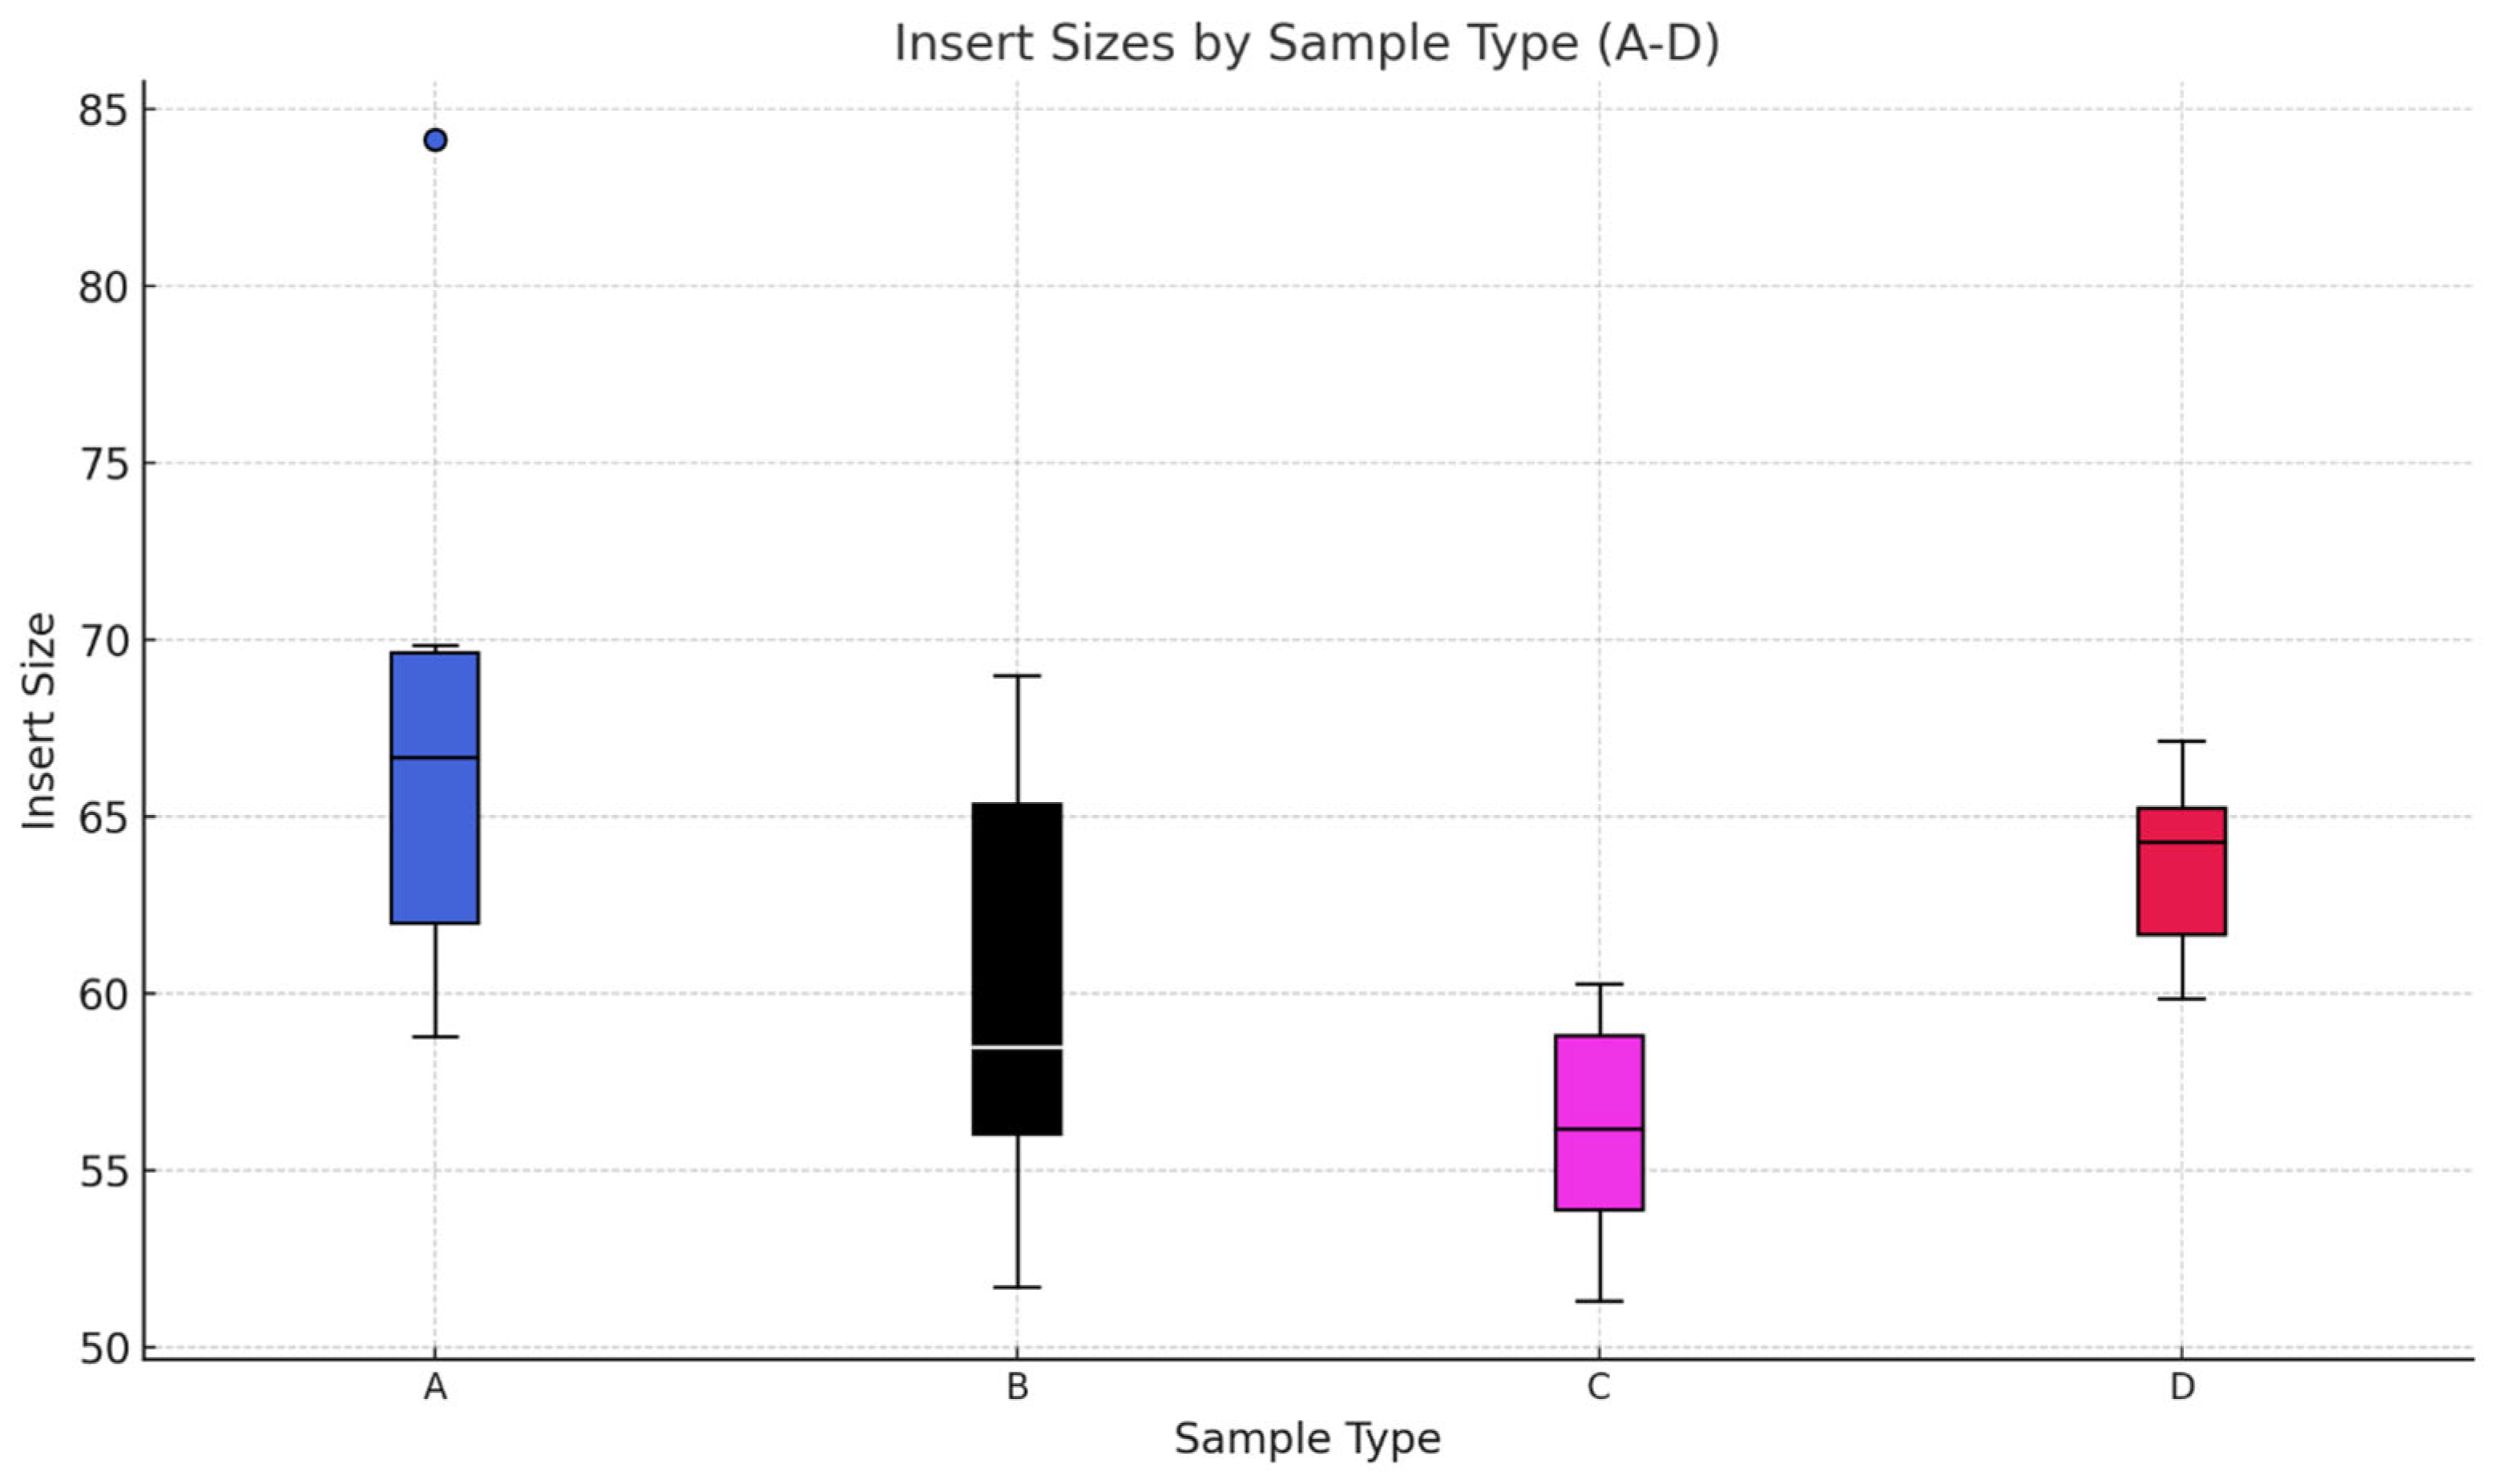
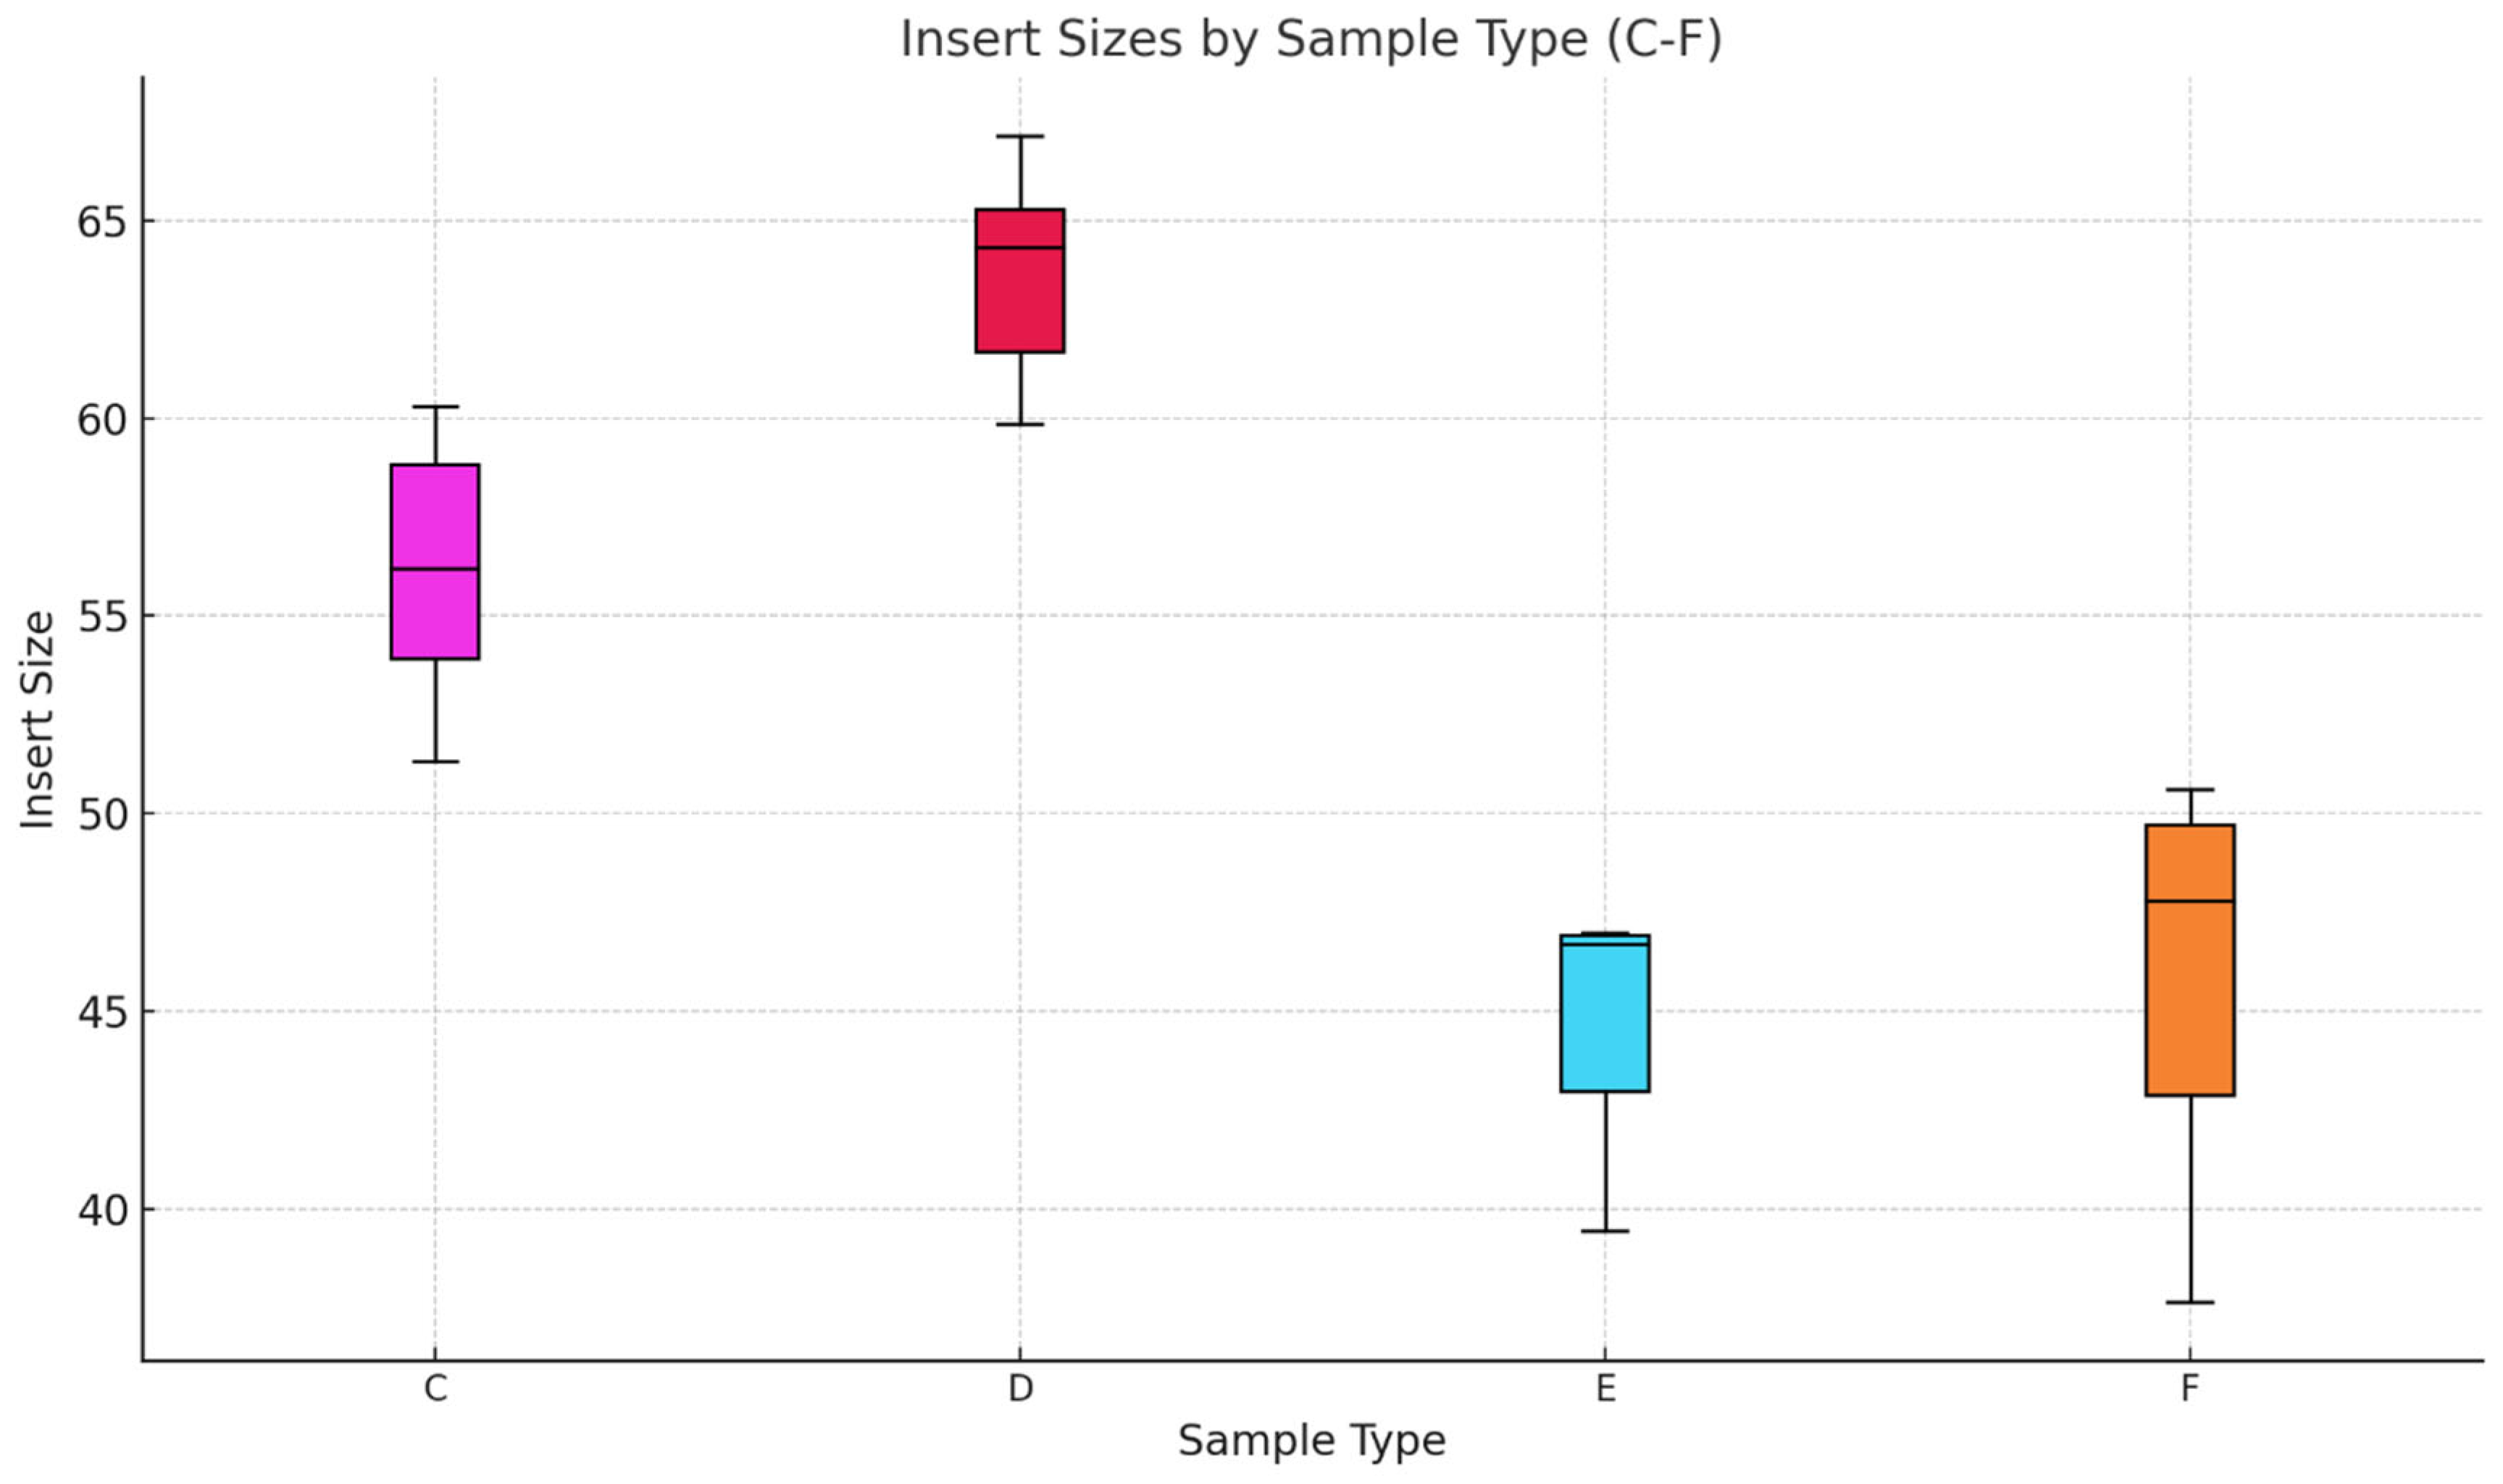
The insert size distribution across the four samples in Figure 9 showed a key difference that was influenced by the aDNA source and the enzyme used for library preparation. The boxplot of Sample Type A showed the largest median size of 67 bp. This can be attributed to the protective nature of the tooth cementum that is acting as a barrier against different environmental degradation. The combination of the high-fidelity AccuPrime Pfx enzyme and the source of the aDNA is likely to contribute to the recovery of larger fragments in this category. Sample Type B showed a median size slightly smaller than Sample Type A, but the spread of the box was broader. This can be due to the difference in the enzyme fidelity. While the tooth sample was a great source of DNA, the lower precision of the GoTaq polymerase may have introduced higher inconsistency in fragment lengths. Sample Type C from all the samples showed the smallest median size, with a very narrow interquartile range. In the case of Sample Type D, the boxplot showed a slightly larger median size than Sample Type C. This can be caused by the amplification properties between the GoTaq and AccuPrime enzymes.
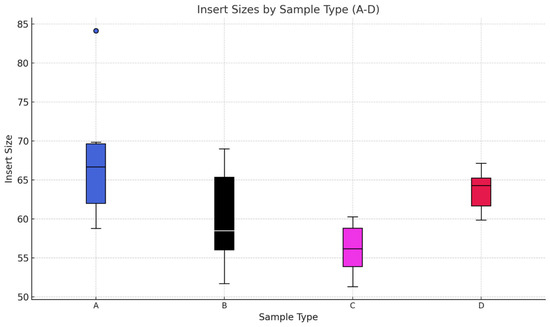
Figure 9.
Boxplot representation of the insert sizes of 24 samples. In this boxplot, we group the samples by the source of the aDNA and enzyme used for NGS library preparation. The aDNA extraction was executed using MinElute column technique. The data used for the boxplot can be found in the Supplementary Materials. Sample types (A–D) and their corresponding methodologies are detailed in Table 1.
In Figure 10, we compare the possible effects of the used DNA extraction method on the insert sizes. Sample Type E showed the smallest median insert size of 46 bp, with a tight range (45–55 bp). The shorter fragment size might be attributed to the silica powder extraction method. The Sample Type F median insert size was slightly larger than E, at 47 bp, but with a broader spread, indicating more variety in the fragment sizes. This may reflect with the previously discussed enzyme attributes of AccuPrime Pfx, as well as its high-fidelity and proofreading activity. The results indicate that the DNA source, type of extraction method, and library preparation enzyme seem to influence insert size distribution. Those aDNA that had been extracted from tooth samples (type A and B) tended to produce longer fragments compared to pars petrosa samples (type C and D). In contrast, pars petrosa consistently yielded tightly distributed insert sizes. These findings interestingly do not align with the data that we presented in the first phase of the study. This can be due to a simple sampling bias or a batch effect, as can be seen in Figure 11 and Figure 12. The enzyme used also seems to influence the insert size, which is probably due to the proofreading activity of the AccuPrime Pfx. In contrast, the GoTaq polymerase, while less precise due to its lack of proofreading activity, proved effective for amplifying smaller DNA fragments, particularly from pars petrosa samples. The silica powder extraction seems to preserve shorter fragments compared to the MinElute extraction method. These results show that the aDNA extraction and library preparation methods influence the optimal quality and recovery of the aDNA fragments.
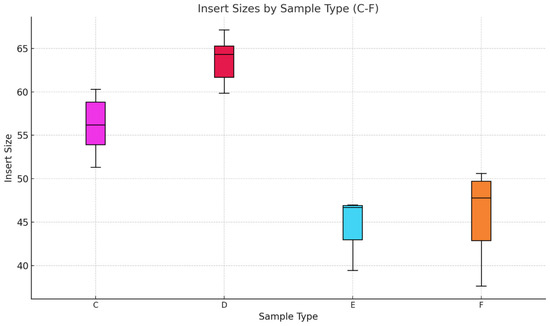
Figure 10.
Boxplot representation of the insert sizes of 24 samples. The second boxplot examines the insert size distributions for sample categories C, D, E, and F—all derived from pars petrosa. While the DNA source is consistent across these categories, the differences in DNA extraction methods and library preparation enzymes contribute to the observed variations.
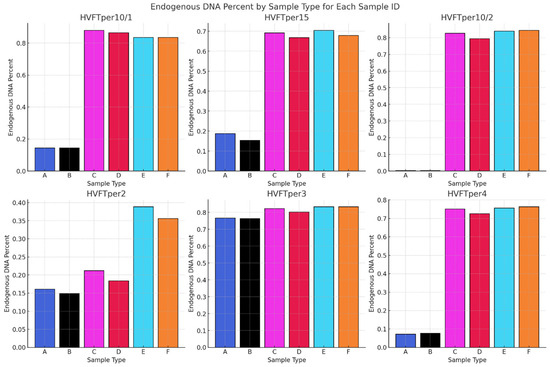
Figure 11.
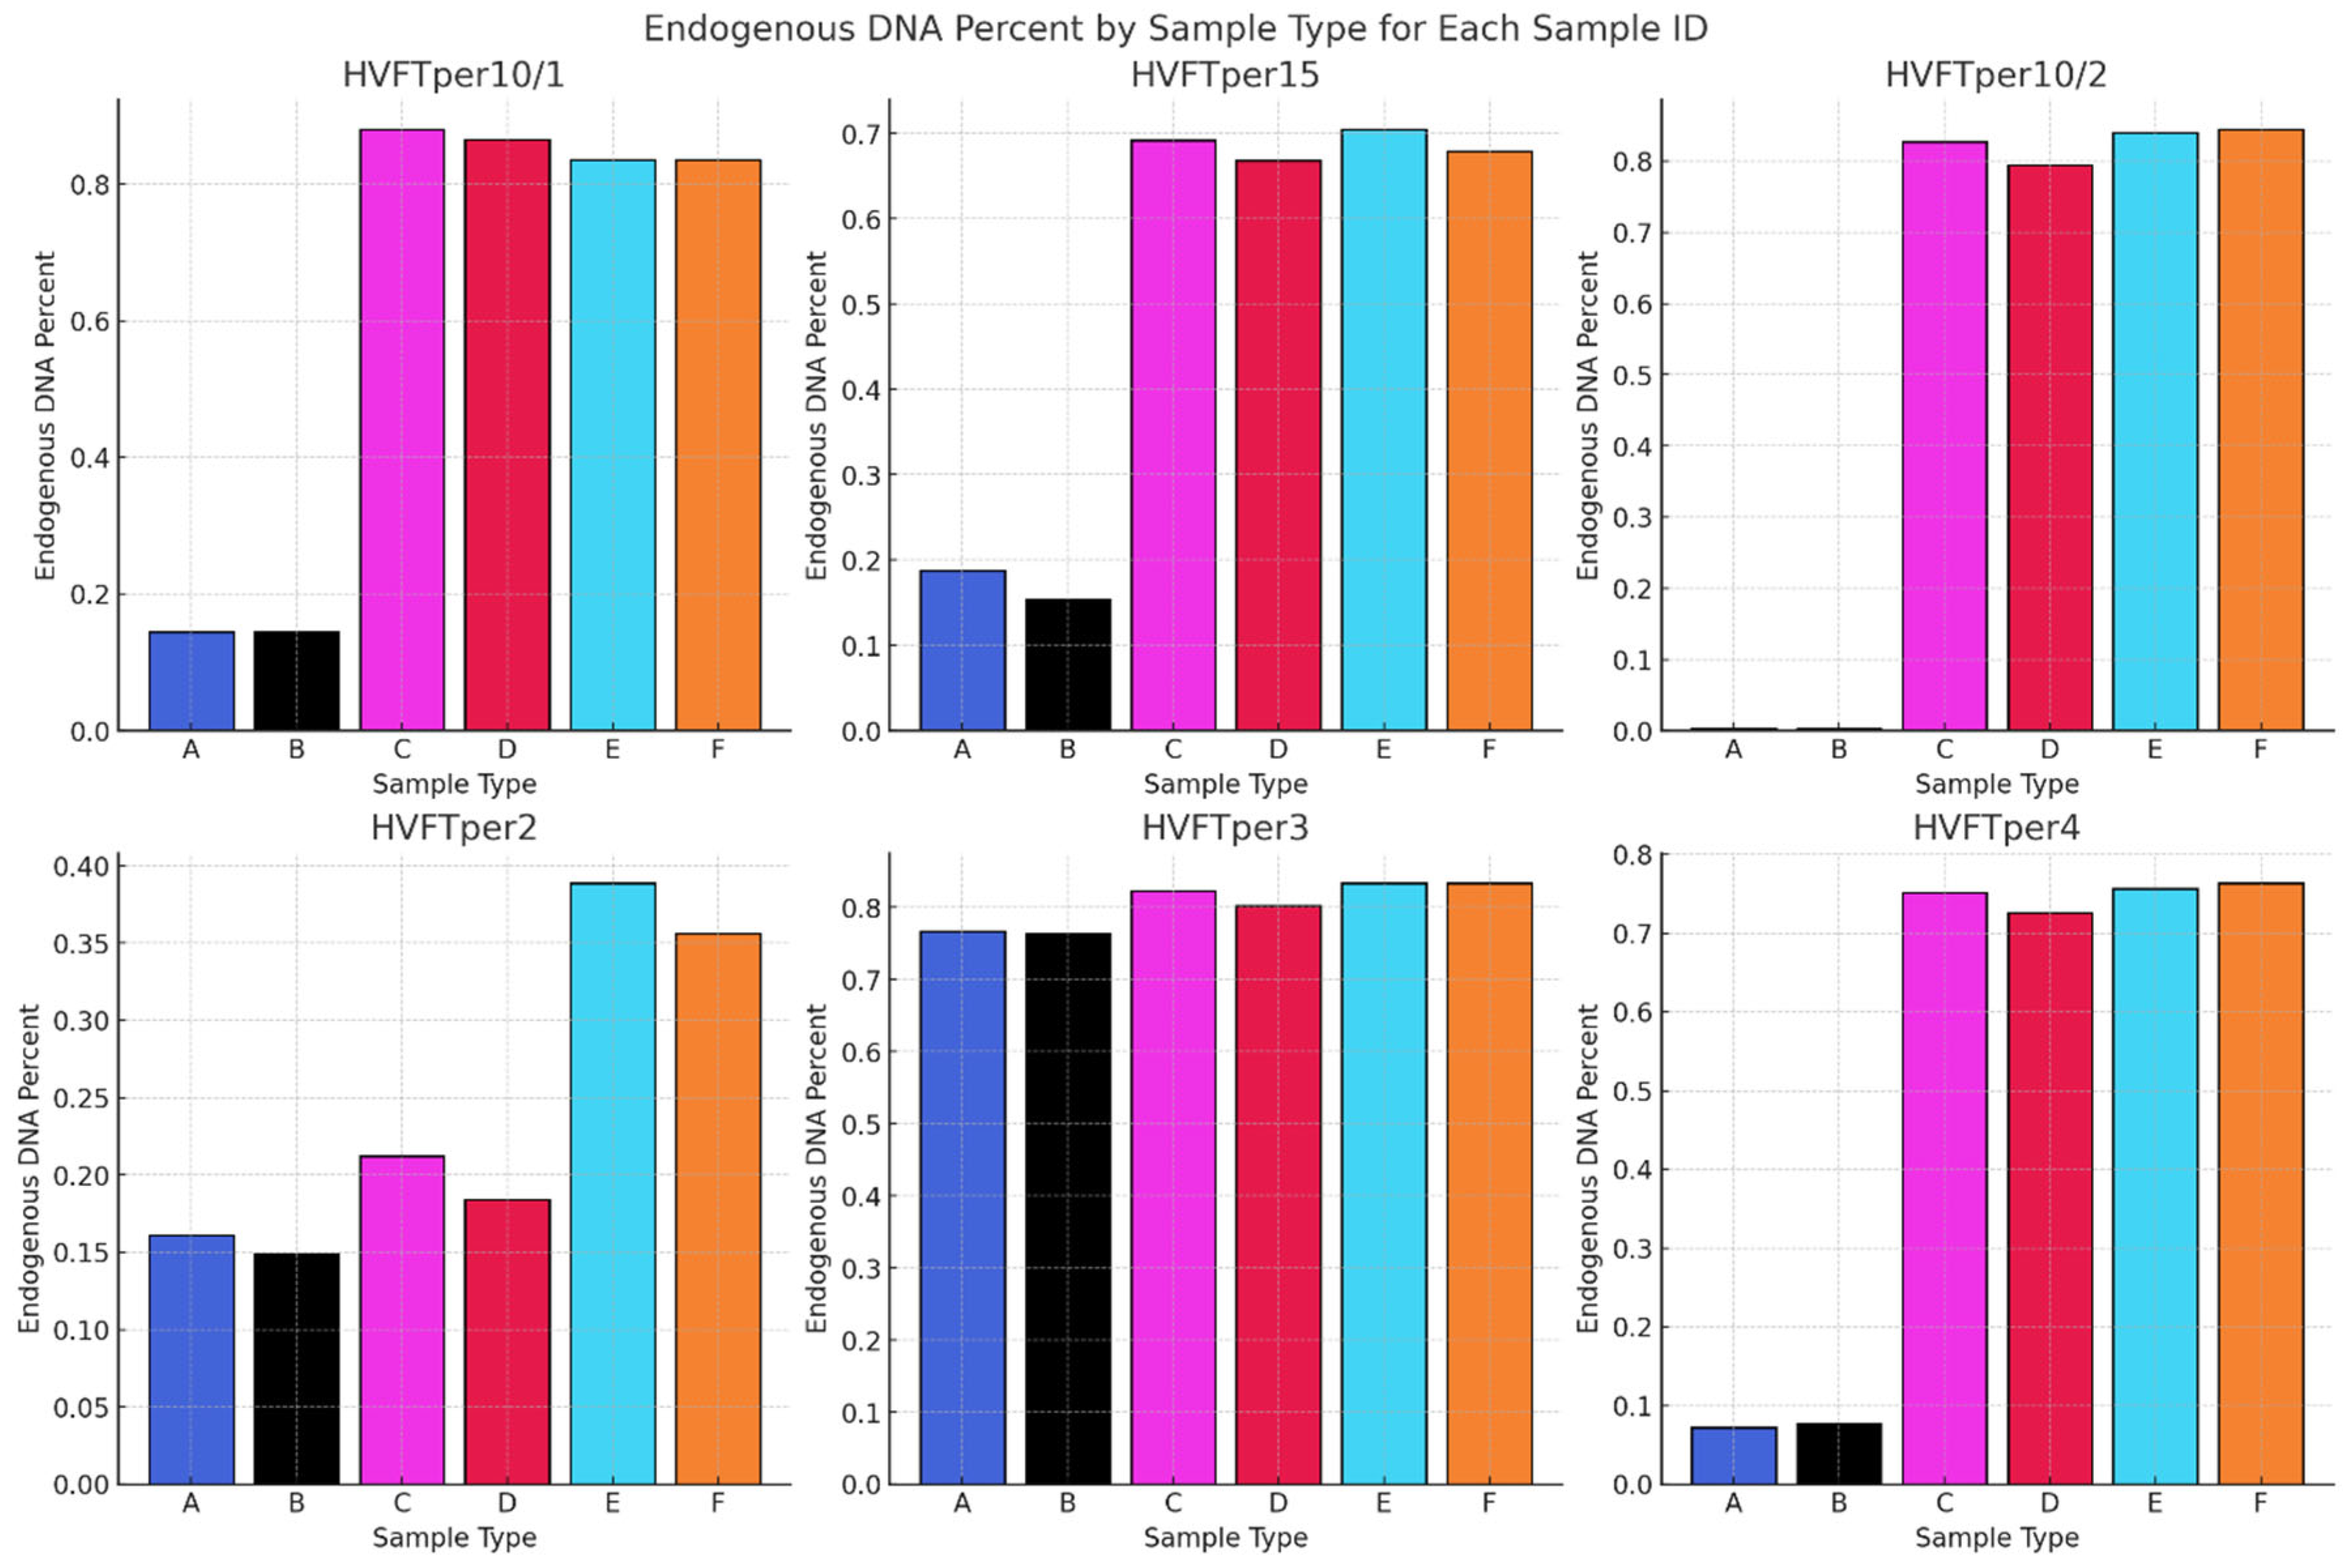
Comparing the average endogenous DNA percentage of each sample and library type. All the Sample Types and the methods used are presented in Table 1.
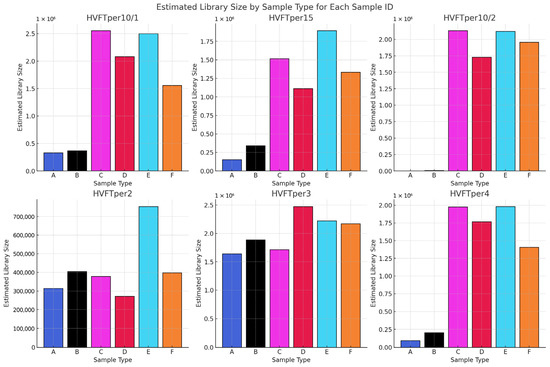
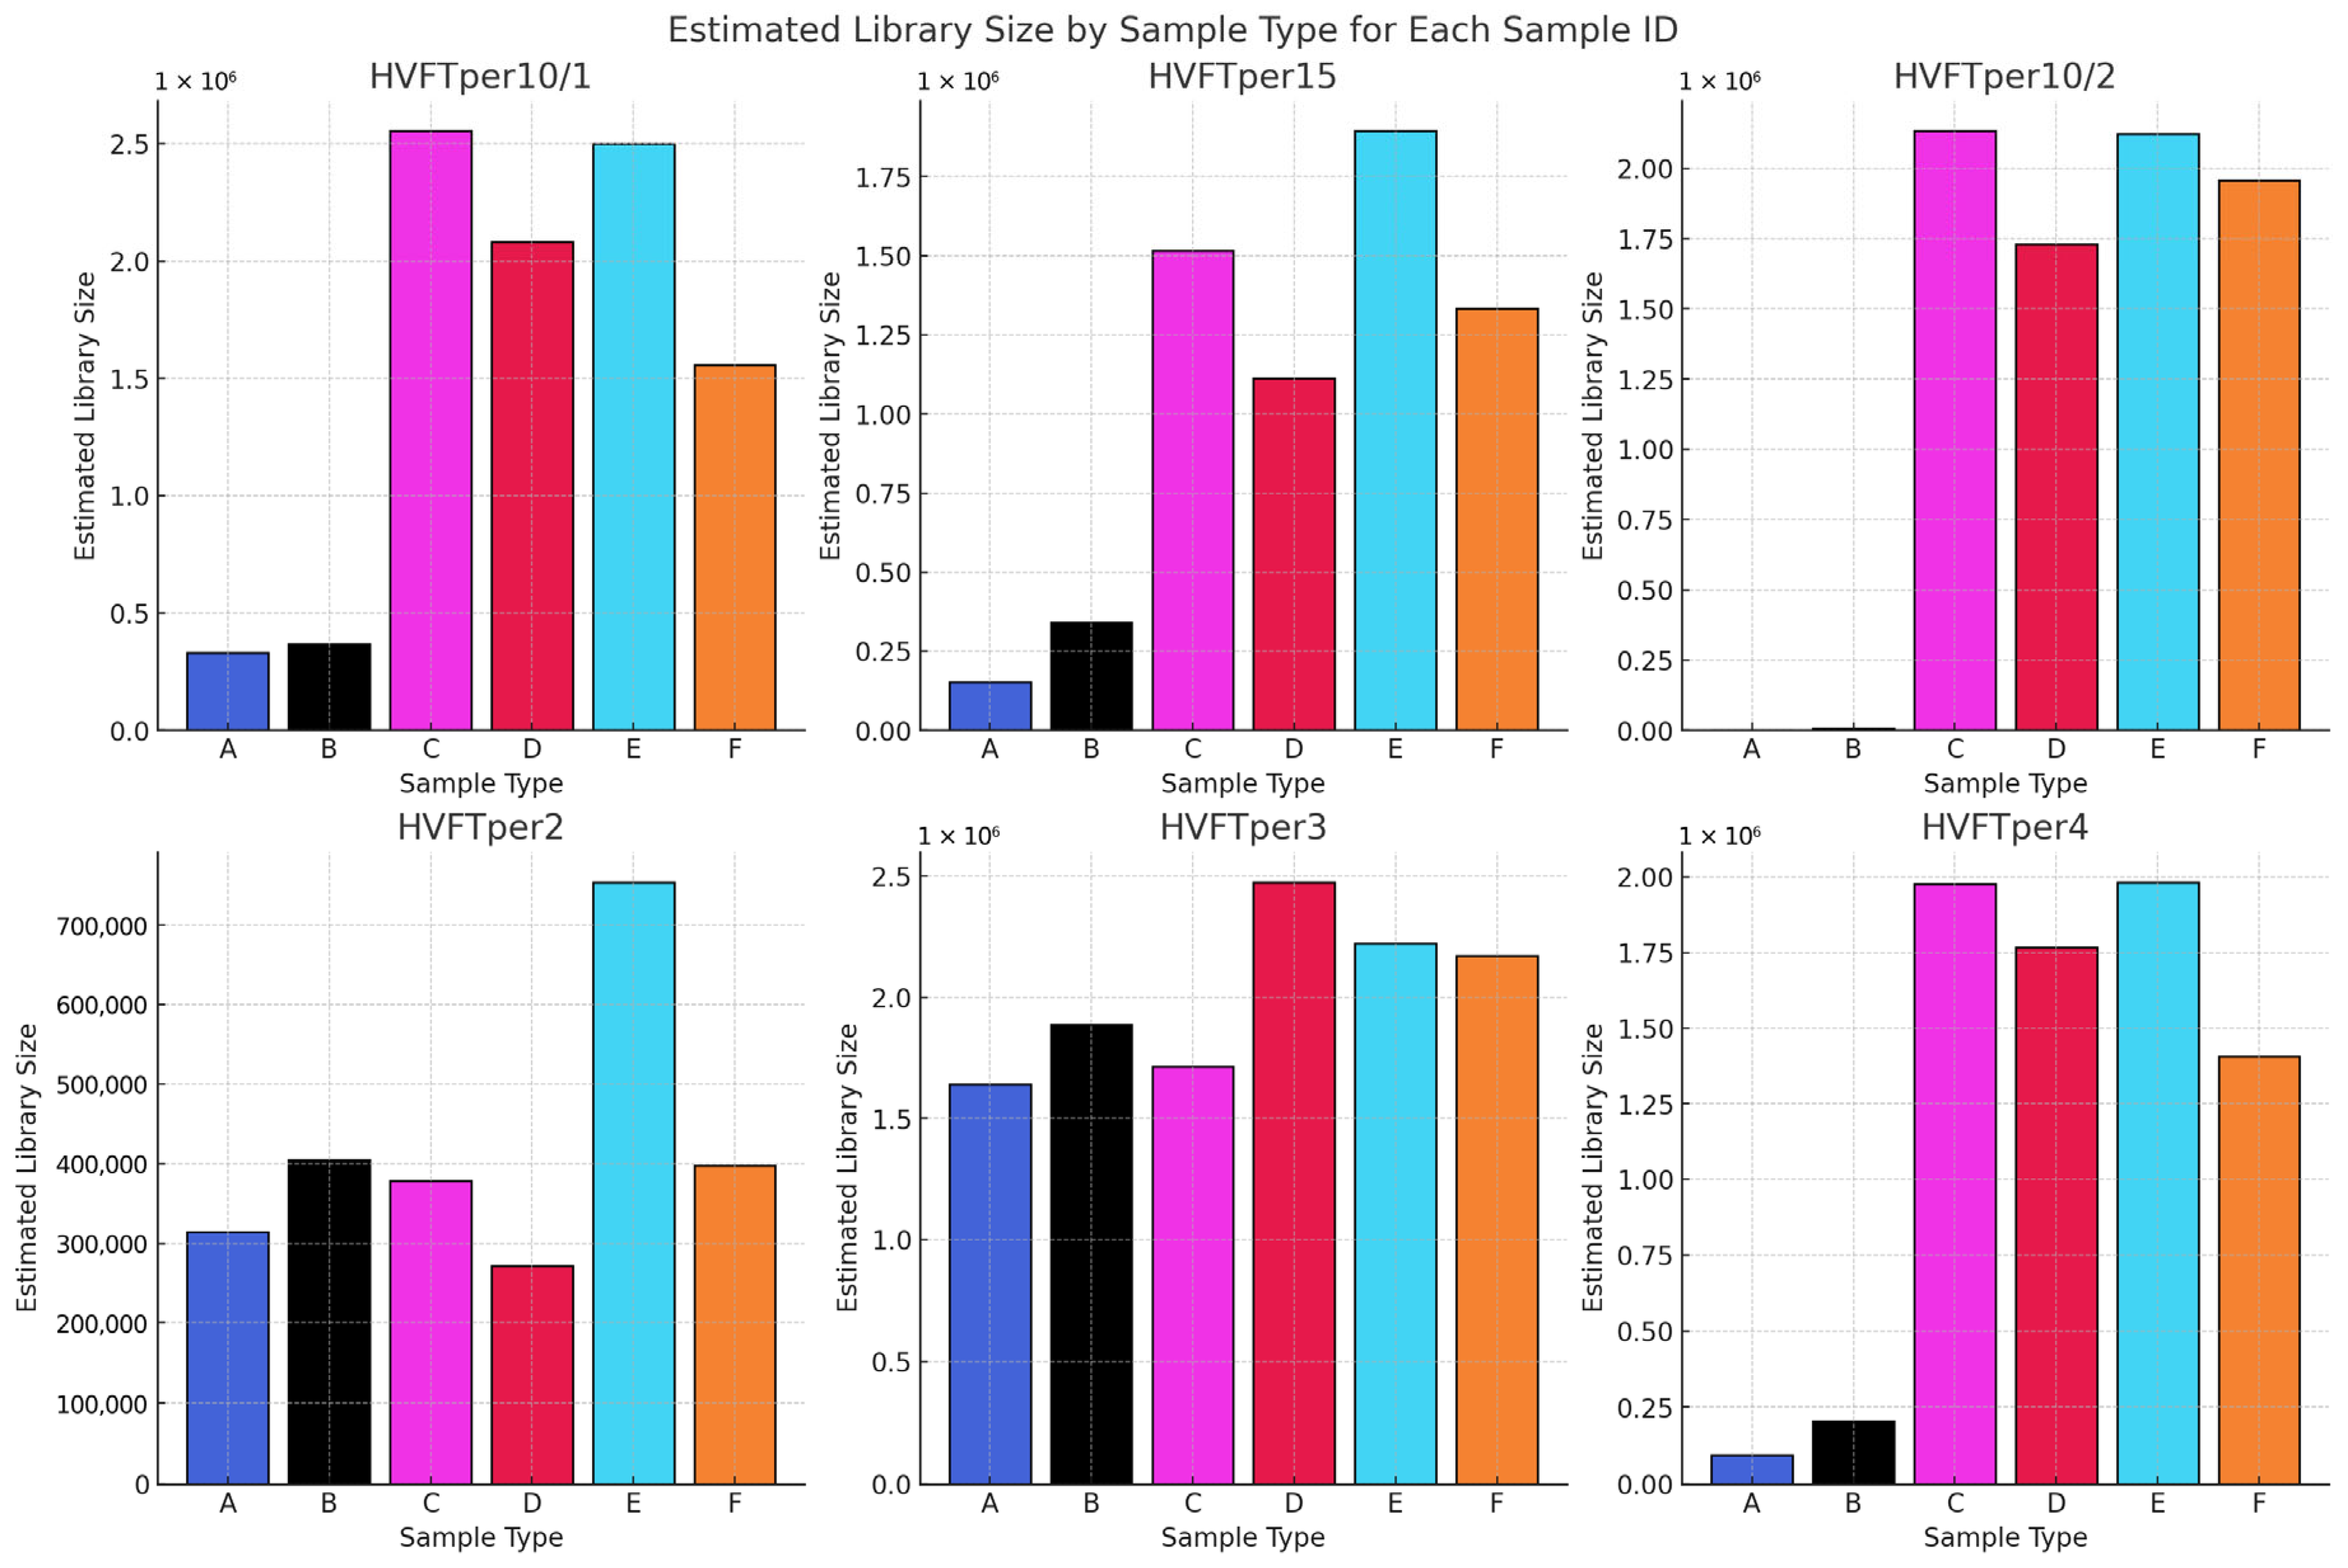
Figure 12.
Comparison of the estimated library size and the complexity of the libraries across different sample and library types. Sample types and their corresponding preparation methods are detailed in Table 1.
In Figure 11, we compare the endogenous content of the NGS libraries made with different methods. In line with previous studies [12] and our phase one results, the endogenous contents of the samples from pars petrosa were generally higher than those from tooth samples. Among the pars petrosa samples, we observed no significant differences in endogenous DNA content across the different protocols. Only in the case of sample HVFTper2 did we see unexpectedly lower amounts of endogenous DNA in the case of the “C” and “D” libraries, which also have low complexity (Figure 12). This can highlight a problem during the DNA extraction in the wet-lab process.
In Figure 12, we compare the library complexity data using the Picard Tool software. The complexity value estimates the number of unique molecules in a library, which indicates the optimal depth at which the library should be sequenced. It appears that from tooth samples, the “B” libraries seem to contain more unique molecules. In the case of the pars petrosa samples, the “C” and “E” libraries seem to be more complex. All these libraries were made by using the GoTaq G2 polymerase. In only one case, from sample HVFTper3, did the library “D” give more complex libraries. Also, if we compare the different DNA extraction methods from the pars petrosa libraries, we see that libraries “C” and “E” do not show significant difference, which is correlating with the data we presented in the first phase in our study.
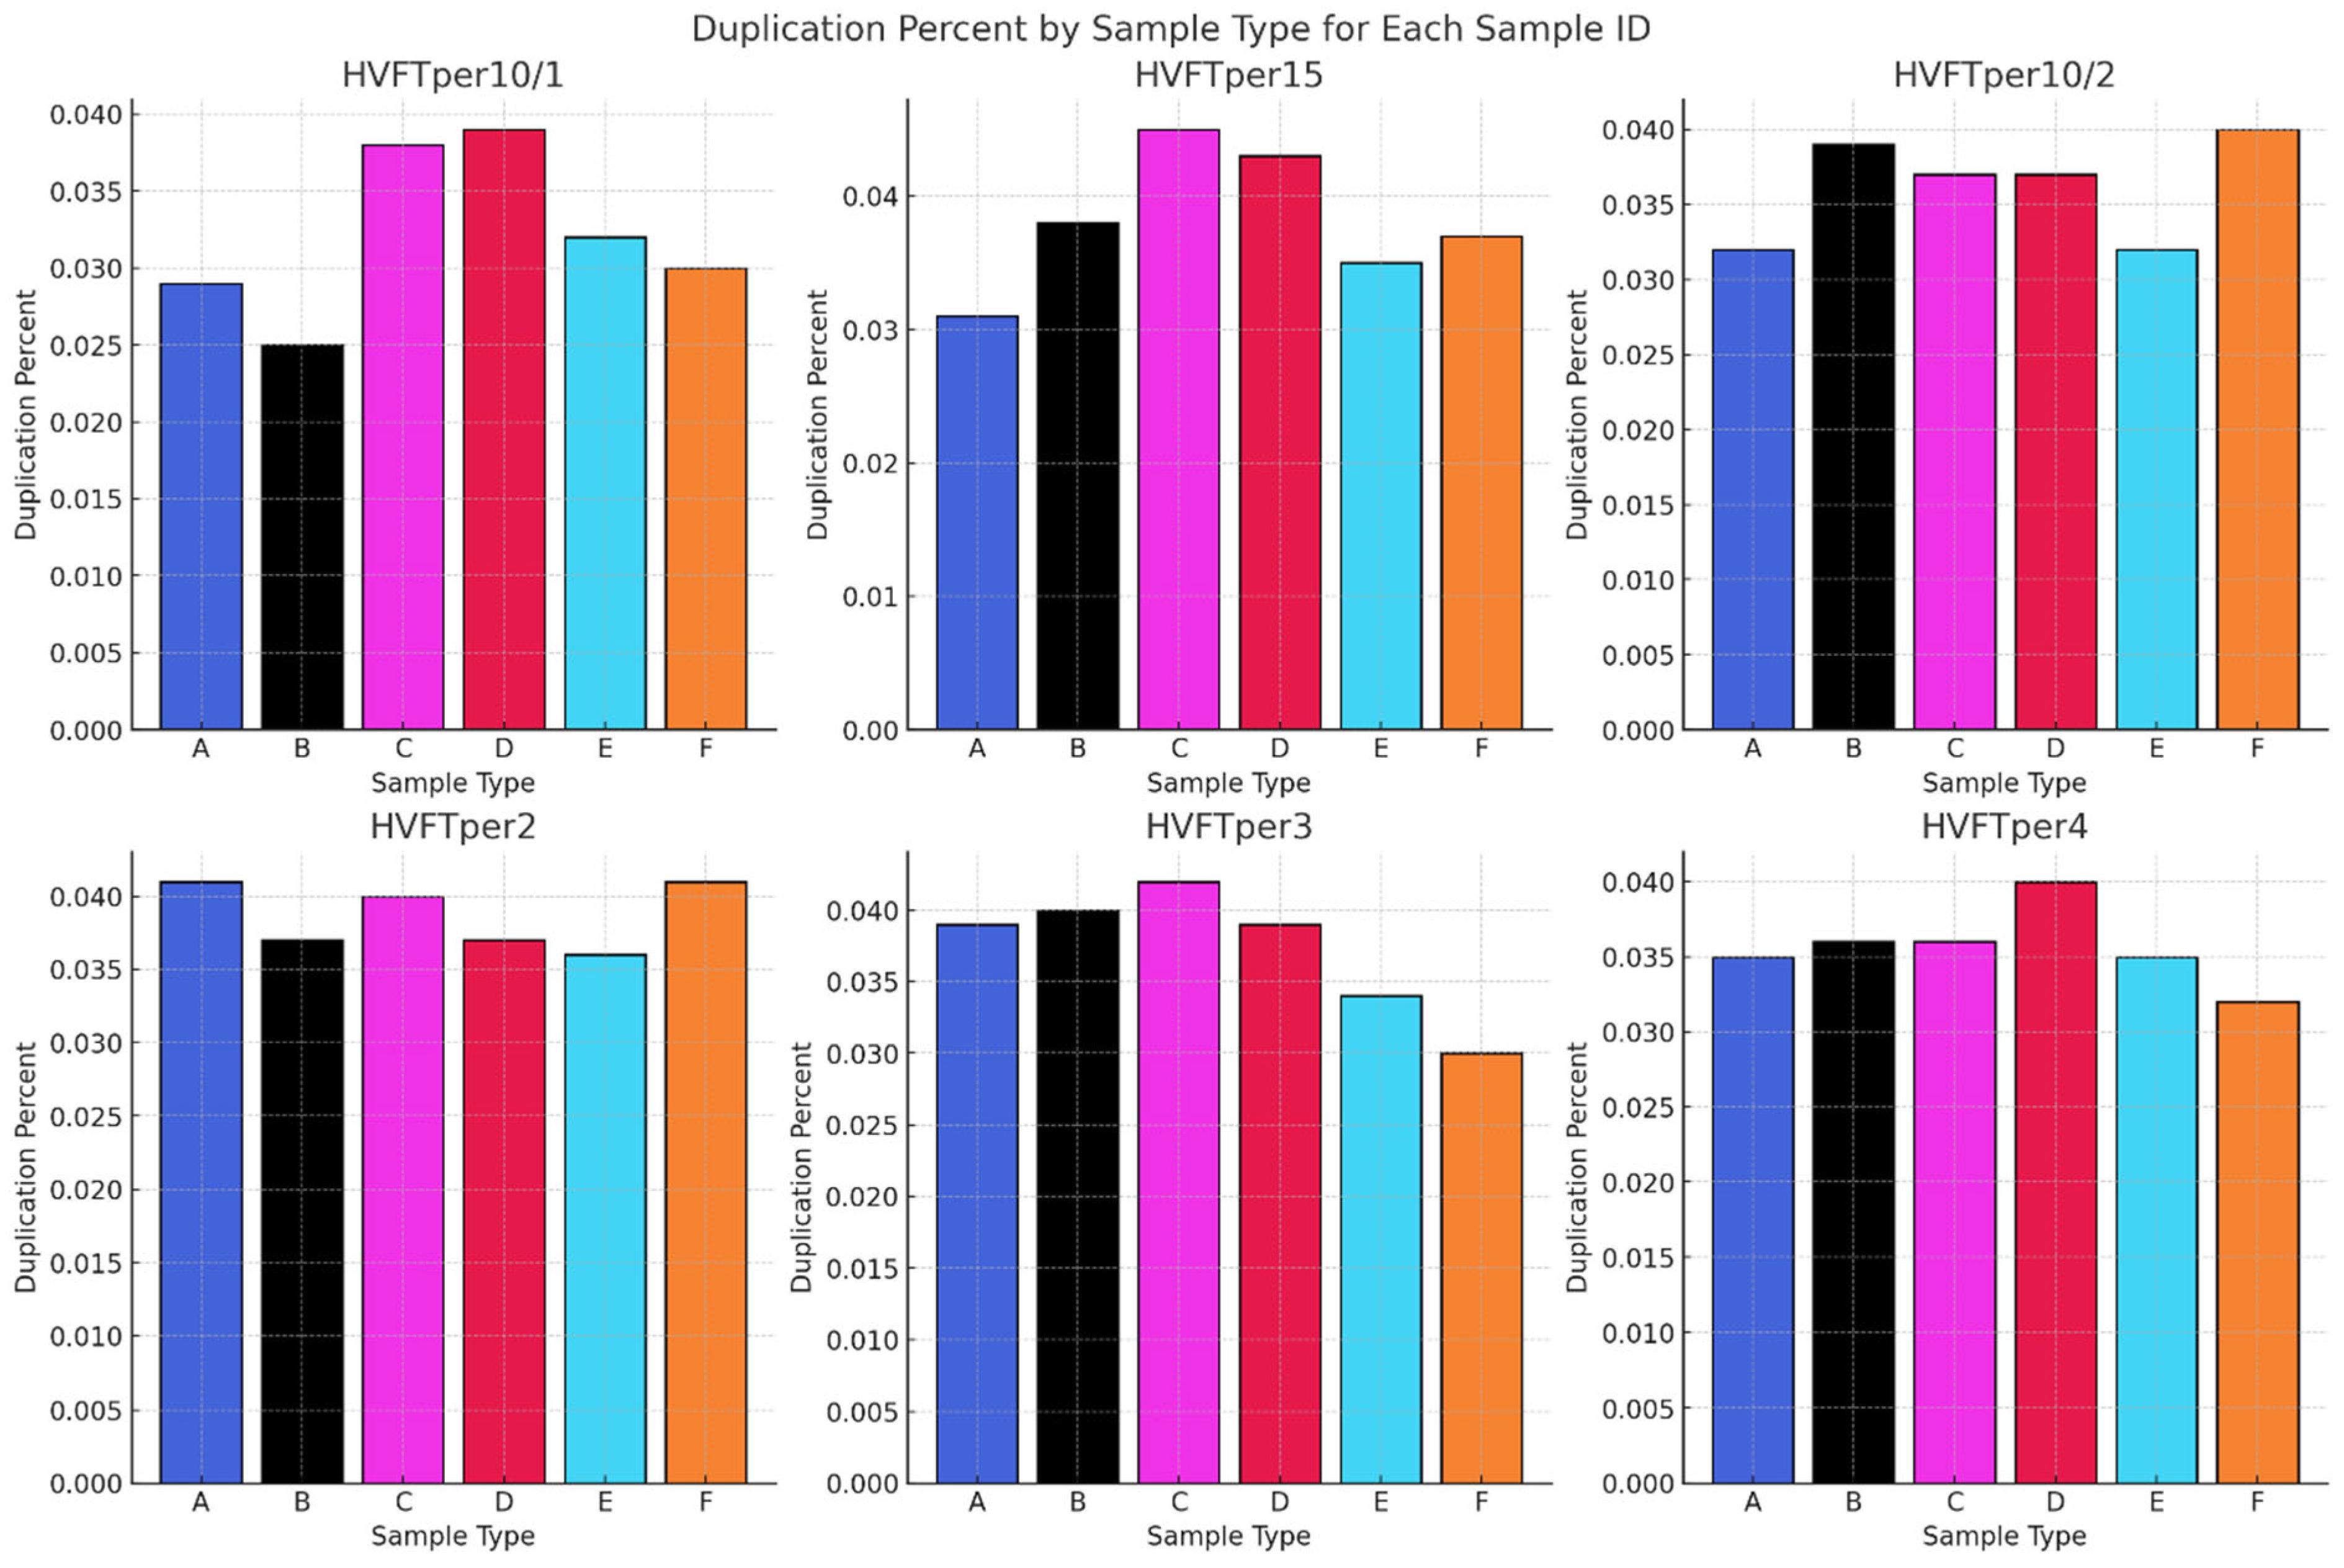
The number of duplicates is a reflection of the non-unique DNA molecules in the sequencing library. This can occur due to over-amplification or limited aDNA diversity in the pool. In Figure 13, the number of duplications in the six sample types shows clear consistency, with the rates of duplicates ranging between 3 and 4% in all the libraries. These data clearly show that the enzyme used and the source of the aDNA are not affecting the number of duplicate reads in the sample. The data presented here show that the methods used are uniformly effective at minimizing the number of duplicates, regardless of the enzymes or protocols used. This states that factors such as original sample quality and the absence of preamplification processes may have a more significant role in the rates of duplicate amounts.
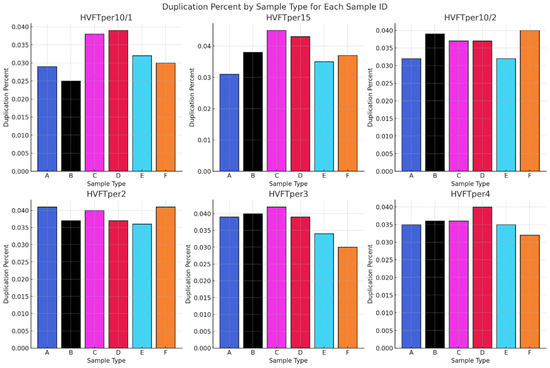
Figure 13.
Comparing the number of duplications found in each sample and library type. All the Sample Types and the methods used are presented in Table 1.
3.3. Results—Phase Three
In the third phase of the study, we wanted to see more details about the two methods we found to be the most optimal in phase two of our study. Our goal was to specifically test the relative efficiency of these two enzymes across multiple samples. Since in price, there is a huge difference between the AccuPrime Pfx enzyme and the GoTaq G2 polymerase, we wanted to see whether the performance outcomes of the two enzymes are really comparable and if we can reduce the cost of the library preparation by using GoTaq G2 polymerase. We conducted experiments on an additional 10 samples.
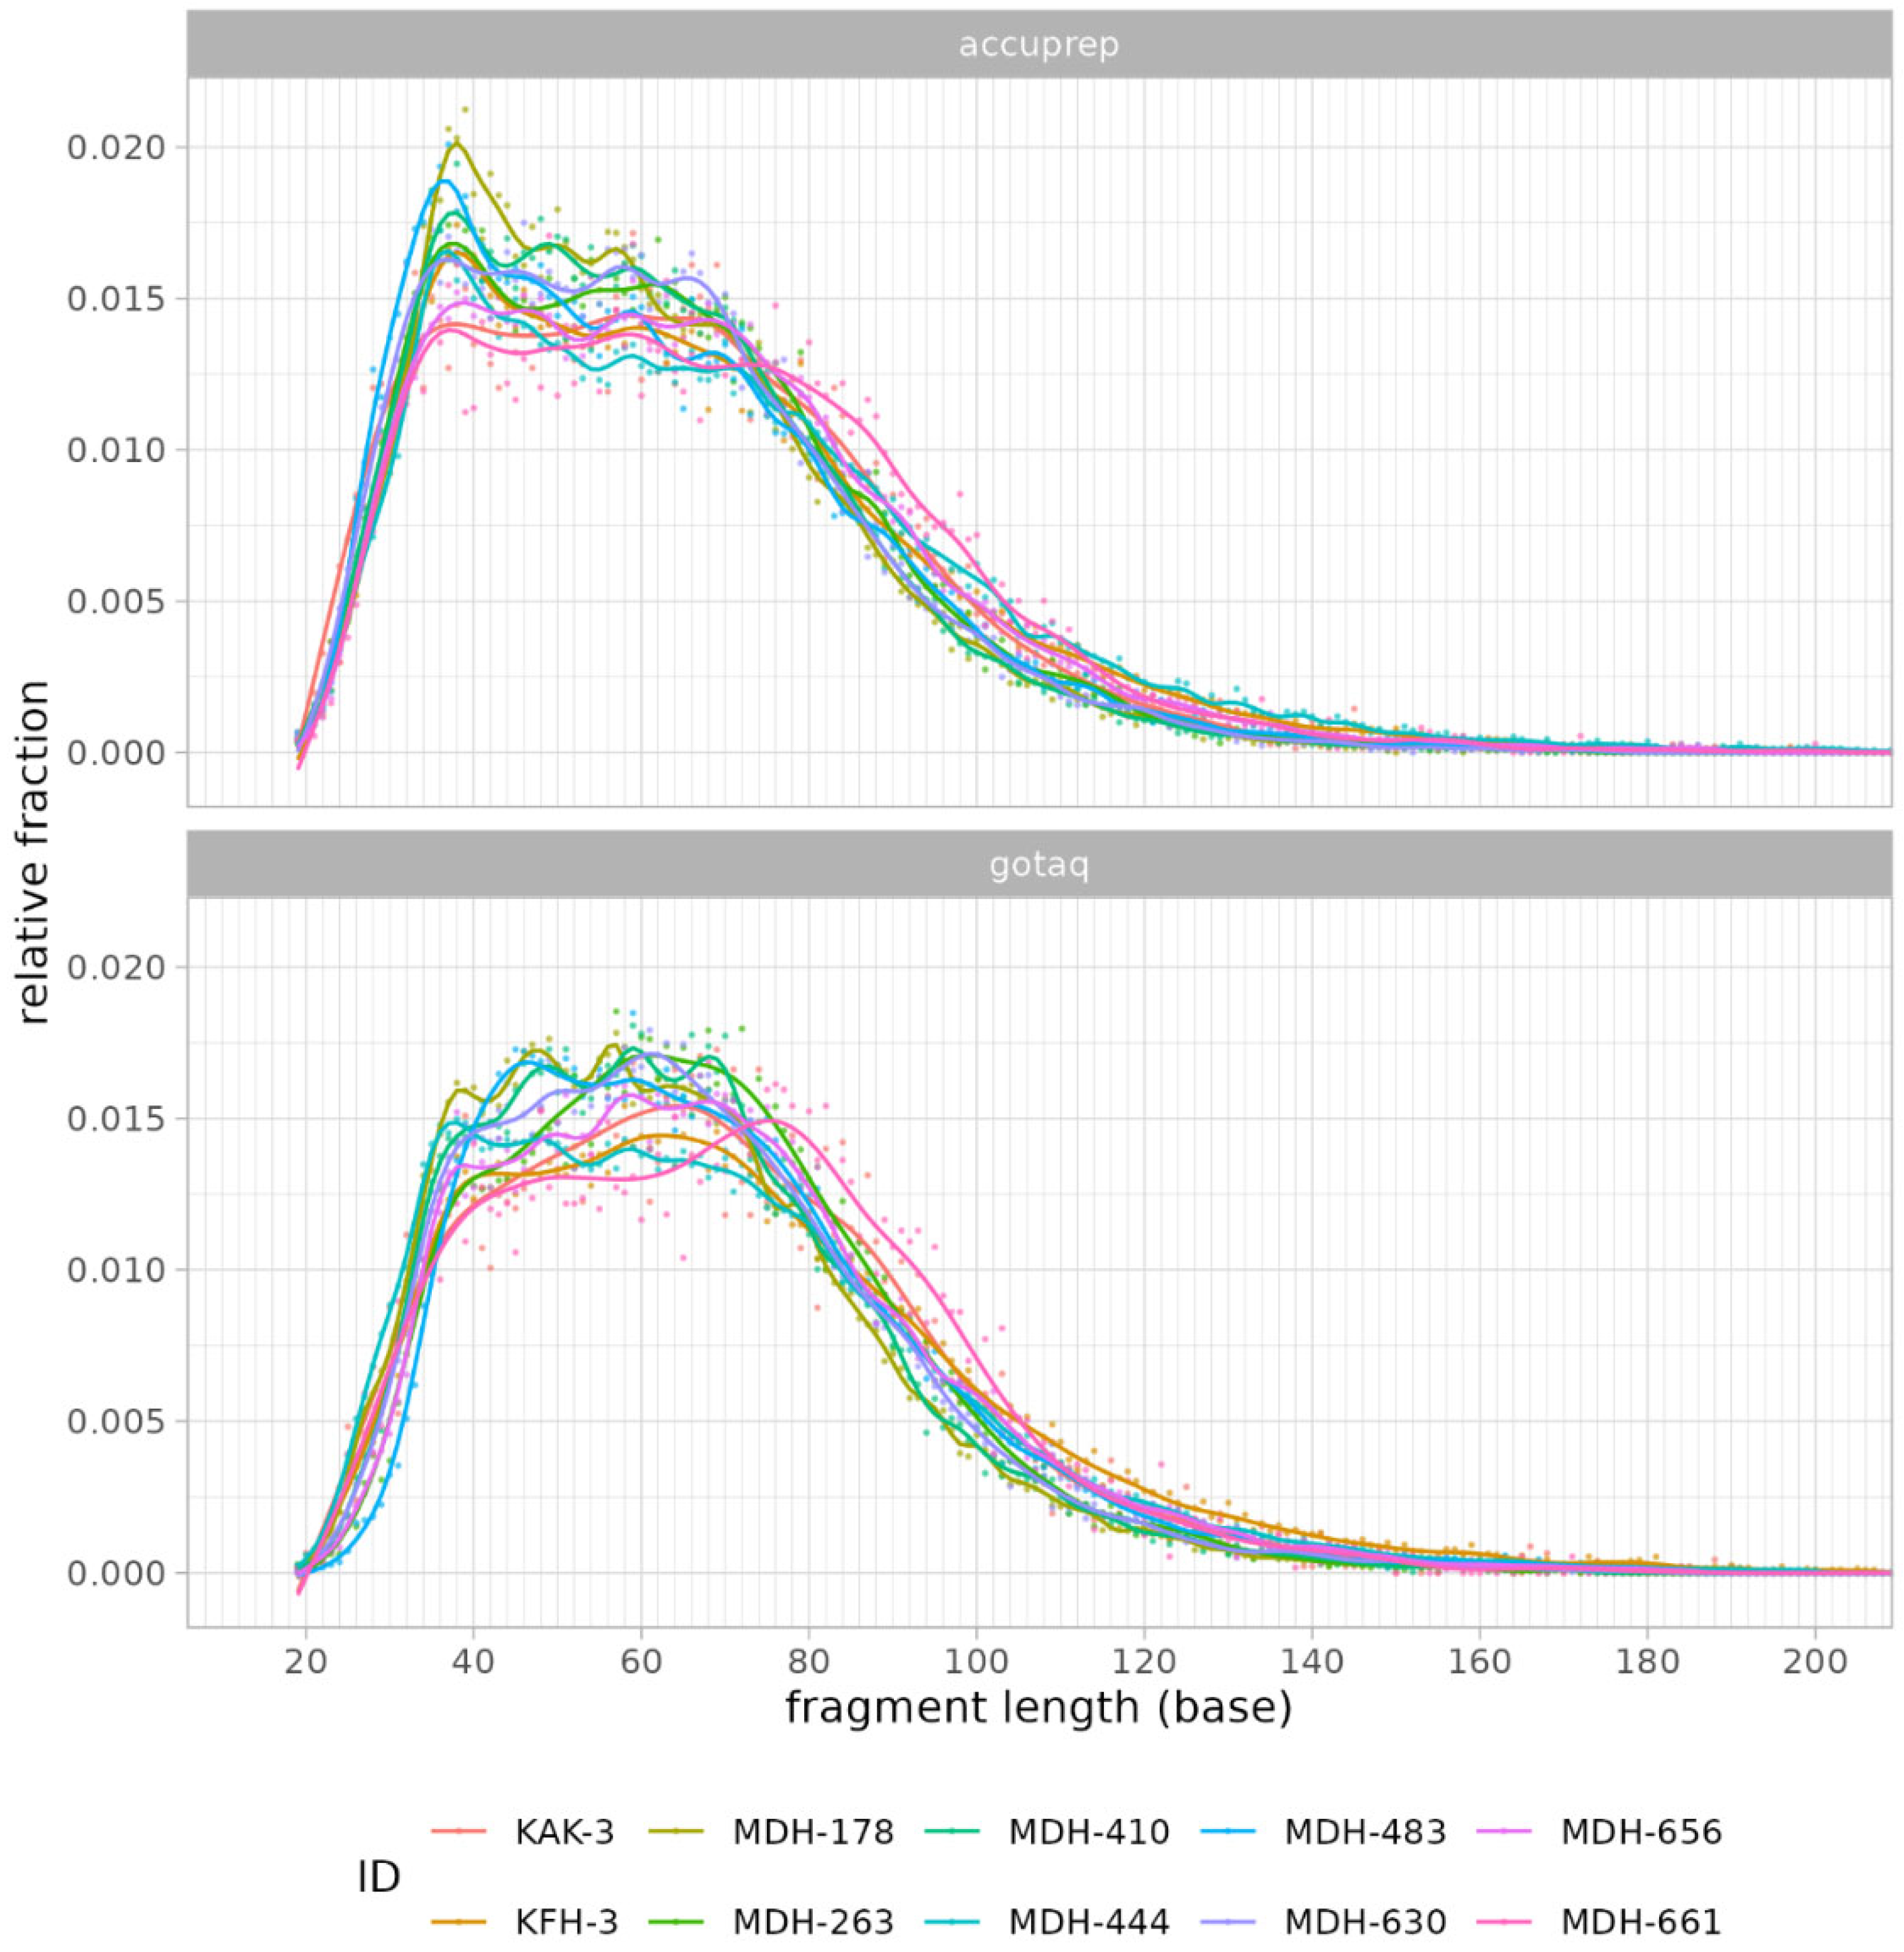
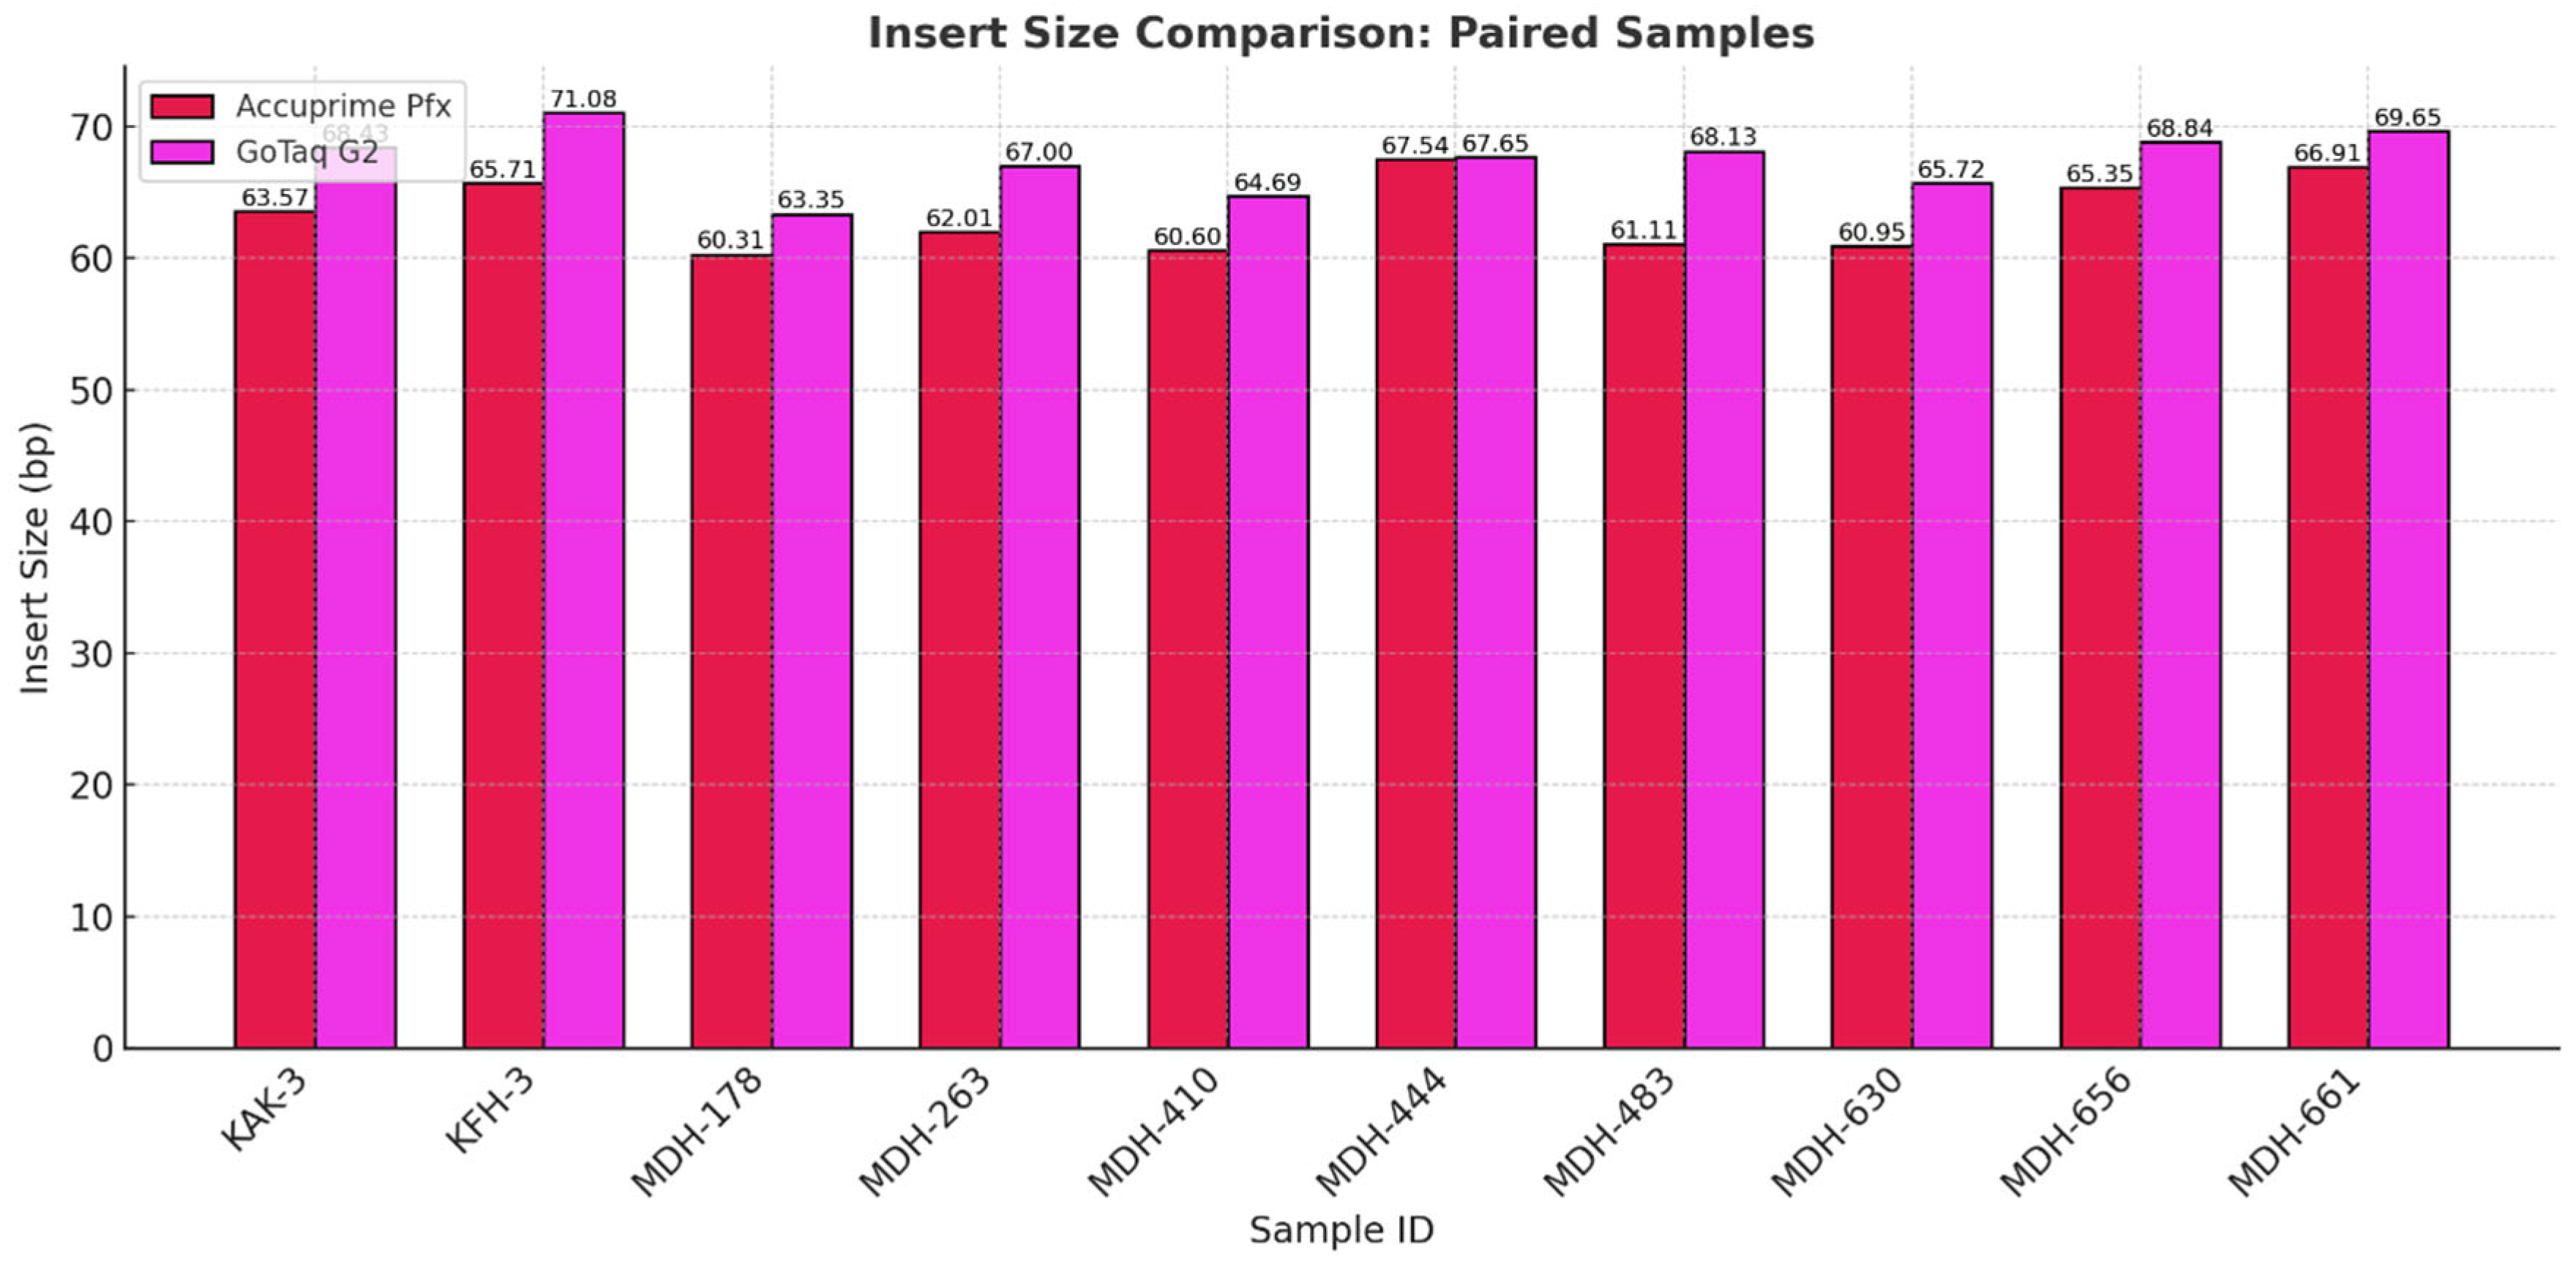
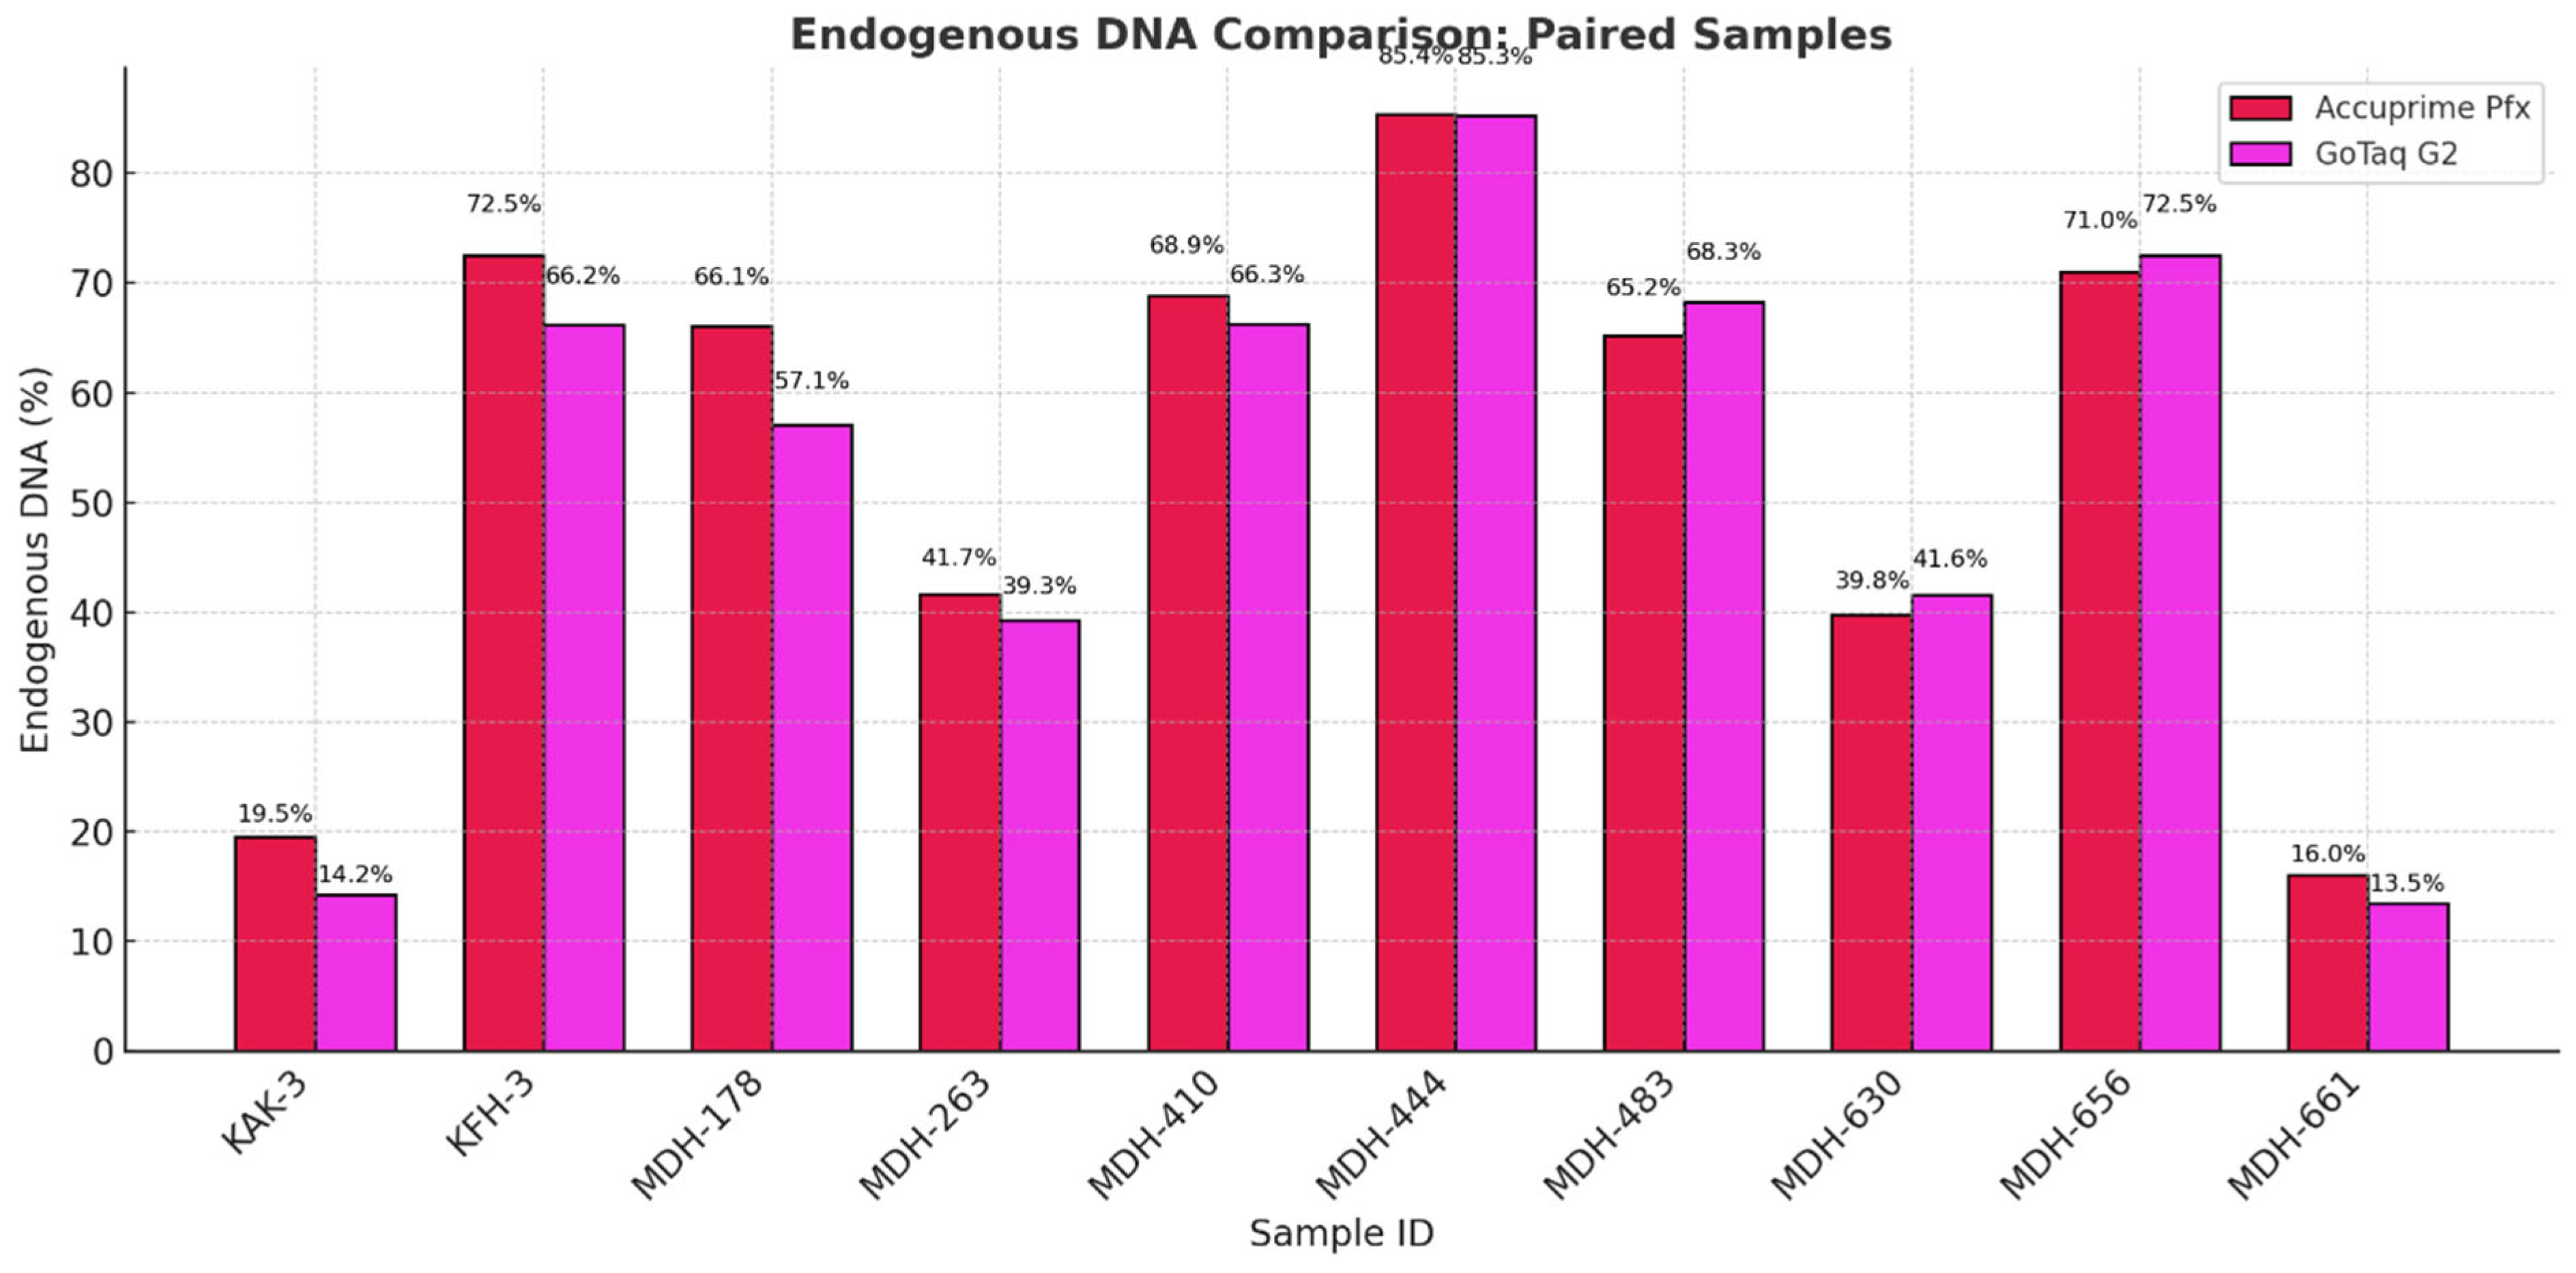
Figure 14 illustrates the fragment length distribution of the libraries created by the two enzymes. We can observe a similar overall shape in the graphs, with most of the fragments clustering between 50 and 100 base pairs. However, minor differences can be observed in the peak distributions. AccuPrime Pfx resulted in a slightly earlier peak around 40–50 base pairs, while GoTaq G2 peaked later, closer to 60–70 base pairs. This result suggests that AccuPrime Pfx generates slightly shorter fragments compared to GoTaq G2. This observation aligns with previous analyses that indicated that GoTaq G2 yields slightly larger average insert sizes, which also can be seen in Figure 15 below. Furthermore, as seen in Figure 16, the endogenous DNA percentages show little to no difference between the two polymerases.
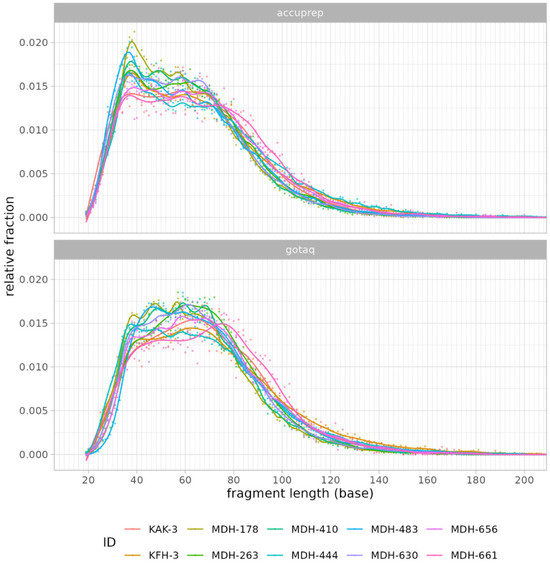
Figure 14.
The graph represents the distribution of fragment lengths for the two enzyme types: AccuPrime Pfx and GoTaq G2, using LC sequencing data.
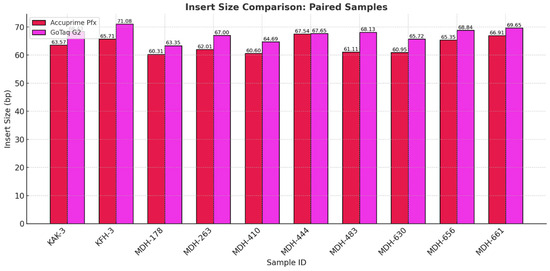
Figure 15.
Average insert sizes of each sample pair comparing the two different enzymes we used in the third phase of the study.

Figure 16.
Endogenous DNA percentage of each sample pair comparing the two different enzymes we used in the third phase of the study.
The results showed that, mostly, the cost-effectiveness of the two enzyme becomes a consideration for research groups. While AccuPrime Pfx gives a marginal benefit compared to GoTaq G2, the price difference can be critical in economic decision making. A slightly higher endogenous DNA recovery and better number of duplicate percentages may not always justify its additional cost. However, AccuPrime Pfx might still hold value for certain scenarios over the GoTaq G2, particularly when working with highly degraded or scarce aDNA samples.
4. Discussion
In the first phase of the study, we analyzed the data we generated by working with more than 2000 archaic samples. We explored LC and HC data for the ratio of endogenous DNA, which is a key metric indicating sample preservation. Our findings validate the use of LC data to assess sample quality and prioritize samples for further analysis. We demonstrated, as previous studies showed, that the petrosa bone is the superior source of aDNA in terms of endogenous DNA. While we did not see big significant differences, and all the libraries ranged mostly in the same range of endogenous DNA, we can observe that the highest means of endogenous DNA ratio can be observed in the libraries made by GoTaq G2 enzyme, followed by libraries made with the extra preamplification step and then libraries made with the Accuprime Pfx enzyme. It is not necessary to create immortalized libraries anymore, so preamplification can be eliminated from the library preparation.
Library complexity is an important metric for the quality of a library. Our results indicated that LC data can provide only a very rough approximation of library complexity trends. This is a valuable insight into sample quality before HC sequencing. However, relying only on LC data, we would not recommend estimating HC library complexity. While the LC ratio of endogenous reads provides a reliable measure of sample authenticity even for HC sequencing, the LC library complexity may not reflect properly on the actual genomic diversity and complexity of the aDNA libraries.
Phase two of the study suggests that AccuPrime Pfx and GoTaq G2 polymerases perform similarly in the context of ancient DNA workflow, offering comparable levels of efficiency and reliability. The choice of the sample source and the purification method, however, can impact the success and result of the downstream analysis. Pars petrosa’s consistently higher yield compared to teeth suggests its superior preservation potential for aDNA. Furthermore, the MinElute purification method proved to recover longer DNA fragments compared to the handmade silica methods, which purify shorter DNA fragments.
In the last phase of the study, the performance of AccuPrime Pfx and GoTaq G2 polymerases was investigated, focusing on their relative efficiency and cost-effectiveness in aDNA workflows. Both enzymes resulted in a similar endogenous DNA recovery with minor differences in their fragment length distribution. AccuPrime Pfx generated slightly shorter and more consistent fragments, while GoTaq G2 produced slightly larger ones. Given the significant cost difference of these two enzymes, GoTaq G2 offers an economical alternative for routine studies without compromising performance. AccuPrime Pfx remains valuable for projects demanding higher precision where ancient samples are degraded or limited. The choice between the two depends on the project’s budget and specific requirements.
Supplementary Materials
The following supporting information can be downloaded at https://www.mdpi.com/article/10.3390/dna5020026/s1.
Author Contributions
B.K.: methodology, data curation, visualization, writing; A.G.: methodology; P.K.: methodology; K.M.: methodology; O.S.: data curation and visualization; G.I.B.V.: methodology; E.N.: supervision. All authors have read and agreed to the published version of the manuscript.
Funding
This research received no external funding.
Institutional Review Board Statement
Not applicable.
Informed Consent Statement
Not applicable.
Data Availability Statement
The data supporting the findings of this study are contained within the article and the Supplementary Materials. All necessary information for reproducing the experiments is provided. Further inquiries can be directed to the corresponding author.
Acknowledgments
We would like to say thank you to Tibor Török and Zoltán Maróti, who supported us during this study. We are grateful to the Institute of Hungarian Research for their support. We thank Peter Nagy, who helped us with his suggestions during the analysis and writing of this article.
Conflicts of Interest
The authors declare no conflicts of interest.
Abbreviations
The following abbreviations are used in this manuscript:
| LC | Low coverage |
| HC | High coverage |
| aDNA | archaic DNA |
References
- Rohland, N.; Hofreiter, M. Ancient Dna Extraction from Bones and Teeth. Nat. Protoc. 2007, 2, 1756–1762. [Google Scholar] [CrossRef] [PubMed]
- Cooper, A. Ancient DNA: Do It Right or Not at All. Science 2000, 5482, 416. [Google Scholar] [CrossRef] [PubMed]
- Orlando, L.; Allaby, R.; Skoglund, P.; Der Sarkissian, C.; Stockhammer, P.W.; Ávila-Arcos, M.C.; Fu, Q.; Krause, J.; Willerslev, E.; Stone, A.C.; et al. Ancient DNA Analysis. Nat. Rev. Methods Primers 2021, 1, 14. [Google Scholar] [CrossRef]
- Prüfer, K.; Stenzel, U.; Hofreiter, M.; Pääbo, S.; Kelso, J.; Green, R.E. Computational Challenges in the Analysis of Ancient DNA. Genome Biol. 2010, 11, R47. [Google Scholar] [CrossRef] [PubMed]
- Picard Tools—By Broad Institute. Available online: http://broadinstitute.github.io/picard/index.html (accessed on 13 October 2024).
- Fulton, T.L. Setting Up an Ancient DNA Laboratory. In Ancient DNA: Methods and Protocols; Shapiro, B., Hofreiter, M., Eds.; Humana Press: Totowa, NJ, USA, 2012; pp. 1–11. ISBN 978-1-61779-516-9. [Google Scholar]
- Knapp, M.; Clarke, A.C.; Horsburgh, K.A.; Matisoo-Smith, E.A. Setting the Stage—Building and Working in an Ancient DNA Laboratory. Ann. Anat.-Anat. Anz. 2012, 194, 3–6. [Google Scholar] [CrossRef] [PubMed]
- Adler, C.J.; Haak, W.; Donlon, D.; Cooper, A. Survival and Recovery of DNA from Ancient Teeth and Bones. J. Archaeol. Sci. 2011, 38, 956–964. [Google Scholar] [CrossRef]
- Campos, P.F.; Craig, O.E.; Turner-Walker, G.; Peacock, E.; Willerslev, E.; Gilbert, M.T.P. DNA in Ancient Bone—Where Is It Located and How Should We Extract It? Ann. Anat.-Anat. Anz. 2012, 194, 7–16. [Google Scholar] [CrossRef]
- Benoit, J.-N.; Quatrehomme, G.; Carle, G.F.; Pognonec, P. An Alternative Procedure for Extraction of DNA from Ancient and Weathered Bone Fragments. Med. Sci. Law 2013, 53, 100–106. [Google Scholar] [CrossRef] [PubMed]
- Harney, É.; Cheronet, O.; Fernandes, D.M.; Sirak, K.; Mah, M.; Bernardos, R.; Adamski, N.; Broomandkhoshbacht, N.; Callan, K.; Lawson, A.M.; et al. A Minimally Destructive Protocol for DNA Extraction from Ancient Teeth. Genome Res. 2021, 31, 472–483. [Google Scholar] [CrossRef] [PubMed]
- Gamba, C.; Jones, E.R.; Teasdale, M.D.; McLaughlin, R.L.; Gonzalez-Fortes, G.; Mattiangeli, V.; Domboróczki, L.; Kővári, I.; Pap, I.; Anders, A.; et al. Genome Flux and Stasis in a Five Millennium Transect of European Prehistory. Nat. Commun. 2014, 5, 5257. [Google Scholar] [CrossRef] [PubMed]
- Rohland, N.; Hofreiter, M. Comparison and Optimization of Ancient DNA Extraction. BioTechniques 2007, 42, 343–352. [Google Scholar] [CrossRef] [PubMed]
- Kircher, M. Analysis of High-Throughput Ancient DNA Sequencing Data. In Ancient DNA: Methods and Protocols; Shapiro, B., Hofreiter, M., Eds.; Humana Press: Totowa, NJ, USA, 2012; pp. 197–228. ISBN 978-1-61779-516-9. [Google Scholar]
- Meyer, M.; Kircher, M. Illumina Sequencing Library Preparation for Highly Multiplexed Target Capture and Sequencing. Cold Spring Harb. Protoc. 2010, 2010, pdb.prot5448. [Google Scholar] [CrossRef]
- Rohland, N.; Harney, E.; Mallick, S.; Nordenfelt, S.; Reich, D. Partial Uracil–DNA–Glycosylase Treatment for Screening of Ancient DNA. Philos. Trans. R. Soc. B Biol. Sci. 2015, 370, 20130624. [Google Scholar] [CrossRef]
- Orlando, L.; Gilbert, M.T.P.; Willerslev, E. Reconstructing Ancient Genomes and Epigenomes. Nat. Rev. Genet. 2015, 16, 395–408. [Google Scholar] [CrossRef] [PubMed]
- Dabney, J.; Meyer, M. Extraction of Highly Degraded DNA from Ancient Bones and Teeth. Methods Mol. Biol. 2019, 1963, 25–29. [Google Scholar] [CrossRef] [PubMed]
- Kousathanas, A.; Leuenberger, C.; Link, V.; Sell, C.; Burger, J.; Wegmann, D. Inferring Heterozygosity from Ancient and Low Coverage Genomes. Genetics 2017, 205, 317–332. [Google Scholar] [CrossRef] [PubMed]
- Maria, A. Nieves-Colón Comparison of Two Ancient DNA Extraction Protocols for Skeletal Remains from Tropical Environments. Available online: https://onlinelibrary.wiley.com/doi/10.1002/ajpa.23472 (accessed on 19 February 2025).
- Pinhasi, R.; Fernandes, D.; Sirak, K.; Novak, M.; Connell, S.; Alpaslan-Roodenberg, S.; Gerritsen, F.; Moiseyev, V.; Gromov, A.; Raczky, P.; et al. Optimal Ancient DNA Yields from the Inner Ear Part of the Human Petrous Bone. PLoS ONE 2015, 10, e0129102. [Google Scholar] [CrossRef] [PubMed]
- Hansen, H.B.; Damgaard, P.B.; Margaryan, A.; Stenderup, J.; Lynnerup, N.; Willerslev, E.; Allentoft, M.E. Comparing Ancient DNA Preservation in Petrous Bone and Tooth Cementum. PLoS ONE 2017, 12, e0170940. [Google Scholar] [CrossRef] [PubMed]
- Römpler, H.; Dear, P.H.; Krause, J.; Meyer, M.; Rohland, N.; Schöneberg, T.; Spriggs, H.; Stiller, M.; Hofreiter, M. Multiplex Amplification of Ancient DNA. Nat. Protoc. 2006, 1, 720–728. [Google Scholar] [CrossRef] [PubMed]


Disclaimer/Publisher’s Note: The statements, opinions and data contained in all publications are solely those of the individual author(s) and contributor(s) and not of MDPI and/or the editor(s). MDPI and/or the editor(s) disclaim responsibility for any injury to people or property resulting from any ideas, methods, instructions or products referred to in the content. |
© 2025 by the authors. Licensee MDPI, Basel, Switzerland. This article is an open access article distributed under the terms and conditions of the Creative Commons Attribution (CC BY) license (https://creativecommons.org/licenses/by/4.0/).