Article

Transcription Factor Inhibition as a Potential Additional Mechanism of Action of Pyrrolobenzodiazepine (PBD) Dimers

by
Julia Mantaj
1,†,
Paul J. M. Jackson
1,
Richard B. Parsons
1,
Tam T. T. Bui
2,
David E. Thurston
1 and
Khondaker Miraz Rahman
1,*
1
Institute of Pharmaceutical Science, King’s College London, 150 Stamford Street, London SE1 9NH, UK
2
Biomolecular Spectroscopy Centre, King’s College London, Guy’s Campus, London SE1 1UL, UK
*
Author to whom correspondence should be addressed.
Current address: School of Applied and Health Sciences, London South Bank University, 103 Borough Road, London SE1 0AA, UK.
Submission received: 24 November 2024 / Revised: 21 January 2025 / Accepted: 24 January 2025 / Published: 5 February 2025

Abstract

:
Background: The pyrrolobenzodiazepine (PBD) dimer SJG-136 reached Phase II clinical trials in ovarian cancer and leukaemia in the UK and USA in the 2000s. Several structural analogues of SJG-136 are currently in clinical development as payloads for Antibody-Drug Conjugates (ADCs). There is growing evidence that PBDs exert their pharmacological effects through inhibition of transcription factors (TFs) in addition to arrest at the replication fork, DNA strand breakage, and inhibition of enzymes including endonucleases and RNA polymerases. Hence, PBDs can be used to target specific DNA sequences to inhibit TFs as a novel anticancer therapy. Objective: To explore the ability of SJG-136 to bind to the cognate sequences of transcription factors using a previously described HPLC/MS method, to obtain preliminary mechanistic evidence of its ability to inhibit transcription factors (TF), and to determine its effect on TF-dependent gene expression. Methods: An HPLC/MS method was used to assess the kinetics and thermodynamics of adduct formation between the PBD dimer SJG-136 and the cognate recognition sequence of the TFs NF-κB, EGR-1, AP-1, and STAT3. CD spectroscopy, molecular dynamics simulations, and gene expression analyses were used to rationalize the findings of the HPLC/MS study. Results: Notable differences in the rate and extent of adduct formation were observed with different DNA sequences, which might explain the variations in cytotoxicity of SJG-136 observed across different tumour cell lines. The differences in adduct formation result in variable downregulation of several STAT3-dependent genes in the human colon carcinoma cell line HT-29 and the human breast cancer cell line MDA-MB-231. Conclusions: SJG-136 can disrupt transcription factor-mediated gene expression, which contributes to its exceptional cytotoxicity in addition to the DNA-strand cleavage initiated by its ability to crosslink DNA.

1. Introduction

Transcription factors (TFs) are proteins that bind to specific DNA sequences, thereby controlling the transcription of genetic information from DNA to RNA [1,2]. As a consequence of the interaction between TFs with their cognate DNA binding sites, the recruitment of RNA polymerase, the enzyme that performs the transcription of genetic information from DNA to RNA, to specific genes, is either blocked or promoted [3]. TFs regulate and control several important processes including cell proliferation, differentia-tion, and apoptosis [4,5,6]. Given the pivotal role of TFs in a wide range of biological cellular processes, it has become increasingly clear that transcriptional misregulation is highly likely to be associated with human diseases [7]. Incorrect regulation and aberrant activity of regulatory TFs due to mutations are strongly linked with disorders including inflammation, viral infections, autoimmune diseases, and malignancies [7]. Uncontrolled TF activation continuously drives cell division, proliferation, and survival through enhanced expression of growth-stimulating gene products [4,5,6], thereby crucially contributing to tumour development and progression. Accordingly, TFs represent a valuable target for the design and development of antitumour strategies that include inhibition of their functional domains or their post-translational modification to terminate their uncontrolled transcriptional activity.
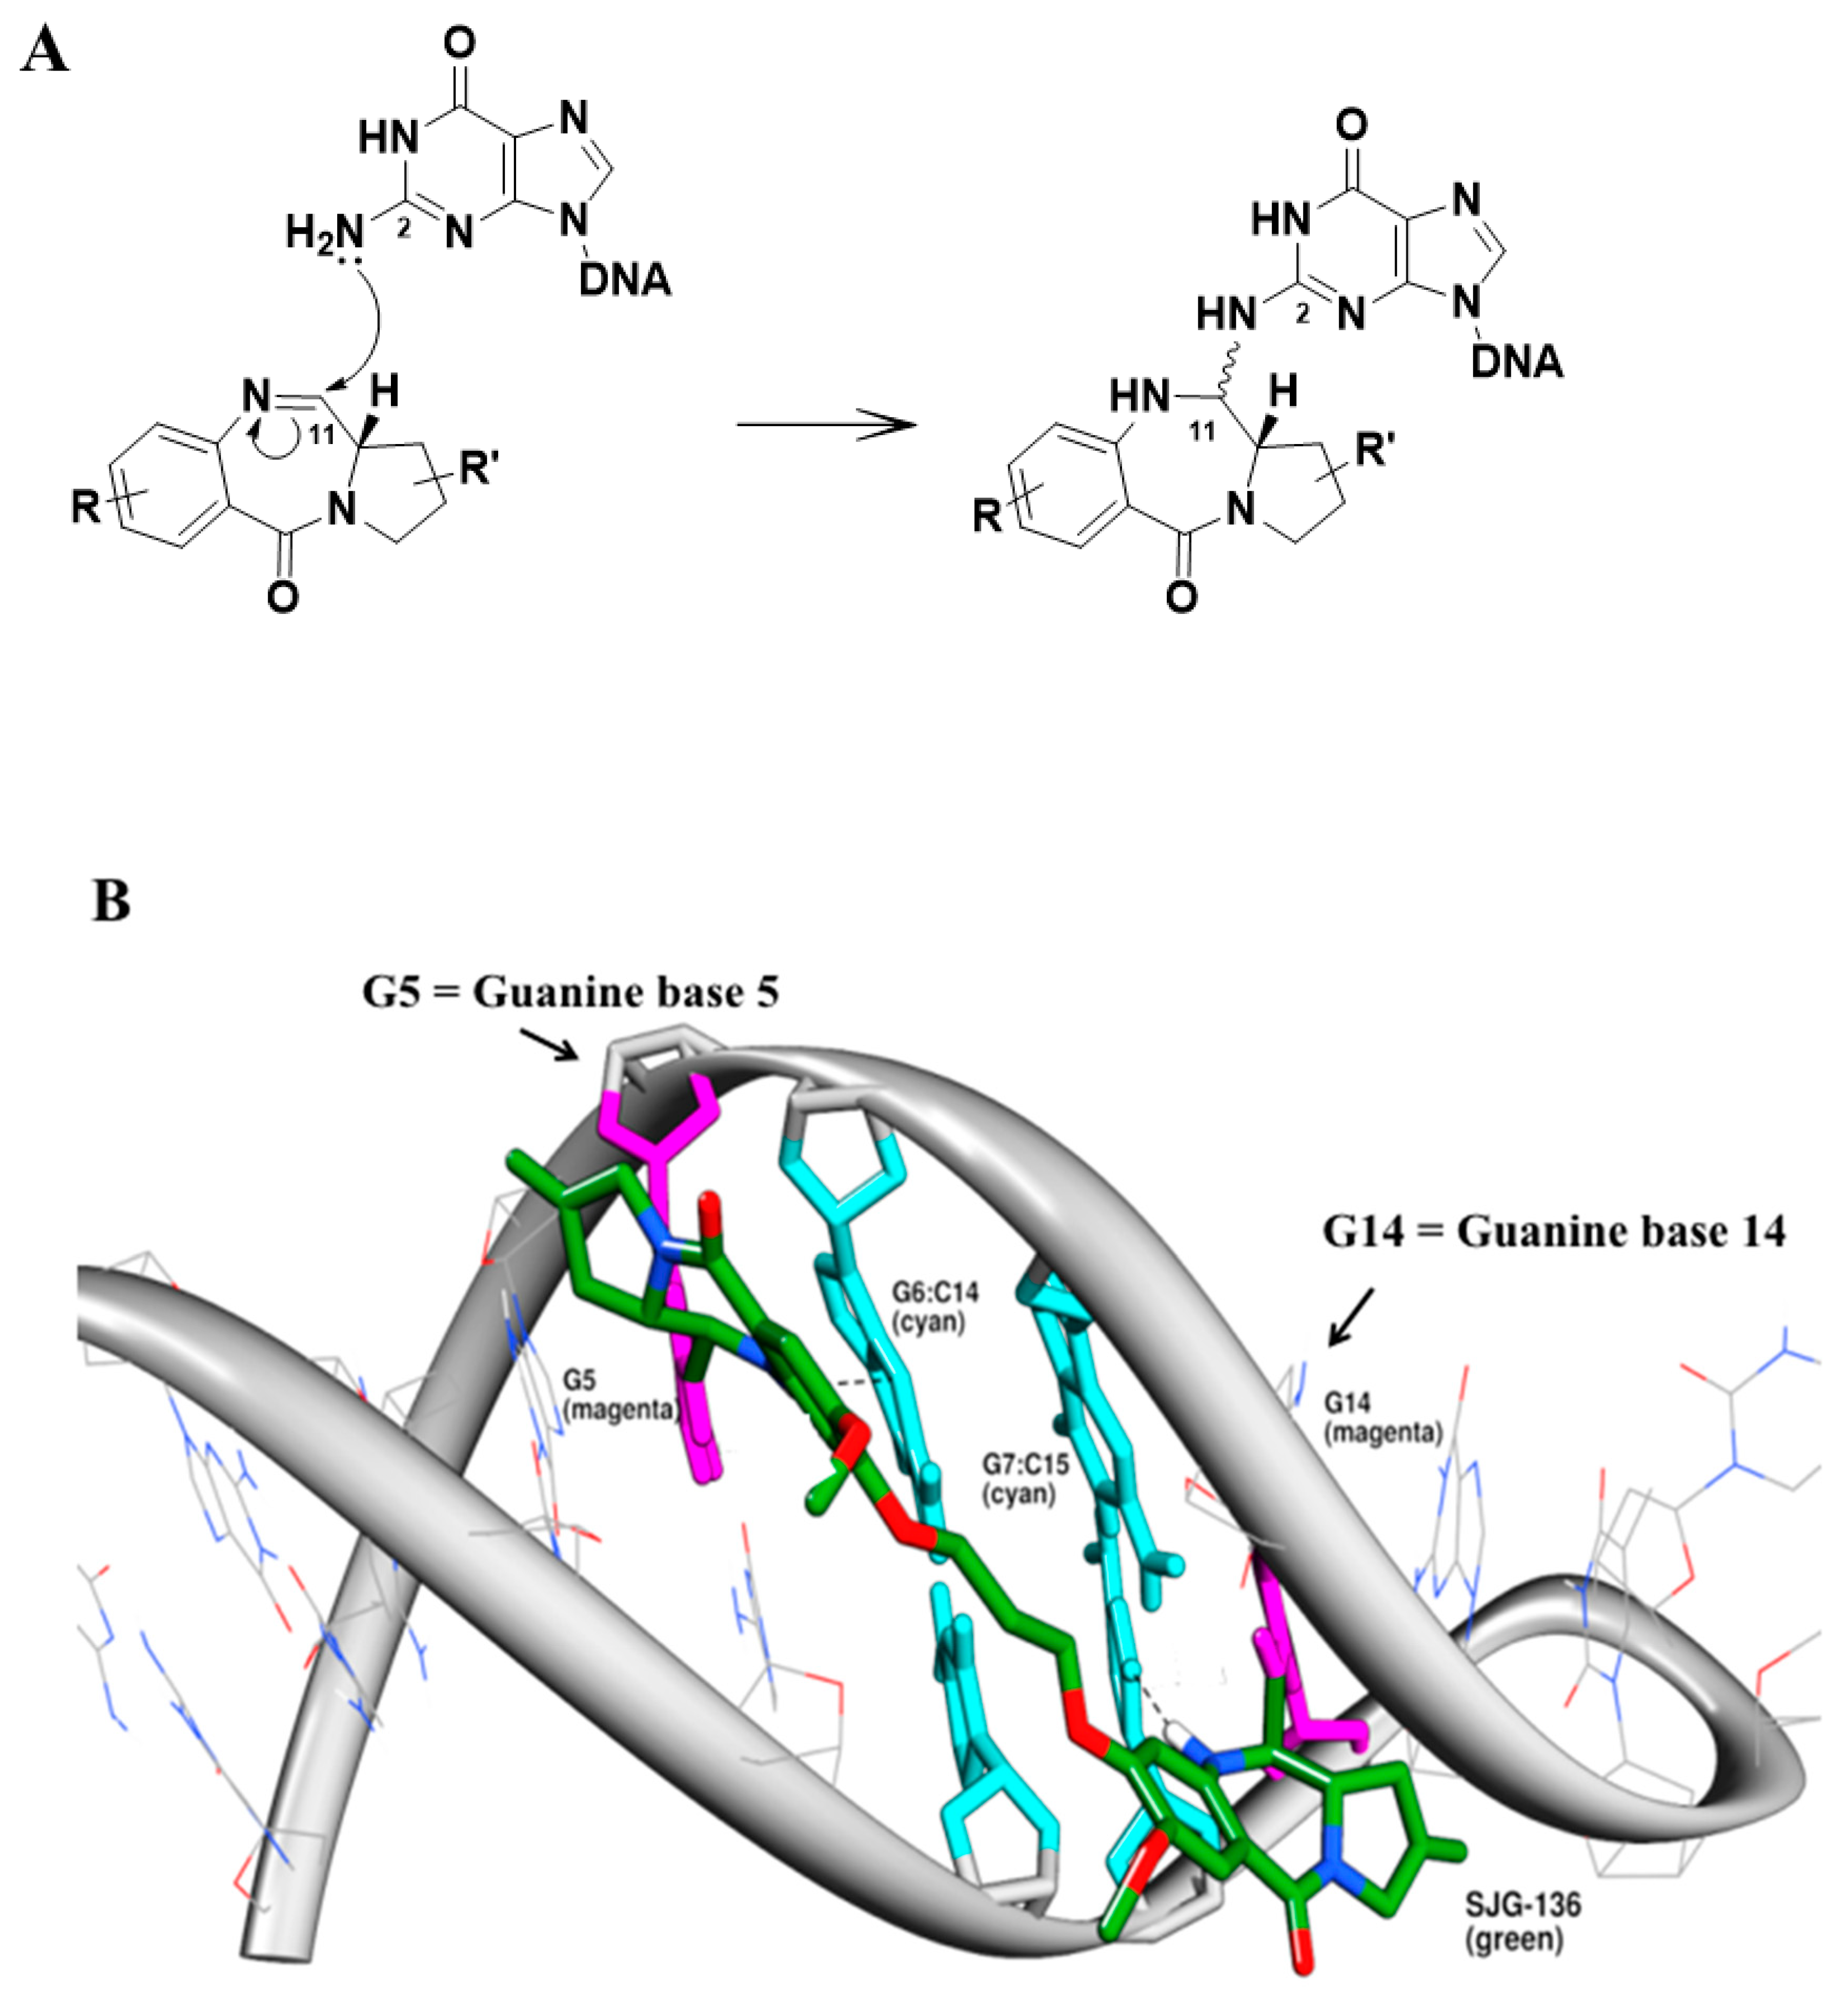
The pyrrolo[2,1-c][1,4]benzodiazepines (PBDs) are synthetic sequence-selective DNA minor groove interacting agents developed from the tricyclic anthramycin (Figure 1A), a member of a family of naturally occurring antitumor antibiotics [8,9]. PBDs contain an S-chiral centre at their C11a position, which provides an appropriate 3D shape for them to fit perfectly within the DNA minor groove [10] (Figure 2). Furthermore, they possess an electrophilic imine moiety at the N10-C11 position that can form a covalent aminal linkage between their C11-position and the C2-NH2 group of a guanine base only when the molecule is secure within the minor groove [10] (Figure 2). A range of synthetic PBDs of extended length has been developed since the discovery of anthramycin in 1965 [11]. For example, attachment of non-covalent minor groove binding components to the C8-position of the PBD A-ring the monomeric PBD GWL-78 [12,13] (Figure 1B) and KMR-28–39 [14] (Figure 1C). The dimerisation of two monomeric PBD units through their C8-position resulted in PBD dimers such as SJG-136 [15] (Figure 1D). The unique structure of PBD dimers allows them to form interstrand or intrastrand DNA cross-links in addition to mono-alkylated adducts [16], thus resulting in greater DNA stabilization [17] compared to monomeric PBDs. These compounds generally have significantly greater cytotoxicity [18] and antitumour activity [19] compared to the PBD monomers. However, PBD monomers have greater antibacterial activity, including activity against Gram-negative bacteria, compared to PBD dimers [20,21,22]. More recently, research has focused on the development of analogues of PBD dimers that can be used as cytotoxic payloads for ADCs [23].
Once covalently bonded to DNA, PBD monomers and dimers have been shown to exert their biological effects in cells through several mechanisms including DNA strand cleavage [24], inhibition of DNA processing enzymes (e.g., endonuclease BamHI [25], RNA polymerase [13] and Ligase I [26]), specific transcription factors (e.g., Sp1 [27], NF-Y [28,29] and NF-κB [14]), and modulation of various signalling pathways (e.g., p53-dependent and -independent apoptogenic [30], JNK/AP-1 [28], VEGF, and SDF1α signalling [31]). A number of these proteins and signalling pathways are upregulated in malignant cells compared to healthy cells, which might explain the anti-tumour activity of PBDs in tumour xenograft models and humans [32]. An increasing body of evidence suggests that PBD monomers mediate their pharmacological effects through transcription factor (TF) inhibition. For example, the PBD monomer GWL-78 (Figure 1B) has been shown to inhibit the NF-Y TF [28], and KMR-28-39 (Figure 1(C) have recently been reported to interact with one or more consensus DNA recognition sites of NF-κB [14]. Based on this, we have studied the interaction of SJG-136 (Figure 1D) with a number of TF consensus sequences using a previously described HPLC/MS study [16], and the results suggest that TF inhibition may contribute to overall antitumour activity and may explain observed differences in cytotoxic potency across various human tumour cell lines. The study involved the initial development of a reversed-phase HPLC/MS method as a tool to evaluate the DNA-binding of PBD monomers GWL-78 and KMR-28-39, both of which had been reported to interact with TF recognition sequences [14,28]. Using custom-designed oligonucleotides containing the cognate sequences of NF-κB, EGR-1, AP-1, and STAT3 TFs, all of which contained ideal GC-rich binding sequences for SJG-136, the HPLC method was used to provide information on both the kinetics and thermodynamics of ad- duct formation. Interestingly, a significant difference in the rate and extent of adduct formation with the different cognate sequences was observed. Furthermore, SJG-136 was found to form different types of adducts with the various TF sequences, demonstrating a clear preference for guanine binding sites within the individual sequences. Subsequent cellular experiments involving polymerase chain reaction (PCR) and quantitative PCR (qPCR) methodologies were carried out to support the HPLC observations made during the biophysical evaluation of SJG-136 with the NF-κB, EGR-1, AP-1, and STAT3 sequences. In these studies, SJG-136 was shown to significantly downregulate a number of AP-1- and STAT3-dependent genes in the human colon carcinoma cell line HT-29 and the human breast cancer cell line MDA-MB-231.
Overall, the findings in this study add significantly to our knowledge of the mechanism of action of SJG-136 and related PBD dimers. PBD dimers are one of the major classes of payloads for ADCs, and several ADCs containing PBD dimer payloads are currently in pre-clinical and clinical development. Recently, the FDA has approved Zynlonta, an ADC that utilises PBD dimer Tesirine (Figure 1E) as the payload. Another structurally related PBD dimer, Talirine (Figure 1F), is being used as a payload in several ADCs that are currently in pre- clinical and clinical development [33,34,35,36]. The results reported here provide important new insights into their mechanism of action, which can potentially impact their clinical studies.

2. Materials and Methods

2.1. Working Solutions of Oligonucleotides

Single-stranded hairpin-forming oligonucleotides (19–23 base pairs) were purchased from Eurogentec, Southampton, UK in lyophilised form. Each single-stranded oligonucleotide was dissolved in annealing buffer (10 mM Tris-HCl pH 8.5 [Sigma-Aldrich, Dorset, UK]/50 mM sodium chloride [Fisher Scientific, Loughborough, UK]/1 mM EDTA [Sigma-Aldrich, Dorset, UK]), and 100 mM ammonium acetate (Sigma-Aldrich, Dorset, UK) in a 1:1 ratio to form stock solutions of 1 mM. To ensure hairpin formation, the solutions were heated to 85 °C for 10 min in a heating/cooling block (Grant Bio, Royston, UK). The solutions were then allowed to cool slowly to room temperature followed by storage at −20 °C overnight to ensure completion of the annealing process. Working solutions of hairpin oligonucleotides of 25 µM were prepared by diluting the stored stock solutions with 100 mM ammonium acetate following storage at −20 °C.

2.2. Working Solutions of PBDs (GWL-78, KMR-28-39 and SJG-136)

PBD monomers GWL-78 and KMR-28-39 were synthesised according to literature methods [12,14]. Spirogen Ltd. supplied PBD dimer SJG-136. The identity and purity of all compounds were confirmed by LC-MS analysis, and each compound was found to have 100% purity. The compounds were dissolved in DMSO (Sigma-Aldrich, Dorset, UK) to form stock solutions of 10 mM, which were stored at −20 °C. Working solutions of 100 µM were prepared by diluting the stock solutions with nuclease-free water (Fisher Scientific, Loughborough, UK). The final working solutions were stored at −20 °C and thawed to room temperature when required.

2.3. Preparation of PBD/DNA Complexes

PBD/DNA complexes were prepared in Eppendorf tubes by adding a PBD working solution of 100 µM to a hairpin oligonucleotide working solution of 25 µM in a 4:1 (PBD/DNA) ratio. The mixture was agitated for 5–10 s using a vortex mixer followed by incubation in a heating/cooling block (Grant Bio, Royston, UK) for 24 h at 25 °C before subjecting to ion-pair reversed-phase HPLC and mass spectrometry analysis.

2.4. Ion-Pair Reversed-Phase HPLC

Liquid chromatography was performed on a Dionex UltiMate 3000 system (Thermo Scientific, Loughborough, UK) equipped with a 2.1 × 50 mm XBridge™ OST C18 column packed with 2.5 µm particles (Waters Ltd., Cheshire, UK). The gradient system used for LC analysis consisted of 100 mM triethylammonium bicarbonate (TEAB) (Sigma-Aldrich, Dorset, UK) as buffer A, and 40% acetonitrile (Fisher Scientific, Loughborough, UK) in water (HPLC grade, Fisher Scientific, Loughborough, UK) as buffer B. For buffer A, a 1 M pre-formulated solution TEAB was diluted to the required concentration with HPLC-grade water. The gradient was ramped from 90% A at 0 min to 55% A at 18 min, 20% A at 22 min, and finally to 10% A at 23.5 min. Samples were introduced to the column using a full-loop injection of 50 µL. UV absorbance was monitored at 254 nm. Sample peaks were integrated, and results were expressed as “Area Under the Curve” (AU(C) generated from the package (Chromeleon 7 software Version 7.1.1.1127; Thermo Scientific, Loughborough, UK).

2.5. Matrix-Assisted Laser Desorption/Ionisation Time of Flight (MALDI-TOF) Analysis

PBD/DNA complexes for MALDI-TOF analysis were prepared by adding a PBD working solution (100 µM) to a hairpin DNA solution (25 µM) in a 4:1 ratio (PBD/DNA) followed by incubation at 25 °C for 24 h to ensure maximum PBD/DNA interaction. The covalently bound PBD/DNA adduct samples for MALDI-TOF-MS were diluted with 0.1 M triethylammonium acetate (TEAA) (Sigma-Aldrich, Dorset, UK) in 1:1, 1:4, and 1:10 ratios. A ZipTipC18™ (Millipore, Corporation, Billerica, MA, USA) reversed-phase sample-preparation methodology was used to desalt and concentrate the oligonucleotide samples before MALDI-TOF analysis, as this procedure provided superior data quality. The matrix was composed of 3-hydroxypicolinic acid (Sigma-Aldrich, Dorset, UK) (50 mg/mL in 50% acetonitrile) and dibasic ammonium citrate (Sigma-Aldrich, Dorset, UK) (50 mg/mL in water) mixed in a 9:1 ratio. Desalted PBD/DNA samples were mixed with 0.5 µL matrix, and 0.2 µL aliquots of sample/matrix mixtures were spotted onto the MALDI-TOF target plate (MTP AnchorChip 384TF, Bruker Daltonik, Bremen, Germany) and allowed to air-dry before MALDI-TOF-MS analysis. MALDI-TOF analysis was carried out on a Bruker Daltonics Autoflex (Bruker Daltonik, Bremen, Germany) automated high-throughput MALDI-TOF system with a nitrogen laser in positive linear mode using delayed extraction of 500 ns and an accelerating voltage of 25,000 V. Acquisition was between 1000–10,000 Dalton with 100 shots per spectrum. The instrument was calibrated before sample analysis using insulin as the standard. For this, 1 µL insulin was spotted onto the MALDI-TOF target plate and dried naturally followed by the addition of 1 µL α-Cyano-4-hydroxycinnamic acid (CHCA) matrix. The data was processed using AutoFlex software (Bruker Daltonik, Bremen, Germany).

2.6. Circular Dichroism (CD) Study

2 µL of a 10 mM SJG-136 stock solution was added to 1000 µL of 5 µM oligonucleotide solution (4:1 SJG-136/DNA), and the mixture was incubated for 24 h at 25 °C in a heating/cooling block. For t = 0 h experiments, 2 µL of 10 mM SJG-136 stock solution was added to 1000 µL of 5 µM DNA working solution, and the mixture was analysed by CD immediately. The CD spectra of the hairpin-forming oligonucleotides and SJG-136/DNA complexes were acquired on a Chirascan plus spectrometer (Applied Photophysics Limited, Leatherhead, UK). The instrument was flushed continuously with pure evaporated nitrogen throughout the experiment. The CD spectra were measured between 200–400 nm in a strain-free rectangular 10 mm cell. Spectra were recorded using a 1 nm step size, a 1-s time-per-point, and a spectral bandwidth of 1 nm. All spectra were recorded at 23 °C, and the baseline was buffer (100 mM/20 mM ammonium acetate) corrected. Oligonucleotides were initially measured alone at a final concentration of 5 µM in an appropriate buffer. SJG-136 was added from a 10 mM stock solution in DMSO for a final concentration of 20 µM for a t = 0 experiment, and CD spectra were recorded immediately followed by further analysis after 24 h. Measurements were carried out while maintaining a constant concentration of oligonucleotides. Data were processed using the OriginPro software (Version 7.0), and differences in CD signals were plotted against the wavelength.

2.7. Molecular Modelling

Molecular dynamics simulations were undertaken on SJG-136 both non-covalently and covalently bound to the transcription factor consensus sequences used in the study. The DNA sequence in each case (including the TTT-loop) was constructed using the AMBER [37] module nab. The TTT-loop was covalently linked to the backbone of DNA using parameters derived in-house. SJG-136 was then docked in the minor groove using AMBER xleap, parm99SB and modified parmbsc0 [38], and Gaff AMBER force field parameters. Antechamber was used to construct mol2 files through the addition of Gasteiger charges, and missing parameters were generated using parmchk. A covalent bond was generated between the exocyclic amine groups of selected guanines (guided by molecular mechanics calculations [39]), to form either mono-adducts or inter/intra-strand cross-links. Energy minimisation was then undertaken in a gradient manner by initially placing the DNA under a high force constraint (i.e., 500 kcal mol−1 Å−2), which was then reduced in stages to zero to enable the ligand to find its local energy minimum. This was followed by a reduction in force in a periodic manner with a relaxation of restraints. Production simulations in an implicit solvent (GBSA) were run for a period of 10 ns, and atomic coordinates were saved at 1ps intervals. Analysis of molecular dynamics simulations was undertaken using VMD [40] and ptraj, and all models were created using Chimera [41].

2.8. Cell Culture

The human breast cancer cell line MDA-MB-231 (ATCC, Manassas, VA, USA) and the human colon carcinoma cell line HT-29 (ATCC, Manassas, VA, USA) were used to evaluate the effects of SGJ-136 on STAT3- and AP-1-dependent gene expression. The cells were grown in normal cell culture conditions at 37 °C under a 5% CO2 humidified atmosphere. MDA-MB-231 cells were maintained in Dulbecco’s modified Eagle’s medium (DMEM Glutamax, Invitrogen, Paisley, UK) supplemented with 10% fetal bovine serum, 1% Penstrep and 1% non-essential amino acids (all Invitrogen, Paisley, UK). HT-29 cells were cultivated in McCoy’s 5A medium (ATCC, Manassas, VA, USA) supplemented with 10% fetal bovine serum, 1% Penstrep, and 1% non-essential amino acids (all Invitrogen, Paisley, UK).

2.9. Drug Treatment

MDA-MB-231 and HT-29 cells were seeded (1 × 10⁶ cells/mL) in six-well plates (total volume 1.5 mL) incubated at 37 °C for 24 h. Bacterial lipopolysaccharide (LPS, Sigma-Aldrich, Dorset, UK) was added to the MDA-MB-231 cells at a final concentration of 500 µg/mL followed by incubation for a further 24 h at 37 °C. HT-29 cells were treated with Tumour Necrosis Factor α (TNF-α, Invitrogen, Paisley, UK) at a final concentration of 30 ng/mL and incubated for 24 h at 37 °C. Following this stimulation, SJG-136 was added at a final concentration of 1 µM to both cell lines followed by incubation for 24 h at 37 °C. LPS induces (dose-dependent) activation of NF-κB in tumour cells, and hence the overexpression of NF-κB-dependent genes [42,43]. Therefore, it was chosen to induce overactivation of NF-κB in the MDA-MB-231 cell line. TNF-α has also been shown to promote cell migration and invasion in colon cancer in an NF-κB and AP-1-dependent manner [44].

2.10. RNA Extraction and RT-PCR

Total RNA was extracted from snap-frozen cell pellets using the RNeasy Plus Mini Kit (Qiagen, Hilden, Germany) according to the manufacturer’s instructions. One microgram of total RNA was then reverse-transcribed into cDNA using the High-Capacity RNA-to-cDNA kit (Applied Biosystems, Foster City, CA, USA) using the manufacturer’s protocol provided.

2.11. Polymerase Chain Reaction (PCR)

PCR was performed using specific primers for Bcl-2, cyclin D1, NNMT, STAT3, fascin, VEGF, CREB-5, AP-1 and p53, with GAPDH as a reference gene. All primer sequences are listed in the Supporting Information (SI, Tables S1 and S2). The primers were purchased in lyophilised form from Integrated DNA Technologies, Coralville (Coralville, IA, USA), and were initially diluted with PCR-grade water (Roche Diagnostics, Mannheim, Germany) to form stock solutions of 100 µM. PCR performed in a PCR Sprint thermal cycler (Thermo Scientific, Loughborough, UK) using the following cycle conditions: 94 °C for 5 min, 30 cycles at 94 °C for 30 s, 55 °C for 30 s, and finally 72 °C for 1 min, with a final extension of 72 °C for 5 min. For each gene, a GAPDH control was prepared and run under identical conditions. Confirmation of target gene amplification was performed via gel electrophoresis using a 1.5% TAE-agarose gel. PCR products were stained using 1:20,000 diluted GelRed (Biotium, CA, USA), which was visualised using UV transillumination (Bio-Rad Universal Gel Imaging System, Bio-Rad, Watford, UK). Band size was determined by comparison with a 100 bp control ladder (Invitrogen, Paisley, UK).

2.12. Quantitative Polymerase Chain Reaction (qPCR)

Specific primers used for qPCR were purchased in lyophilised form from Integrated DNA Technologies, Coralville (USA). Primers were diluted with PCR-grade water to form stock solutions of 100 µM. All primer sequences are listed in the Supporting Information (SI, Table S3). UPL probes were supplied by the Genomic Centre, Waterloo Campus, King’s College London. A pooled reference DNA sample was used as a quality control for plate- to-plate variations. This pooled sample was created by mixing 2 µL of each cDNA sample followed by dilution to 200 µL with DEPC (diethylpyrocarbonate)-treated water. From this mixture, a dilution series of 1:10, 1:100, and 1:1000 was prepared that covered the entire range of concentrations measured in the assay. qPCR was performed on an ABI Prism 7000 thermal cycler (Applied Biosystems) using the following cycling conditions: 9 °C for 10 min, followed by 40 cycles at 95 °C for 15 s and 60 °C for 1 min. All samples were run together in triplicate along with their corresponding negative controls. Negative template controls and the pooled reference control DNA were also run on each 384-well plate, and ß-actin was utilised as a reference gene to normalise mRNA expression. Results were analysed using the Data Assist Software Version 3.0 (Applied Biosystems), and gene-expression levels were quantified using the comparative ΔΔCt method. Results were expressed as ΔCt (Ct sample—Ct ß–actin), and the fold-change in gene expression was compared to the untreated sample.

2.13. Statistical Analysis

Statistical analysis was performed using the GraphPad Prism software version 7.0d (GraphPad, La Jolla, CA, USA). p values of <0.5 were considered as significant. Experiments were performed in triplicates and repeated three times to ensure reliability.

3. Results

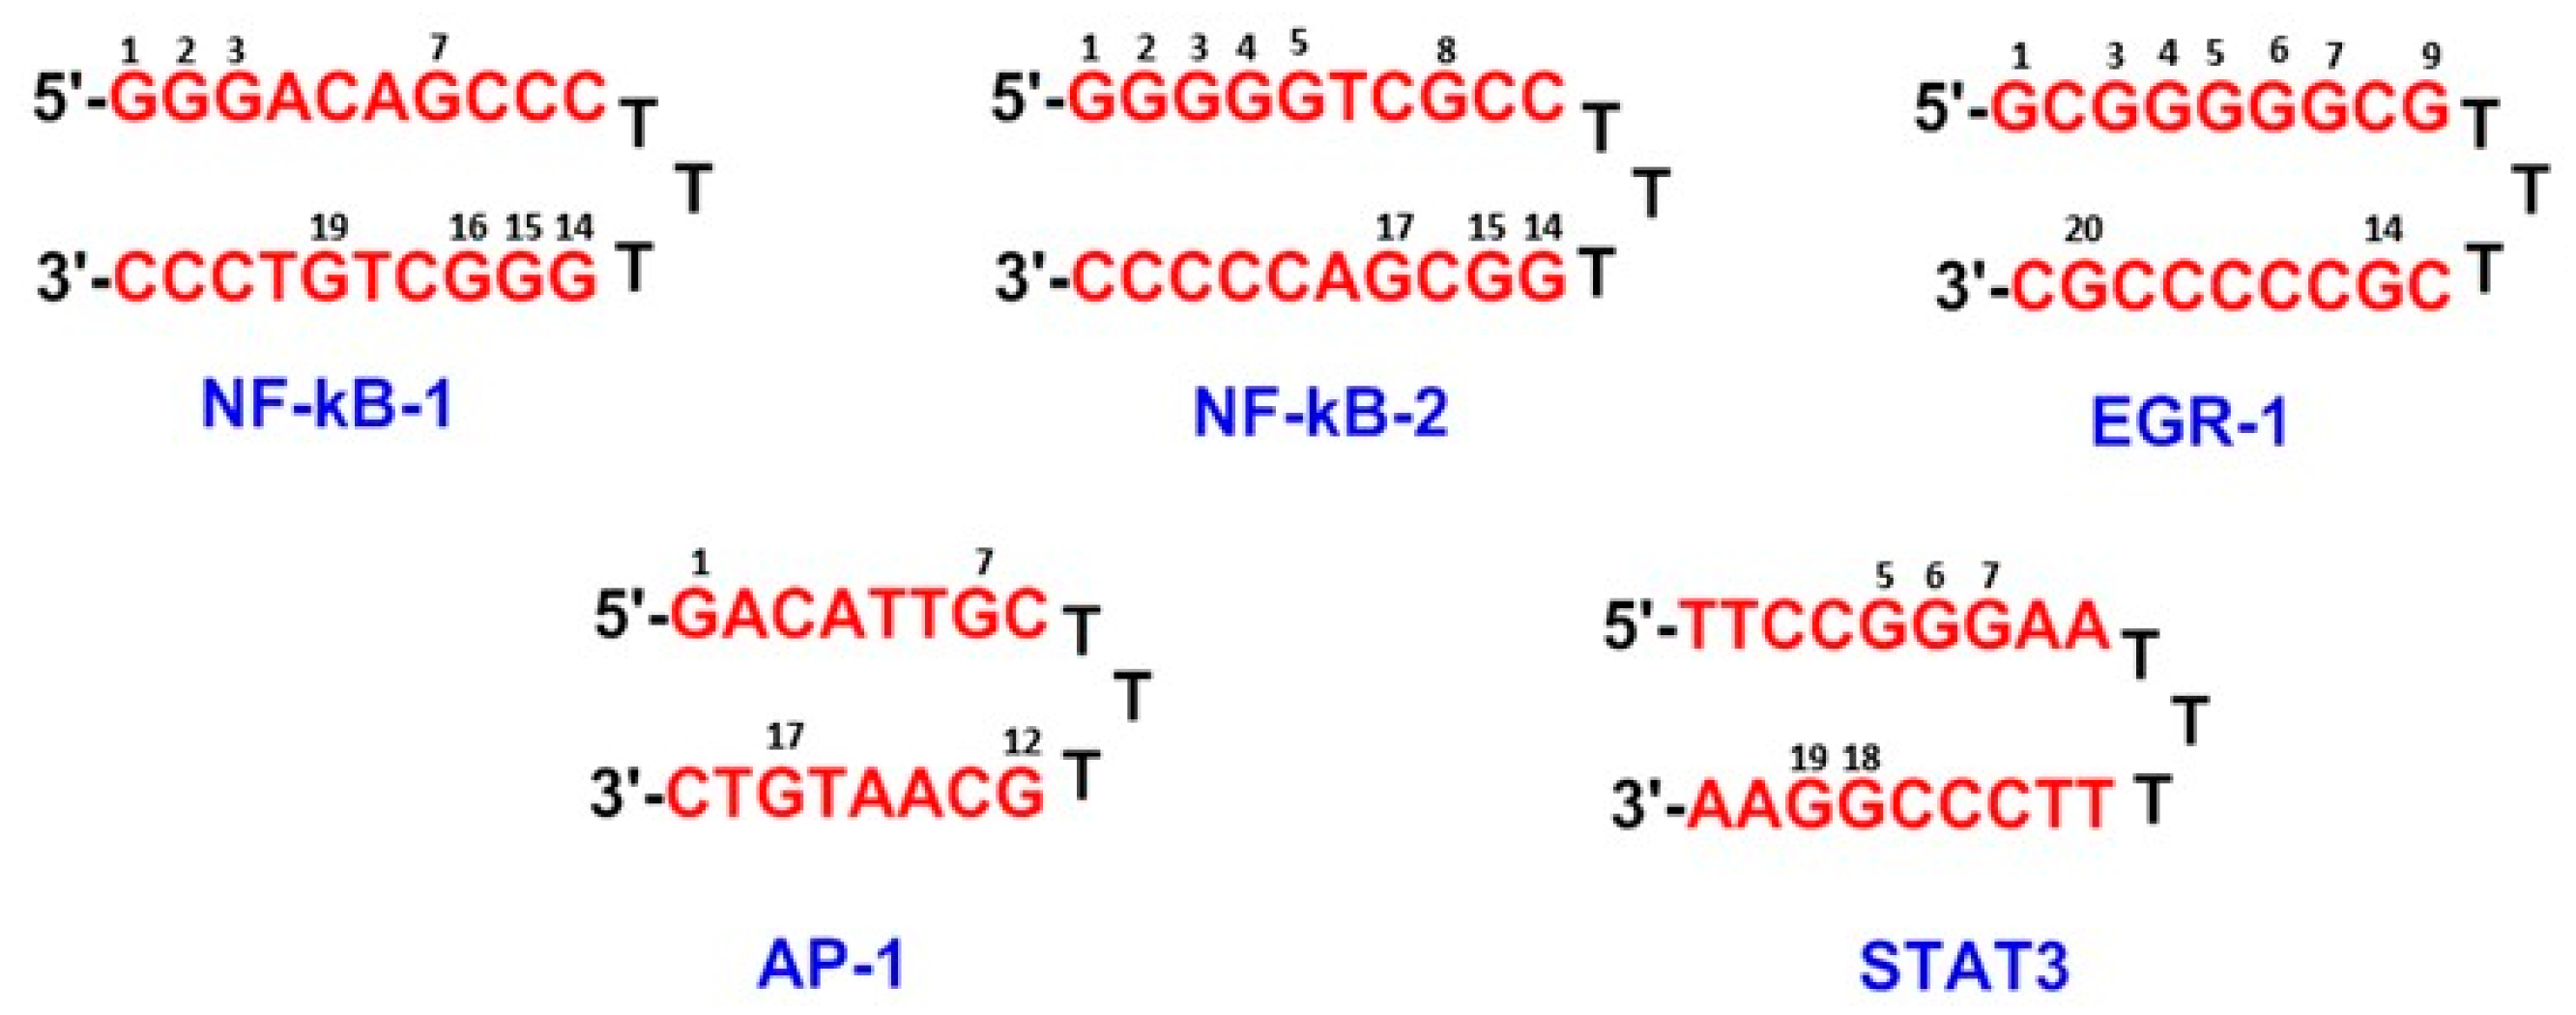
This study aimed to investigate the interaction of the PBD dimer SJG-136 with the cognate sequences of the oncogenic transcription factors NF-κB, EGR-1, AP-1, and STAT3 (Figure 3) using a previously reported HPLC/MS method [16,45]. These transcription factors were selected for this study as they are known to play a crucial role in the development of human malignancies and to be overexpressed in human cancer cell types in which SJG-136 has been demonstrated to be highly cytotoxic [46]. For example, NF-κB is overexpressed in most leukaemic cells, STAT3 in many breast cancer cells, and EGR-1 and AP-1 in ovarian cancer cells with SJG-136 LC50 (median lethal concentration) values ranging from 0.14 to 320 nmol/L [46]. Studies across wider panels of cell lines [19] have demonstrated selectivity toward particular cell lines that cannot be explained through previously reported mechanisms of action such as DNA strand breakage [15], inhibition of enzymes [13], and arrest at the replication fork [13]. Moreover, the NCI 60-cell line screen has revealed an activity pattern for SJG-136 similar to other DNA interactive agents such as melphalan, cyclophosphamide, and chlorambucil. However, overall, its profile did not precisely match with cluster patterns associated with any specific chemotherapeutic agent, thus suggesting a unique mechanism of action for SJG-136. To investigate whether transcription factor inhibition could play a role in the mechanism of action of SJG-136, we utilized an ion pair RP-HPLC methodology to study the interaction of SJG-136 with the hairpin-forming oligonucleotides shown in Figure 3, particularly concerning the extent and rate of adduct formation. The stoichiometry of adducts formed was confirmed by MALDI-TOF-MS analysis based on molecular weight. Circular dichroism (CD) experiments and molecular dynamics simulations were also used to gain insight into adduct formation and support the HPLC/MS observations. Finally, in vitro TF-dependent gene-expression analysis using PCR was carried out to confirm the ability of SJG-136 to inhibit TF-mediated processes in the human breast cancer cell line MDA-MB-231 and the colon carcinoma cell line HT-29.

3.1. HPLC/MS Study

The ion pair RP-HPLC/MS method was initially validated by studying the interaction of the PBD monomers GWL-78 and KMR-28-39 with the cognate sequences of the transcription factors NF-κB, EGR-1, AP-1, and STAT3 (Figure 3), as these molecules have been previously shown to interact with these consensus transcription factor sequences through a mono-covalent binding mechanism [14,28].
Working solutions of 100 µM GWL-78 and KMR-28-39 were added to a DNA working solution of 25 µM in a 4:1 ratio (PBD/DNA). The mixtures were then incubated at 25 °C for 24 h and subjected to RP-HPLC and MALDI-TOF analysis. The results confirmed that both ligands could bind covalently to the sequences studied and that the HPLC and MALDI-TOF-MS methodologies were capable of evaluating both the rate and extent of adduct formation and the stoichiometry (SI, Figures S1–S10).
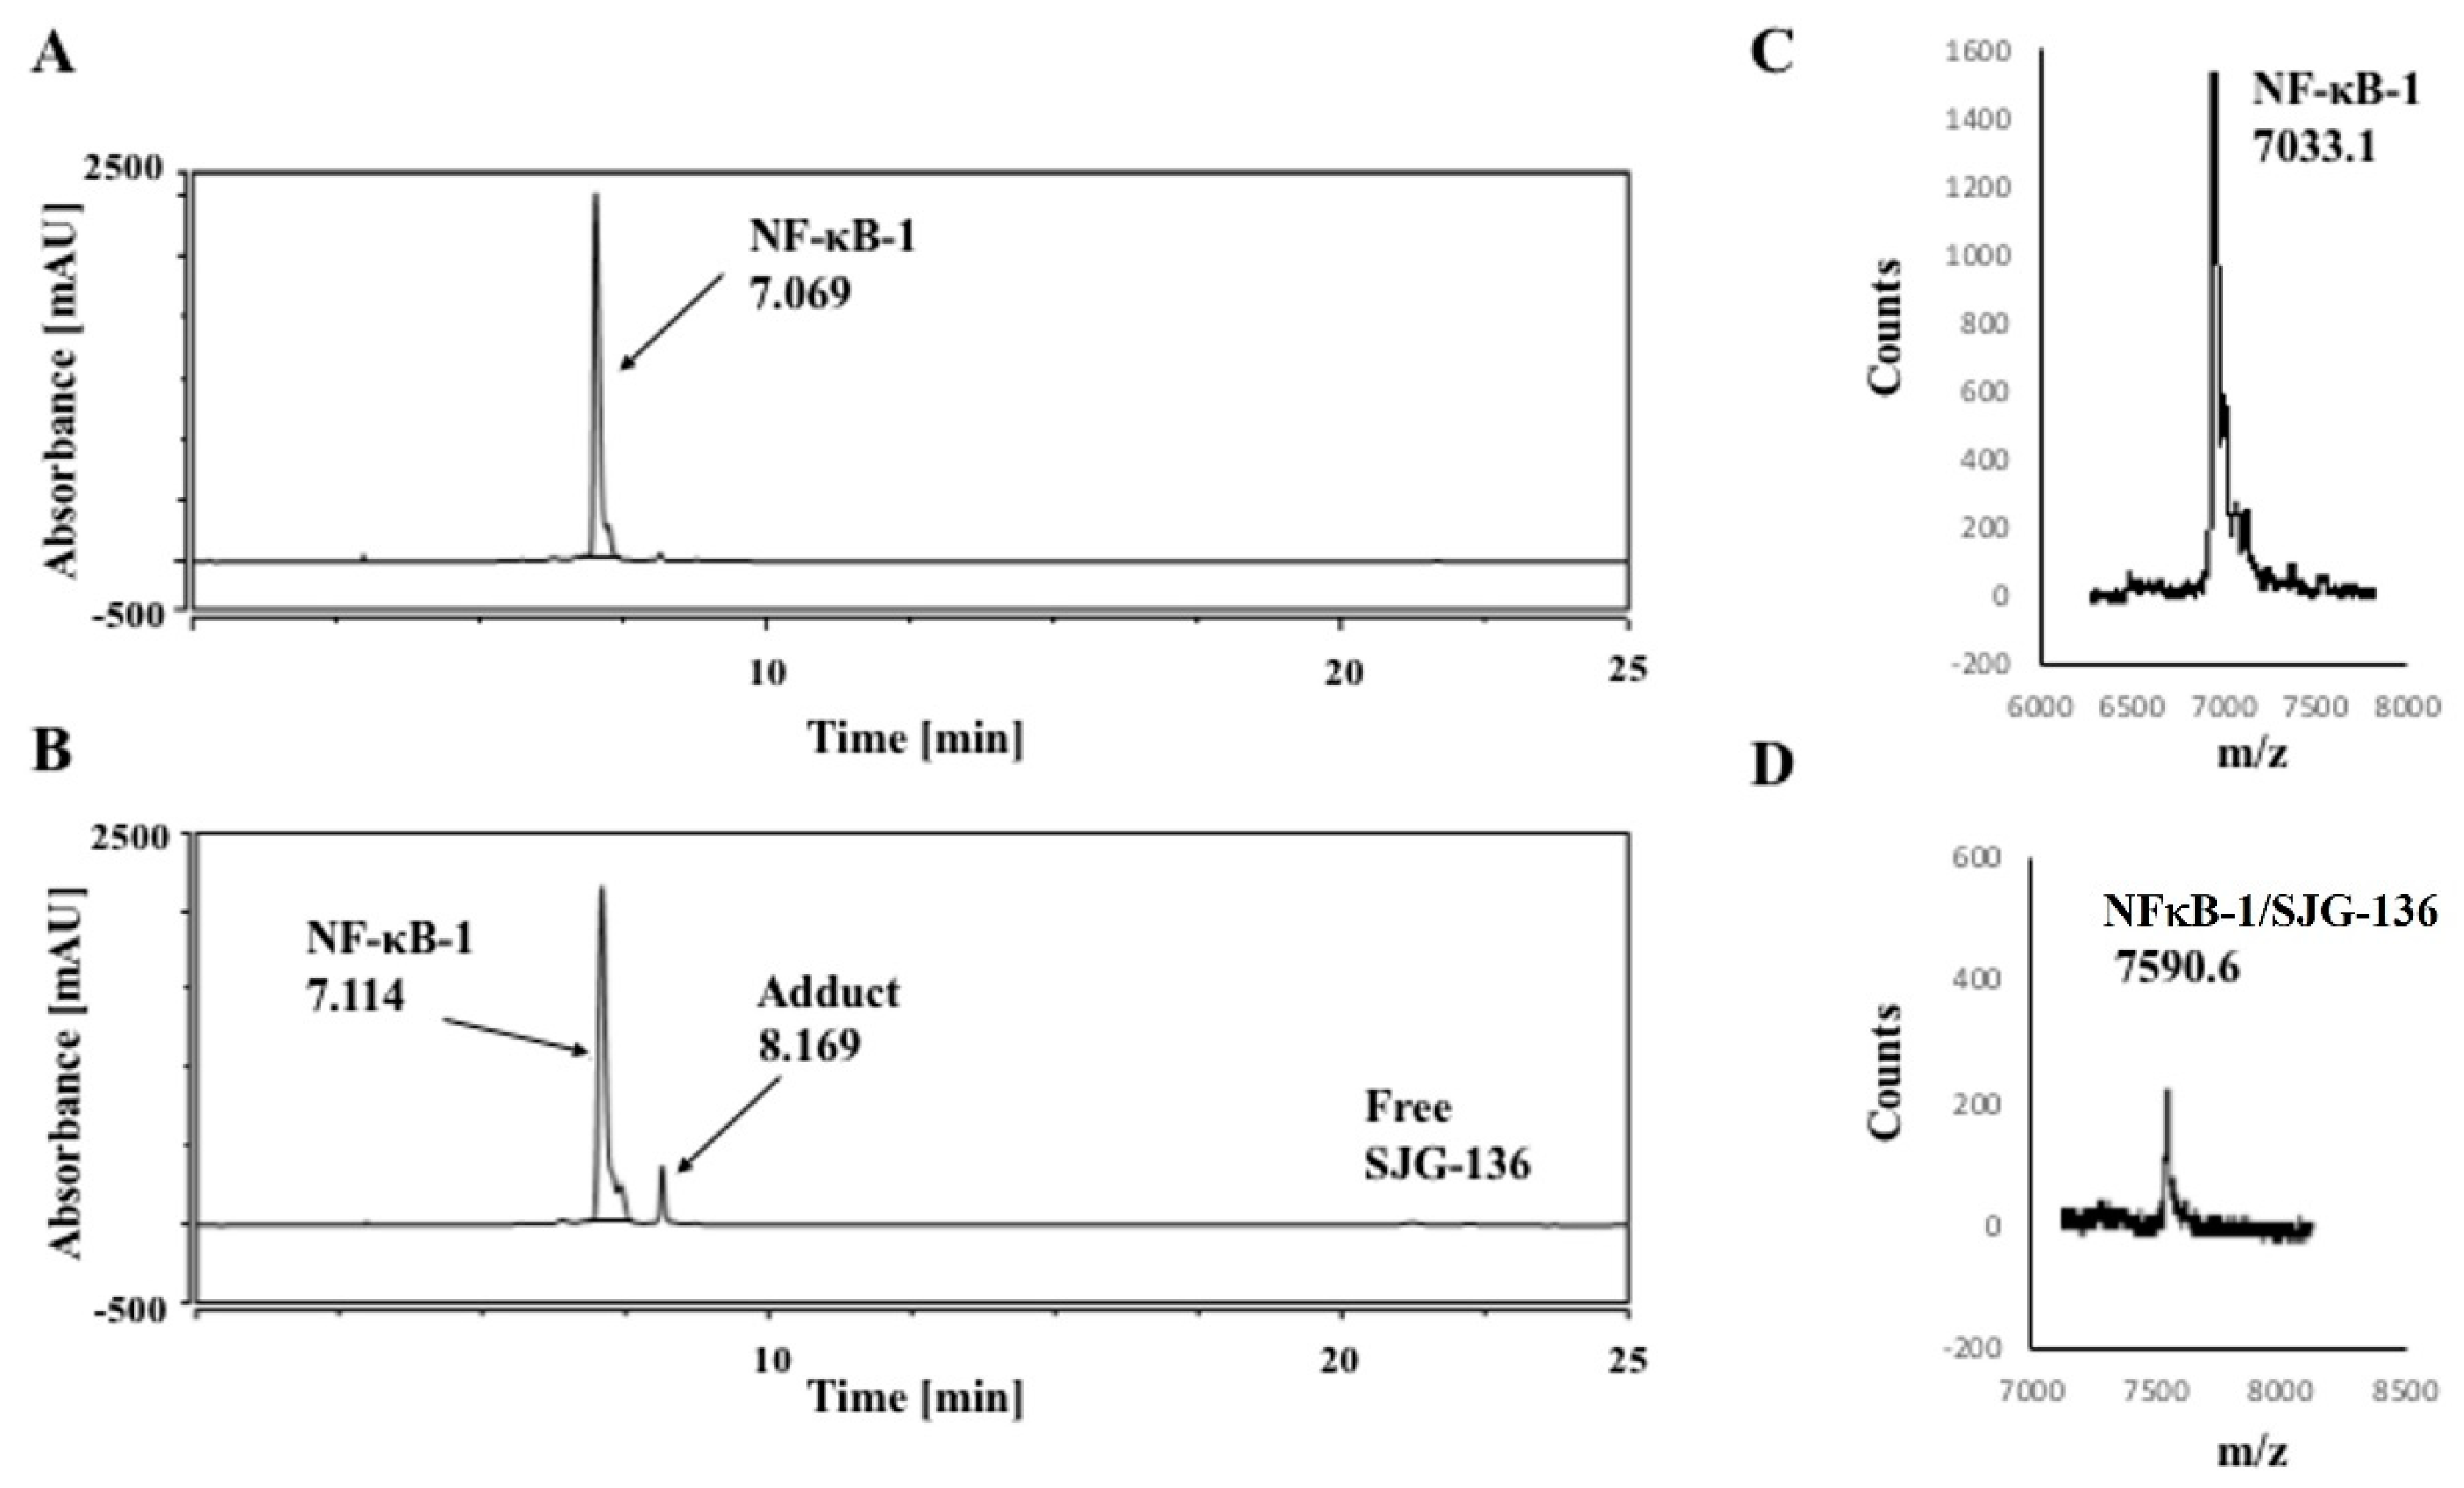
Next, the interaction of SJG-136 with the hairpin sequences shown in Figure 3 was studied. The working solution of SJG-136 was added to the working solution of each hairpin in a 4:1 ratio (SJG-136/DNA), followed by incubation at 25 °C for 24 h. The NF-κB-1 sequence (Figure 3) alone produced a single peak at RT 7.069 min (Figure 4A) and a m/z of 7033.1 m/z (theoretical mass: 7032.6 m/z) (Figure 4C). After incubation with SJG-136 in a 4:1 ratio (SJG-136/DNA) at 25 °C a new minor peak emerged at RT 8.169 min with approximately 16.6% adduct formation observed after 24 h (Figure 4B). The 1:1 stoichiometry of the new adduct peak was confirmed by MALDI-TOF-MS (observed mass: 7590.6 m/z; theoretical mass: 7589.2 m/z for a 1:1 SJG-136/NF-κB-1 adduct) (Figure 4D). The 1:1 stoichiometry was assumed to be due to binding of the SJG-136 to one guanine preventing further drug binding due to steric effects.
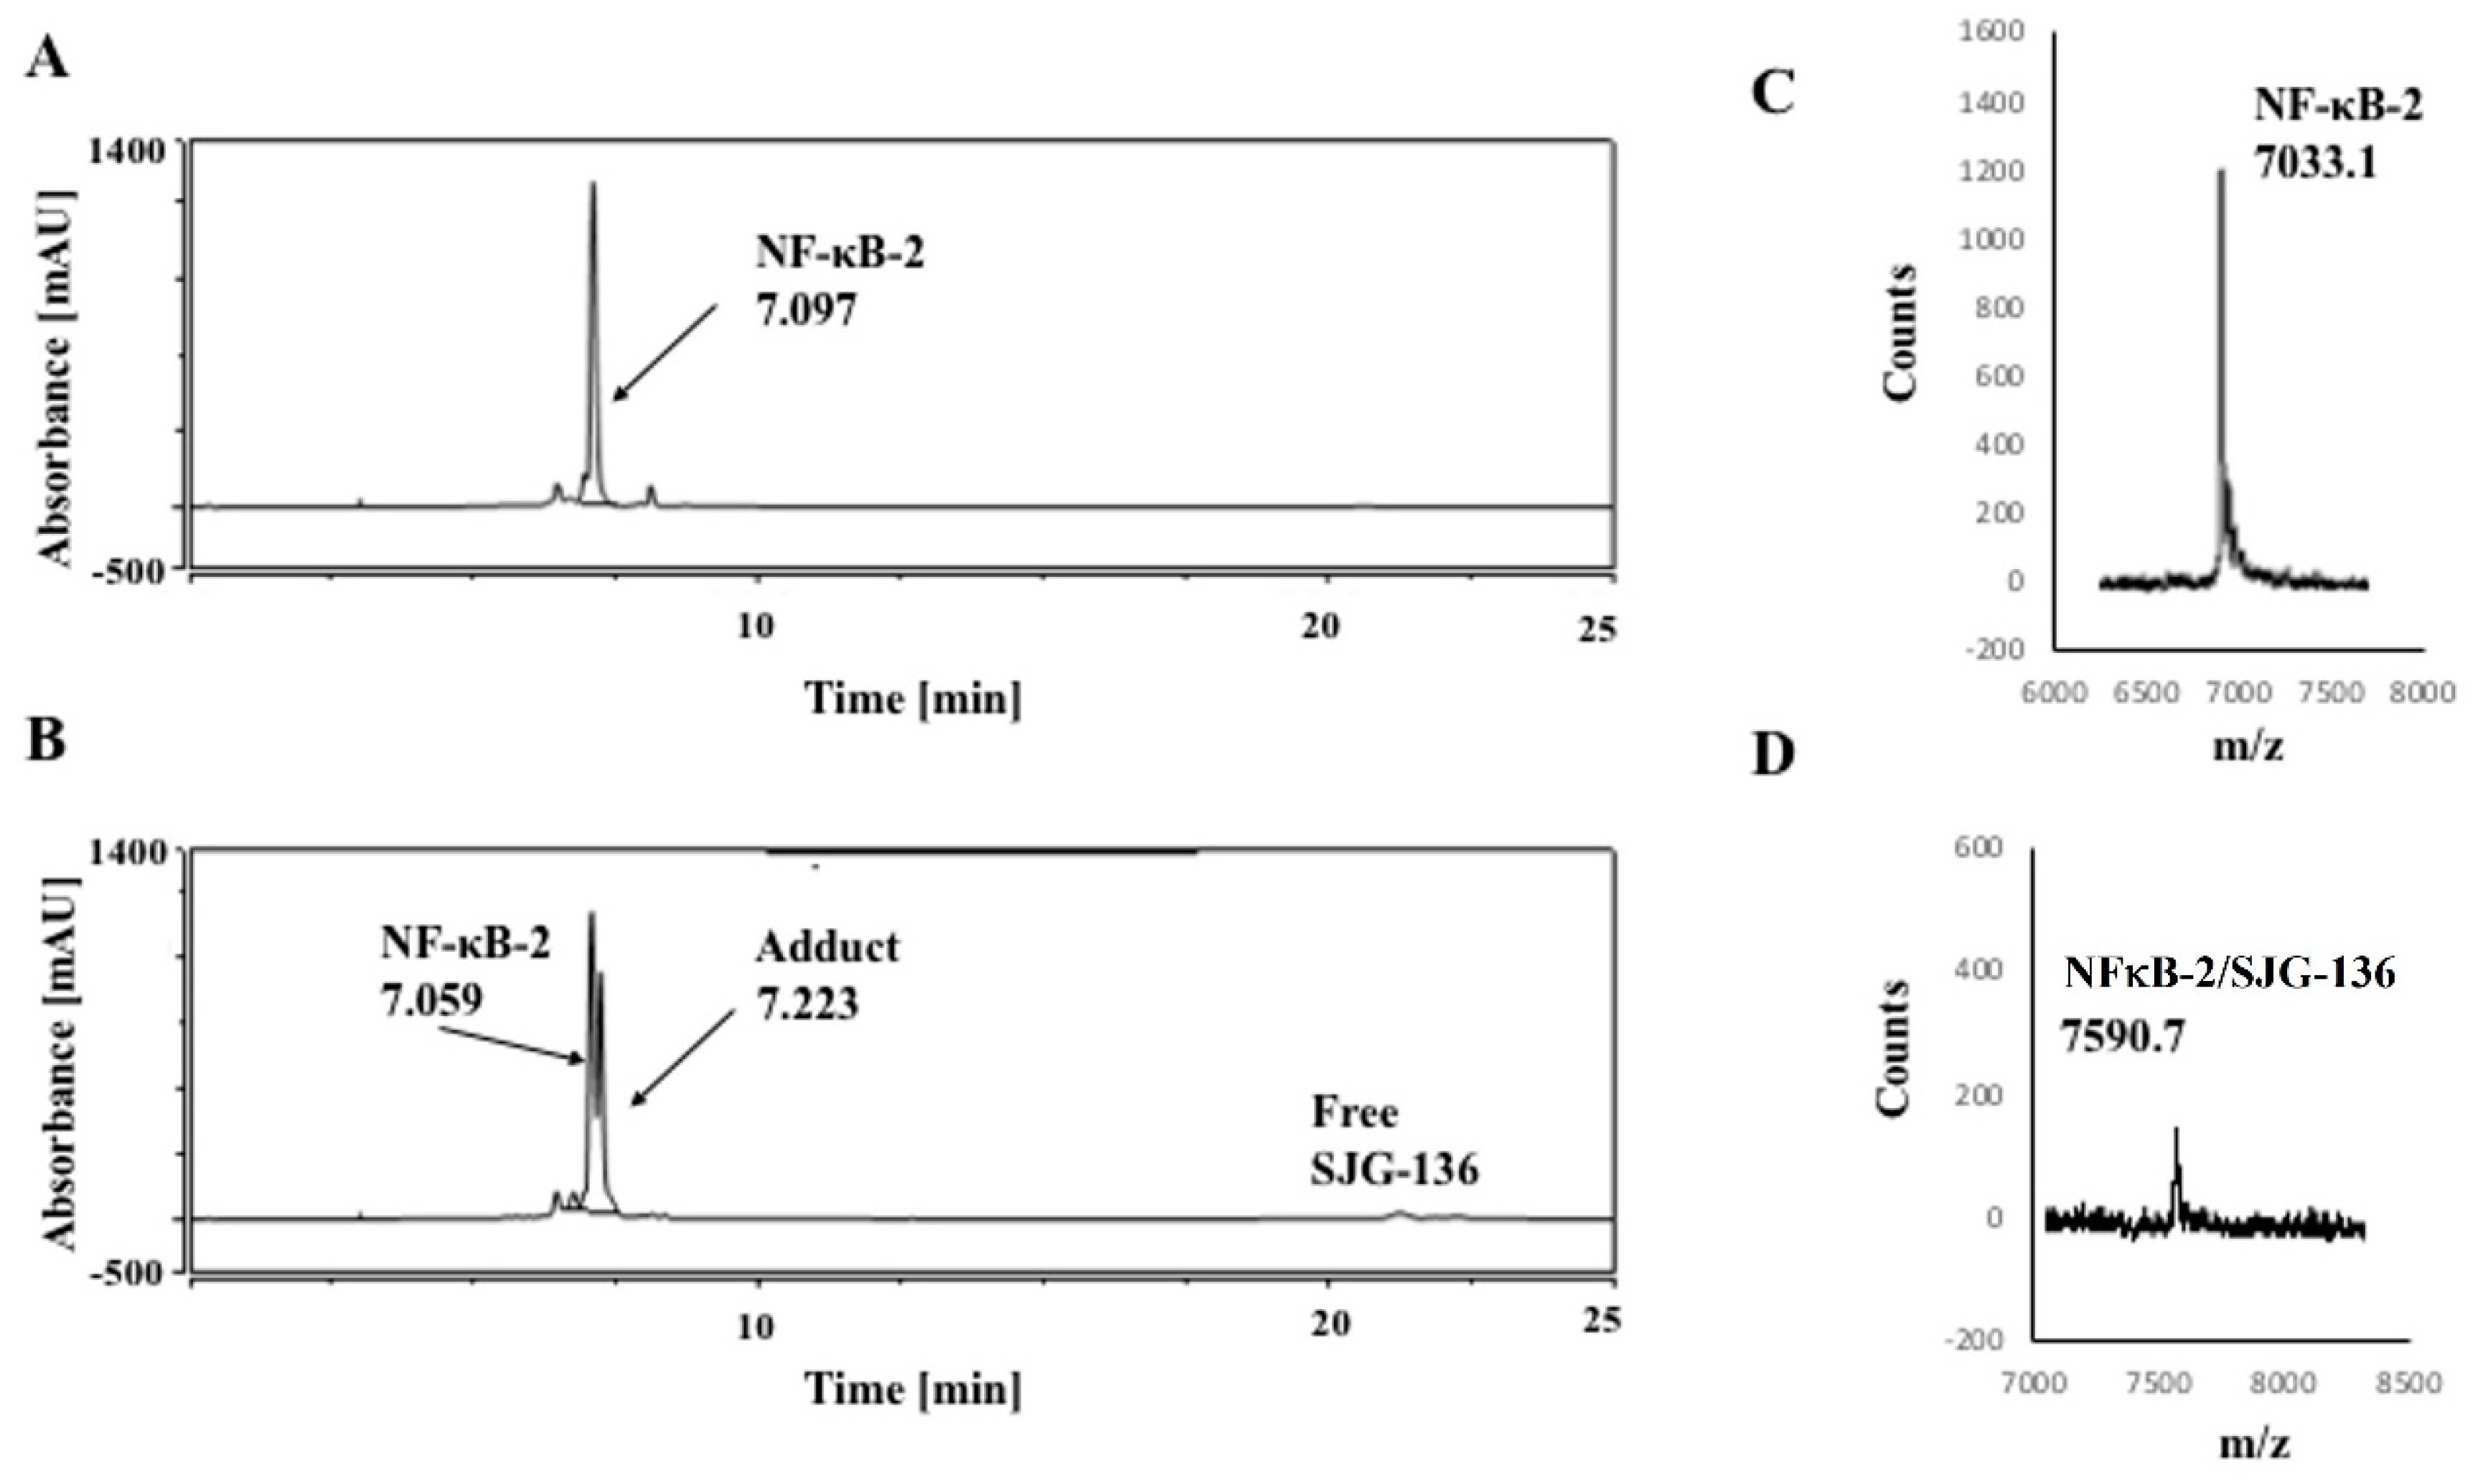
Similar experiments involving the NF-κB-2 sequence gave a single peak at RT 7.097 min (Figure 5A), which was identified by MALDI-TOF-MS (7033.1 m/z) (Figure 5C). After treatment with SJG-136, the SJG-136/NF-κB-2 adduct peak appeared at RT 7.223 min, and a 1:1 stoichiometry was confirmed by MALDI-TOF-MS (Observed mass: 7590.7 m/z, Theoretical mass: 7590.2 m/z) (Figure 5D; Table 1). The small difference in RTs of the NF-κB- 2 hairpin sequence and the SJG-136/NF-κB-2 adduct peak (7.059 and 7.223 min, respectively) is likely due to insufficient resolution of the solvent system used in this study. However, the peak at RT 7.223 min was collected, and its identity was confirmed by MALDI-TOF-MS (Figure 5D). Overall, the reaction between SJG-136 and NF-κB-2 was more favourable compared to the SJG-136/NF-κB-1 interaction with 43% adduct formation observed after 24 h.
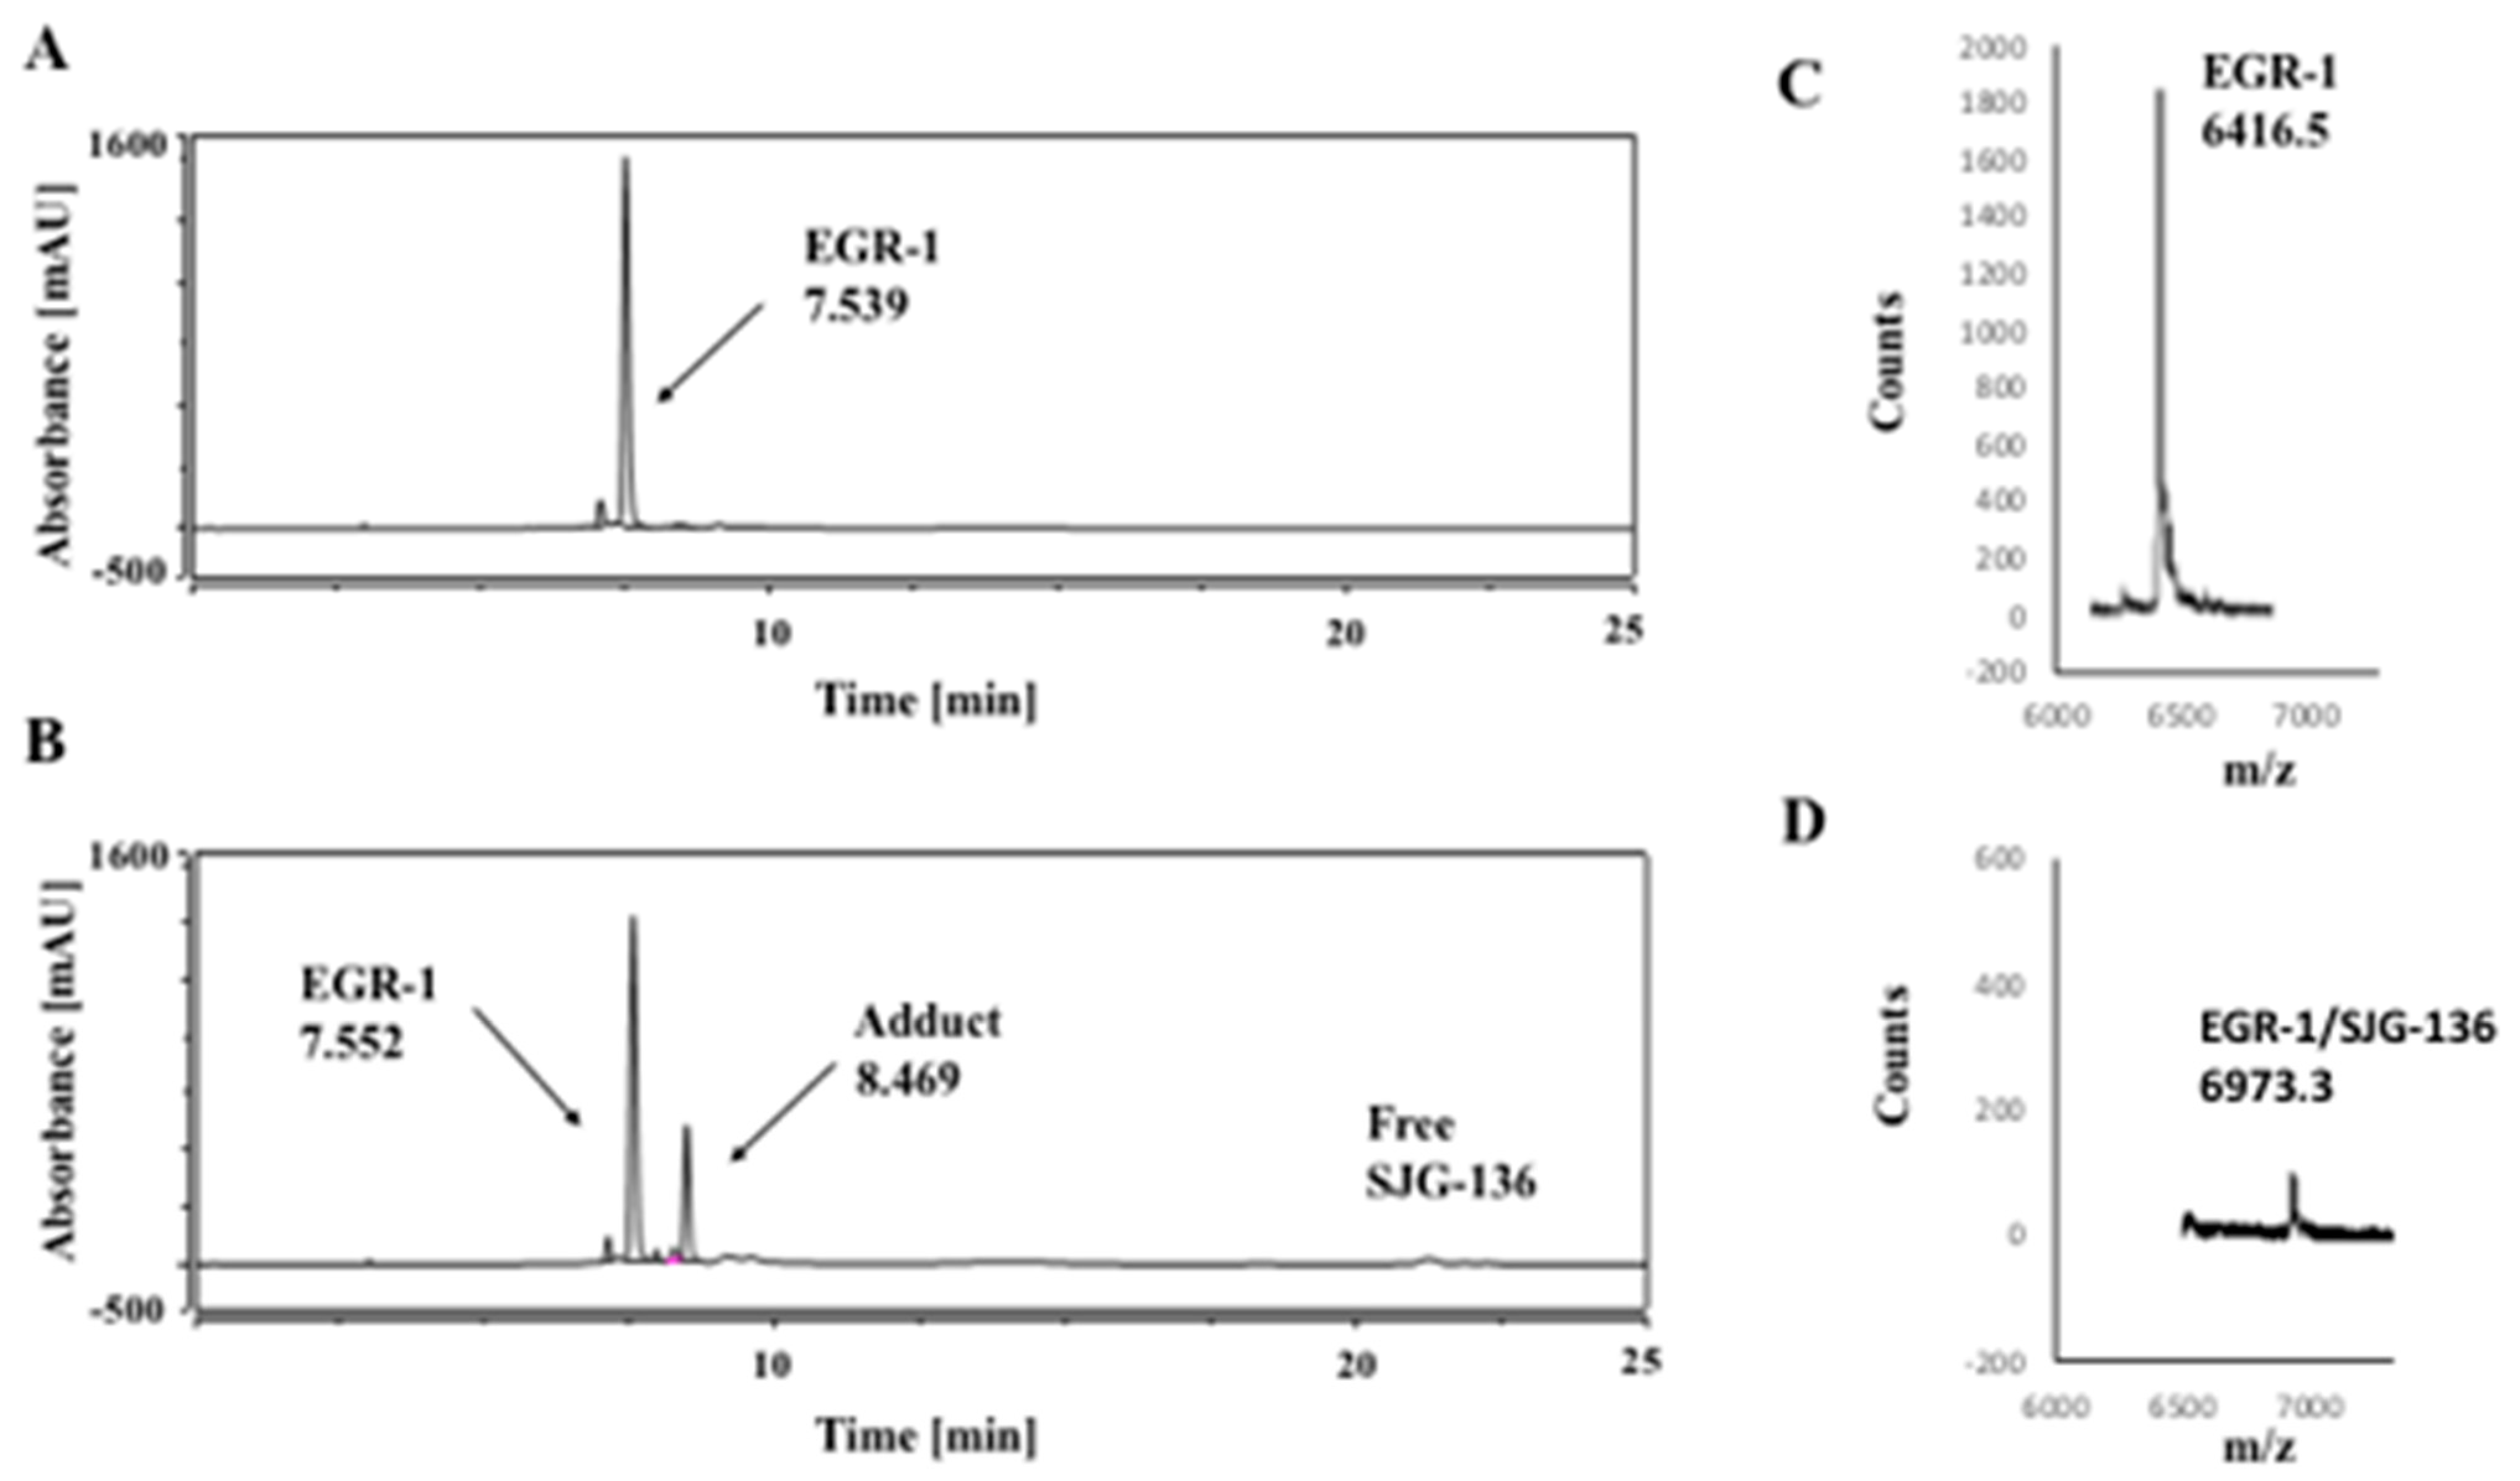
In a similar experiment, EGR-1 alone (Figure 3) and the SJG-136/EGR-1 adduct gave peaks at RT 7.539 and 8.469 min, respectively. The identity of the peaks and 1:1 stoichiometry of the SJG-136/EGR-1 adduct was confirmed by MALDI-TOF-MS (Figure 6D; Table 1). In the case of EGR-1, the extent of adduct formation was greater than NF-kB-1 sequence but lower than NF-κB-2 with 28% adduct formation after 24 h.
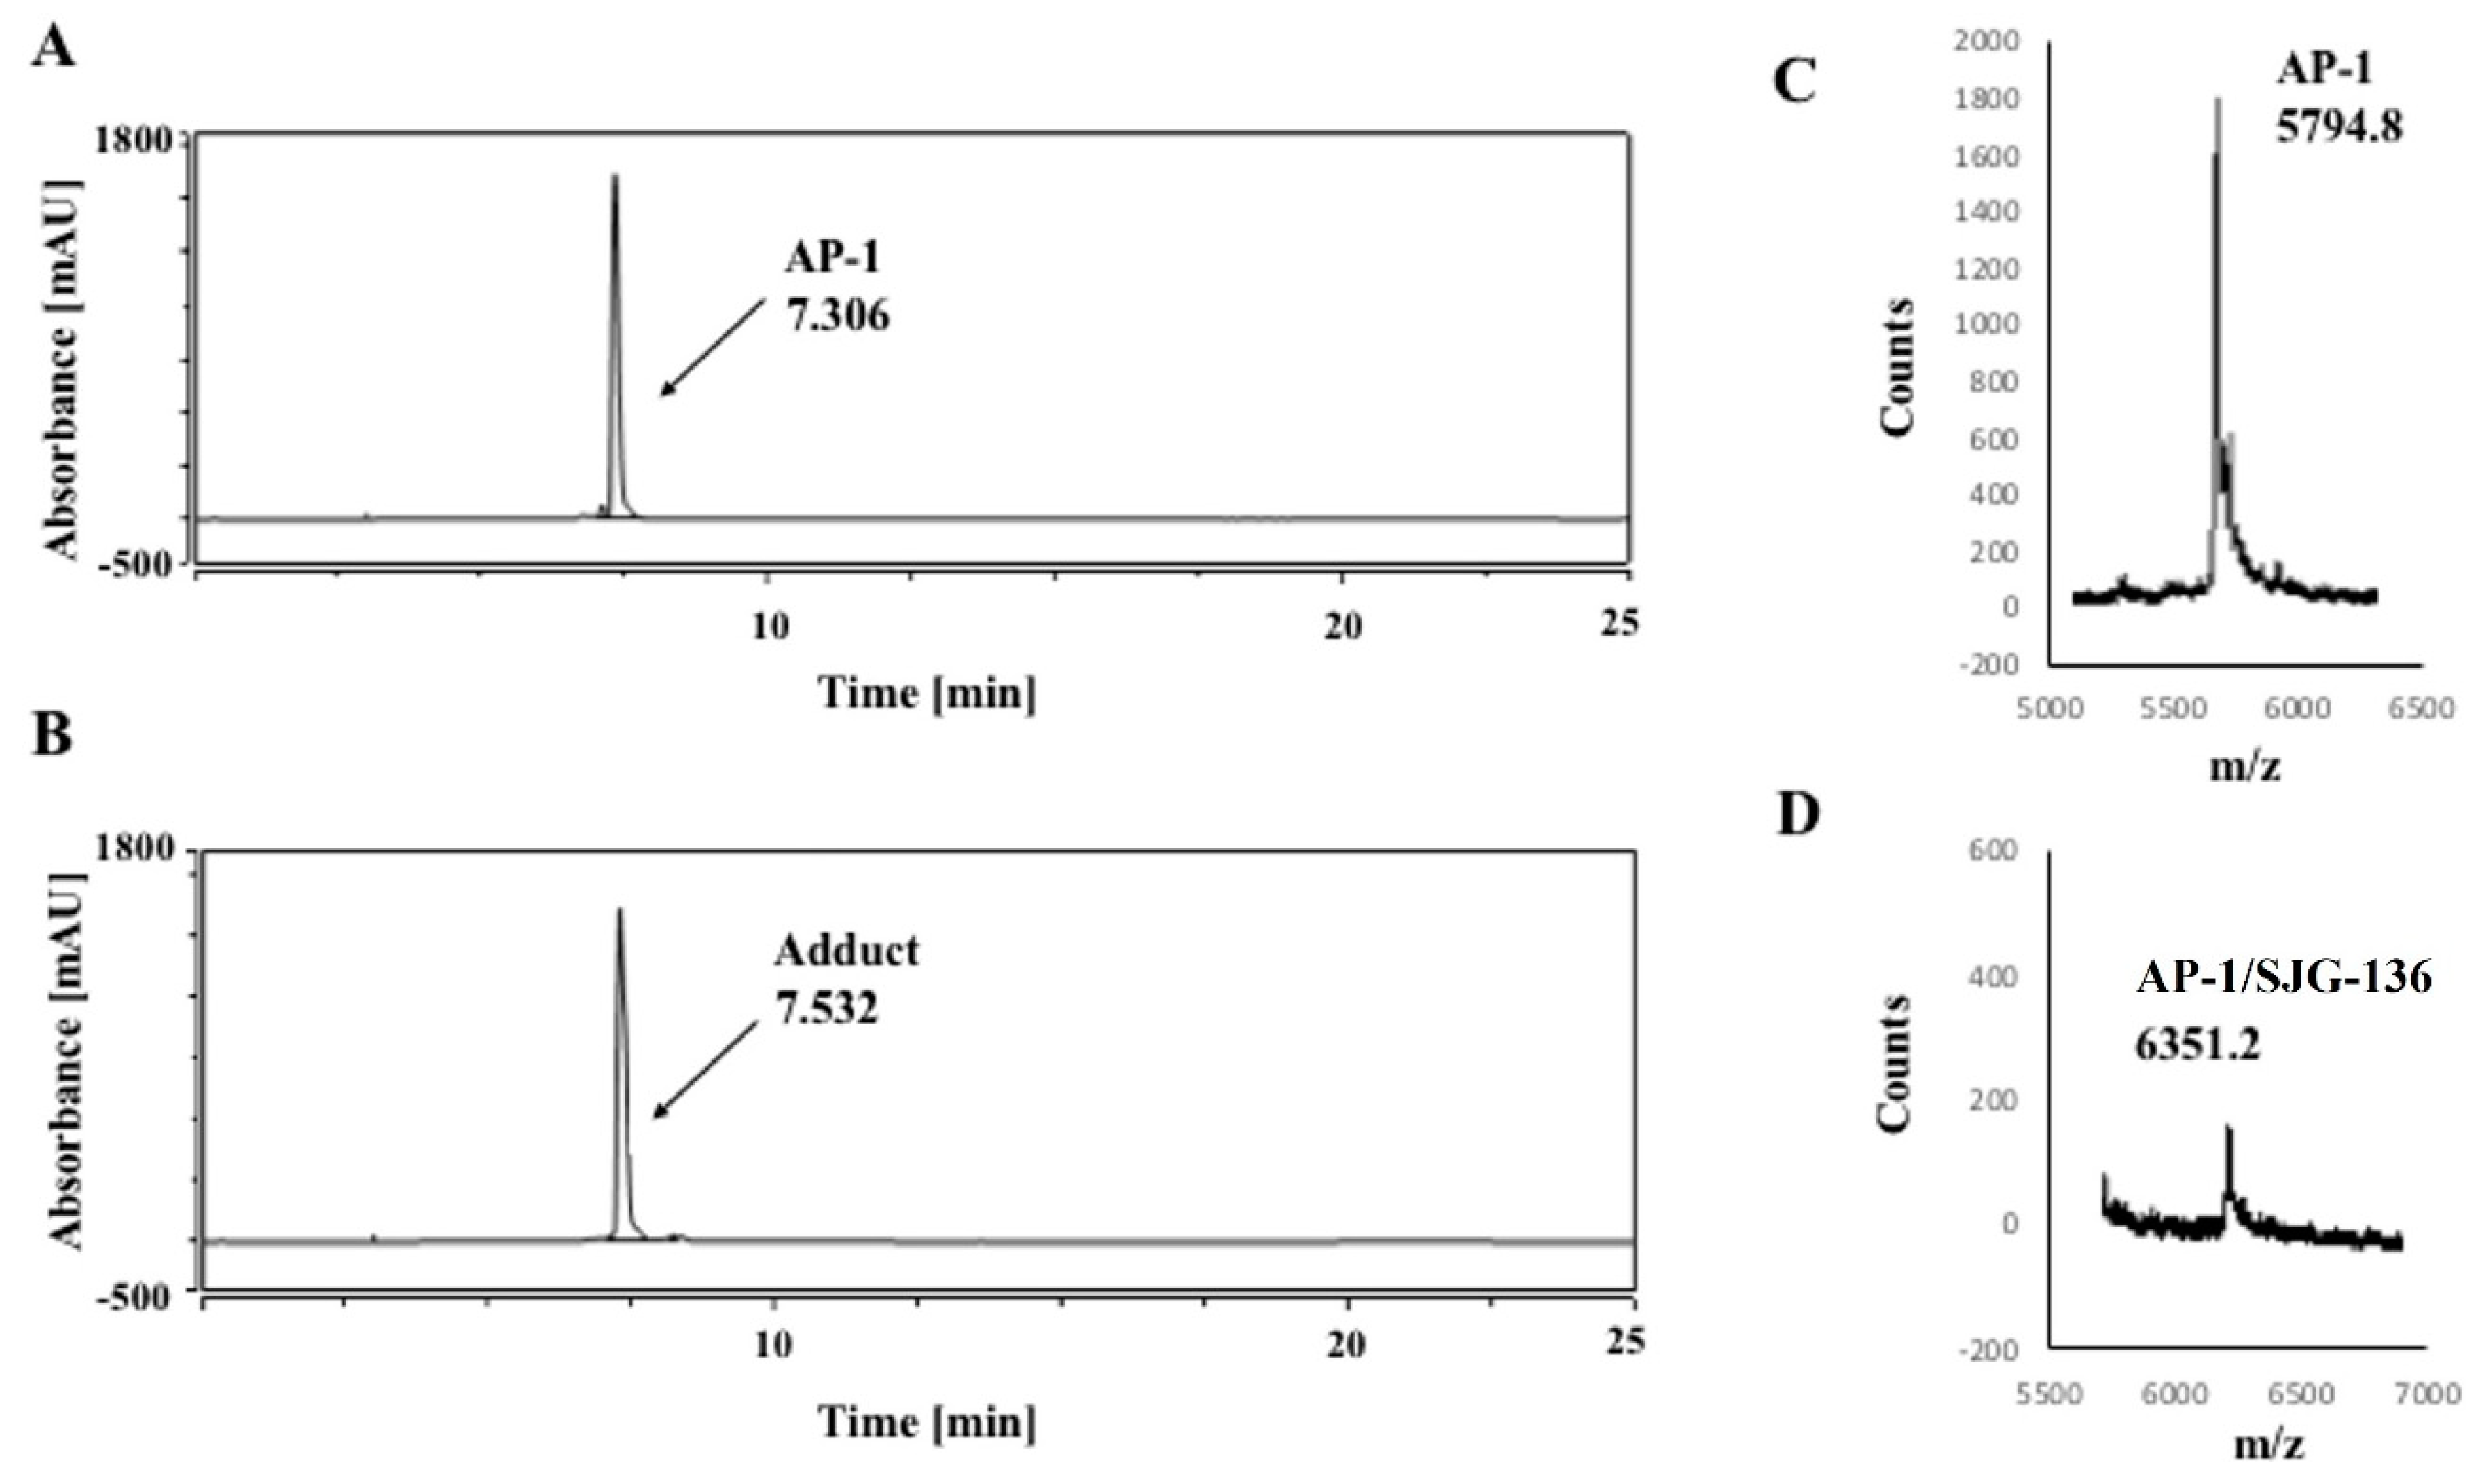
Annealed AP-1 sequence (Figure 3) produced a single peak in the HPLC chromatogram at RT 7.306 min (Figure 7A) while the SJG-136/AP-1 adduct peak appeared at 7.532 (Figure 7B). The identity of both peaks and the stoichiometry of the SJG-136/AP-1 adduct were identified by MALDI-TOF-MS (Figure 7D; Table 1). The reaction between SJG-136 and the AP-1 sequence was notably more efficient than for NF-κB-1, NF-κB-2 or EGR-1 with 100% conversion to the adduct observed after 24 h. Like with the NF-κB-2 hairpin sequence, a minimal difference in RTs was observed between the AP-1 hairpin sequence and the SJG-136/AP-1 adduct peak (7.306 and 7.532 min, respectively), which may be due to insufficient resolution of the solvent system applied. However, MALDI-TOF-MS analysis confirmed the identity of the peak collected at 7.532 min as the SJG-136/AP-1 adduct (Figure 7D).
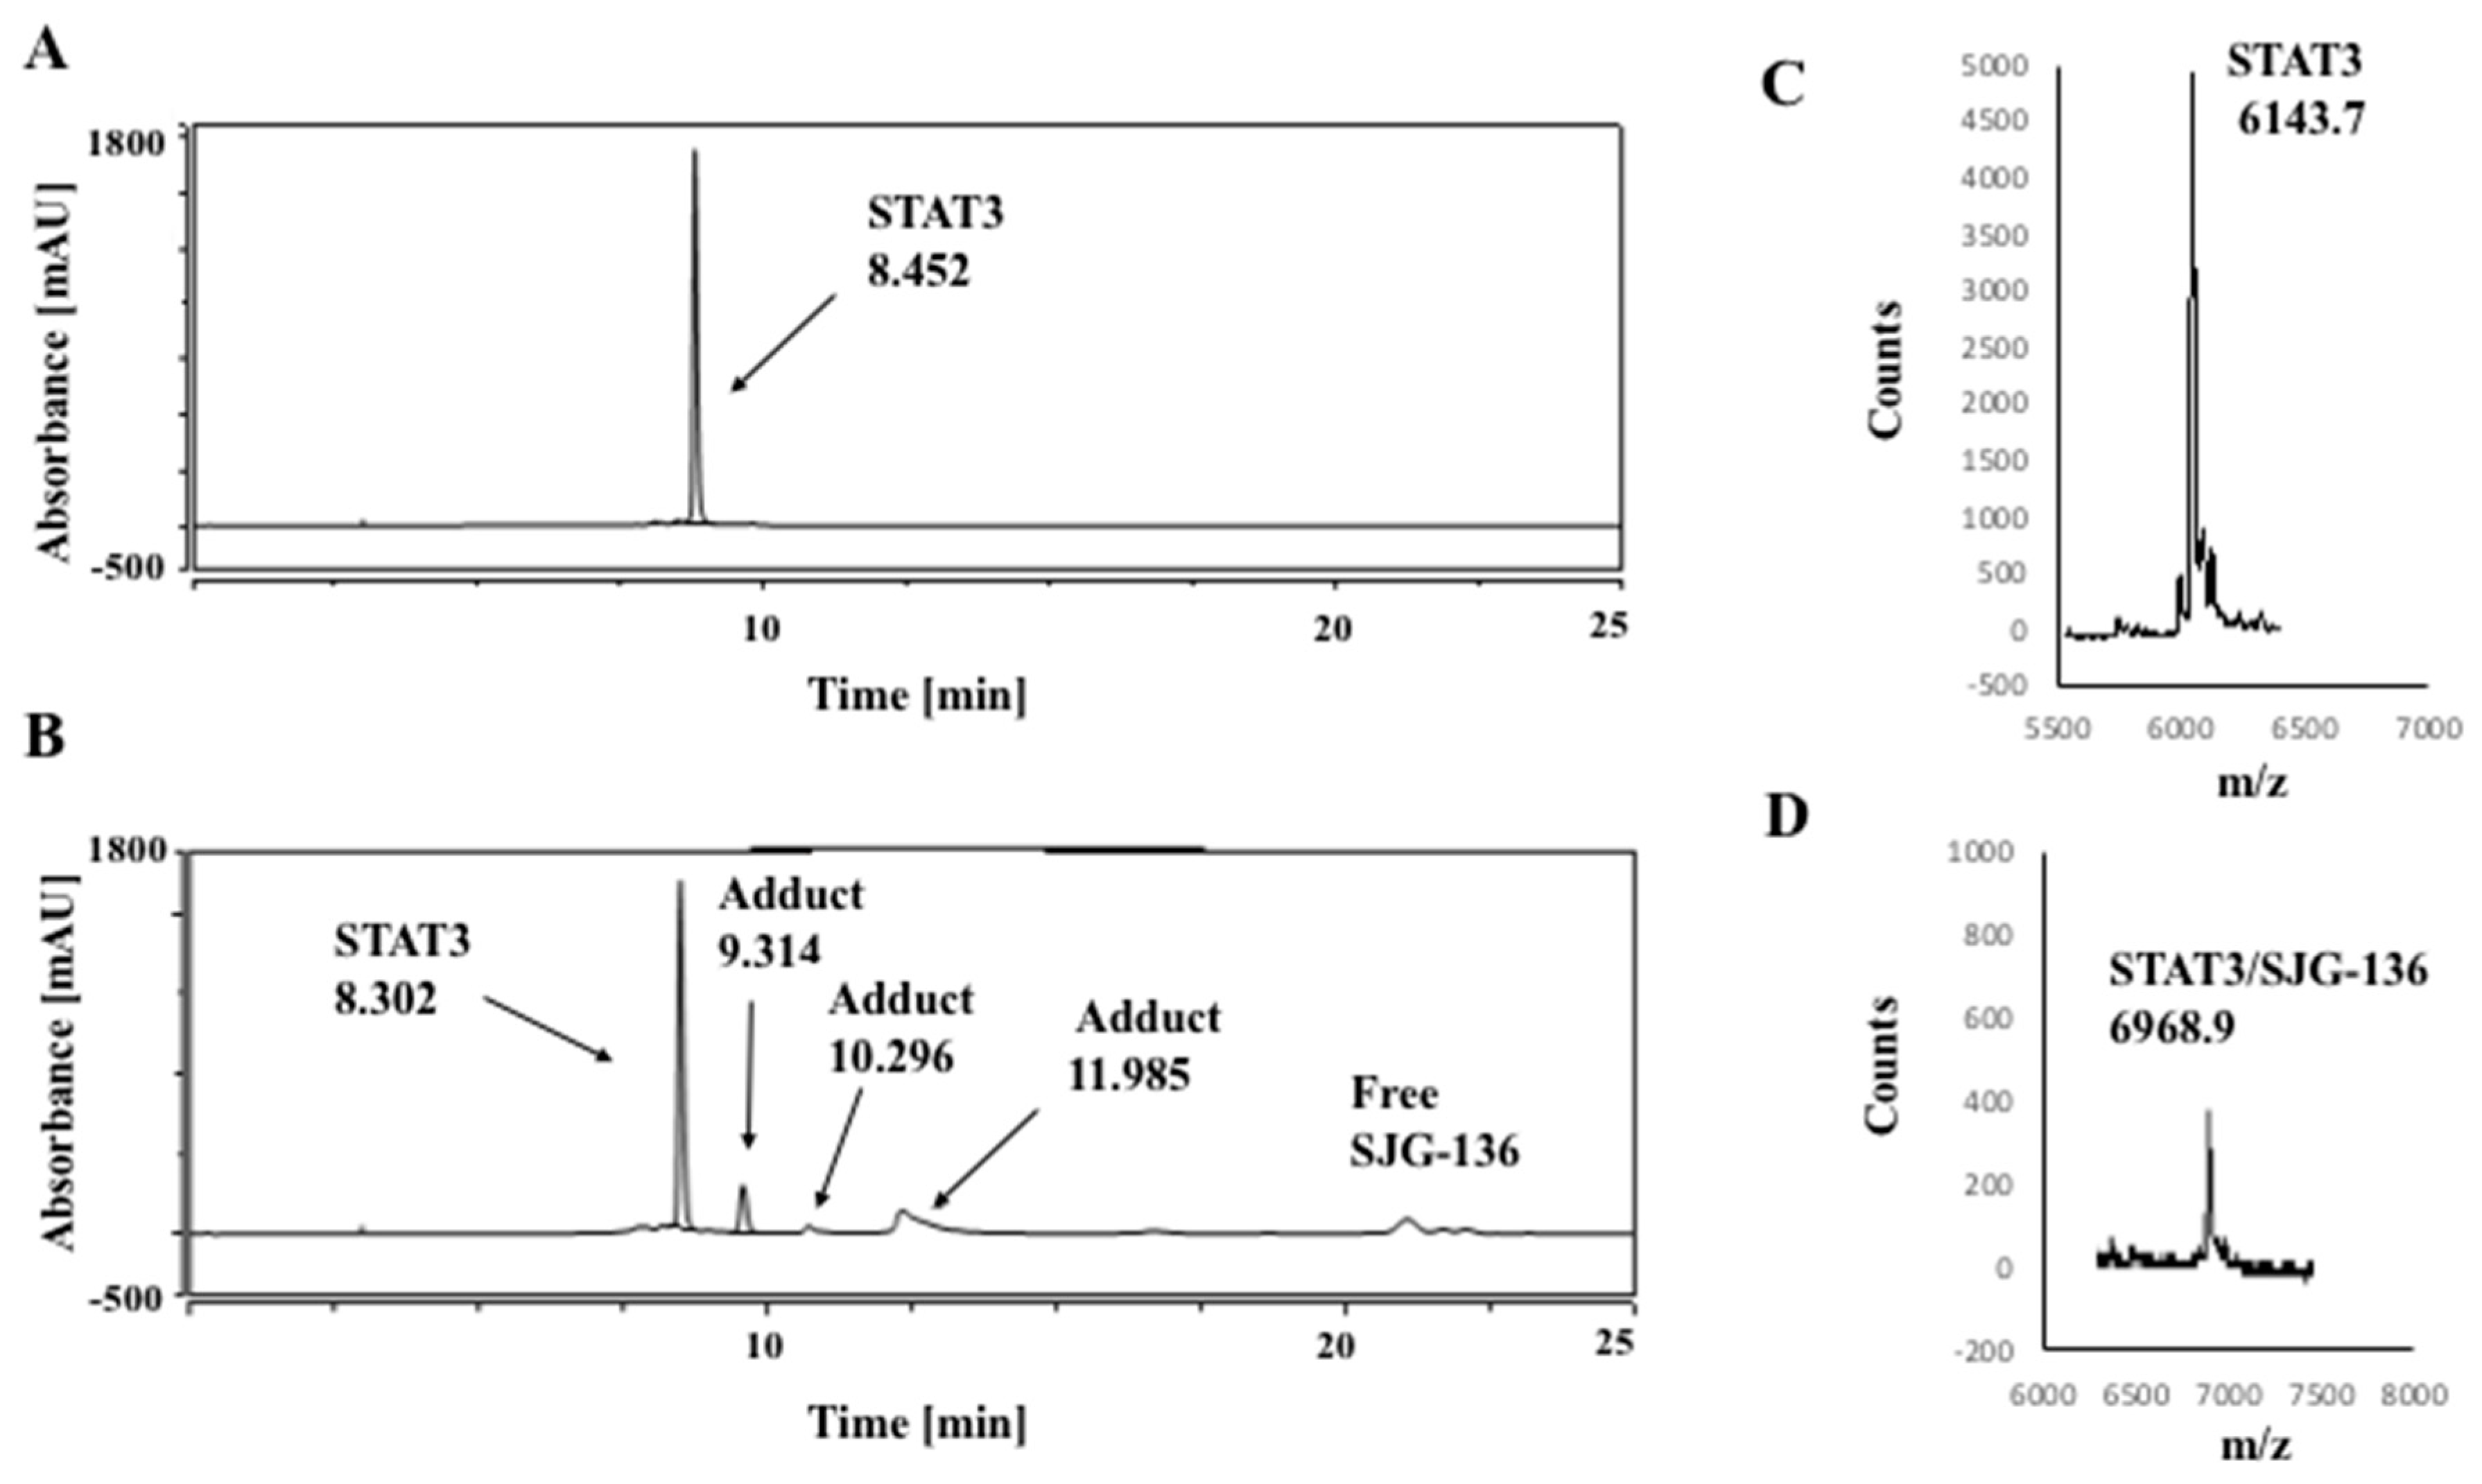
Finally, a similar study was carried out on the STAT3 sequence. While the oligo alone (Figure 3) provided a single peak at RT 8.452 min (Figure 8A), three new adduct peaks were observed at RT 9.314 min, 10.296 min, and 11.985 min with an approximately overall 14% adduct formation (Figure 8B). The STAT3 sequence has five guanines (positions 5, 6, 7, 18, and 19) to which SJG-136 can bind. Looking at the chromatogram, it appears that SJG-136 prefers one guanine that could be the main peak at RT 8.302 min. The other three minor peaks could be the less favourable adducts. At this point, it cannot be confirmed/determined to which guanine SJG-136 is bonded. The adduct stoichiometry of each peak was confirmed by MALDI-TOF-MS to be 1:1 SJG-136/STAT3 based on an observed mass of 6968.9 m/z (theoretical mass: 6968.8 m/z) (Figure 8D); (Table 1). The same mass was observed for all three SJG-136 adducts formed. The STAT3 sequence contains five guanines at positions 5, 6, 7, 18, and 19, to which SJG-136 can bind (Figure 3). From the chromatogram, it appears that SJG-136 exhibits a preference for one guanine, possibly corresponding to the main peak at RT 9.314 min. The other minor peaks represent less favourable adducts. However, it cannot be confirmed or determined which guanine SJG-136 is bonded to based on the HPLC-MS study.
The HPLC data obtained revealed significant differences in the extent of adduct formation between the individual sequences although their guanine content is comparable (Table 2). After 24 h, SJG-136 had formed significant levels of adducts with NF-κB-2 (~43%) and AP-1 (~100%) sequences, while reacting to a lesser extent with the EGR-1 (~28%), NF-κB-1 (~16%), and STAT3 (~14%) sequences.

3.2. CD Study

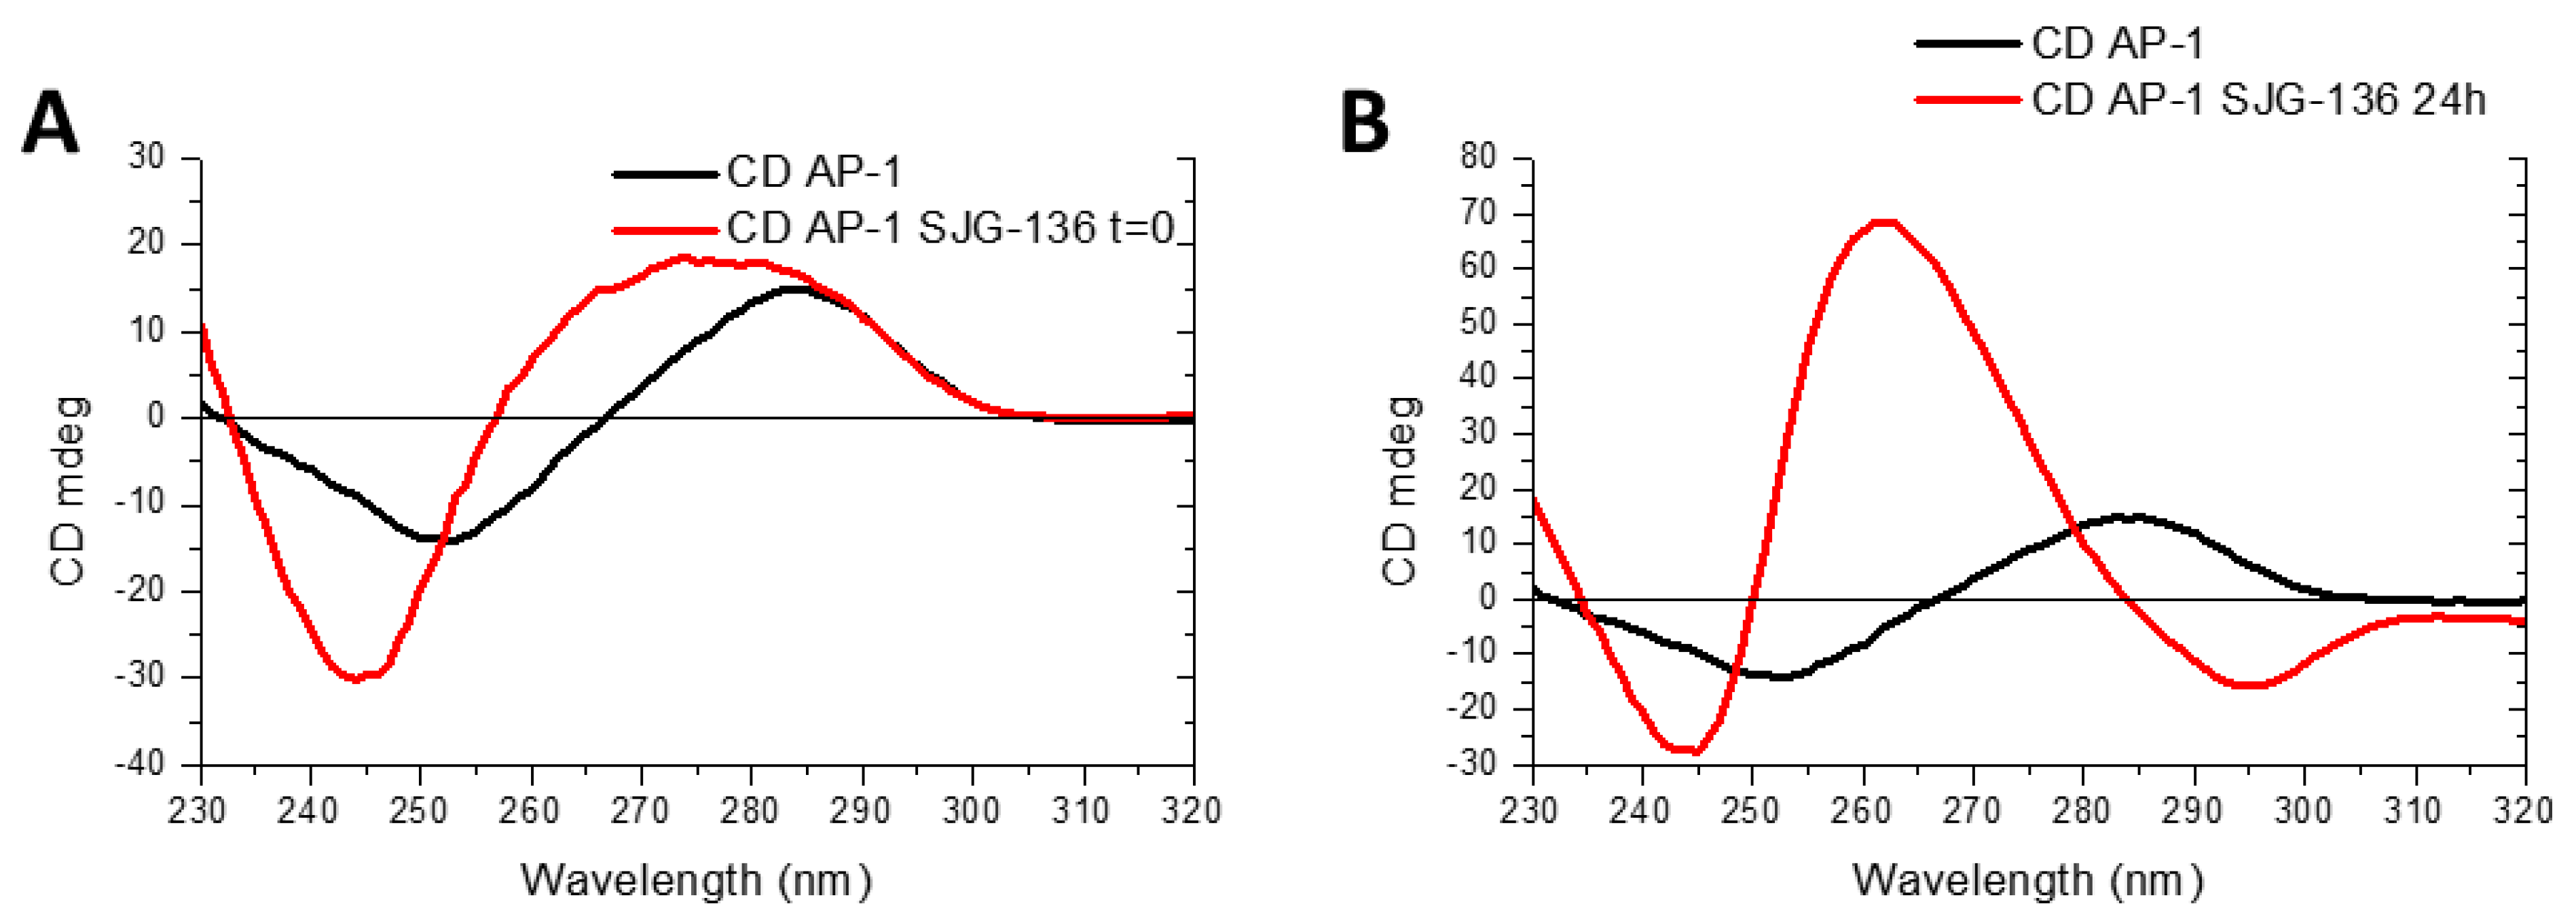
CD spectroscopy was used to explore changes in the secondary structure of the DNA hairpins upon SJG-136 binding. The CD profiles of all sequences alone displayed negative and positive bands at approximately 240 nm and 272 nm, respectively. Figure S12 (SI) shows typical CD profiles for B-form DNA hairpins. It has been previously reported that the CD spectrum of pure B-form DNA exhibits a negative and positive band at approximately 245 nm and 260–280 nm, respectively [47,48,49]. The negative band at about 245 nm is due to the right-handed helicity of the DNA, whereas the positive band at around 260–280 nm is due to the π-π base stacking. However, the precise position and amplitudes of the CD bands may vary with sequence due to differences in chromophores and because of various conformational differences. The CD profiles of all sequences showed an increase in negative ellipticity at about 240 nm and positive ellipticity at about 272 nm after addition of SJG-136 and immediate CD analysis (SI, Figure S12A,C,E,G,I). These changes in the CD bands confirm alterations in the secondary structure of DNA upon SJG-136 binding. Similar results were obtained after 24 h of incubation. The CD profiles of all sequences displayed an enhancement of the negative band at 240 nm and the positive band at 270 nm (SI, Figure S12B,D,F,H,J). Moreover, the positive CD band increased to a greater extent for all sequences after 24 h of incubation with SJG-136 compared to the t = 0 measurement. This reflected the time—dependent nature of adduct formation due to covalent binding showing that more adduct had been formed after 24 h. Interestingly, for the AP-1 sequence, SJG-136 induced a significant increase of the positive CD band at about 263 nm from 4 mdeg up to 55 mdeg after 24 h compared to t = 0 (Figure 9A,B), which also shifted from 275 mn to 260 nm, suggesting binding of SJG-136 to the AP-1 hairpin sequence [50]. Furthermore, the AP-1/SJG-136 complex exhibited the greatest enhancement in intensity of the positive band compared to the NF-κB-1, NF-κB-2, EGR-1, and STAT3 sequences, suggesting a higher reactivity for this sequence (SI, Figure S12). This result was consistent with the previous HPLC/MS study in which SJG-136 had a high preference and selectivity for the AP-1 sequence.

3.3. Molecular Modelling Study

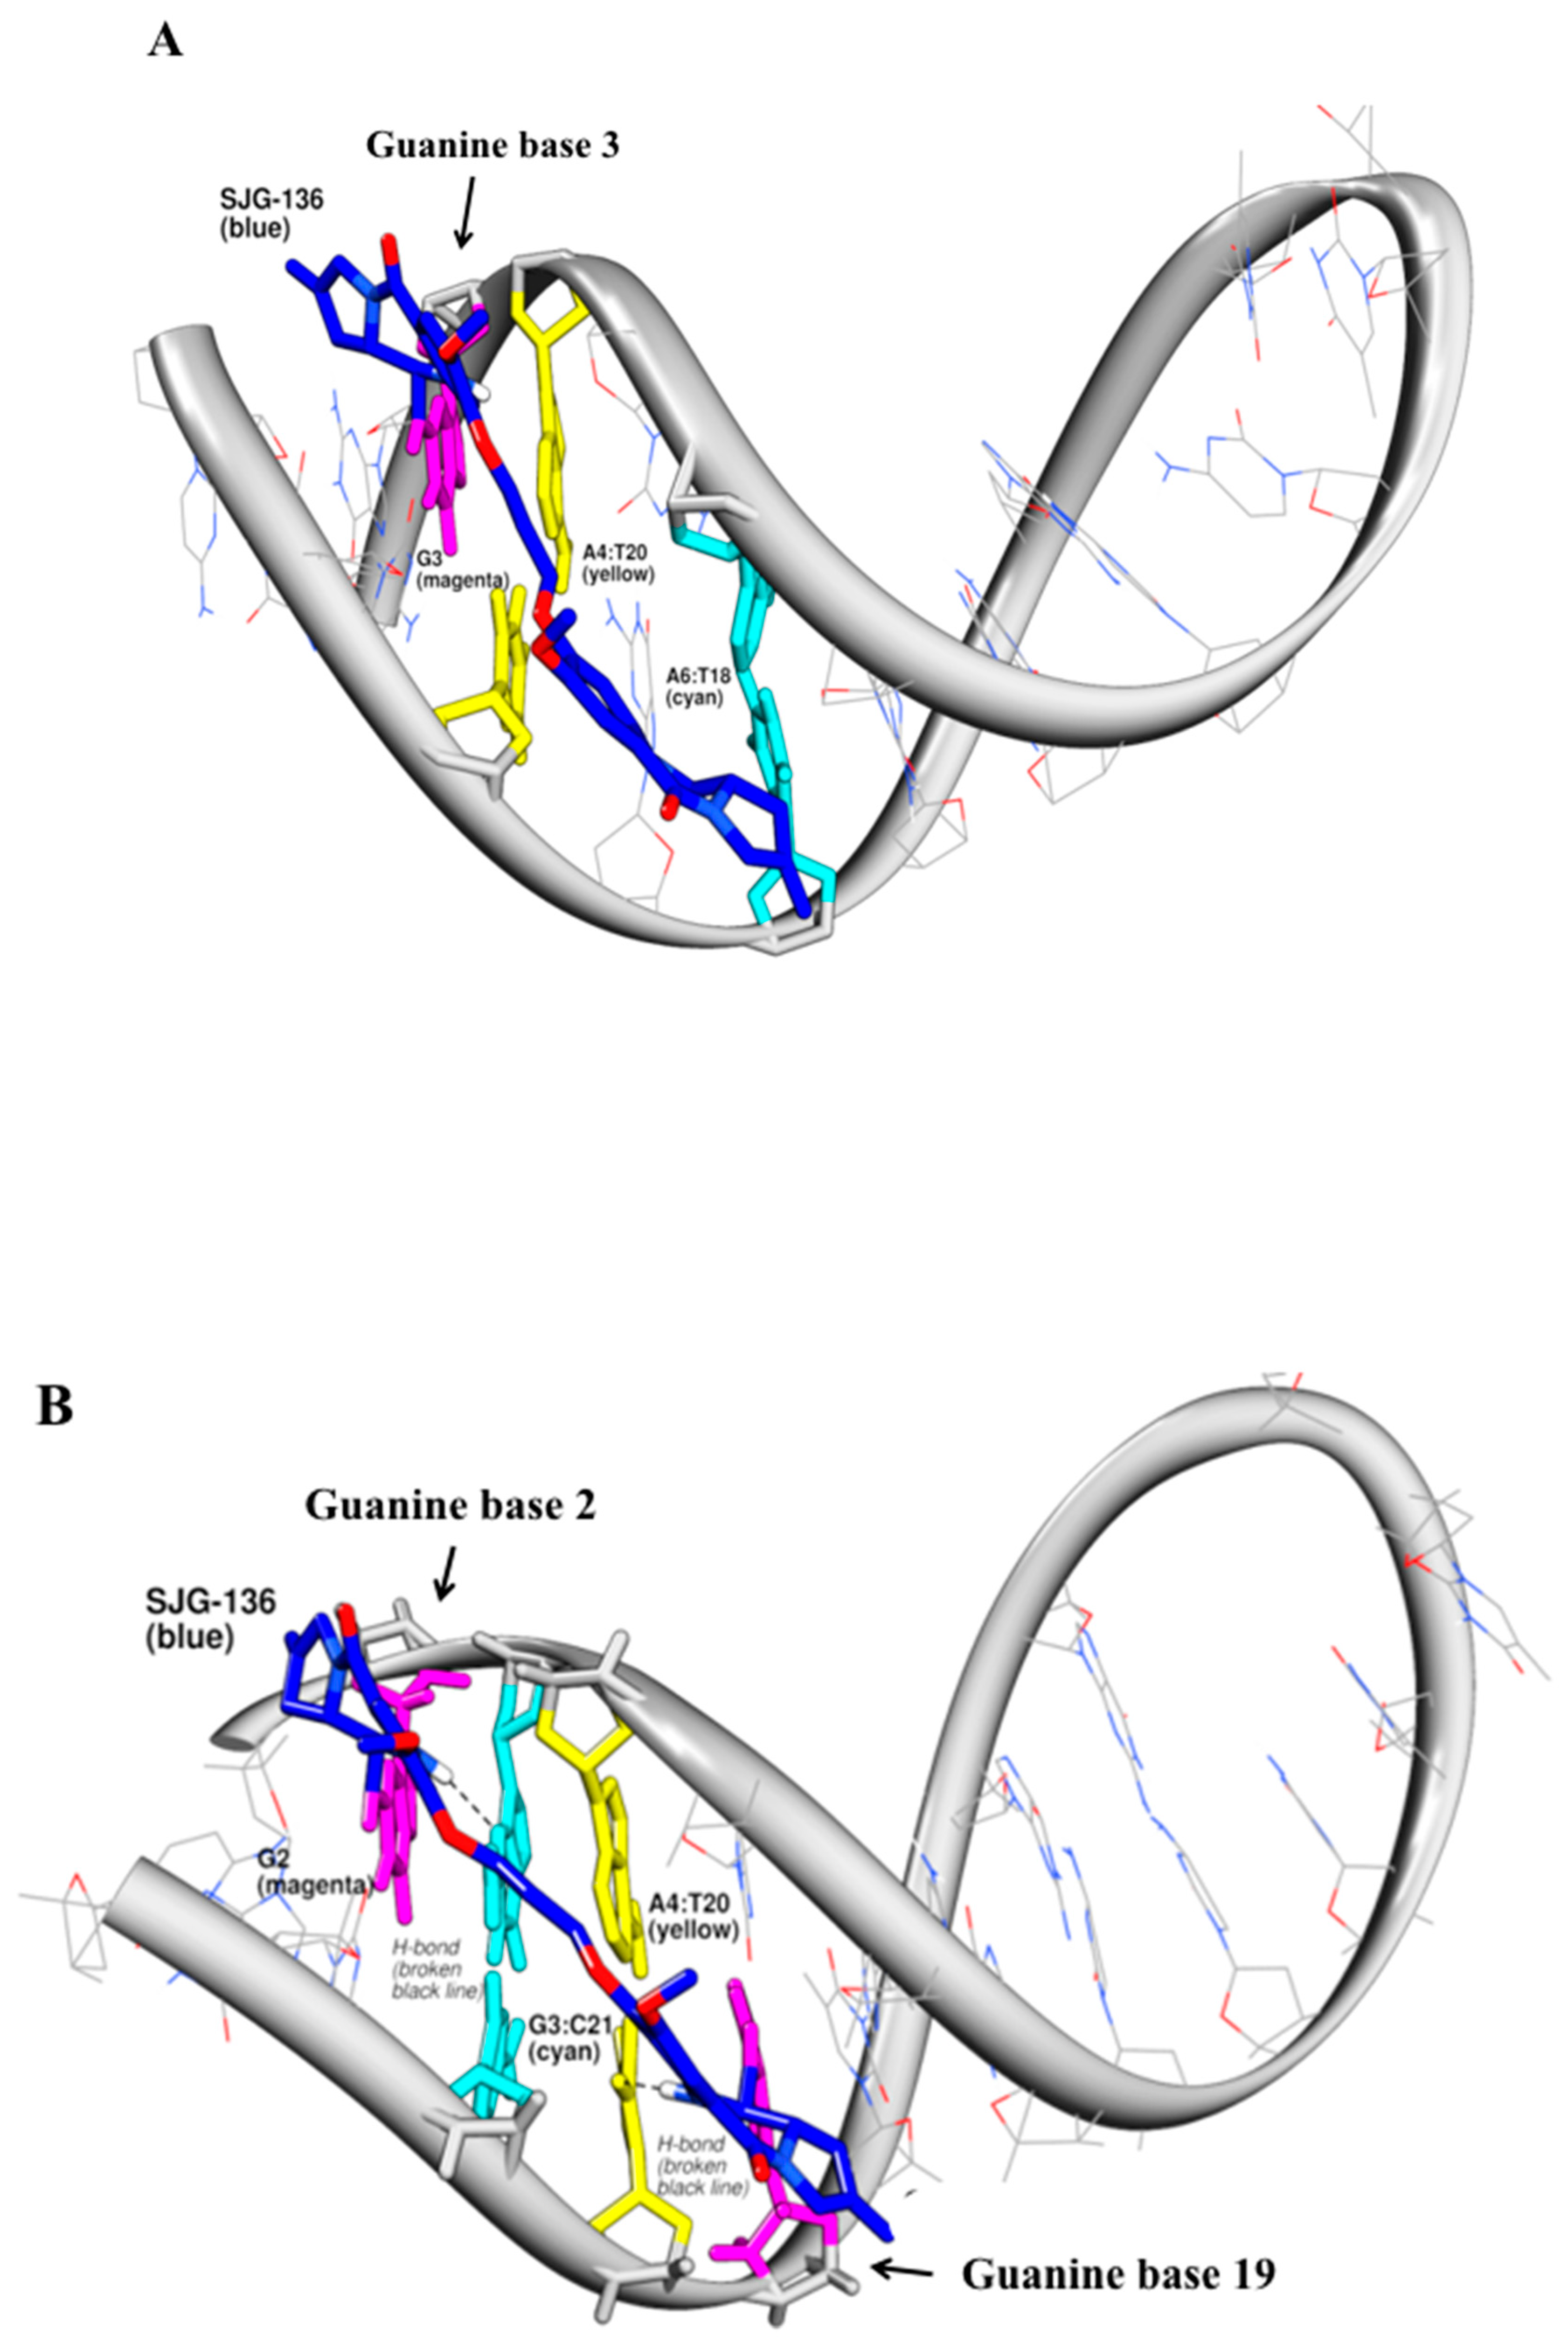
Molecular dynamics simulations were used to study the reactivity of SJG-136 toward NF-κB-1, NF-κB-2, EGR-1, AP-1 and STAT3 sequences to rationalise the results of HPLC/MS and CD studies. As SJG-136 is known to form mono-adducts as well as cross-links, both types of adduct were investigated and, in the case of mono-adducts, both loop-facing and non-loop-facing orientations were considered. Potential energy calculations (kcal/mol), averaged throughout a 10 ns simulation, were used to evaluate the binding potential of SJG-136 to each guanine in the DNA sequences. Based on publications to date three base pairs were set as a minimum criterion for adduct formation (based on the preference of the PBD moiety for 5′- X-G-X-3′ triplets) [32]. Molecular dynamics simulations and potential energy calculations (SI, Table S4) indicate that, within the NF-κB-1 consensus sequence, the most likely mono-adduct is formed at the guanine in position G3 (pointing towards the loop), as non-covalent interactions between the central methylene linker of the dimer and the A4:T20 base-pair assist the ligand to accommodate within the DNA minor groove (Figure 10A). The interstrand cross-link at G2-G19 is the most likely cross-linked adduct due to the formation of non- covalent interactions between the central methylene linker and A4:T20 (Figure 10B). Additionally, hydrogen bonds between N10-H of the PBDs and adjoining bases (i.e., G3 and T20) also assist in restraining the DNA in the minor groove.
In the case of the NF-κB-2 sequence, molecular modelling suggested that the most likely mono-alkylated adduct to occur would be at G5 in the forward orientation (i.e., pointing into the loop), due to potentially stabilising van der Waals interactions between the central methylene chain of SJG-136 and the T6:A18 base-pair of the hairpin (SI, Figure S13A). Based on potential energy calculations the most likely cross-link is the intrastrand cross-link between G1 and G3 (SI, Figure S13B). For the EGR-1 sequence, molecular dynamics simulations and potential energy calculations showed that the most likely mono-alkylated adduct is formed at G6 in reverse orientation (i.e., pointing away from the loop) due to van der Waals interactions and hydrogen bond formation (SI, Figure S14A). According to the potential energy calculations, the most likely cross-linked adduct, in this case, would be an interstrand cross-link between G5 and G14 due to the strong interaction of SJG-136 with the 5′-GGGC-3′ bases (SI, Figure S14B). Molecular dynamics simulations and potential energy calculations conducted on the AP-1 hairpin suggested that the most likely mono-alkylated adduct would be formed at G7 in the reverse orientation (i.e., away from the DNA loop), in which case the NH group of one PBD moiety could form a hydrogen bond to the adjacent adenine base, A14 (SI, Figure S15B). Based on the potential energy calculations, the most likely cross-linked adduct would be the shorter interstrand cross-link between G1 and G17, which suggests that the A-ring-3′ orientation (as evident in 5′-GAC-3′) may be preferred to the A-ring-5′ orientation (i.e., 5′-CATTG-3′) (SI, Figure S15A). Finally, molecular modelling with the STAT3 hairpin suggested that mono-alkylated adduct formation should be preferred over cross-links. The most preferred mono-adduct is likely to form at G7 orientated away from the loop (i.e., the reverse adduct) (SI, Figure S16B), whereas the most favoured cross- linked adduct should be formed between G6 and G19 (SI, Figure S16A).

3.4. Effect of SJG-136 on TF-Dependent Gene Expression

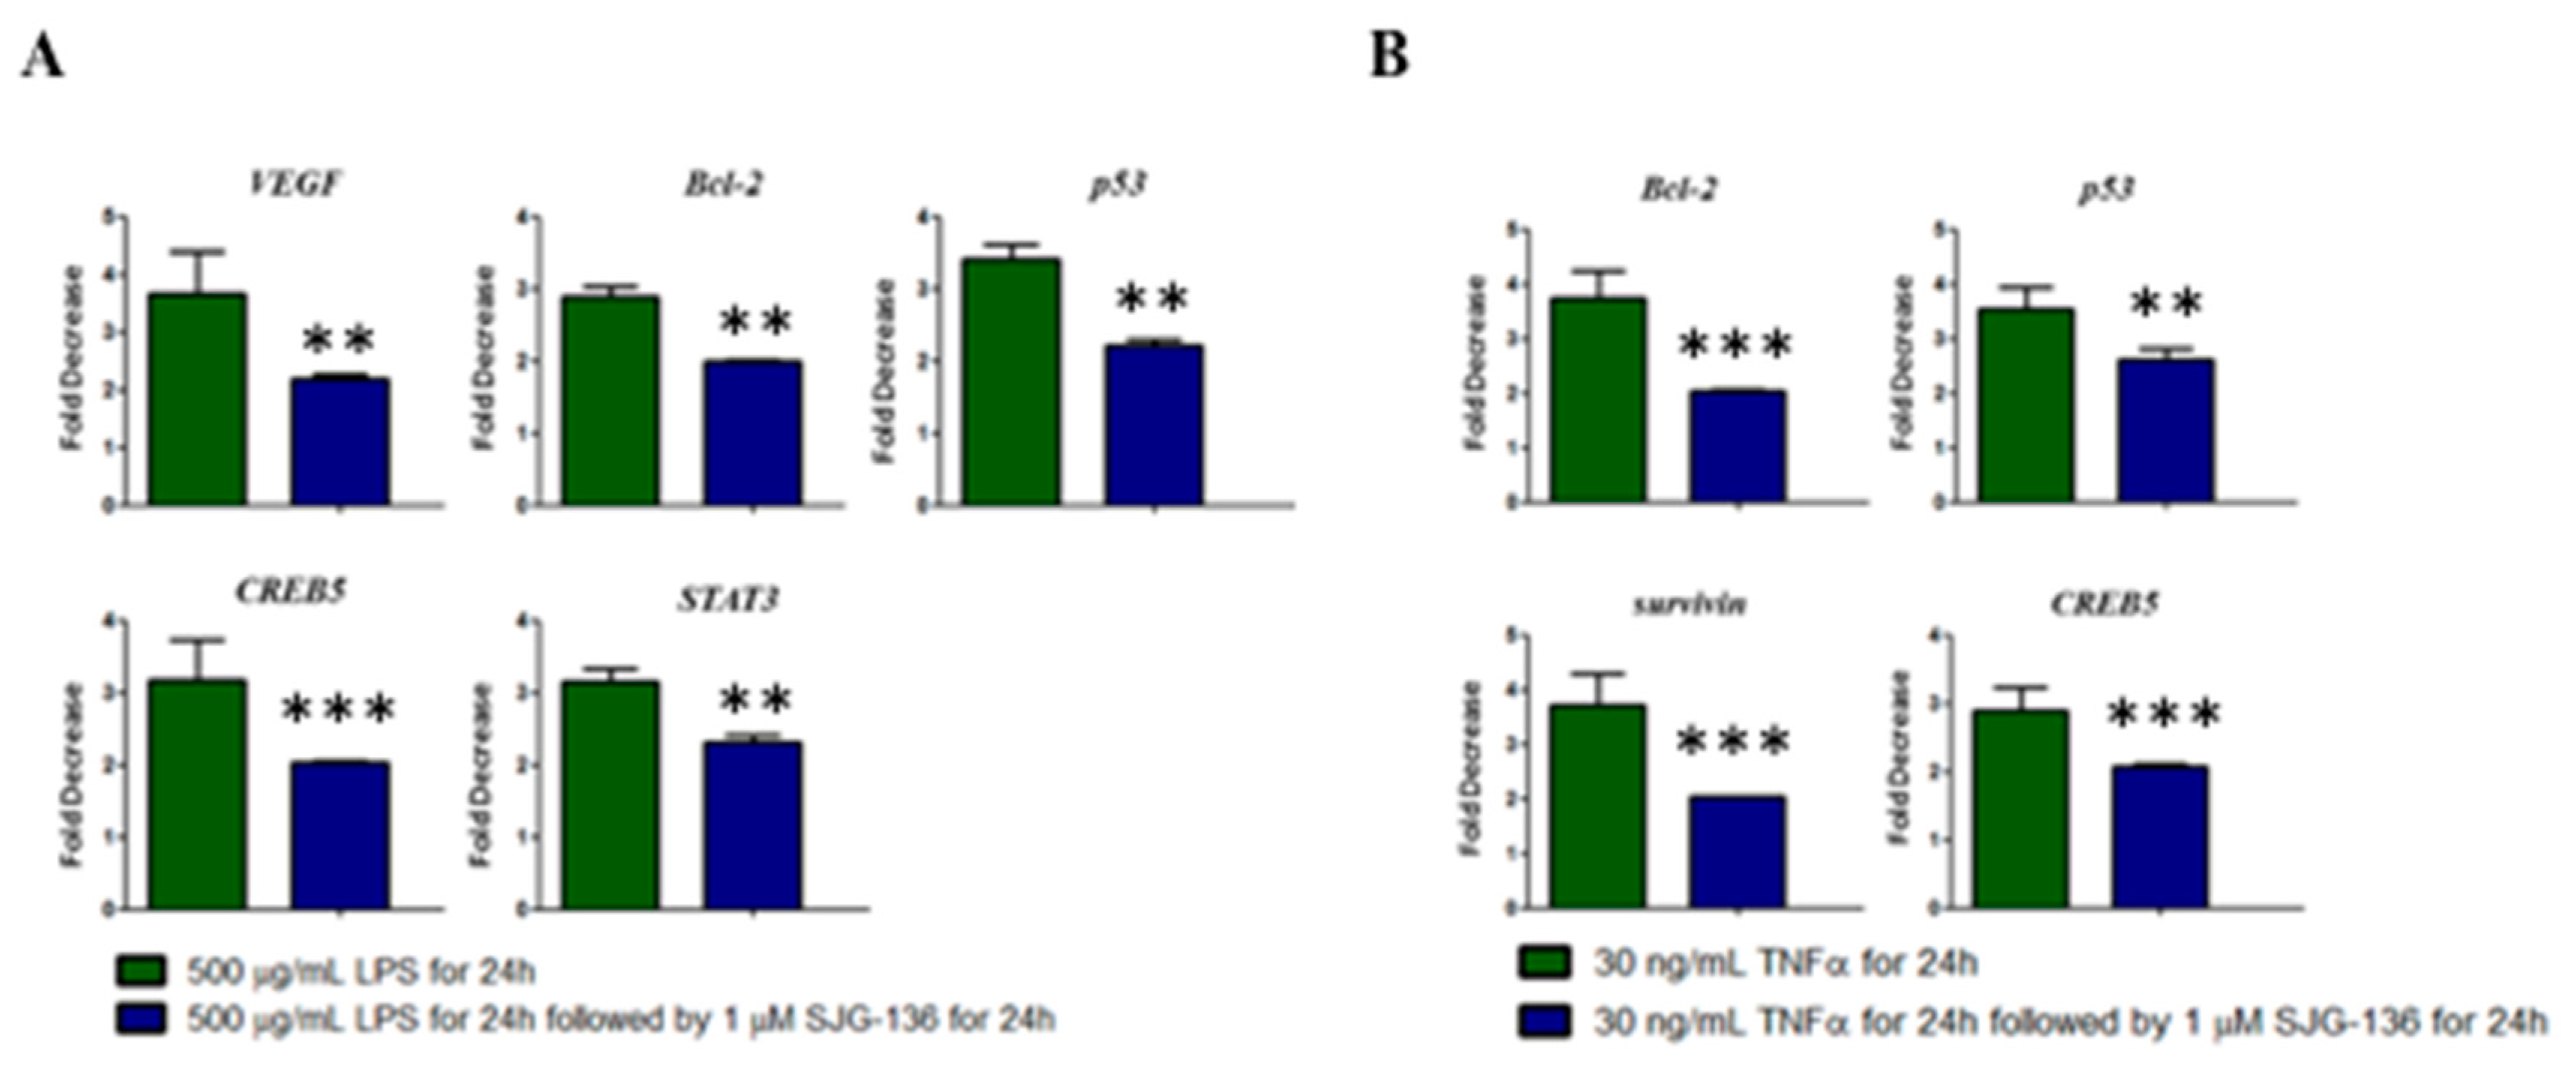
Based on the evidence from the HPLC/MS and CD studies that SJG-136 can bind to TF-relevant DNA sequences, it was decided to investigate the ability of SJG-136 to modulate TF function in the human tumour breast cancer cell line MDA-MB-231 and the human colon carcinoma cell line HT-29, selected for this study as they are reported to be STAT3- and AP-1 dependent, respectively [51,52]. Initially, expression levels of STAT3 and AP-1 in the MDA-MB-231 and AP-1 were stimulated by treating with 500 µg/mL bacterial lipopolysaccharide (LPS) and 30 ng/mL of tumour necrosis factor α (TNF-α), respectively, for 24 h at 37 °C. LPS is the major component of the outer surface membrane of Gram-negative bacteria, which functions as an extremely effective stimulator of innate and natural immunity in eukaryotic cells [53]. LPS induces a dose-dependent activation of NF-κB and overexpression of NF-κB genes [42,43]. TNF-α is a pro-inflammatory cytokine with a variety of biological functions including cell proliferation, differentiation, apoptosis, lipid metabolism, and coagulation [54]. TNF-α has been demonstrated to induce the AP-1 signalling pathway by activation of specific kinases required for phosphorylation of c-Jun and ATF2, which are components of AP-1 [44]. Due to the role of LPS and TNF-α on the induction of NF-κB and AP-1 dependent genes, respectively, they were used in this study. Following this activation process, SJG-136 was added at a 1 µM concentration to the cells followed by incubation for another 24 h at 37 °C. Quantitative PCR (qPCR) was used to determine the effect of SJG-136 on TF-dependent gene expression. VEGF, Bcl-2, p53, CREB5, STAT3, survivin, and Elk-1 were chosen for evaluation by qPCR and normalised against the reference gene β-actin. Statistical analysis was performed using 1-way ANOVA followed by Tukey’s Multiple Comparison post-test, and p-values of <0.05 were considered significant. The qPCR results are provided in Figure 11 and show that VEGF, Bcl-2, p53, CREB5, STAT3, and Elk-1 were significantly downregulated in MDA-MB-231 cells with 2.0-to-2.3-fold changes observed after the cells were stimulated with LPS and treated with SJG-136 (Figure 11A, blue column) compared to the LPS-stimulated but non-treated cells (Figure 11A, green column).
Similarly, statistical analysis showed that the expression of Bcl-2, p53, CREB5, and survivin were significantly downregulated in HT-29 after TNF-α-stimulated cells were treated with SJG-136 (Figure 11B, green versus blue columns). The fold-decrease in mRNA expression decreased from 3.7 to 2.9 (TNF-α-stimulated non-treated cells) to 2.6 to 2.0-fold (TNF-α-stimulated and SJG-136-treated cells) (Figure 11B, green versus blue column).

4. Discussion

The results obtained from the HPLC/MS study indicate that SJG-136 is capable of binding to NF-κB, EGR-1, AP-1, and STAT3 consensus sequences but with varying rates and stoichiometries. Previous studies carried out on the interaction of SJG-136 with short oligonucleotides have shown that, during the MALDI-TOF measurement, the adduct formed can separate into the parent DNA and SJG-136 due to the high energy involved in the process. This results in a higher peak for the DNA and a smaller peak for the formed SJG-136/DNA adduct [55,56,57,58], a phenomenon also observed in this study, which was in broad agreement with the MALDI-TOF results obtained in this study. Equally important are the observed differences in the rate of adduct formation. Previous studies have demonstrated that SJG-136 can form interstrand cross-links at Pu-GATC-Py and Pu-GAATC-Py sequences and intrastrand cross-linked adducts at Pu-GATG-Py and Pu-GAATG-Py sequences (rank order: Pu-GAAT > Pu-GATC-Py >> Pu-GATG-Py > Pu-GAAT(C) [16]. In addition, SJG-136 is capable of forming mono-alkylated adducts in which only one PBD unit is covalently bound at sequences that contain one suitable PBD binding site but no other suitably positioned guanines [16,57]. Surprisingly, based on the HPLC results reported here, SJG-136 formed three distinct adducts with the STAT3 sequence, while only single adducts were formed in the case of the NF-κB-1, NF-κB-2, EGR-1, and AP-1 sequences. Therefore, these results suggest that SJG-136 favours one particular binding site within the NF-κB-1, NF-κB-2, EGR-1, and AP-1 sequences, suggesting a higher degree of sequence selectivity towards these sequences compared to STAT3. Conversely, this suggests that SJG-136 may cause a greater biological effect by binding to the STAT3 sequence in cells due to the multiple adducts formed. These results add new information on the overall mechanism of action of SJG-136 and also help to understand previously reported differences in cytotoxicity of SJG-136 across different human tumour cell lines.
The CD results confirmed the ability of SJG-136 to bind to the NF-κB, EGR-1, AP-1, and STAT3 hairpin DNAs. Changes to their characteristic CD signals occurred for all sequences studied, suggesting alterations to their secondary structure after SJG-136 binding, which were significantly more pronounced after 24 h of incubation. Following the HPLC results, the AP-1/SJG-136 complex displayed the greatest change in the positive CD band, especially after 24 h of incubation, compared to the NF-κB-1, NF-κB-2, EGR-1, and STAT3 sequences.
Molecular dynamics simulations provided insights into the sequence-specific binding of SJG-136 to transcription factor recognition sequences. The molecular modelling confirmed that SJG-136 forms both mono-alkylated and cross-linked adducts, with variations in preferred binding sites across NF-κB, EGR-1, AP-1, and STAT3 sequences. The interaction of SJG-136 with NF-κB-1 showed likely mono-alkylation at G3, while interstrand cross-links at G2-G19, stabilized by van der Waals interactions and hydrogen bonding. For NF-κB-2 sequence likely mono-adduct formation at G5 and cross-linking at G1-G3. Studies with AP-1 and STAT3 showed notable differences, with AP-1 favouring G7 mono-alkylation and shorter cross-links at G1-G17, while in the case of STAT3 a preference for mono-adduct formation over cross-linking was observed. These findings further confirm that SJG-136 can form both mono-alkylated and cross-linked adducts at appropriately separated guanine bases. It should be noted that the molecular modelling study provides preliminary findings due to the short sampling time, and conducting a longer microsecond MD simulation might be helpful to obtain further confirmation of these preliminary findings.
Finally, the qPCR data suggests significant downregulation of Bcl-2, p53, CREB5, and survivin mRNA expression after stimulation of HT-29 cells with TNF-α and treatment with SJG-136, and a significant decrease of mRNA expression of VEGF, Bcl-2, p53, CREB5, STAT3, and Elk-1 in LPS-stimulated and SJG-136-treated MDA-MB-231 cells. Overall, this study provides preliminary evidence of a novel mechanism of action for the pyrrolobenzodiazepine dimer SJG-136, demonstrating its ability to bind covalently to consensus DNA sequences of oncogenic transcription factors NF-κB, EGR-1, AP-1, and STAT3 with varying rates and stoichiometries. Through a combination of HPLC-MS, CD spectroscopy, molecular dynamics simulations, and gene expression analyses, we have shown for the first time that SJG-136 can disrupt transcription factor-mediated gene expression, which contributes to its exceptional cytotoxicity in addition to the DNA-strand cleavage initiated by its ability to cross-link DNA. Interestingly, SJG-136 exhibited a preference and good reactivity toward the AP-1 sequence, with complete adduct formation, and showed pronounced effects on AP-1-dependent gene expression. These findings provide critical insights into the sequence-specific interactions of SJG-136 with DNA and highlight its potential as a dual-action chemotherapeutic agent that targets both DNA and transcription factor activity.

5. Conclusions

An ion-pair reversed-phase HPLC and MALDI-TOF-MS assay was used to study the interaction of the pyrrolobenzodiazepine (PBD) dimer SJG-136 with the cognate target DNA sequences of the oncogenic transcription factors NF-κB, EGR-1, AP-1, and STAT3 to assess transcription factor inhibition as a possible mechanism of action. Significant differences in the rate and extent of reaction with these individual DNA hairpin sequences were observed, with SJG-136 reacting rapidly with the NF-κB-2 and AP-1 sequences, but more slowly with the EGR-1, NF-kB-1, and STAT3 sequences. Furthermore, the agent formed three distinct adducts with the STAT3 consensus sequence due to the multiple GC base pairs present, whereas only a single adduct was observed to form with NF-κB, EGR-1, and AP-1 sequences. These observations were supported by the results of CD studies, with the AP-1 hairpin providing the greatest changes in the CD spectra after interaction with SJG-136. SJG-136 was also evaluated for its ability to affect gene expression in the human colon carcinoma cell line HT-29 (AP-1-dependent) and the human breast cancer cell line MDA-MB-231 (STAT3-dependent) using quantitative polymerase chain reaction (qPCR). In these experiments, SJG-136 was observed to significantly downregulate AP-1- and STAT3-dependent gene expression (e.g., Bcl-2, survivin, VEGF, CREB5, and p53). This is the first report of transcription factor inhibition as a possible additional mechanism of action for PBD dimer SJG-136. Together, these results contribute to our understanding of the mechanism of action of SJG-136 and aid in the interpretation of biochemical and pharmacological assays for structurally related PBD dimers which form part of ADC linker-payload constructs such as talirine and tesirine, the latter of which is a component of the approved antibody-drug conjugate (AD(C) loncastuximab tesirine (ZynlontaTM). Knowledge of this additional mechanism of action may help in the rational design of novel PBD dimers as payloads for ADCs, perhaps making them particularly effective against transcription factor-driven malignancies.

Supplementary Materials

The following supporting information can be downloaded at: https://www.mdpi.com/article/10.3390/dna5010008/s1, Figure S1: Interaction of GWL-78 with NF-κB-1. (A) HPLC chromatogram of NF-κB-1 sequence alone; (B) HPLC chromatogram of NF-κB-1 sequence after incubating with GWL-78 for 24 h showing the appearance one new peak at RT 7.636 min; (C) MALDI-TOF spectra of sequence NF-κB-1 (NF-κB-1 observed mass: 7033.2 m/z, theoretical mass: 7032.6 m/z); (D) MALDI-TOF spectra of GWL-78 with sequence NF-κB-1 confirming the identity of adduct formation relating to the chromatographic profiles (GWL-78/NF-κB-1 adduct observed mass: 7624 m/z, theoretical mass: 7623.2 m/z). Experiments were performed in triplicates (n = 3); Figure S2: Interaction of GWL-78 with NF-κB-2. (A) HPLC chromatogram of NF-κB-2 sequence alone; (B) HPLC chromatogram of NF-κB-2 sequence after incubating with GWL-78 for 24 h showing the appearance one new peak at RT 7.265 min; (C) MALDI-TOF spectra of sequence NF-κB-2 (NF-κB-2 observed mass: 7034.3 m/z, theoretical mass: 7032.6 m/z); (D) MALDI-TOF spectra of GWL-78 with sequence NF-κB-2 confirming the identity of adduct formation relating to the chromatographic profiles (GWL-78/NF-κB-2 adduct observed mass: 7624.2 m/z, theoretical mass: 7623.2 m/z). Experiments were performed in triplicates (n = 3); Figure S3: Interaction of GWL-78 with EGR-1. (A) HPLC chromatogram of EGR-1 sequence alone; (B) HPLC chromatogram of EGR-1 sequence after incubating with GWL-78 for 24 h showing the appearance of three different adducts at RT 8.536 min, 9.258 min, and 11.399 min; (C) MALDI-TOF spectra of sequence EGR-1 (EGR-1 observed mass: 6417.3 m/z, theoretical mass: 6416.2 m/z); (D) MALDI-TOF spectra of GWL-78 with sequence EGR-1 confirming the identity of adduct formation relating to the chromatographic profiles (GWL-78/EGR-1 adduct observed mass: 7007.4 m/z, theoretical mass: 7006.8 m/z). Experiments were performed in triplicates (n = 3); Figure S4: Interaction of GWL-78 with AP-1. (A) HPLC chromatogram of AP-1 sequence; (B) HPLC chromatogram of AP-1 sequence after incubating with GWL-78 for 24 h showing the appearance of a new major peak at RT 7.605 min; (C) MALDI-TOF spectra of sequence AP-1 (AP-1 observed mass: 5792.5 m/z, theoretical mass: 5793.8 m/z); (D) MALDI-TOF spectra of GWL-78 with sequence AP-1 confirming the identity of adduct formation relating to the chromatographic profiles (GWL-78/AP-1 adduct observed mass: 6383.9 m/z, theoretical mass 6384.4 m/z). Experiments were performed in triplicates (n = 3); Figure S5: Interaction of GWL-78 with STAT3. (A) HPLC chromatogram of STAT3 sequence alone; (B) HPLC chromatogram of STAT3 sequence after incubating with GWL-78 for 24 h showing the appearance of three new minor peaks at RT 8.536 min, RT 9.244 min, and 14.484 min; (C) MALDI-TOF spectra of sequence STAT3 (STAT3 observed mass: 6411.7 m/z, theoretical mass: 6412.2 m/z); (D) MALDI-TOF spectra of GWL-78 with sequence STAT3 confirming the identity of adduct formation relating to the chromatographic profiles (GWL-78/STAT3 adduct observed mass: 7001.9 m/z, theoretical mass 7002.8 m/z). Experiments were performed in triplicates (n = 3); Figure S6: Interaction of KMR-28-39 with NF-κB-1. (A) HPLC chromatogram of NF-κB-1 sequence alone; (B) HPLC chromatogram of NF-κB-1 sequence after incubating with KMR-28-39 for 24 h showing the appearance one new peak at RT 7.682 min; (C) MALDI-TOF spectra of sequence NF-κB-1 (NF-κB-1 observed mass: 7033.2 m/z, theoretical mass: 7032.6 m/z); (D) MALDI-TOF spectra of KMR-28-29 with sequence NF-κB-1 confirming the identity of adduct formation relating to the chromatographic profiles (KMR-28-39/NF-κB-1 adduct observed mass: 7698.4 m/z, theoretical mass: 7699.6 m/z). Experiments were performed in triplicates (n = 3); Figure S7: Interaction of KMR-28-39 with NF-κB-2. (A) HPLC chromatogram of NF-κB-2 sequence alone; (B) HPLC chromatogram of NF-κB-2 sequence after incubating with KMR-28-39 for 24 h showing the appearance one new peak at RT 6.709 min; (C) MALDI-TOF spectra of sequence NF-κB-2 (NF-κB-2 observed mass: 7034.1 m/z, theoretical mass: 7032.6 m/z); (D) MALDI-TOF spectra of KMR-28-39 with sequence NF-κB-2 confirming the identity of adduct formation relating to the chromatographic profiles (KMR-28-39/NF-κB-2 adduct observed mass: 7701.3 m/z, theoretical mass 7700.6 m/z). Experiments were performed in triplicates (n = 3); Figure S8: Interaction of KMR-28-39 with EGR-1. (A) HPLC chromatogram of EGR-1 sequence alone; (B) HPLC chromatogram of EGR-1 sequence after incubating with KMR-28-39 for 24 h showing the appearance two new minor peaks at RT 8.867 min and 16.916 min; (C) MALDI-TOF spectra of sequence EGR-1 (EGR-1 observed mass: 6417.1 m/z, theoretical mass: 6416.2 m/z); (D) MALDI-TOF spectra of KMR-28-39 with sequence EGR-1 confirming the identity of adduct formation relating to the chromatographic profiles (KMR-28-39/EGR-1 adduct observed mass: 7082.5 m/z, theoretical mass 7083.2 m/z). Experiments were performed in triplicates (n = 3); Figure S9: Interaction of KMR-28-39 with AP-1. (A) HPLC chromatogram of AP-1 sequence alone; (B) HPLC chromatogram of AP-1 sequence after incubating with KMR-28-39 for 24 h showing the appearance of one new peak at RT 8.028 min; (C) MALDI-TOF spectra of sequence AP-1 (AP-1 observed mass: 5792.9 m/z, theoretical mass: 5793.8 m/z); (D) MALDI-TOF spectra of KMR-28-39 with sequence AP-1 confirming the identity of adduct formation relating to the chromatographic profiles (KMR-28-39/AP-1 adduct observed mass: 6461.8 m/z, theoretical mass 6460.8 m/z). Experiments were performed in triplicates (n = 3); Figure S10: Interaction of KMR-28-39 with STAT3. (A) HPLC chromatogram of STAT3 sequence alone; (B) HPLC chromatogram of STAT3 sequence after incubating with KMR-28-39 for 24 h showing the appearance of one new peak at RT 8.993 min; (C) MALDI-TOF spectra of sequence STAT3 (STAT3 observed mass: 6413.5 m/z, theoretical mass 6412.2 m/z); (D) MALDI-TOF spectra of KMR-28-39 with sequence STAT3 confirming the identity of adduct formation relating to the chromatographic profiles (KMR-28-39/STAT3 adduct observed mass: 7078.5 m/z, theoretical mass 7079.2 m/z). Experiments were performed in triplicates (n = 3); Figure S11: MALDI-TOF spectra confirming the identity of SJG-136 forming adduct with 12 bp long dsDNA. (A) MALDI–TOF MS spectrum of dsDNA alone showing that dsDNA separates into the corresponding single stranded DNA under the MALDI-TOF conditions; (B) MALDI–TOF MS spectrum of the 1:1 SJG-136/dsDNA adduct. The ion at m/z 7844.5 corresponds to the [M+H]+ ion of the SJG-136/dsDNA adduct, and the ions at 7284.3 and 3644.8 correspond to [M+H]+ ions of dsDNA and ssDNA, respectively, formed by in source fragmentation; Figure S12: CD spectra showing the interaction of SJG-136 with NF-κB-1, NF-κB-2, EGR-1, AP-1, and STAT3 sequences. (A) NF-κB-1 sequence alone (black) and NF-κB-1/SJG-136 complex at t = 0 h; (B) NF-κB-1 sequence alone (black) and NF-κB-1/SJG-136 complex at t = 24 h showing binding of SJG-136 to NF-κB-1sequence; (C) NF-κB-2 sequence alone (black) and NF-κB-2/SJG-136 complex at t = 0 h; (D) NF-κB-2 sequence alone (black) and NF-κB-2/SJG-136 complex at t = 24 h confirming binding of SJG-136 to NF-κB-2 sequence; (E) EGR-1 sequence alone (black) and EGR-1/SJG-136 complex at t = 0 h; (F) EGR-1 sequence alone (black) and EGR-1/SJG-136 complex at t = 24 h showing binding of SJG-136 to EGR-1 sequence; (G) AP-1 sequence alone (black) and AP-1/SJG-136 complex at t = 0 h; (H) AP-1 sequence alone (black) and AP-1/SJG-136 complex at t = 24 h confirming binding of SJG-136 to AP-1 sequence; (I) STAT3 sequence alone (black) and STAT3/SJG-136 complex at t = 0 h; (J) STAT3 sequence alone (black) and STAT3/SJG-136 complex at t = 24 h showing binding of SJG-136 to STAT3 sequence. Experiments were performed in triplicates (n = 3); Figure S13: Low energy snapshots. (A) SJG-136 (green) covalently bound to G5 (magenta) of NF-κB-2 sequence in reverse orientation (i.e., pointing away from the TTT-loop); (B) SJG-136 (blue) covalently bound to G4 and G17 (magenta) of NF-κB-2. G5 (which impedes ligand binding) is yellow and bases involved in non-covalent interactions are illustrated in orange sticks. Figure S14: Low energy snapshots. (A) SJG-136 (green) covalently bound to G6 (magenta) of EGR-1 sequence in reverse orientation (i.e., pointing away from the TTT-loop). Bases involved in non-covalent interactions are illustrated in orange sticks; (B) SJG-136 (green) covalently bound to G5 and G14 (magenta) of EGR-1 sequence in reverse orientation (i.e., pointing away from the TTT-loop). Bases involved in non-covalent interactions are illustrated in cyan sticks; Figure S15: Low energy snapshots. (A) SJG-136 (green) covalently bound to G1 and G17 (magenta) of AP-1 sequence forming an interstrand cross-link across the sequence 5′-GAC-3′; (B) SJG-136 (green) covalently bound to G7 of AP-1 sequence. The NH group of the PBD forms a hydrogen bond with an adjacent adenine base, A14 (yellow). Figure S16: Low energy snapshots. (A) SJG-136 (green) covalently bound to G6 and G19 (magenta) of the STAT3 sequence. The NH groups of each PBD form hydrogen bonds to cytosine residues (i.e., C17 illustrated in orange and C4 illustrated in yellow) and form covalent bonds with G6 and G19, spanning the sequence 5′-Py-CCGG-Pu-3′; (B) SJG-136 (green) covalently bound to G7 (magenta) of the STAT3 sequence. The NH group of the PBD forms a stabilising H-bond to C16 (yellow); Table S1: Primers used for PCR study for STAT3; Table S2: Primers used for PCR study for AP-1; Table S3: Primers used for qPCR study; Table S4: Extent of adduct formation after 24 h SJG-136 with transcription factor sequences NF-κB-1, NF-κB-2, EGR-1, AP-1 and STAT3 (formed adduct in %); Table S5: Number of adducts observed after 24 h between SJG-136 and the transcription factor sequences NF-κB-1, NF-κB-2, EGR-1, AP-1 and STAT3 (number of adducts formed); Table S6: Potential Energy (kcal/mol) of SJG-136 covalently bound to every potential reacting guanine of NF-κB-1, NF-κB-2, EGR-1, AP-1 and STAT3 sequences. (F) indicates a forward adduct (i.e., towards the TTT-loop) and (R) indicates a reverse adduct (i.e., away from the DNA loop).

Author Contributions

Conceptualization, J.M., P.J.M.J., D.E.T. and K.M.R.; Methodology, J.M. and P.J.M.J.; Software, J.M. and P.J.M.J.; Validation, J.M., P.J.M.J. and K.M.R.; Formal analysis, J.M., P.J.M.J., R.B.P., T.T.T.B., D.E.T. and K.M.R.; Investigation, J.M. and P.J.M.J.; Resources, D.E.T., R.B.P. and K.M.R.; Data curation, J.M., P.J.M.J. and K.M.R.; Writing—original draft preparation, J.M., P.J.M.J. and K.M.R.; Writing—review and editing, J.M., P.J.M.J. and K.M.R.; Supervision, D.E.T., R.B.P., T.T.T.B. and K.M.R.; Project administration, D.E.T. and K.M.R.; Funding acquisition, D.E.T. and K.M.R. All authors have read and agreed to the published version of the manuscript.

Funding

This research received no external funding.

Institutional Review Board Statement

Not applicable.

Informed Consent Statement

Not applicable.

Data Availability Statement

The research data is available and will be provided upon request.

Acknowledgments

Spirogen Ltd. is acknowledged for providing a sample of SJG-136.

Conflicts of Interest

The authors declare no conflicts of interest.

References

  1. Latchman, D.S. Transcription factors: An overview. Int. J. Biochem. Cell Biol. 1997, 29, 1305–1312. [Google Scholar] [CrossRef] [PubMed]
  2. Karin, M. Too many transcription factors: Positive and negative interactions. New Biol. 1990, 2, 126–131. [Google Scholar] [PubMed]
  3. Ptashne, M.; Gann, A. Transcriptional activation by recruitment. Nature 1997, 386, 569–577. [Google Scholar] [CrossRef] [PubMed]
  4. Mitchell, P.J.; Tjian, R. Transcriptional regulation in mammalian cells by sequence-specific DNA binding proteins. Science 1989, 245, 371–378. [Google Scholar] [CrossRef]
  5. Babu, M.M.; Luscombe, N.M.; Aravind, L.; Gerstein, M.; Teichmann, S.A. Structure and evolution of transcriptional regulatory networks. Curr. Opin. Struct. Biol. 2004, 14, 283–291. [Google Scholar] [CrossRef]
  6. Gill, G. Regulation of the initiation of eukaryotic transcription. Essays Biochem. 2001, 37, 33–43. [Google Scholar]
  7. Boyadjiev, S.A.; Jabs, E.W. Online Mendelian Inheritance in Man (OMIM) as a knowledgebase for human developmental disorders. Clin. Genet. 2000, 57, 253–266. [Google Scholar] [CrossRef]
  8. Dervan, P.B. Molecular recognition of DNA by small molecules. Bioorg. Med. Chem. 2001, 9, 2215–2235. [Google Scholar] [CrossRef]
  9. Neidle, S. DNA minor-groove recognition by small molecules. Nat. Prod. Rep. 2001, 18, 291–309. [Google Scholar] [CrossRef]
  10. Smellie, M.; Bose, D.S.; Thompson, A.S.; Jenkins, T.C.; Hartley, J.A.; Thurston, D.E. Sequence-selective recognition of duplex DNA through covalent interstrand cross-linking: Kinetic and molecular modeling studies with pyrrolobenzodiazepine dimers. Biochemistry 2003, 42, 8232–8239. [Google Scholar] [CrossRef]
  11. Leimgruber, W.; Stefanovic, V.; Schenker, F.; Karr, A.; Berger, J. Isolation and characterization of anthramycin, a new antitumor antibiotic. J. Am. Chem. Soc. 1965, 87, 5791–5793. [Google Scholar] [CrossRef] [PubMed]
  12. Antonow, D.; Thurston, D.E. Synthesis of DNA-interactive pyrrolo[2,1-c][1,4]benzodiazepines (PBDs). Chem. Rev. 2011, 111, 2815–2864. [Google Scholar] [CrossRef] [PubMed]
  13. Wells, G.; Martin, C.R.H.; Howard, P.W.; Sands, Z.A.; Laughton, C.A.; Tiberghien, A.; Woo, C.K.; Masterson, L.A.; Stephenson, M.J.; Hartley, J.A.; et al. Design, synthesis, and biophysical and biological evaluation of a series of pyrrolobenzodiazepine-poly(N-methylpyrrole) conjugates. J. Med. Chem. 2006, 49, 5442–5461. [Google Scholar] [CrossRef] [PubMed]
  14. Rahman, K.M.; Jackson, P.J.M.; James, C.H.; Basu, B.P.; Hartley, J.A.; Schatzlein, A.; Robson, M.; Pedley, R.B.; Pepper, C.; Fox, K.R.; et al. GC-targeted C8-linked pyrrolobenzodiazepine-biaryl conjugates with femtomolar in vitro cytotoxicity and in vivo antitumor activity in mouse models. J. Med. Chem. 2013, 56, 2911–2935. [Google Scholar] [CrossRef] [PubMed]
  15. Gregson, S.J.; Howard, P.W.; Hartley, J.A.; Brooks, N.A.; Adams, L.J.; Jenkins, T.C.; Kelland, L.R.; Thurston, D.E. Design, synthesis, and evaluation of a novel pyrrolobenzodiazepine DNA-interactive agent with highly efficient cross-linking ability and potent cytotoxicity. J. Med. Chem. 2001, 44, 737–748. [Google Scholar] [CrossRef]
  16. Rahman, K.M.; Thompson, A.S.; James, C.H.; Narayanaswamy, M.; Thurston, D.E. The pyrrolobenzodiazepine dimer SJG-136 forms sequence-dependent intrastrand DNA cross-links and monoalkylated adducts in addition to interstrand cross-links. J. Am. Chem. Soc. 2009, 131, 13756–13766. [Google Scholar] [CrossRef]
  17. Gregson, S.J.; Howard, P.W.; Gullick, D.R.; Hamaguchi, A.; Corcoran, K.E.; Brooks, N.A.; Hartley, J.A.; Jenkins, T.C.; Patel, S.; Guille, M.J.; et al. Linker length modulates DNA cross-linking reactivity and cytotoxic potency of C8/C8′ ether-linked C2-exo-unsaturated pyrrolo[2,1-c][1,4]benzodiazepine (PBD) dimers. J. Med. Chem. 2004, 47, 1161–1174. [Google Scholar] [CrossRef]
  18. Bose, D.S.; Thompson, A.S.; Ching, J.S.; Hartley, J.A.; Berardini, M.D.; Jenkins, T.C.; Neidle, S.; Hurley, L.H.; Thurston, D.E. Rational Design of a Highly Efficient Irreversible DNA Interstrand Cross-Linking Agent Based on the Pyrrolobenzodiazepine Ring-System. J. Am. Chem. Soc. 1992, 114, 4939–4941. [Google Scholar] [CrossRef]
  19. Hartley, J.A.; Spanswick, V.J.; Brooks, N.; Waud, W.R.; Hartley, J.A.; Howard, P.W.; Gregson, S.J.; Thurston, D.E.; Sausville, E.A. SJG-136 (NSC 694501), a novel rationally designed DNA minor groove interstrand cross-linking agent with potent and broad spectrum antitumor activity: Part 1: Cellular pharmacology, in vitro and initial in vivo antitumor activity. Cancer Res. 2004, 64, 6693–6699. [Google Scholar] [CrossRef]
  20. Rahman, K.M.; Rosado, H.; Moreira, J.B.; Feuerbaum, E.-A.; Fox, K.R.; Stecher, E.; Howard, P.W.; Gregson, S.J.; James, C.H.; de la Fuente, M.; et al. Antistaphylococcal activity of DNA-interactive pyrrolobenzodiazepine (PBD) dimers and PBD-biaryl conjugates. J. Antimicrob. Chemother. 2012, 67, 1683–1696. [Google Scholar] [CrossRef]
  21. Andriollo, P.; Hind, C.K.; Picconi, P.; Nahar, K.S.; Jamshidi, S.; Varsha, A.; Clifford, M.; Sutton, J.M.; Rahman, K.M. C8-linked pyrrolobenzodiazepine monomers with inverted building blocks show selective activity against multidrug resistant Gram-positive bacteria. ACS Infect. Dis. 2018, 4, 158–174. [Google Scholar] [CrossRef] [PubMed]
  22. Picconi, P.; Hind, C.K.; Nahar, K.S.; Jamshidi, S.; Di Maggio, L.; Saeed, N.; Evans, B.; Solomons, J.; Wand, M.E.; Sutton, J.M.; et al. New Broad-Spectrum Antibiotics Containing a Pyrrolobenzodiazepine Ring with Activity against Multidrug-Resistant Gram-Negative Bacteria. J. Med. Chem. 2020, 63, 6941–6958. [Google Scholar] [CrossRef] [PubMed]
  23. Kung Sutherland, M.S.; Walter, R.B.; Jeffrey, S.C.; Burke, P.J.; Yu, C.; Kostner, H.; Stone, I.; Ryan, M.C.; Sussman, D.; Lyon, R.P.; et al. SGN-CD33A: A novel CD33-targeting antibody-drug conjugate using a pyrrolobenzodiazepine dimer is active in models of drug-resistant AML. Blood 2013, 122, 1455–1463. [Google Scholar] [CrossRef] [PubMed]
  24. Reid, J.M.; Buhrow, S.A.; Kuffel, M.J.; Jia, L.; Spanswick, V.J.; Hartley, J.A.; Thurston, D.E.; Tomaszewski, J.E.; Ames, M.M. Pharmacokinetics, pharmacodynamics and metabolism of the dimeric pyrrolobenzodiazepine SJG-136 in rats. Cancer Chemother. Pharmacol. 2011, 68, 777–786. [Google Scholar] [CrossRef]
  25. Puvvada, M.S.; Hartley, J.A.; Jenkins, T.C.; Thurston, D.E. A quantitative assay to measure the relative DNA-binding affinity of pyrrolo[2,1-c] [1,4]benzodiazepine (PBD) antitumour antibiotics based on the inhibition of restriction endonuclease BamHI. Nucleic Acids Res. 1993, 21, 3671–3675. [Google Scholar] [CrossRef]
  26. Shameem, M.; Kumar, R.; Krishna, S.; Kumar, C.; Siddiqi, M.I.; Kundu, B.; Banerjee, D. Synthetic modified pyrrolo[1,4] benzodiazepine molecules demonstrate anticancer activity by targeting the human ligase 1 enzyme: An in silico and in vitro mechanistic study. Chem. Biol. Interact. 2015, 237, 115–124. [Google Scholar] [CrossRef]
  27. Baraldi, P.G.; Cacciari, B.; Guiotto, A.; Romagnoli, R.; Spalluto, G.; Leoni, A.; Bianchi, N.; Feriotto, G.; Rutigliano, C.; Mischiati, C.; et al. [2,1-c][1,4]benzodiazepine (PBD)-distamycin hybrid inhibits DNA binding to transcription factor Sp1. Nucleosides Nucleotides Nucleic Acids 2000, 19, 1219–1229. [Google Scholar] [CrossRef]
  28. Kotecha, M.; Kluza, J.; Wells, G.; Caroline, O.C.; Forni, C.; Mantovani, R.; Howard, P.W.; Morris, P.; Thurston, D.E.; Hartley, J.A.; et al. Inhibition of DNA binding of the NF-Y transcription factor by the pyrrolobenzodiazepine-polyamide conjugate GWL-78. Mol. Cancer Ther. 2008, 7, 1319–1328. [Google Scholar] [CrossRef]
  29. Brucoli, F.; Hawkins, R.M.; James, C.H.; Wells, G.; Jenkins, T.C.; Ellis, T.; Hartley, J.A.; Howard, P.W.; David, E. ThurstonNovel C8-linked pyrrolobenzodiazepine (PBD)-heterocycle conjugates that recognize DNA sequences containing an inverted CCAAT box. Bioorg. Med. Chem. Lett. 2011, 21, 3780–3783. [Google Scholar] [CrossRef]
  30. Chou, Y.W.; Senadi, G.C.; Chen, C.Y.; Kuo, K.K.; Lin, Y.T.; Wang, J.J.; Lee, J.H.; Wang, Y.C.; Hu, W.P. Design and synthesis of pyrrolobenzodiazepine-gallic hybrid agents as p53-dependent and -independent apoptogenic signaling in melanoma cells. Eur. J. Med. Chem. 2016, 109, 59–74. [Google Scholar] [CrossRef]
  31. Hsieh, M.C.; Hu, W.P.; Yu, H.S.; Wu, W.C.; Chang, L.S.; Kao, Y.H.; Wang, J.J. A DC-81-indole conjugate agent suppresses melanoma A375 cell migration partially via interrupting VEGF production and stromal cell-derived factor-1alpha-mediated signaling. Toxicol. Appl. Pharmacol. 2011, 255, 150–159. [Google Scholar] [CrossRef] [PubMed]
  32. Thurston, D.E.; Pysz, I. Chemistry and Pharmacology of Anticancer Drugs, 2nd ed.; CRC Press: Boca Raton, FL, USA, 2021. [Google Scholar]
  33. Agarwal, S.; Fang, L.; McGowen, K.; Yin, J.; Bowman, J.; Ku, A.T.; Alilin, A.N.; Corey, E.; Roudier, M.P.; True, L.D.; et al. Tumor-derived biomarkers predict efficacy of B7H3 antibody-drug conjugate treatment in metastatic prostate cancer models. J. Clin. Investig. 2023, 133, e162148. [Google Scholar] [CrossRef] [PubMed]
  34. Zou, N.; Han, A. Application of Pyrrolobenzodiazepines in Antibody Drug Conjugates. In Contemporary Accounts in Drug Discovery and Development; Willy: Hoboken, NJ, USA, 2022; pp. 293–339. [Google Scholar]
  35. Lewis, G.; Li, G.; Guo, J.; Yu, S.-F.; Fields, C.; Lee, G.; Zhang, D.; Dragovich, P.; Pillow, T.; Wei, B.; et al. The HER2-directed antibody-drug conjugate DHES0815A in advanced and/or metastatic breast cancer: Preclinical characterization and phase 1 trial results. Nat. Commun. 2024, 15, 466. [Google Scholar]
  36. Hartley, J.A. Antibody-drug conjugates (ADCs) delivering pyrrolobenzodiazepine (PBD) dimers for cancer therapy. Opin. Biol. Ther. 2021, 21, 931–943. [Google Scholar] [CrossRef] [PubMed]
  37. Tad, D.A.C.; Cheatham, T.E., III; Simmerling, C.L.; Wang, J.; Duke, R.E.; Luo, R.; Walker, R.C.; Zhang, W.; Merz, K.M.; Roberts, B.; et al. AMBER 12; University of California: San Francisco, CA, USA, 2012. [Google Scholar]
  38. Perez, A.; Marchan, I.; Svozil, D.; Sponer, J.; Cheatham, T.E.; Laughton, C.A.; Orozco, M. Refinement of the AMBER force field for nucleic acids: Improving the description of alpha/gamma conformers. Biophys. J. 2007, 92, 3817–3829. [Google Scholar] [CrossRef]
  39. Rao, S.N.; Singh, U.C.; Kollman, P.A. Molecular mechanics simulations on covalent complexes between anthramycin and B DNA. J. Med. Chem. 1986, 29, 2484–2492. [Google Scholar] [CrossRef]
  40. Humphrey, W.; Dalke, A.; Schulten, K. VMD: Visual molecular dynamics. J. Mol. Graph. 1996, 14, 33–38. [Google Scholar] [CrossRef]
  41. Pettersen, E.F.; Goddard, T.D.; Huang, C.C.; Couch, G.S.; Greenblatt, D.M.; Meng, E.C.; Ferrin, T.E. UCSF Chimera—A visualization system for exploratory research and analysis. J. Comput. Chem. 2004, 25, 1605–1612. [Google Scholar] [CrossRef]
  42. Sharif, O.; Bolshakov, V.N.; Raines, S.; Newham, P.; Perkins, N.D. Transcriptional profiling of the LPS induced NF-κB response in macrophages. BMC Immunol. 2007, 8, 1. [Google Scholar] [CrossRef]
  43. Chen, M.-C.; Chang, W.-W.; Kuan, Y.-D.; Lin, S.-T.; Hsu, H.-C.; Lee, C.-H. Resveratrol inhibits LPS-induced epithelial-mesenchymal transition in mouse melanoma model. Innate Immun. 2012, 18, 685–693. [Google Scholar] [CrossRef]
  44. Chang, L.; Karin, M. Mammalian MAP kinase signalling cascades. Nature 2001, 410, 37–40. [Google Scholar] [CrossRef]
  45. Rahman, K.M.; Mussa, V.; Narayanaswamy, M.; James, C.H.; Howard, P.W.; Thurston, D.E. Observation of a dynamic equilibrium between DNA hairpin and duplex forms of covalent adducts of a minor groove binding agent. Chem. Commun. 2009, 227–229. [Google Scholar] [CrossRef] [PubMed]
  46. Alley, M.C.; Hollingshead, M.G.; Pacula-Cox, C.M.; Hartley, J.A.; Spanswick, V.J.; Brooks, N.; Clingen, P.H.; McHugh, P.J.; Hochhauser, D.; Pedley, R.B.; et al. SJG-136 (NSC 694501), a novel rationally designed DNA minor groove interstrand cross-linking agent with potent and broad spectrum antitumor activity: Part 2: Efficacy evaluations. Cancer Res. 2004, 18, 6700–6706. [Google Scholar] [CrossRef] [PubMed]
  47. Chang, Y.M.; Chen, C.K.; Hou, M.H. Conformational changes in DNA upon ligand binding monitored by circular dichroism. Int. J. Mol. Sci. 2012, 13, 3394–3413. [Google Scholar] [CrossRef] [PubMed]
  48. Kaushik, M.; Kukreti, R.; Grover, D.; Brahmachari, S.K.; Kukreti, S. Hairpin-duplex equilibrium reflected in the A-->B transition in an undecamer quasi-palindrome present in the locus control region of the human beta-globin gene cluster. Nucleic Acids Res. 2003, 31, 6904–6915. [Google Scholar] [CrossRef]
  49. Kypr, J.; Kejnovska, I.; Renciuk, D.; Vorlickova, M. Circular dichroism and conformational polymorphism of DNA. Nucleic Acids Res. 2009, 37, 1713–1725. [Google Scholar] [CrossRef]
  50. Fornasiero, D.; Kurucsev, T. Circular-Dichroism Spectra and the Interaction between Acridine-Dyes and Deoxyribonucleic-Acid. J. Phys. Chem. 1981, 85, 613–618. [Google Scholar] [CrossRef]
  51. Chun, J.; Li, R.-J.; Cheng, M.-S.; Kim, Y.S. Alantolactone selectively suppresses STAT3 activation and exhibits potent anticancer activity in MDA-MB-231 cells. Cancer Lett. 2015, 357, 393–403. [Google Scholar] [CrossRef]
  52. McLoughlin, P.; Roengvoraphoj, M.; Gissel, C.; Hescheler, J.; Certa, U.; Sachinidis, A. Transcriptional responses to epigallocatechin-3 gallate in HT 29 colon carcinoma spheroids. Genes Cells 2004, 9, 661–669. [Google Scholar] [CrossRef]
  53. Raetz, C.R.; Whitfield, C. Lipopolysaccharide endotoxins. Annu. Rev. Biochem. 2002, 71, 635–700. [Google Scholar] [CrossRef]
  54. Wajant, H.; Pfizenmaier, K.; Scheurich, P. Tumor necrosis factor signaling. Cell Death Differ. 2003, 10, 45–65. [Google Scholar] [CrossRef]
  55. Narayanaswamy, M.; Griffiths, W.J.; Howard, P.W.; Thurston, D.E. An assay combining high-performance liquid chromatography and mass spectrometry to measure DNA interstrand cross-linking efficiency in oligonucleotides of varying sequences. Anal. Biochem. 2008, 374, 173–181. [Google Scholar] [CrossRef] [PubMed]
  56. Rahman, K.M.; James, C.H.; Thurston, D.E. Effect of base sequence on the DNA cross-linking properties of pyrrolobenzodiazepine (PBD) dimers. Nucleic Acids Res. 2011, 39, 5800–5812. [Google Scholar] [CrossRef] [PubMed]
  57. Rahman, K.M.; James, C.H.; Bui, T.T.; Drake, A.F.; Thurston, D.E. Observation of a single-stranded DNA/pyrrolobenzodiazepine adduct. J. Am. Chem. Soc. 2011, 133, 19376–19385. [Google Scholar] [CrossRef] [PubMed]
  58. Rahman, K.M.; James, C.H.; Thurston, D.E. Observation of the reversibility of a covalent pyrrolobenzodiazepine (PBD) DNA adduct by HPLC/MS and CD spectroscopy. Org. Biomol. Chem. 2011, 9, 1632–1641. [Google Scholar] [CrossRef]
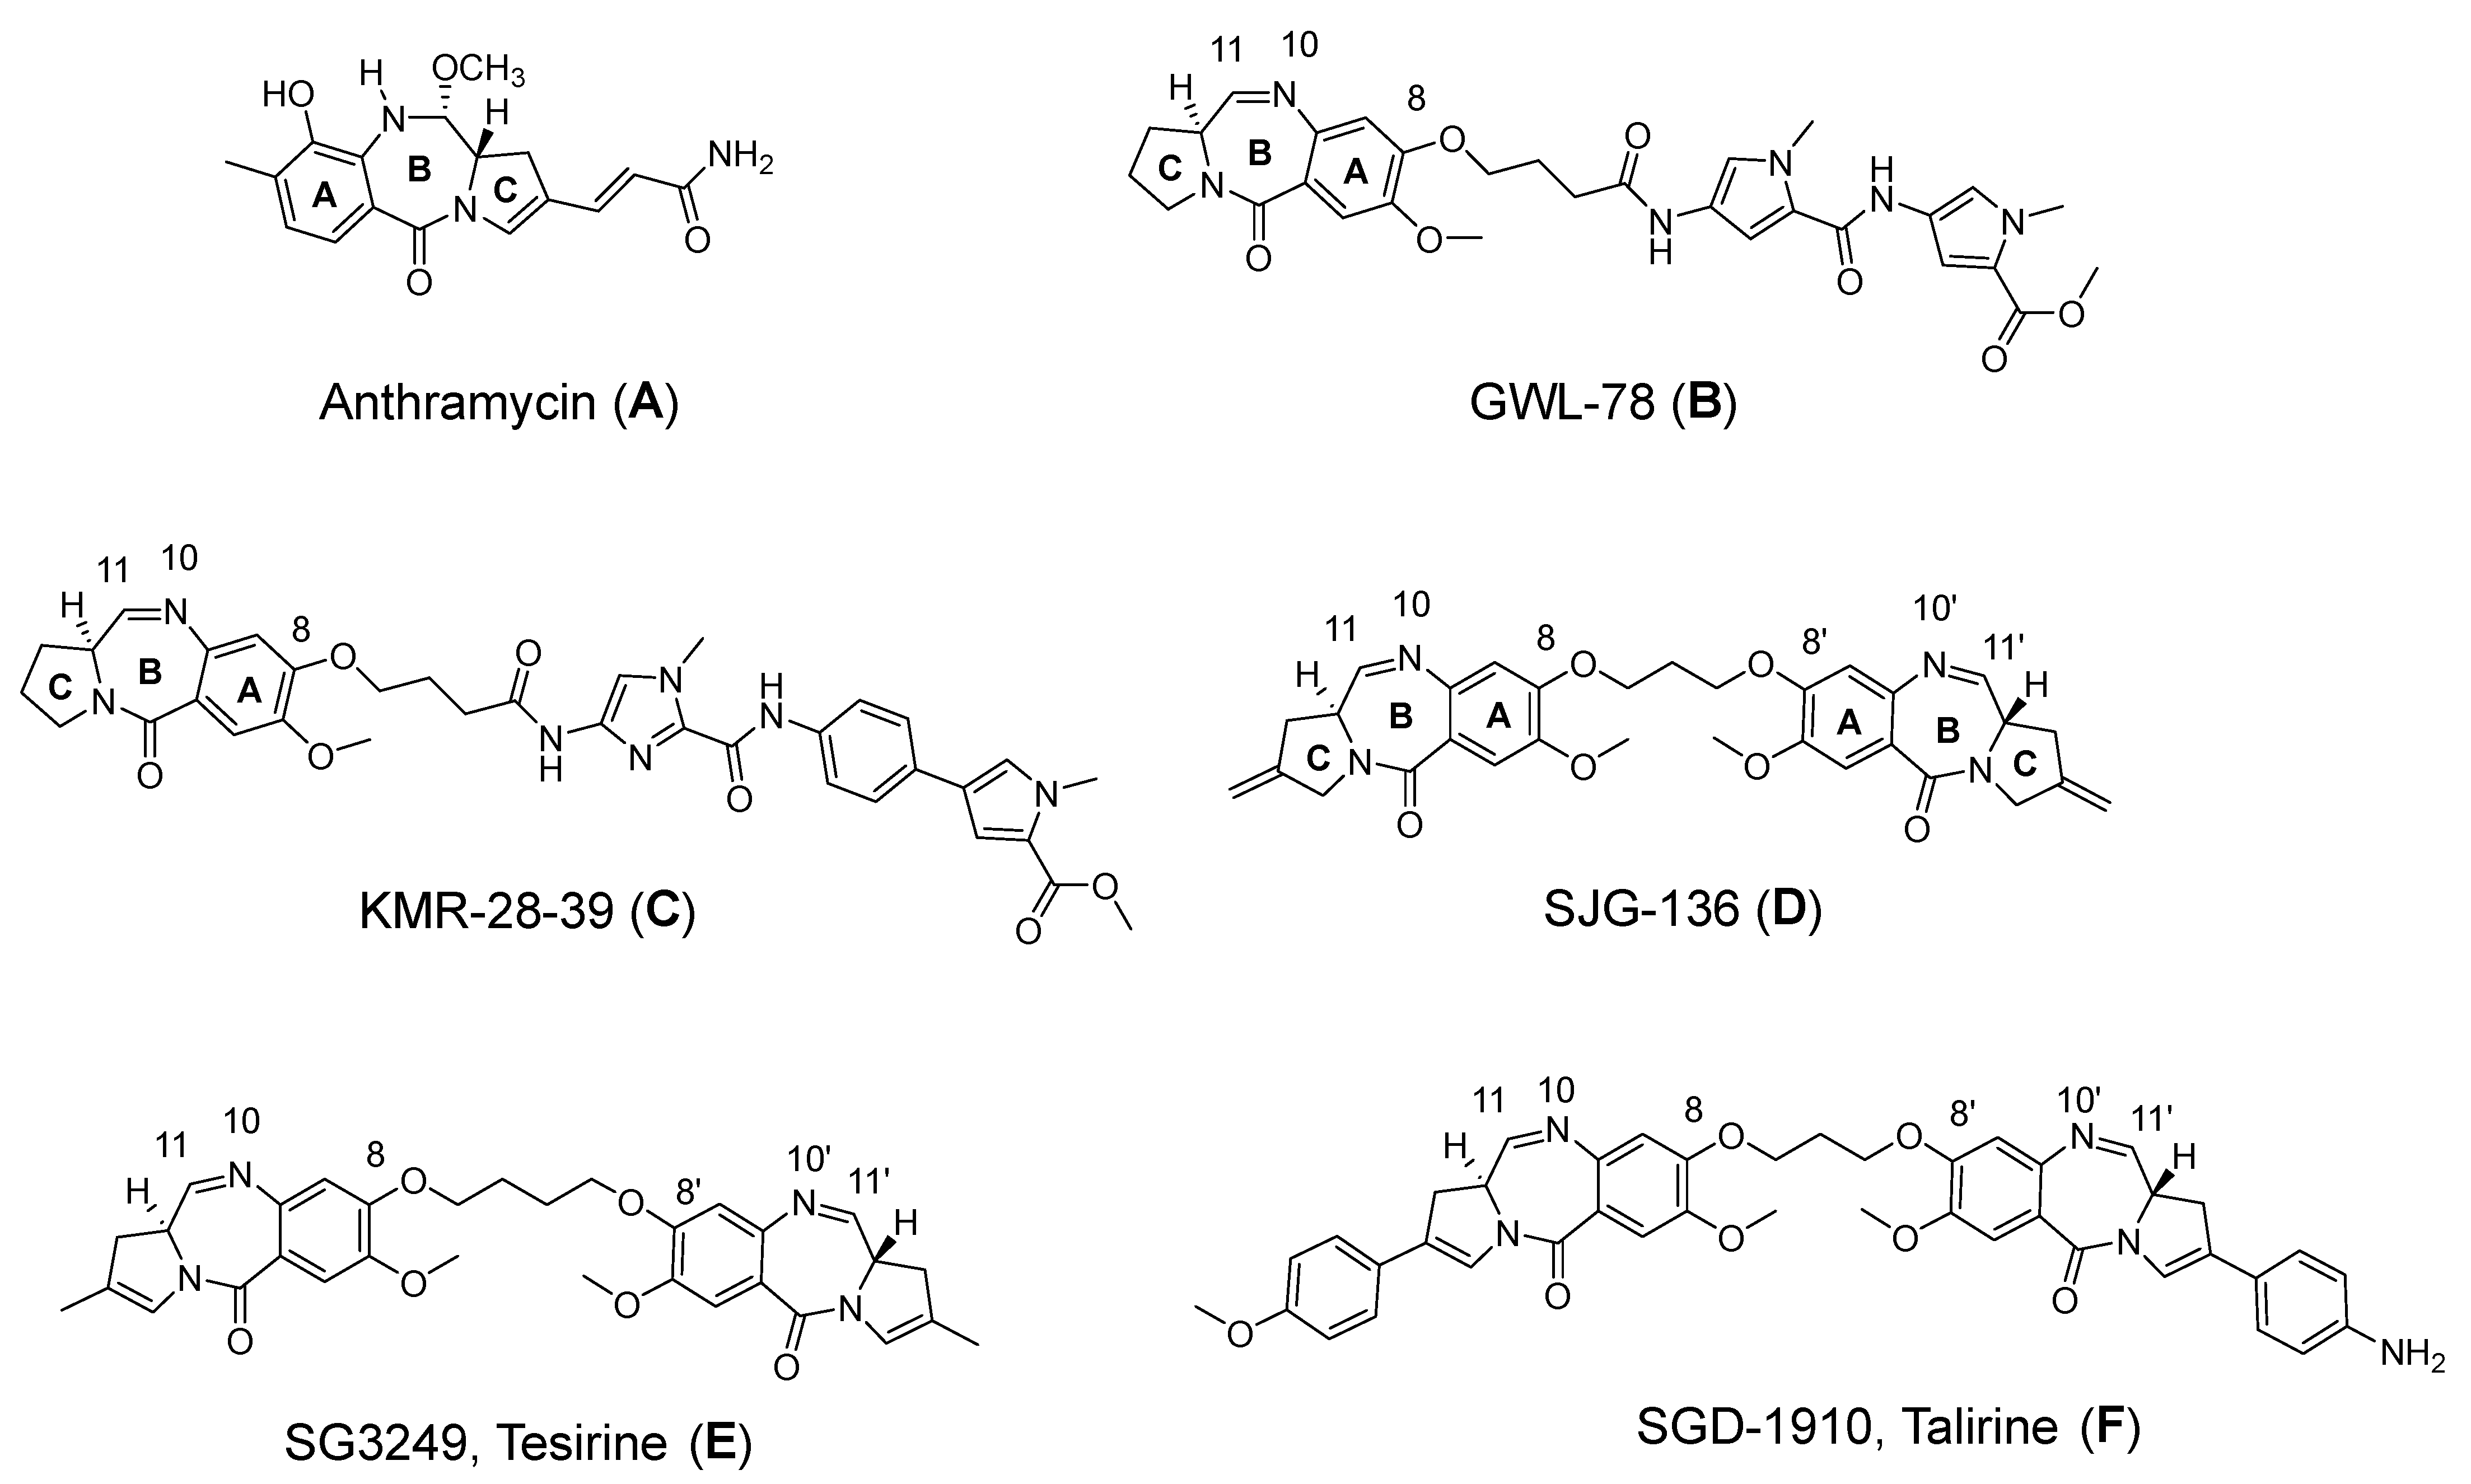
Figure 1. Structures of the naturally occurring anthramycin (A), the C8-bis-pyrrole PBD Conjugate GWL-78 (B), the PBD 4-(1-methyl-1H-pyrrol-3-yl)benzenamine (MPB) conjugate KMR-28-39 (C), the C8/C8’-linked PBD dimer SJG-136 (D), the structurally related PBD dimer ADC payloads, Tesirine (E), and Talirine (F).
Dna 05 00008 g001
Figure 2. (A) Schematic diagram of the mechanism of covalent binding of a PBD molecule to a guanine base; (B) Low-energy snapshot of a molecular model of the PBD dimer SJG-136 (green) covalently bound to G5 and G14 (purple/magenta) of the consensus sequence of the transcription factor EGR-1. DNA bases involved in the non-covalent interactions are shown as cyan sticks. Blue colour represents nitrogen atom. Dash lines represent hydrogen bonds.
Dna 05 00008 g002
Figure 3. Structure of the hairpin oligonucleotides used in this study that contain the cognate sequences of the transcription factors NF-κB (two possible sequences NF-κB-1 and NF-κB-2), EGR-1, AP-1, and STAT3.
Dna 05 00008 g003
Figure 4. The interaction of SJG–136 with NF–κB–1. (A) HPLC chromatogram of NF–κB–1 alone; (B) HPLC chromatogram of the SJG–136/NF–κB–1 adduct; (C) MALDI–TOF spectrum of the NF–κB–1 sequence alone; (D) MALDI–TOF spectrum of the SJG–136/NF–κB–1 adduct.
Dna 05 00008 g004
Figure 5. Interaction of SJG–136 with NF–κB–2. (A) HPLC chromatogram of NF–κB–2 alone; (B) HPLC chromatogram of the SJG–136/NF–κB–2 adduct; (C) MALDI-TOF spectrum of NF–κB–2 alone; (D) MALDI–TOF spectrum of the SJG–136/NF–κB–2 adduct.
Dna 05 00008 g005
Figure 6. Interaction of SJG–136 with EGR–1. (A) HPLC chromatogram of EGR–1 alone; (B) HPLC chromatogram of SJG–136/EGR–1 adduct; (C) MALDI–TOF spectrum of EGR–1 alone; (D) MALDI–TOF spectrum of the SJG–136/EGR–1 adduct.
Dna 05 00008 g006
Figure 7. Interaction of SJG–136 with AP–1. (A) HPLC chromatogram of AP–1 alone; (B) HPLC chromatogram of the SJG–136/AP–1 adduct; (C) MALDI-TOF spectrum of the AP–1 sequence alone; (D) MALDI–TOF spectrum of the SJG–136/AP–1 adduct.
Dna 05 00008 g007
Figure 8. Interaction of SJG–136 with the STAT3 sequence. (A) HPLC chromatogram of the STAT3 hairpin alone; (B) HPLC chromatogram of the SJG–136/STAT-3 adducts; (C) MALDI–TOF spectrum of the STAT3 hairpin alone; (D) MALDI–TOF spectrum of the SJG-136/STAT–3 adduct. The same mass was observed for all three adducts formed.
Dna 05 00008 g008
Figure 9. Interaction of SJG–136 with the AP–1 hairpin sequence. (A) CD spectrum of the AP–1 sequence alone (black) and the AP–1/SJG–136 complex at t = 0 h; (B) CD spectrum of the AP–1 sequence alone (black) and the AP–1/SJG–136 complex at t = 24 h.
Dna 05 00008 g009
Figure 10. Low-energy snapshots of molecular models of the interaction of SJG-136 with the NF-κB-1 hairpin. (A) Mono-Alkylated Adduct: SJG-136 (blue) covalently bound to G3 (purple/magenta) of the NF-κB-1 hairpin. The central methylene linker of SJG-136 forms extensive van der Waals interactions with the A4:T20 base pair (yellow), and the unreacted PBD forms non-covalent interactions with the A6:T18 base pair (cyan), allowing the molecule to fit isosterically in the DNA minor groove; (B) Interstrand cross-linked Adduct: SJG-136 (blue) covalently bound to both G2 and G19 (magenta) of the NF-κB-1 hairpin. The central methylene linker of SJG-136 forms extensive van der Waals interactions with the A4:T20 base pair (yellow) with stabilising hydrogen bonds between the N10-proton of one PBD moiety and the ring nitrogen (N3) of the adjacent G3, and between the N10-proton of the other PBD moiety and the O4 atom of the neighbouring T20 base.
Dna 05 00008 g010
Figure 11. The effect of SJG-136 on the expression of (A) STAT3-dependent genes in MDA-MB-231 cells and (B) AP-1-dependent genes in HT-29 cells expressed as fold-decrease. Experiments were performed in triplicates (n = 3). All data are mean ± SD. * = p < 0.05, ** = p < 0.001, *** = p < 0.0001, NS = not significant.
Dna 05 00008 g011
Table 1. Theoretical and observed masses [Da] of single-stranded hairpin oligonucleotides and their 1:1 adducts with SJG-136 after 24-h incubation.
DNA SequenceDNA MassTheoretical Mass DNA/SJG-136 (1:1) (DNA Mass + 556.64)Observed DNA/SJG-136 Adduct Mass (1:1)
NF-κB-17032.67589.27590.6
NF-κB-27033.67590.27590.7
EGR-16416.26972.86973.3
AP-15793.86350.46351.2
STAT36412.26968.86968.9
Table 2. Extent and number of adduct formation after 24 h SJG-136 with transcription factor sequences NF-κB-1, NF-κB-2, EGR-1, AP-1, and STAT3 (formed adduct in %). Experiments were performed in triplicates (n = 3).
NF-κB-1NF-κB-2EGR-1AP-1STAT3
Extent16.6142.9027.7310013.94
No of adduct11113
Disclaimer/Publisher’s Note: The statements, opinions and data contained in all publications are solely those of the individual author(s) and contributor(s) and not of MDPI and/or the editor(s). MDPI and/or the editor(s) disclaim responsibility for any injury to people or property resulting from any ideas, methods, instructions or products referred to in the content.