Hypothesis

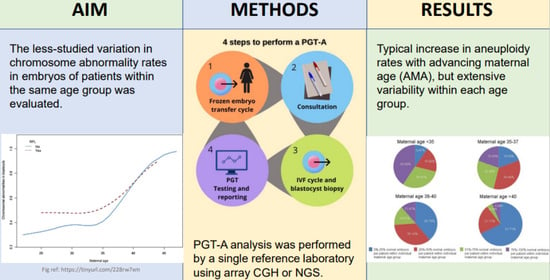
Large Intra-Age Group Variation in Chromosome Abnormalities in Human Blastocysts

1
School of Biosciences, University of Kent, Canterbury, Kent CT2 7NJ, UK
2
Rosa Scientific, Princeton, NJ 08452, USA
3
CooperGenomics, Livingston, NJ 07039, USA
*
Author to whom correspondence should be addressed.
DNA 2021, 1(2), 91-104; https://doi.org/10.3390/dna1020010
Submission received: 9 September 2021 / Revised: 11 November 2021 / Accepted: 12 November 2021 / Published: 6 December 2021

Abstract

:
Research Question: Is maternal age only a gross predictor of chromosome abnormalities in human embryos? Design: Here, we evaluated the less-studied variation in chromosome abnormality rates in embryos of patients within the same age group. Patients undergoing IVF and PGD for chromosomal abnormalities in ~127 different IVF clinics were included. PGT-A analysis was performed by a single reference laboratory using array CGH or NGS. To get an estimate of the range of abnormalities observed, the aCGH and NGS data were studied both independently and together. Results: The overall results showed the typical increase in aneuploidy rates with advancing maternal age (AMA) but extensive variability within each age group. Conclusions: Increasing aneuploidy with maternal age has been demonstrated in live births, unborn fetuses, IVF embryos and oocytes. In contrast, post-meiotic and other abnormalities that might lead to mosaicism, polyploidy and haploidy, are commonplace (around 30%), regardless of maternal age. Here we conclude that age is only a gross predictor of chromosome abnormalities in IVF embryos. In contrast to the existing standard of offering PGT-A to AMA patients, the high rate and extreme variation of chromosomal abnormalities in human embryos may warrant PGT-A for further IVF cycles even in younger age groups, especially if a history of increased levels of aneuploidy is evident. Furthermore, better indicators are needed to determine which patients are at a higher risk of producing increased levels of aneuploid embryos.

Graphical Abstract

1. Introduction

Aneuploidy, the most common form of chromosomal abnormality in humans is also the leading genetic cause of spontaneous abortions and congenital birth defects [1,2]). Preimplantation genetic testing (PGT) for aneuploidy PGT-A (formerly PGS—preimplantation genetic screening) was first applied using fluorescent in situ hybridization (FISH) and cleavage-stage biopsy [3,4]. Following technological developments, several CCS (comprehensive chromosome screening) techniques [5,6,7,8,9,10,11,12]) and blastocyst biopsy [13,14]) replaced the older methods [15].
Through the use of these technologies, many studies reported the same consistent observations regarding chromosome abnormalities before implantation. First, meiotic-origin aneuploidy increases with advancing maternal age and is the major cause of IVF failure [16,17,18,19,20]. Second, most abnormalities are maternal in origin [21,22,23,24]).
Mosaicism (the presence of more than two or more cell lines with different chromosome constitutions) is detected in one third of cleavage-stage embryos and one fifth of blastocysts [20,25,26,27,28,29,30,31]). This is almost certainly an underestimate however, due to the fact that only a sample of cells are biopsied and, in the case of FISH studies, only a subset of chromosomes is analyzed. Post-meiotic errors frequently lead to mosaicism and do not increase with advancing maternal age; rather, increase is associated with poor morphology [20,29]). It is important to realize that mosaicism was first described in human IVF embryos in the early nineties [4,32,33,34]), but due to the inability of most CCS techniques to detect it accurately in blastocyst biopsies, mosaicism is consistently underreported (4% mosaics detected by array CGH, or aCGH, compared to 21% following the advent of next-generation sequencing (NGS)) [35,36,37,38]).
There are other types of chromosome abnormalities that are less well studied. For example, the incidence of de-novo segmental abnormalities (or chromosome structural abnormalities) are still under debate. Inherited segmental abnormalities are detectable with high accuracy [39] but despite this, their clinical relevance is still poorly understood.
Another trend that has been poorly researched is the variability in chromosome abnormality rates between different fertility centers [40,41,42]. Identifying the causes of these differences could shed light into means of improving ART in general and using PGT-A as quality control.
Other sources of variability in chromosome abnormalities are even less well studied. For instance, it is evident that not all patients within the same age group produce the same rate of chromosome abnormalities; but because embryo cohort sizes are small, with a few exceptions [29,43]), this has been attributed mostly to sample size variation. Two studies [43,44]) found a large variation within age groups when analyzing first meiotic aneuploidy in oocytes. However, the first study detected only first meiotic aneuploidy by FISH [43] while the second [44] had a small sample size. Similar results had been previously found in embryos of egg donor cycles [19]. Both studies suggest that age might be only a gross indicator of chromosome abnormalities and that there is a need to address the great variation observed within the same age groups. This variability could be caused by differences between individual genome markers, lifestyle of the individual and treatment variations [44]. The purpose of this study was therefore to extend this work to assess the variability of chromosome abnormalities in a large dataset of PGT-A procedures across maternal ages using contemporary technologies.

2. Materials and Methods

This study targeted 14,289 women who underwent PGT-A at Reprogenetics Centers, USA during the period from February 2012 to November 2015. The patients underwent their IVF cycles at over 127 different IVF centers around the US. The complete age distribution of the analyzed dataset is shown in Figure 1. A total of 2175 patients utilized egg donors. The study includes results for PGT-A performed using blastocyst biopsy only. Embryos that underwent day 2–3 blastomere biopsy were excluded from the analysis. Patients with unknown maternal age were excluded from analysis. We also excluded patients who possibly had egg donors for whom the age was not available. Acknowledging the shortcomings of pre-array technologies, this study has limited the cases analyzed to the ones performed using array and NGS technologies. Cases that were analyzed using FISH and single gene methods were not considered.
PGT-A analysis was performed using two methods, NGS and aCGH. NGS analysis on samples was conducted using the VeriSeq protocol (Illumina, San Diego, CA, USA). VeriSeq libraries were sequenced on the MiSeq (Illumina, San Diego, CA, USA) sequencer. BlueFuse software (Illumina, San Diego, CA, USA) was utilized to analyze the sequencing data. The sequencing protocol used for processing the sample was an in-house protocol. This protocol has not been validated externally. The validation for this program has been internal and the results thereof have not been published. NGS as a technique however, has been validated on different platforms [7,45]). Array CGH analysis was performed using the 24SureV3 (Illumina, San Diego, CA, USA) single channel method as described previously [5,46]). This method is a single channel method that utilizes female and male reference DNAs. Every sample is thus compared to two female and two male references. Data were analyzed using the BlueFuse software (Illumina, San Diego, CA, USA).
This study was conducted as a retrospective study based on genetic information and inpatient and outpatient charts. A global approach to analyze the entire dataset was initially used to observe trends and distributions of data. The dataset was analyzed separately for patients who had used egg donors and patients who had not used egg donors. Apart from this approach, embryos from 7286 patients (excluding patients using egg donors) who had embryo cohort sizes of 4 and more were analyzed separately (Figure 3). The patient group analyzed with this limitation would be annotated as the limited cohort size (LCS) group. Limiting of cohort size resulted in an attrition of patients; however, this analysis was performed to attain a truer sense of variation observed in different age groups. Percentage of euploid embryos available for transfer post PGT-A dependent on the age group the patient belongs to was also calculated.
For aCGH, structural and numerical chromosomal abnormalities were unified under one category (abnormal) and were analyzed as a single dataset. For NGS, embryos were classified as “euploid” (no abnormality detected in the biopsy), “mosaic” (biopsy sample contains one or two chromosomes in mosaic form, either as whole chromosome or partial chromosome), or “abnormal” (all cells in biopsy had the same abnormality). Analysis was performed on whole number values that were obtained by counting the number of normal and abnormal diagnoses in every patient. For analysis, advanced maternal age (AMA) was set at ≥35 years of age in women. Women of the maternal age 25 and under were grouped together for analysis due to the lack of substantial sample size. Patients of maternal age up to 45 were included in this study. In the LCS group, patient analysis was performed by grouping women ≤35 years old (all young mothers) and women ≥44 years old.
All the patients were referred for PGT-A because of, but not limited to, the following reasons. AMA was the most common factor for the referral of these patients. Apart from AMA, spontaneous abortion and male factor were reasons for PGD/PGT-A treatment found in patients. In the young mothers’ age group, apart from the physicians requesting for PGD/PGT-A, male factor and spontaneous abortion were found to be the most common reasons for patients seeking PGD/PGT-A.
In addition, R statistical software version 3.3.1 and Microsoft excel were used for graphing purposes and statistical analysis.

Consent and IRB Approval
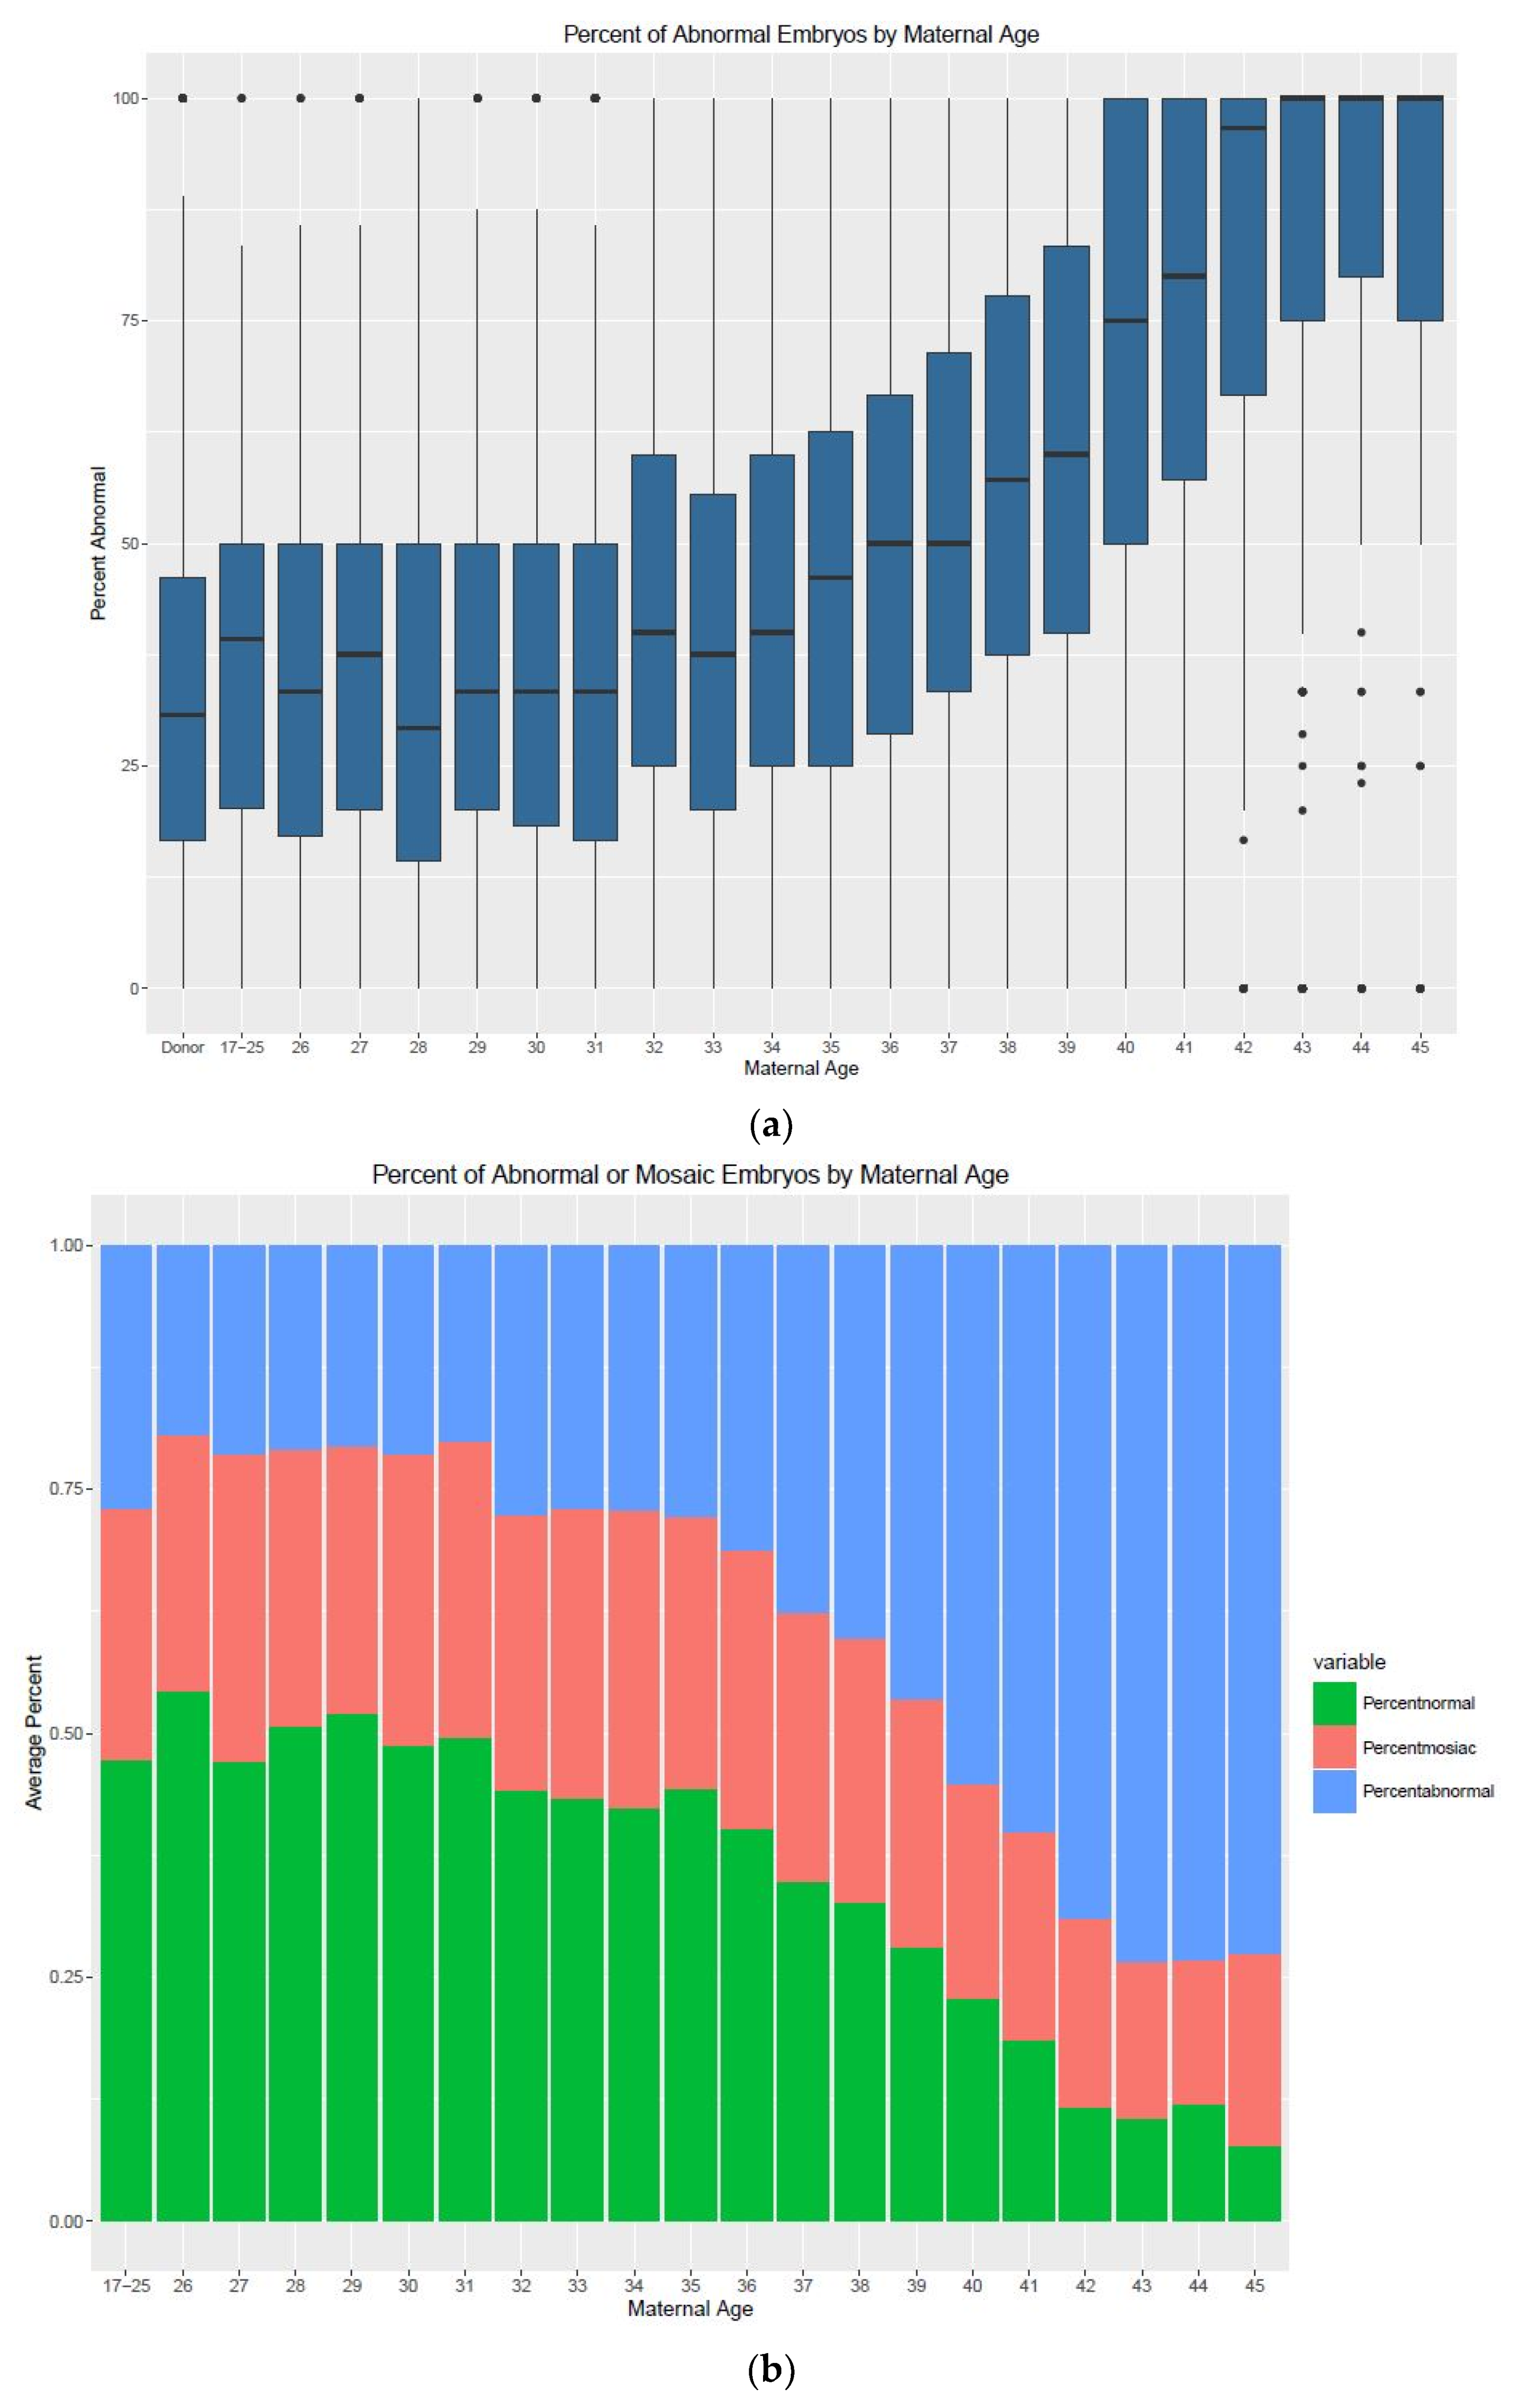
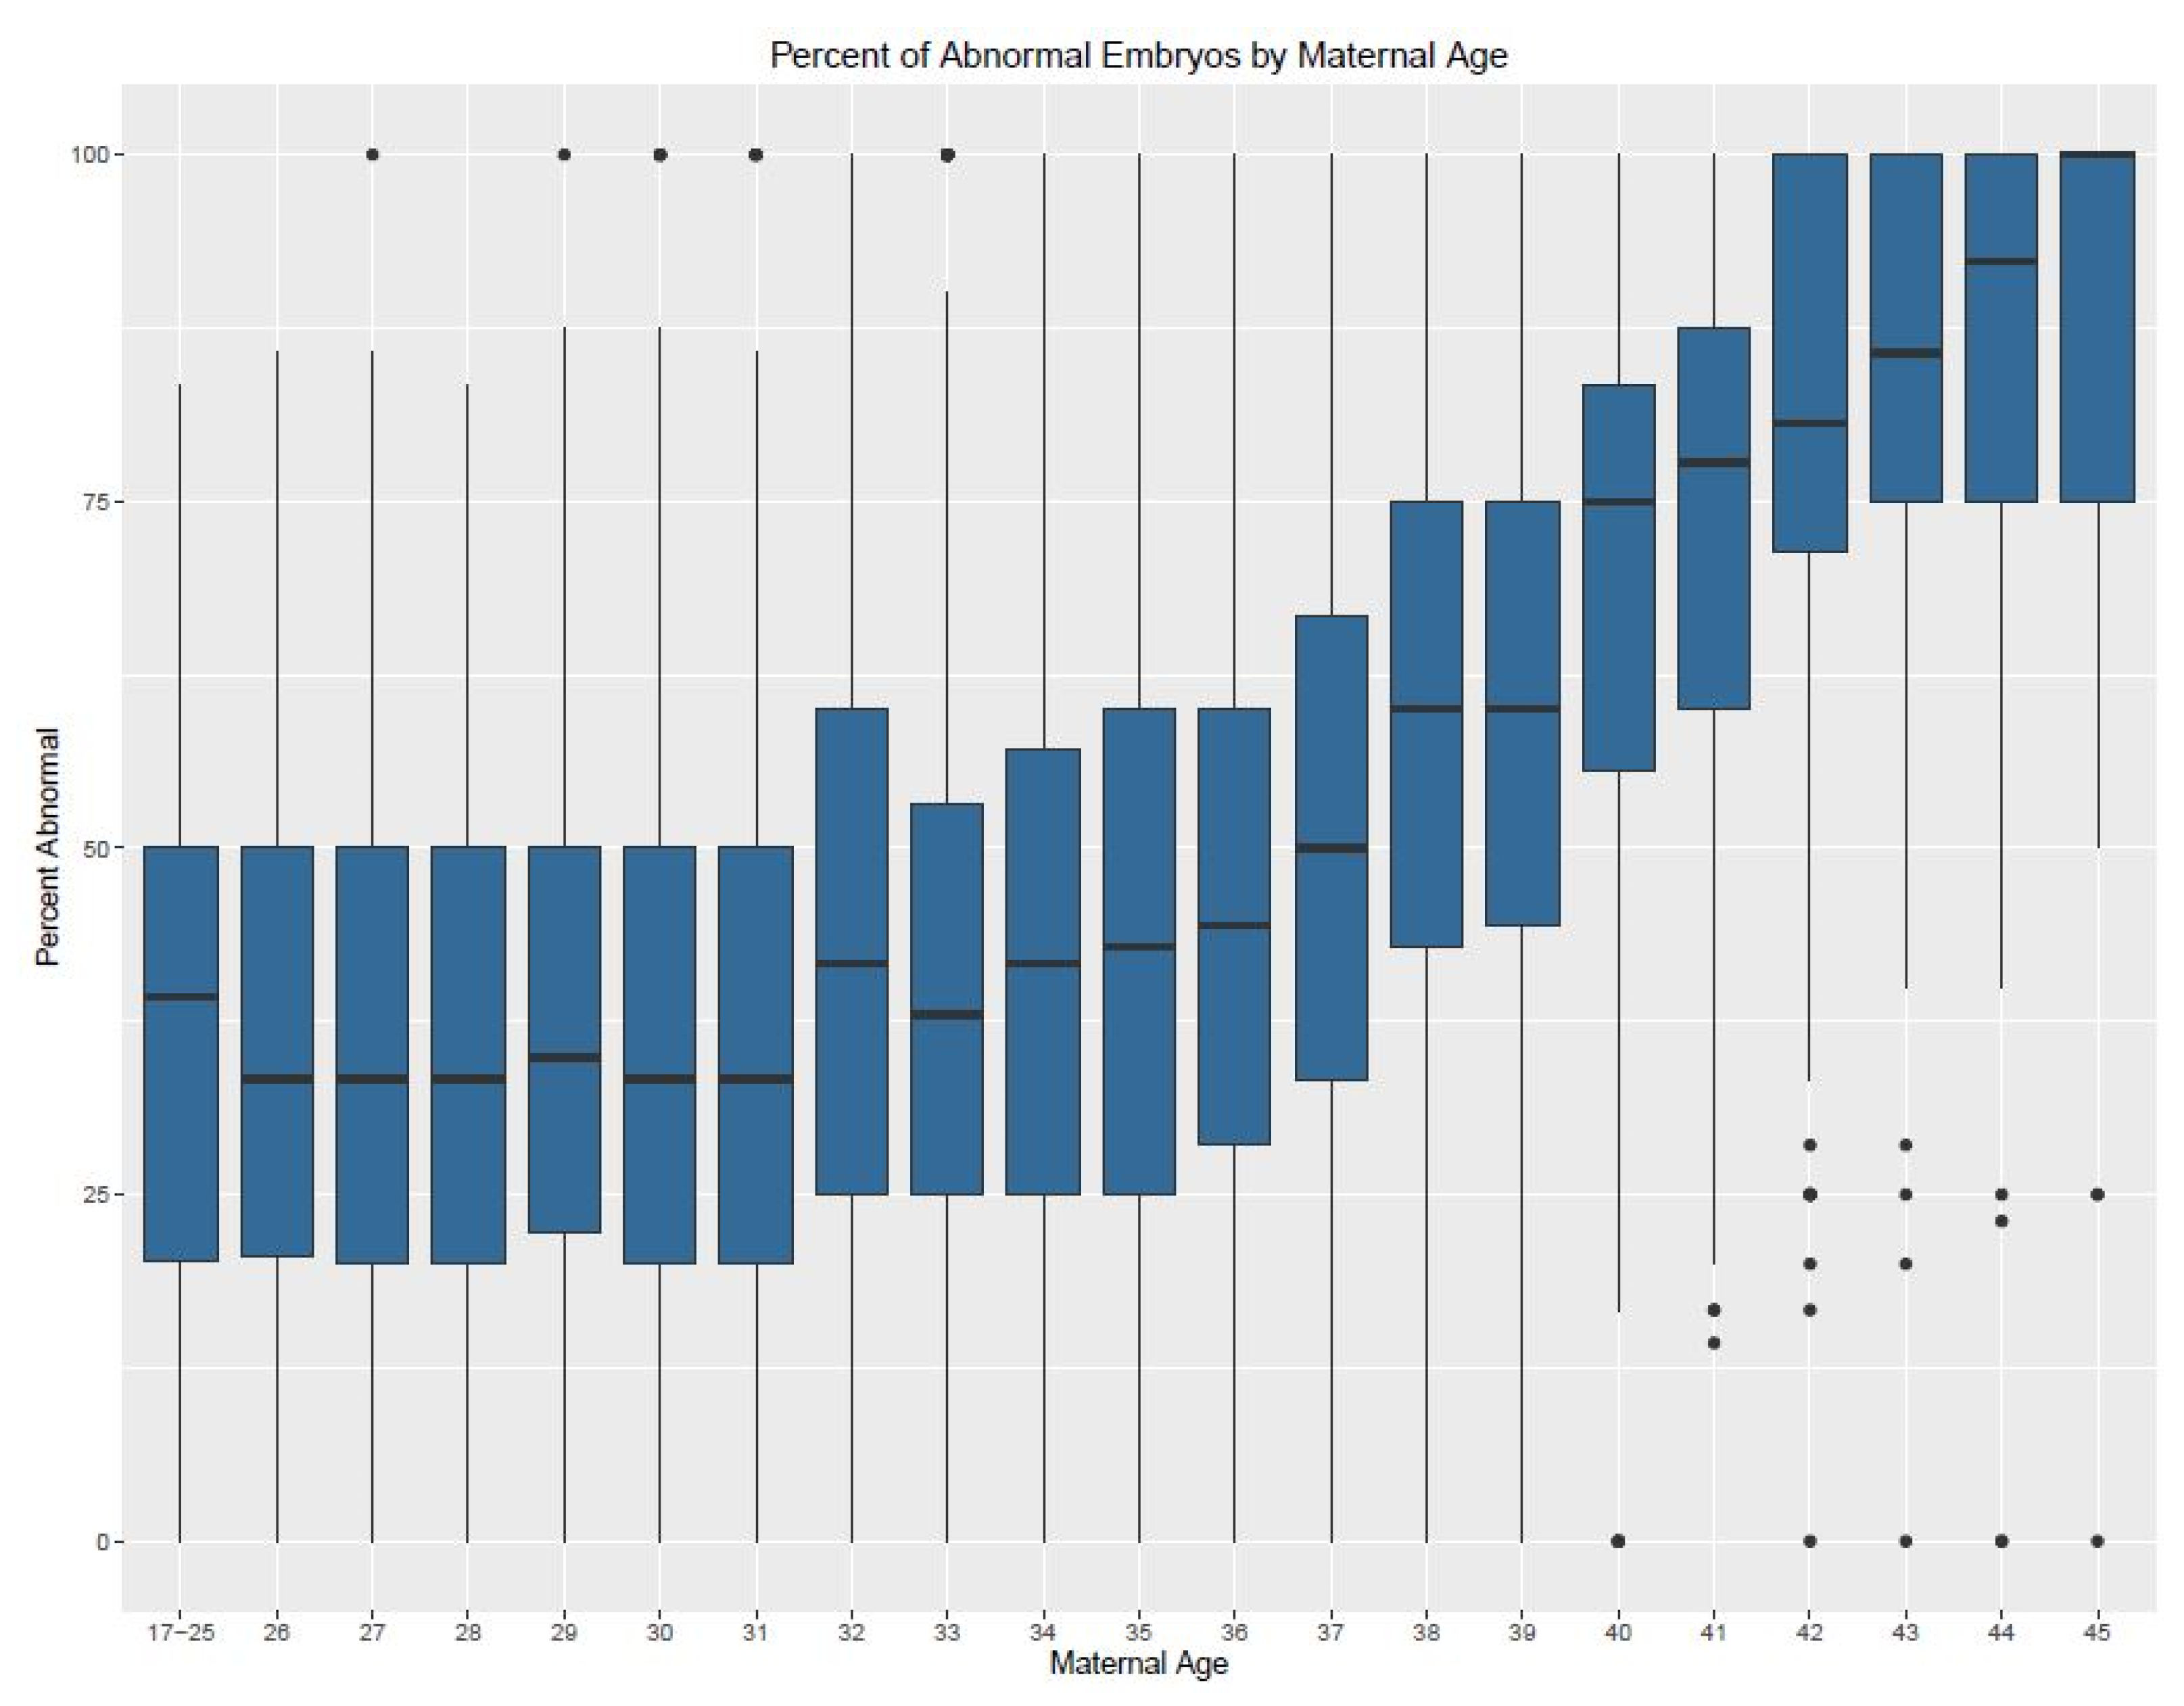
Patients included in this study had consented to PGT-A by aCGH or NGS. We consider the study to be exempt from Institutional Review Board (IRB) approval. According to the common rule 45 CFR 46.101(b) (4), exemptions include “research, involving the collection or study of existing data, documents, records, pathologic specimens, if these sources are publicly available or if the information is recorded by the investigator in such manner that subjects cannot be identified, directly or through identifiers linked to subjects”.
A retrospective chart review was performed using a secure electronic medical record of patients with embryos that underwent PGT-A (eIVF, from PracticeHwy.com, Irving, TX, USA).

3. Results

We calculated the range of minimum and maximum values present in our dataset, as observed in Table 1. Before calculating this range, data were first observed for aCGH (in Table 1) and NGS groups. No substantial difference was observed between these groups. Every age group in our dataset had at least one patient who had all the embryos in their respective cohort either abnormal or normal. Therefore, a range of 0–100% can be observed in Table 1. We also calculated the Inter Quartile Range (IQR) for each individual age group. IQR is a measure of variability that we obtain by dividing the dataset into different quartiles. The IQR ranges from ~29% to ~40% within the dataset. Observing the mean and medians in the dataset also sheds light on the variation existing in the dataset. Most patients had at least 30% abnormal embryos in their cohort. Almost 40% of the embryos could be abnormal, irrespective of the age group based on our dataset.
Reviewing the data for individual outcomes of the normal versus abnormal diagnoses, we observed variation that is present in the dataset. Based on Figure 1, wide ranges of variation in chromosome abnormalities are evident, with most age groups having the proportion that were euploid ranging between 0% and 100%. Even after excluding outliers, wide ranges such as these help us highlight the variation observed. Even in younger patients aged ≤35, the percentage of abnormal findings in individual patients fluctuated between 0% and 100.
Interestingly in older patients, while the trend towards increased abnormality was observed, we observed some patients with low abnormality rates. Some outliers in this category show a 0% abnormality rate, i.e., all embryos from some women in this category are euploid. Density plots for every individual age group (Figure 2 and Figure 3) are also representative of the variation observed within each group.
We also compared the variation in abnormalities on the basis of the technique used to process and analyze the sample (Figure 1). As seen in Figure 1a, wide variation exists throughout the dataset for the samples processed using aCGH. However, large scale variation does exist for datasets with adequate sample size. Interestingly even AMA groups of 38 years and 40 years have cases with percentage of normal embryos for each case ranging between 0% normal to 100% abnormal.
A notable observation, however, is that almost 38% of the embryos from mothers of age 35 and below are abnormal and cannot be transferred during IVF. The percentage of normal embryos drops substantially as expected with increase in maternal age. The percentage of normal embryos continues to decrease, with only 20% euploid embryos observed in the age group 41–45.
The LCS group was made up of 7286 cases. The defining factor for the LCS group was the embryo cohort size per case (>4). This approach was performed to omit the small embryo cohort patients that could behave as statistical confounders towards calculated percentages. Despite omitting a major part of the original dataset, the LCS dataset exhibited wide variation in the observed percentage of abnormalities in the cohorts. As observed in Figure 2, saving for the age groups between 17 and 26, every age group had abnormality values ranging between 0% and 100% in their cohorts. The amount of variation seen in the LCS group is like the one observed in the complete dataset. This in turn reinforces the validity of the observation of large variation in all age groups.
As observed in Figure 3, the possibility of having 75–100% normal embryos decreases from 40% in the age group <35 years of age to 6% in the age group 38–40 years. Conversely, patients <35 years of age have close to a 10% chance of having 75–100% abnormal embryos compared to 68% for patients 38–40. Additionally, Table 2a,b and Table 3a,b shows the likelihood that a patient would have euploid embryos at a certain age based on their cohort sizes. aCGH and NGS cases show a similar pattern.

4. Discussion

Embryos that are predominantly aneuploid usually do not implant and, if so, they usually miscarry. Therefore, PGT-A is a tool to screen a cohort of embryos to transfer those that are predominantly euploid with the purpose to achieving a faster and less traumatic route to a viable pregnancy. The alternative is to transfer embryos blindly, which may result in longer time to pregnancy, higher miscarriage rates and higher dropout rates [47]. Several randomized-controlled trials have shown PGT-A to be effective in good prognosis patients [48,49,50,51]); however, the field remains controversial as not all these trials have escaped criticism because of sample size and intent-to-treat criteria. The monetary cost effectiveness of PGT-A has been debated, and, it is argued, may be beneficial when considering neonatal care when replacing a single euploid embryo, compared to replacing two untested ones [48].
Traditionally, PGT-A has been a standard treatment for AMA patients and patients with a medical history including diagnoses of recurrent pregnancy loss or male factor infertility, but the most commonly used criteria are a combination of maternal age and cohort size. That is, if a patient has enough embryos for PGT-A to be selective and the patient is above a certain age, PGT-A is more likely to be used than in patients that are very young or patients with very few eggs. This aligns with the work of Ata et al. [16] showing a progressive chance of finding euploid embryos with increasing maternal age and decreasing cohort size. However, most studies focusing on the decline of implantation rates with advanced maternal age have focused on variable averages per age group. However, this masks the great variability within patients of the same age group. We have found that irrespective of age, some patients may have very high or very low rates of embryo chromosome abnormalities, warranting application of PGT-A, irrespective of maternal age.
The current study evaluated the data using multiple strategies. Patient data were analyzed with varying restrictions like limiting cohort size, selection of technique used to process the samples, selection of doctors and choosing for patient with and without egg donors. A global approach was also used, and patient data were analyzed without using any restrictions. As expected, we observed that there was a substantial increase in chromosomal abnormalities in AMA patients. This confirms prior trends as observed in several other studies. However, the study adds a new dimension by observing high rates (up to 45%) of variability in the embryos possessing chromosomal abnormalities in patients, especially younger patients, who are currently not being offered PGT-A routinely. Some prior studies observed high rates of chromosomal abnormalities in embryos from younger patients [19]. However, these studies used older techniques like FISH, while all the PGT-A cycles in this study were performed using aCGH and NGS. Utilizing the data derived from cycles that underwent aCGH and NGS only make the dataset more robust and relatively impervious to misdiagnosis.
While maternal age is unarguably the primary risk factor, the high rate and extreme variation of chromosome abnormalities in human embryos could possibly be explained by a compounded effect of multiple factors. For example, one such factor includes clinical measurements. As observed by Katz-Jaffe et al., 2013, patients with abnormal serum ovarian reserve parameters; patients with abnormally high follicular stimulating hormone (FSH) levels & low anti-Müllerian hormone levels had an increased likelihood of generating aneuploid blastocysts independent of patient age [52]. This means that younger patients with either of these markers could possibly have high aneuploidy observed in their embryos.
A second factor that affects variation between patients may be attributed to genetic markers. It has been hypothesized that disruption of the meiotic machinery that coordinates chromosome segregation may result in aneuploidy (Hassold, Hall and Hunt, 2007). For example, SYCP3, a gene that forms a part of the synaptonemal complex joins homologous chromosomes during meiosis I. Genetic variants in SYCP3 have been shown to affect sperm production in azoospermic males and to result in recurrent pregnancy loss in females [53]. However, the genetic factors affecting aneuploidy in humans are not well studied, as there is not yet a sufficient in vitro model since meiosis I occurs prior to birth in females. Several studies using mouse model systems have shown that deletion of several meiotic genes lead to infertility as a result of aneuploidy embryos, demonstrating the importance of meiotic machinery in fertility and pregnancy [54,55,56,57,58,59]). Further research into genetic variation affecting aneuploidy in women, especially cohorts of young maternal age, should be conducted to gain a better understanding of how disruption of meiosis affects fertility potential.
In addition to maternal age, hormonal levels (FSH, AMH) and gene markers, a fourth source of aneuploidy rate variation between patients and clinics is iatrogenic and caused by the ART procedure itself. We have shown that there is great variability in aneuploidy rates between clinics when treating egg donors, a group of patients that should be relatively homogeneous [60]. The fact that we analyzed data from over 100 centers implies that some of that variation between patients is center related. This study was performed on blastocyst trophectoderm biopsies in human blastocysts. Biopsies of trophectoderm are not a true representation of aneuploid cells within the fetal lineage ICM. Hence, it would be illuminating if we are able to use a technique such as Hyperspectral autofluorescence microscopy that enables discrimination between euploid and aneuploid ICM in mouse embryos [61].
If judiciously applied, PGT-A could be a tool to eliminate the uncertainty that has been a built-in feature of the IVF procedure, especially in young and egg donor patients showing these markers. Integrating information such as age, clinical markers and genomic markers may provide an improved prediction of the risk of aneuploidy, and thus, a more precise method of providing guidance on when PGT-A may be most useful in patients pursuing IVF.
To date however, PGT-A has been shown to be effective mostly in patients of advanced maternal age, its efficacy in younger patients remains to be determined. It is important to note that PGT-A inherently involves the sampling of ~five cells from around a ~200 cell blastocyst. Moreover, although TE biopsy has been shown to predict the karyotype of the rest of the embryo reasonably well [62], a small sample such as this can only ever by a reasonable proxy for the level of mosaicism, if present. The trophectoderm (from which the biopsy is taken) gives rise to the placenta, which has been shown to be chromosomally mosaic with quite high frequency [63]. Awareness of the limitations of PGT-A is therefore crucial, as is determining the origin of any chromosomal errors (meiotic vs. post zygotic). Most importantly, if PGT-A is to be applied to younger patients, then we need to go beyond the observations of this study (that simply observed the variability) to predicting with a reasonable level of accuracy which patients are prone to higher levels, and this is most likely to benefit from PGT-A.
PGT-A is considered invasive due to the embryo biopsy involved during the procedure. Until non-invasive methods are proven to be effective, biopsies are essential and central to the performance of PGT-A. It is therefore important to observe whether embryo biopsy might cause post-natal growth restriction. A 2009 singleton children study observed at age 2 years born after embryo biopsy applied in PGT-A presented no difference compared with Intracytoplasmic sperm injection (ICSI) and natural cycle children. However, based on existing findings, there were no detrimental effects observed in these children [64]. A broader study including a much larger sample size would be more indicative and could validate using PGT-A in more IVF cycles, irrespective of maternal age. One possible conclusion from our analysis is that PGT-A could be offered to infertile women of all ages since the predictive value of the technique far outweighs the possible risk of any negative impact of the PGT-A process. At the very least, younger patients consistently demonstrating high levels of aneuploidy should be considered as a referral category for PGT-A.

Author Contributions

S.S. and S.M. conceived of the presented idea. S.S. developed the theory further. L.R. performed the laboratory methods. D.K.G. encouraged S.S. to investigate the variation within a specific age cohort and supervised the findings of his work. All authors discussed the results and contributed to the final manuscript. All authors have read and agreed to the published version of the manuscript.

Funding

This research received no external funding.

Institutional Review Board Statement

Not applicable.

Informed Consent Statement

Not applicable.

Acknowledgments

The authors would like to thank Kirk Gosik for his help with R-statistical package.

Conflicts of Interest

The authors declare no conflict of interest.

References

  1. Hassold, T.; Hall, H.; Hunt, P. The origin of human aneuploidy: Where we have been. where we are going. Hum. Mol. Genet. 2007, 16, R203–R208. [Google Scholar] [CrossRef]
  2. Subramaniyam, S.; Pulijaal, V.R.; Mathew, S. Double and multiple chromosomal aneuploidies in spontaneous abortions: A single institutional experience. J. Hum. Reprod. Sci. 2014, 7, 262–268. [Google Scholar] [CrossRef]
  3. Munne, S.; Lee, A.; Rosenwaks, Z.; Grifo, J.; Cohen, J. Diagnosis of major chromosome aneuploidies in human preimplantation embryos. Hum. Reprod. 1993, 8, 2185–2191. Available online: http://www.ncbi.nlm.nih.gov/pubmed/8150922 (accessed on 11 November 2021). [CrossRef]
  4. Munne, S.; Weier, H.U.; Stein, J.; Grifo, J.; Cohen, J. A fast and efficient method for simultaneous X and Y in situ hybridization of human blastomeres. J. Assist. Reprod. Genet. 1993, 10, 82–90. Available online: http://www.ncbi.nlm.nih.gov/pubmed/8499685 (accessed on 11 November 2021). [CrossRef] [PubMed]
  5. Gutierrez-Mateo, C.; Colls, P.; Sanchez-Garcia, J.; Escudero, T.; Prates, R.; Ketterson, K.; Wells, D.; Munne, S. Validation of microarray comparative genomic hybridization for comprehensive chromosome analysis of embryos. Fertil. Steril. 2011, 95, 953–958. [Google Scholar] [CrossRef] [PubMed]
  6. Johnson, D.S.; Gemelos, G.; Baner, J.; Ryan, A.; Cinnioglu, C.; Banjevic, M.; Ross, R.; Alper, M.; Barrett, B.; Frederick, J.; et al. Preclinical validation of a microarray method for full molecular karyotyping of blastomeres in a 24-h protocol. Hum. Reprod. 2010, 25, 1066–1075. [Google Scholar] [CrossRef]
  7. Kung, A.; Munne, S.; Bankowski, B.; Coates, A.; Wells, D. Validation of next-generation sequencing for comprehensive chromosome screening of embryos. Reprod. Biomed. Online 2015, 31, 760–769. [Google Scholar] [CrossRef] [PubMed] [Green Version]
  8. Treff, N.R.; Fedick, A.; Tao, X.; Devkota, B.; Taylor, D.; Scott, R.T., Jr. Evaluation of targeted next-generation sequencing-based preimplantation genetic diagnosis of monogenic disease. Fertil. Steril. 2013, 99, 1377–1384.e6. [Google Scholar] [CrossRef] [PubMed]
  9. Treff, N.R.; Tao, X.; Ferry, K.M.; Su, J.; Taylor, D.; Scott, R.T., Jr. Development and validation of an accurate quantitative real-time polymerase chain reaction-based assay for human blastocyst comprehensive chromosomal aneuploidy screening. Fertil. Steril. 2012, 97, 819–824. [Google Scholar] [CrossRef] [PubMed]
  10. Wells, D.; Delhanty, J.D. Comprehensive chromosomal analysis of human preimplantation embryos using whole genome amplification and single cell comparative genomic hybridization. Mol. Hum. Reprod. 2000, 6, 1055–1062. Available online: http://www.ncbi.nlm.nih.gov/pubmed/11044470 (accessed on 1 August 2016). [CrossRef]
  11. Wells, D.; Kaur, K.; Grifo, J.; Glassner, M.; Taylor, J.C.; Fragouli, E.; Munne, S. Clinical utilisation of a rapid low-pass whole genome sequencing technique for the diagnosis of aneuploidy in human embryos prior to implantation. J. Med. Genet. 2014, 51, 553–562. [Google Scholar] [CrossRef] [PubMed] [Green Version]
  12. Wilton, L.; Williamson, R.; McBain, J.; Edgar, D.; Voullaire, L. Birth of a healthy infant after preimplantation confirmation of euploidy by comparative genomic hybridization. N. Engl. J. Med. 2001, 345, 1537–1541. [Google Scholar] [CrossRef] [PubMed]
  13. McArthur, S.J.; Leigh, D.; Marshall, J.T.; de Boer, K.A.; Jansen, R.P. Pregnancies and live births after trophectoderm biopsy and preimplantation genetic testing of human blastocysts. Fertil. Steril. 2005, 84, 1628–1636. [Google Scholar] [CrossRef] [PubMed]
  14. Schoolcraft, W.B.; Fragouli, E.; Stevens, J.; Munne, S.; Katz-Jaffe, M.G.; Wells, D. Clinical application of comprehensive chromosomal screening at the blastocyst stage. Fertil. Steril. 2010, 94, 1700–1706. [Google Scholar] [CrossRef] [PubMed]
  15. Sermon, K.; Capalbo, A.; Cohen, J.; Coonen, E.; De Rycke, M.; De Vos, A.; Delhanty, J.; Fiorentino, F.; Gleicher, N.; Griesinger, G.; et al. The why, the how and the when of PGS 2.0: Current practices and expert opinions of fertility specialists, molecular biologists, and embryologists. MHR Basic Sci. Reprod. Med. 2016, 22, 845–857. [Google Scholar] [CrossRef] [PubMed]
  16. Ata, B.; Kaplan, B.; Danzer, H.; Glassner, M.; Opsahl, M.; Tan, S.L.; Munne, S. Array CGH analysis shows that aneuploidy is not related to the number of embryos generated. Reprod. Biomed. Online 2012, 24, 614–620. [Google Scholar] [CrossRef] [Green Version]
  17. Franasiak, J.M.; Forman, E.J.; Hong, K.H.; Werner, M.D.; Upham, K.M.; Treff, N.R.; Scott, R.T., Jr. The nature of aneuploidy with increasing age of the female partner: A review of 15,169 consecutive trophectoderm biopsies evaluated with comprehensive chromosomal screening. Fertil. Steril. 2014, 101, 656–663.e1. [Google Scholar] [CrossRef]
  18. Harton, G.L.; Munne, S.; Surrey, M.; Grifo, J.; Kaplan, B.; McCulloh, D.H.; Griffin, D.K.; Wells, D.; PGD Practitioners Group. Diminished effect of maternal age on implantation after preimplantation genetic diagnosis with array comparative genomic hybridization. Fertil. Steril. 2013, 100, 1695–1703. [Google Scholar] [CrossRef]
  19. Munne, S.; Alikani, M.; Tomkin, G.; Grifo, J.; Cohen, J. Embryo morphology, developmental rates, and maternal age are correlated with chromosome abnormalities. Fertil. Steril. 1995, 64, 382–391. Available online: http://www.ncbi.nlm.nih.gov/pubmed/7615118 (accessed on 11 November 2021). [CrossRef] [PubMed] [Green Version]
  20. Munne, S.; Chen, S.; Colls, P.; Garrisi, J.; Zheng, X.; Cekleniak, N.; Lenzi, M.; Hughes, P.; Fischer, J.; Garrisi, M.; et al. Maternal age, morphology, development and chromosome abnormalities in over 6000 cleavage-stage embryos. Reprod. Biomed. Online 2007, 14, 628–634. Available online: http://www.ncbi.nlm.nih.gov/pubmed/17509208 (accessed on 1 August 2016). [CrossRef]
  21. Konstantinidis, M.; Prates, R.; Goodall, N.-N.; Fischer, J.; Tecson, V.; Lemma, T.; Chu, B.; Jordan, A.; Armenti, E.; Wells, D.; et al. Live births following Karyomapping of human blastocysts: Experience from clinical application of the method. Reprod. Biomed. Online 2015, 31, 394–403. [Google Scholar] [CrossRef] [PubMed] [Green Version]
  22. Kuliev, A.; Verlinsky, Y. Meiotic and mitotic nondisjunction: Lessons from preimplantation genetic diagnosis. Hum. Reprod. Update 2004, 10, 401–407. [Google Scholar] [CrossRef] [PubMed] [Green Version]
  23. Rabinowitz, M.; Ryan, A.; Gemelos, G.; Hill, M.; Baner, J.; Cinnioglu, C.; Banjevic, M.; Potter, D.; Petrov, D.A.; Demko, Z. Origins and rates of aneuploidy in human blastomeres. Fertil. Steril. 2012, 97, 395–401. [Google Scholar] [CrossRef]
  24. Treff, N.R.; Su, J.; Tao, X.; Miller, K.A.; Levy, B.; Scott, R.T., Jr. A novel single-cell DNA fingerprinting method successfully distinguishes sibling human embryos. Fertil. Steril. 2010, 94, 477–484. [Google Scholar] [CrossRef] [PubMed]
  25. Bielanska, M.; Tan, S.L.; Ao, A. High rate of mixoploidy among human blastocysts cultured in vitro. Fertil. Steril. 2002, 78, 1248–1253. Available online: http://www.ncbi.nlm.nih.gov/pubmed/12477520 (accessed on 11 November 2021). [CrossRef]
  26. Campbell, I.M.; Yuan, B.; Robberecht, C.; Pfundt, R.; Szafranski, P.; McEntagart, M.E.; Nagamani, S.C.S.; Erez, A.; Bartnik, M.; Wiśniowiecka-Kowalnik, B.; et al. Parental somatic mosaicism is underrecognized and influences recurrence risk of genomic disorders. Am. J. Hum. Genet. 2014, 95, 173–182. [Google Scholar] [CrossRef] [Green Version]
  27. Fragouli, E.; Alfarawati, S.; Spath, K.; Wells, D. Morphological and cytogenetic assessment of cleavage and blastocyst stage embryos. Mol. Hum. Reprod. 2014, 20, 117–126. [Google Scholar] [CrossRef] [Green Version]
  28. Magli, M.C.; Gianaroli, L.; Ferraretti, A.P.; Lappi, M.; Ruberti, A.; Farfalli, V. Embryo morphology and development are dependent on the chromosomal complement. Fertil. Steril. 2007, 87, 534–541. [Google Scholar] [CrossRef] [PubMed]
  29. Munne, S.; Ary, J.; Zouves, C.; Escudero, T.; Barnes, F.; Cinioglu, C.; Ary, B.; Cohen, J. Wide range of chromosome abnormalities in the embryos of young egg donors. Reprod. Biomed. Online 2006, 12, 340–346. Available online: http://www.ncbi.nlm.nih.gov/pubmed/16569324 (accessed on 11 November 2021). [CrossRef]
  30. Munne, S.; Grifo, J.; Wells, D. Mosaicism: “survival of the fittest” versus “no embryo left behind”. Fertil. Steril. 2016, 105, 1146–1149. [Google Scholar] [CrossRef] [PubMed] [Green Version]
  31. Sandalinas, M.; Sadowy, S.; Alikani, M.; Calderon, G.; Cohen, J.; Munne, S. Developmental ability of chromosomally abnormal human embryos to develop to the blastocyst stage. Hum. Reprod. 2001, 16, 1954–1958. Available online: http://www.ncbi.nlm.nih.gov/pubmed/11527904 (accessed on 11 November 2021). [CrossRef] [PubMed] [Green Version]
  32. Delhanty, J.D.A.; Griffin, D.K.; Handyside, A.H.; Harper, J.; Pieters, M.H.E.C.; Winston, R.M.L. Detection of aneuploidy and chromosomal mosaicism in human embryos during preimplantation sex determination by fluorescent in-situ hybridisation. Hum. Mol. Genet. 1993, 2, 1183–1185. [Google Scholar] [CrossRef] [PubMed]
  33. Griffin, D.K.; Handyside, A.H.; Penketh, R.J.A.; Winston, R.M.L.; Delhanty, J.D.A. Fluorescent in-situ hybridisation to interphase nuclei of human preimplantation embryos with X and Y specific probes. Hum. Reprod. 1991, 6, 101–105. [Google Scholar] [CrossRef]
  34. Munne, S.; Weier, H.U.; Grifo, J.; Cohen, J. Chromosome mosaicism in human embryos. Biol. Reprod. 1994, 51, 373–379. Available online: http://www.ncbi.nlm.nih.gov/pubmed/7803609 (accessed on 11 November 2021). [CrossRef] [PubMed]
  35. Fragouli, E.; Alfarawati, S.; Spath, K.; Tarozzi, N.; Borini, A.; Wells, D. The developmental potential of mosaic embryos. Fertil. Steril. 2017, 104, e96. [Google Scholar] [CrossRef]
  36. Greco, E.; Biricik, A.; Cotarelo, R.P.; Iammarone, E.; Rubino, P.; Tesarik, J.; Fiorentino, F.; Minasi, M.G. Successful implantation and live birth of a healthy boy after triple biopsy and double vitrification of oocyte-embryo-blastocyst. SpringerPlus 2015, 4, 22. [Google Scholar] [CrossRef] [Green Version]
  37. Grifo, J.; Colls, P.; Ribustello, L.; Escudero, T.; Liu, E.; Munne, S. Why do array-CGH (ACGH) euploid embryos miscarry? Reanalysis by NGS reveals undetected abnormalities which would have prevented 56% of the miscarriages. Fertil. Steril. 2017, 104, e14. [Google Scholar] [CrossRef]
  38. Munne, S.; Large, M.; Ribustello, L.; Blazek, J.; Gouw, F.; Grifo, J.; Haddad, G.; Chang, W.; Grunert, G.M.; Huang, A.; et al. PGS analysis of over 33,000 blastocysts using high resolution Next Generation Sequencing (HRNGS) of over 33,000 blastocysts using high resolution Next Generation Sequencing (HRNGS). Fertil. Steril. 2016, 106, e18–e19. [Google Scholar] [CrossRef]
  39. Fiorentino, F.; Spizzichino, L.; Bono, S.; Biricik, A.; Kokkali, G.; Rienzi, L.; Ubaldi, F.M.; Iammarrone, E.; Gordon, A.; Pantos, K. PGD for reciprocal and Robertsonian translocations using array comparative genomic hybridization. Hum. Reprod. 2011, 26, 1925–1935. [Google Scholar] [CrossRef] [PubMed] [Green Version]
  40. Munne, S.; Magli, C.; Adler, A.; Wright, G.; de Boer, K.; Mortimer, D.; Tucker, M.; Cohen, J.; Gianaroli, L. Treatment-related chromosome abnormalities in human embryos. Hum. Reprod. 1997, 12, 780–784. Available online: http://www.ncbi.nlm.nih.gov/pubmed/9159442 (accessed on 11 November 2021). [CrossRef] [PubMed] [Green Version]
  41. Munne, S.; Alikani, M. Culture-induced chromosome abnormalities: The canary in the mine. Reprod. Biomed. Online 2011, 22, 506–508. [Google Scholar] [CrossRef] [PubMed] [Green Version]
  42. Munne, S.; Alikani, M.; Barritt, J.; Hesla, J.; Kaplan, B.; Alper, M.; McCulloh, D. Egg donor aneuploidy rates significantly differ between fertility centers. Fertil. Steril. 2014, 102, e121–e122. [Google Scholar] [CrossRef]
  43. Munne, S.; Held, K.R.; Magli, C.M.; Ata, B.; Wells, D.; Fragouli, E.; Baukloh, V.; Fischer, R.; Gianaroli, L. Intra-age, intercenter, and intercycle differences in chromosome abnormalities in oocytes. Fertil. Steril. 2012, 97, 935–942. [Google Scholar] [CrossRef] [PubMed]
  44. Gabriel, A.S.; Thornhill, A.R.; Ottolini, C.S.; Gordon, A.; Brown, A.P.C.; Taylor, J.; Bennett, K.; Handyside, A.; Griffin, D.K. Array comparative genomic hybridisation on first polar bodies suggests that non-disjunction is not the predominant mechanism leading to aneuploidy in humans. J. Med. Genet. 2011, 48, 433–437. Available online: http://jmg.bmj.com/content/48/7/433.abstract (accessed on 11 November 2021). [CrossRef] [PubMed]
  45. Fiorentino, F.; Biricik, A.; Bono, S.; Spizzichino, L.; Cotroneo, E.; Cottone, G.; Kokocinski, F.; Michel, C.E. Development and validation of a next-generation sequencing-based protocol for 24-chromosome aneuploidy screening of embryos. Fertil. Steril. 2014, 101, 1375–1382. [Google Scholar] [CrossRef] [PubMed]
  46. Colls, P.; Escudero, T.; Fischer, J.; Cekleniak, N.A.; Ben-Ozer, S.; Meyer, B.; Damien, M.; Grifo, J.A.; Hershlag, A.; Munne, S. Validation of array comparative genome hybridization for diagnosis of translocations in preimplantation human embryos. Reprod. Biomed. Online 2012, 24, 621–629. [Google Scholar] [CrossRef] [PubMed] [Green Version]
  47. Troude, P.; Guibert, J.; Bouyer, J.; de La Rochebrochard, E. Medical factors associated with early IVF discontinuation. Reprod. BioMed. Online 2017, 28, 321–329. [Google Scholar] [CrossRef] [Green Version]
  48. Forman, E.J.; Hong, K.H.; Ferry, K.M.; Tao, X.; Taylor, D.; Levy, B.; Treff, N.R.; Scott, R.T., Jr. In-vitro fertilization with single euploid blastocyst transfer: A randomized controlled trial. Fertil. Steril. 2017, 100, 100–107.e1. [Google Scholar] [CrossRef] [PubMed] [Green Version]
  49. Rubio, C.; Bellver, J.; Rodrigoa, L.; Castillón, G.; Guillén, A.; Vidal, C.; Giles, J.; Ferrando, M.; Cabanillas, S.; Remohí, J.; et al. In vitro fertilization with preimplantation genetic diagnosis for aneuploidies in advanced maternal age: A randomized controlled study. Fertil. Steril. 2017, 107, 1122–1129. [Google Scholar] [CrossRef] [Green Version]
  50. Scott, R.T., Jr.; Upham, K.M.; Forman, E.J.; Hong, K.H.; Scott, K.L.; Taylor, D.; Tao, X.; Treff, N.R. Blastocyst biopsy with comprehensive chromosome screening and fresh embryo transfer significantly increases in vitro fertilization implantation and delivery rates: A randomized controlled trial. Fertil. Steril. 2017, 100, 697–703. [Google Scholar] [CrossRef]
  51. Yang, Z.; Liu, J.; Collins, G.S.; Salem, S.A.; Liu, X.; Lyle, S.S.; Peck, A.C.; Sills, E.S.; Salem, R.D. Selection of single blastocysts for fresh transfer via standard morphology assessment alone and with array CGH for good prognosis IVF patients: Results from a randomized pilot study. Mol. Cytogenet. 2012, 5, 24. [Google Scholar] [CrossRef] [PubMed] [Green Version]
  52. Katz-Jaffe, M.G.; Surrey, E.S.; Minjarez, D.A.; Gustofson, R.L.; Stevens, J.M.; Schoolcraft, W.B. Association of abnormal ovarian reserve parameters with a higher incidence of aneuploid blastocysts. Obstet. Gynecol. 2013, 121, 71–77. [Google Scholar] [CrossRef]
  53. Miyamoto, T.; Hasuike, S.; Yogev, L.; Maduro, M.R.; Ishikawa, M.; Westphal, H.; Lamb, D.J. Azoospermia in patients heterozygous for a mutation in SYCP3. Lancet 2003, 362, 1714–1719. [Google Scholar] [CrossRef]
  54. Bannister, L.A.; Pezza, R.J.; Donaldson, J.R.; de Rooij, D.G.; Schimenti, K.J.; Camerini-Otero, R.D.; Schimenti, J.C. A dominant, recombination-defective allele of Dmc1 causing male-specific sterility. PLoS Biol. 2007, 5, e105. [Google Scholar] [CrossRef] [Green Version]
  55. Cherry, S.M.; Adelman, C.A.; Theunissen, J.W.; Hassold, T.J.; Hunt, P.A.; Petrini, J.H. The Mre11 complex influences DNA repair, synapsis, and crossing over in murine meiosis. Curr. Biol. 2007, 17, 373–378. [Google Scholar] [CrossRef] [PubMed] [Green Version]
  56. Koehler, K.E.; Schrump, S.E.; Cherry, J.P.; Hassold, T.J.; Hunt, P.A. Near-human aneuploidy levels in female mice with homeologous chromosomes. Curr. Biol. 2006, 16, R579–R580. [Google Scholar] [CrossRef] [Green Version]
  57. Kuznetsov, S.; Pellegrini, M.; Shuda, K.; Fernandez-Capetillo, O.; Liu, Y.; Martin, B.K.; Burkett, S.; Southon, E.; Pati, D.; Tessarollo, L.; et al. RAD51C deficiency in mice results in early prophase I arrest in males and sister chromatid separation at metaphase II in females. J. Cell Biol. 2007, 176, 581–592. [Google Scholar] [CrossRef] [PubMed]
  58. Roy, A.; Matzuk, M.M. Deconstructing mammalian reproduction: Using knockouts to define fertility pathways. Reproduction 2006, 131, 207–219. [Google Scholar] [CrossRef] [Green Version]
  59. Singh, P.; Schimenti, J.C. The genetics of human infertility by functional interrogation of SNPs in mice. Proc. Natl. Acad. Sci. USA 2015, 112, 10431–10436. [Google Scholar] [CrossRef] [PubMed] [Green Version]
  60. Munné, S.; Alikani, M.; Ribustello, L.; Colls, P.; Martínez-Ortiz, P.A.; Referring Physician Group; McCulloh, D.H. Euploidy rates in donor egg cycles significantly differ between fertility centers. Human Reprod. 2017, 32, 743–749. [Google Scholar] [CrossRef] [Green Version]
  61. Tan, C.Y.T.; Mahbub, S.B.; Campbell, J.M.; Habibalahi, A.; Campugan, C.A.; Rose, R.D.; Chow, D.J.X.; Mustafa, S.; Goldys, E.M.; Dunning, K.R. Non-invasive, label-free optical analysis to detect aneuploidy within the inner cell mass of the preimplantation embryo. Hum. Reprod. 2021, deab233. [Google Scholar] [CrossRef] [PubMed]
  62. Victor, A.R.; Griffin, D.K.; Brake, A.J.; Tyndall, J.C.; Murphy, A.E.; Lepkowsky, L.T.; Lal, A.; Zouves, C.G.; Barnes, F.L.; McCoy, R.C.; et al. Assessment of aneuploidy concordance between clinical trophectoderm biopsy and blastocyst. Hum. Reprod. 2019, 34, 181–192. [Google Scholar] [CrossRef] [PubMed]
  63. Coorens, T.H.H.; Oliver, T.R.W.; Sanghvi, R.; Sovio, U.; Cook, E.; Vento-Tormo, R.; Haniffa, M.; Young, M.D.; Rahbari, R.; Sebire, N.; et al. Inherent mosaicism and extensive mutation of human placentas. Nature 2021, 592, 80–85. [Google Scholar] [CrossRef]
  64. Desmyttere, S.; De Schepper, J.; Nekkebroeck, J.; De Vos, A.; De Rycke, M.; Staessen, C.; Liebaers, I.; Bonduelle, M. Two-year auxological and medical outcome of singletons born after embryo biopsy applied in preimplantation genetic diagnosis or preimplantation genetic screening. Hum. Reprod. 2009, 24, 470–476. [Google Scholar] [CrossRef] [PubMed] [Green Version]
Figure 1. Array CGH and NGS methods of analysis were used to perform PGT-A cases. (a) Array CGH data showing the variation of embryo abnormalities observed through all maternal ages in the study. Egg donors are grouped together. Ages 17–25 were also grouped due to lack of sample size. Maternal ages of up to 45 were included in this study. Wide ranges of abnormalities from 0–100 are observed throughout the dataset. (b) NGS data showing the variation of embryo abnormalities observed through all maternal ages in the study. Maternal ages of up to 45 were included in this study. The bottom bars in the graph (green) represent the percent normal group. The middle bars in the graph (pink) represent percent mosaic group. The top bars in the graph (blue) represent percent abnormal group.
Dna 01 00010 g001
Figure 2. A total of 7286 women with a cohort size of at least four embryos or more (LCS) who underwent PGT-A are represented in this graph. Variation of embryo abnormalities is observed through all maternal ages in the study. Ages 17–25 were also grouped due to lack of sample size. Maternal ages of up to 45 were included in this study. Wide ranges of abnormalities from 0–100 are observed throughout the LCS dataset.
Dna 01 00010 g002
Figure 3. The LCS dataset is represented in this graph. Likelihood (percentages) of finding normal euploid embryos depending on the age group the patient belongs to are represented in the above figure.
Dna 01 00010 g003
Table 1. Patients whose samples were analyzed using aCGH data. Median and mean are calculated for the percent abnormality observed in the dataset per age group of patients. IQR is a measure of variability that is obtained by dividing the dataset into different quartiles.
AgeMin. (%)1st QuartileMedianMean3rd QuartileMax. (%)IQRn (Cycles)
Donor016.6730.7732.6446.1510029.481538
17–25021.434038.015010028.5785
26017.0533.3336.255010032.9578
2702037.538.725010030101
28014.2928.5731.965010035.71192
2902033.3336.585010030251
30017.833.3336.055010032.2336
31016.6733.3336.275010033.33461
320254041.966010035529
3302037.539.6255.5610035.56669
340254042.116010035680
3502545.844.9162.510037.5816
36026.585046.2266.6710040.09896
37033.335050.9370.7210037.39939
38037.557.1456.8177.7810040.281043
3904062.559.9683.3310043.331095
400507568.09100100501044
41057.148074.0110010042.86938
42066.6793.3378.1410010033.33811
4307510084.7510010025613
4408010087.2910010020358
4507510083.510010025182
Table 2. (a) Likelihood (percentages) of finding normal (euploid) diagnoses depending on the age group the patient belongs to and the cohort size of their individual embryos are represented in this table. Embryos analyzed by aCGH (n = 78,528 embryos) are represented below. (b) Blue (high) to red (low) heat map shows the likelihood (percentages) of finding euploid embryos within cohort sizes 1 to 3 and greater than 3 in aCGH patients.
a
Cohort SizeEGD<3030313233343536373839404142>42
1 to 359.24%59.42%64.88%64.58%60.52%58.58%56.97%50.45%49.85%48.00%43.85%38.91%30.70%25.45%21.29%13.33%
4 to 664.57%61.47%58.25%59.12%53.88%58.15%53.73%53.81%52.17%46.88%39.52%38.93%30.98%26.25%20.20%15.08%
7 to 966.31%62.56%60.42%61.04%56.24%56.96%57.29%53.50%52.89%45.77%42.91%38.33%28.10%22.90%18.28%12.71%
10 to 1267.12%63.94%65.67%63.62%56.63%60.13%54.86%59.37%53.93%49.62%40.96%38.67%30.92%22.42%24.76%20.39%
13 to 1568.00%63.01%66.82%65.30%58.12%60.10%61.25%52.92%53.35%56.00%43.44%41.56%35.22%29.78%25.37%24.44%
>1667.26%64.46%66.33%70.88%60.25%60.23%61.29%59.06%57.41%48.42%44.68%43.55%38.71%29.41%17.91%11.11%
Total17,032466222282873319939933817452347864785514451094624403632464471
b
Cohort SizeEGD21–313233343536373839404142434445+
163.64%60.00%48.57%57.14%68.18%45.71%54.79%53.75%40.00%43.48%36.43%28.69%25.16%15.52%9.64%15.48%
261.93%63.30%60.00%64.66%52.24%50.51%45.10%46.85%42.04%36.25%30.66%25.15%21.23%13.54%12.21%13.04%
357.43%62.33%64.29%55.00%57.41%50.91%51.42%46.96%45.53%39.53%29.31%24.84%19.73%13.57%12.28%14.29%
>366.53%62.39%56.05%58.49%56.11%54.72%53.11%47.66%41.33%38.92%30.74%24.96%20.17%15.12%15.29%15.23%
Table 3. (a) The overall likelihood (percentages) of finding normal (euploid) diagnoses depending on the age group the patient belongs to and the cohort size of their individual embryos are represented in this table. Embryos analyzed by NGS (n = 30,533 embryos) are represented below. (b) Blue (high) to red (low) heat map shows the likelihood (percentages) of finding euploid diagnoses within cohort sizes 1 to 3 and greater than 3 in NGS patients.
a
Cohort SizeEGD<3030313233343536373839404142>42
1 to 358.59%47.92%40.54%46.09%48.28%40.00%43.69%43.25%42.86%32.26%30.03%28.81%25.00%21.91%12.28%11.69%
4 to 653.72%48.40%52.03%54.10%49.75%42.63%44.20%45.83%38.46%32.77%35.53%30.54%23.46%17.09%14.38%12.64%
7 to 957.09%47.45%53.69%49.75%43.60%45.53%42.09%43.81%39.36%37.76%36.48%27.29%24.74%19.48%12.72%11.48%
10 to 1260.42%52.38%49.48%43.75%42.46%44.95%38.67%45.56%40.52%37.50%34.97%25.91%26.58%15.79%6.58%13.79%
13 to 1564.11%52.98%34.29%61.87%32.80%37.76%36.14%46.94%49.70%25.77%26.61%24.03%19.20%13.89%7.94%9.41%
>1662.84%59.26%33.33%43.40%39.56%47.78%44.25%30.36%41.03%36.72%23.97%24.09%17.56%20.29%8.33%7.27%
Total609018228621270161514361680195919131898196420261893157011491386
b
Cohort SizeEGD21–313233343536373839404142434445+
140.91%38.19%53.33%37.50%31.58%33.33%36.11%33.33%21.95%28.57%17.74%19.05%15.52%11.11%8.82%11.11%
250.00%41.35%56.52%28.85%40.22%37.93%38.30%32.00%24.60%36.96%25.27%26.71%13.11%6.67%12.00%6.90%
360.45%46.24%39.58%40.15%46.94%46.30%41.83%27.32%32.28%20.29%23.50%17.95%11.90%13.33%12.00%5.88%
>359.98%50.81%43.96%44.36%42.22%44.80%40.31%35.96%33.68%28.35%22.74%17.56%11.20%10.68%12.62%12.10%
Publisher’s Note: MDPI stays neutral with regard to jurisdictional claims in published maps and institutional affiliations.

