Article

Influence of Milling Conditions on Fecal Sludge-Based Biochar

1
Department of Agricultural and Biosystems Engineering, College of Agriculture and Environmental Sciences, Makerere University, Kampala P.O. Box 7062, Uganda
2
Department of Forestry, Tourism and Biodiversity, College of Agriculture and Environmental Sciences, Makerere University, Kampala P.O. Box 7062, Uganda
3
Institute for Water Quality and Resource Management, Research Center of Waste and Resource Management, Technische Universität Wien (TU Wien), Karlsplatz 13/226-2, 1040 Vienna, Austria
*
Author to whom correspondence should be addressed.
Biomass 2025, 5(4), 74; https://doi.org/10.3390/biomass5040074
Submission received: 24 September 2025 / Revised: 18 October 2025 / Accepted: 30 October 2025 / Published: 14 November 2025

Abstract

This research explores the effects of milling on fecal sludge (FS) biochar with an emphasis on milling time (5, 10, and 15 min) and ball-to-powder ratio (BPR) (4.533 g/g, 9.067 g/g, and 10.5 g/g). FS biochar was prepared through slow co-pyrolysis of a 50:50 mixture (by weight) of fecal sludge and rice husk powder at 550 °C. The resultant FS biochar with good qualities was subjected to methylene blue (MB) dye adsorption at varying FS biochar weights (0.05 g, 0.1 g, and 0.15 g) and adsorption durations. The BSA peaked at 50 m2/g for a BPR of 10.5 g/g and a milling duration of 10 min. Prolonged milling (15 min) led to structural degradation and reduced BET surface area (BSA). The pore volume peaked at a BPR of 9.067 g/g for shorter milling times and 10.5 g/g for extended milling. The SEM revealed that a milling time of 10 min at a BPR of 9.067 g/g provided the best balance between particle size reduction and uniform morphology, minimizing agglomeration. MB adsorption revealed that FS biochar milled for 10 min and 9.067 g/g BPR demonstrated the best properties. These findings highlight the potential of FS biochar for applications in environmental remediation and agricultural fields, contributing to resource recovery from FS.

1. Introduction

The field of composite materials has witnessed a remarkable surge in interest and advancements, with researchers exploring innovative applications across various domains, including medicine, environmental remediation, water treatment, and the food industry, to mention but a few [1,2,3,4,5,6]. One such area of focus is the development of materials derived from biochar, which is a result of slow pyrolysis of biomass, a widely available and often underutilized resource [7,8,9]. Conventional ball milling and cryo-milling, among other techniques, have been some of the major top-down green approaches of material synthesis [10,11,12,13,14], among other approaches like lithography, laser ablation etching, etc., which result in remarkable size reduction [15,16,17,18]. However, this has been extensively practiced on various materials other than fecal sludge (FS)-derived biochar [19]. Therefore, this leaves a knowledge gap regarding the quality of products that can be derived from FS biochar through milling. Fecal sludge, a complex and heterogeneous waste material [20], has gained increasing attention as a potential source of valuable resources, including nutrients and energy, which has prompted its application as a fertilizer and as fuel [21,22]. FS biochar has gained attention for applications in soil enhancement, water purification, and energy production. Biochar properties are highly dependent on post-production modification processes that tailor its structure and functionality for specific applications [23,24]. Although thermochemical conversion techniques such as pyrolysis and hydrothermal carbonization are widely used, they often yield biochar with heterogeneous characteristics that limit performance. Subsequent modification through milling plays a pivotal role in refining these properties by improving particle size uniformity, increasing surface area, and enhancing surface reactivity. Among the available milling technologies, cryogenic milling is particularly advantageous as it minimizes thermal degradation and preserves the structural integrity of biochar. Although numerous studies have explored how milling parameters such as ball-to-powder ratio and milling time influence the physicochemical properties of biochar derived from lignocellulosic and agricultural residues [25], there remains a significant knowledge gap regarding how these parameters affect fecal sludge-derived biochar. Despite its promising potential, FS biochar has received little attention in terms of systematic milling optimization, limiting understanding of how to tailor its functional properties for advanced environmental and industrial applications. This study aimed to investigate how variations in key milling parameters influenced the physicochemical properties and functional performance of FS biochar. It was hypothesized that optimizing factors such as milling duration and ball-to-powder ratio would significantly enhance surface area, pore structure, and adsorption capacity, thereby improving the material’s suitability for environmental remediation and agricultural use. The expected outcome was to establish evidence-based milling conditions that unlock the full potential of fecal sludge biochar as a high-value product for sustainable resource recovery.

2. Materials and Methods

Sample Preparation

The FS biochar used in this study was produced from a mixture of dried fecal sludge and rice husk powder milled to a particle size of >2 mm in a 50:50 mixing ratio (by weight). The mixture was subjected to slow pyrolysis to generate the FS biochar at a temperature of 550 °C for two hours in a Nabertherm muffle furnace under a constant nitrogen flow of 2 L/min. After cooling to room temperature, the FS biochar was stored in airtight containers to prevent contamination and moisture absorption. The FS biochar was ball-milled in a Retsch cryomill using stainless steel balls of various diameters at a frequency of 30 Hz while varying the ball-to-powder ratio and milling time. The milling time was varied at 5, 10, and 15 min while the ball-to-powder ratio (BPR) was varied by maintaining a constant sample weight of 6 g and varying the weight of the balls. The resultant BPRs were 4.533 g/g, 9.067 g/g, and 10.5 g/g. Each experiment was repeated three times to ensure precision and repeatability of the experimental outcomes.

3. Analyses and Characterization

3.1. Determination of Carbon and Nitrogen

The resultant FS biochar’s elemental composition (carbon and nitrogen) for all samples was measured using an elemental analyzer (Vario EL III, Elementar Analysensysteme GmbH, Langenselbold, Germany). Three measurements were carried out per sample, each of them comprising 5 mg of sample material.

3.2. Determination of Particle Size and Surface Morphology

The particle size distribution was measured using laser diffraction equipment (Malvern Mastersizer 2000, Worcestershire, UK). A total of three runs were carried out per sample, with 3 g of sample for each run. To determine the surface morphology, a sample of 1 mg was carefully placed on the SEM sample holder for double gold spattering with COXEM SPT-20 Ion Sputter Coater made in Daejeon, South Korea; the sample holders with samples were carefully placed in the SEM, and images were taken. The benchtop scanning electron microscope (SEM Coxem EM-30 plus made in Daejeon, South Korea) was used to determine the surface morphology and composition.

3.3. Analysis of Functional Groups

Fourier Transform Infrared Spectroscopy (FTIR) was used to determine the functional groups using a Bruker Alpha II compact FT-IR spectrometer made in Billerica, Massachusetts, USA. For each analysis, approximately 1 mg of the sample was placed on the Attenuated Total Reflectance (ATR) crystal for analysis. This analysis provided qualitative information on the functional groups present, enabling characterization of the material.

3.4. Measurement of Surface Area, Pore Volume, and Pore Size

The FS biochar surface area, pore size, and pore volume were measured as per Figure 1 using the Micromeritics ASAP 2020 made in Norcross, GA, USA. Accelerated Surface Area and Porosimetry system. Approximately 0.2 g of each sample was analyzed using the BET (Brunauer, Emmett, and Teller) method. Prior to analysis, the samples were degassed at 200 °C for 10 h to remove moisture and impurities. Due to the complexity and high cost of the procedure, each measurement was performed once. The measurements, including specific surface area, pore size, and pore volume, were conducted over a 12-h period after degassing, as shown in the Figure 1.

3.5. Dye Adsorption

The adsorption performance of three FS biochar samples towards methylene blue (MB), a model cationic dye, was evaluated to assess the influence of milling parameters on adsorption efficiency. Methylene blue (MB) adsorption experiments were performed in an OLS26 Aqua Pro shaking (made in Cambridge, United Kingdom) water bath held at a constant temperature of 25 °C and 100 rpm. The three samples with the best physical and chemical attributes were selected: S1 was FS biochar milled for 10 min at a BPR of 9.067 g/g, S2 was FS biochar milled for 10 min at a BPR of 10.5 g/g, and S3 was FS biochar milled for 15 min at a BPR of 10.5 g/g. Adsorption experiments were conducted using a fixed initial dye concentration of 5 ppm, while the amount of FS biochar was varied at 0.05 g, 0.10 g, and 0.15 g to evaluate the effect of the dosages. Contact time was also varied at 1, 5, 10, 15, and 20 h to determine the influence of adsorption duration. After each experiment, the remaining dye concentration in solution was determined using a JENWAY UV spectrophotometer model 6705 (a make of United Kingdom) at 665 nm. A standard calibration curve was plotted using known MB concentrations and their corresponding absorbance values to accurately quantify residual dye concentrations. The calibration constant determined from the standard calibration curve was then used to calculate the dye concentration based on the absorbance measurement readings after dye adsorption. The adsorbed dye was then determined from the difference between it and the initial dye concentration of 5 mg/L.

3.6. Statistical Analysis

In this study, R software 4.5.2 was used for analysis, with the effect of varying two influencing factors: the pyrolysis temperature and mixing ratios of the two analyzed feedstocks. A two-way analysis of variance (ANOVA) at a significance level of p < 0.05 was used to evaluate significant differences between treatments for char yield, specific surface area, pore size, and pore volume. The normality of the data was assessed using the Shapiro–Wilk test to confirm that the assumptions for ANOVA were met. All experiments were performed in triplicate to ensure the reliability and reproducibility of the results.

4. Results and Discussions

4.1. Effect of BPR and Milling Time on Carbon and Nitrogen

The analysis of milling time and ball-to-powder ratio (BPR) on carbon (C) and nitrogen (N) content as visualized in Figure 2 revealed no statistically significant effects (p > 0.05). This is attributed to the purely mechanical, room-temperature nature of ball milling, which alters particle size, porosity, and surface accessibility without introducing reactive chemicals or high temperatures so that bulk elemental C and N remain essentially unchanged despite surface-level modifications. Specifically, the p-values for milling time were 0.175 (C) and 0.188 (N), while those for BPR were 0.796 (C) and 0.781 (N), suggesting that neither variable independently influences C or N within the tested conditions. Additionally, the interaction effect (Time × BPR) was not significant (p = 0.355 for C, p = 0.419 for N), implying that the combined effect of milling time and BPR does not significantly alter these elemental compositions. However, the plotted trends indicate a peak in C (23.6%) and N (0.94%) at 10 min with a BPR of 10.5 g/g, suggesting this may be an optimal condition for maximizing elemental content. While statistical significance was not achieved, the observed trends imply that adjusting milling parameters could still enhance carbonization and nitrogen retention, warranting further studies with extended milling durations and finer parameter increments to validate these findings. Based on the results, 10 min of milling at a BPR of 10.5 g/g appears to be the most favorable condition for maximizing carbon and nitrogen content, though further research is needed to confirm its reliability across different feedstocks. Despite the lack of statistical significance, the trends suggest that optimized ball milling could improve FS biochar properties, which is similar to the findings by Lopez-Tenllado, Motta [26] and Lyu, Gao [27]. This milled biochar, with higher carbon content, could serve as an efficient adsorbent for pollutants [28,29,30], including heavy metals and organic contaminants in wastewater treatment. Additionally, its enhanced nitrogen content makes it a promising soil amendment [31,32], improving soil fertility and nutrient retention in agriculture. Furthermore, FS biochar with high carbon purity can be explored for energy storage applications, such as in supercapacitors or activated carbon production for catalysis [33]. Future studies should investigate the structural and surface-area modifications resulting from milling to better align FS biochar properties with specific applications.

4.2. Particle Size Distribution

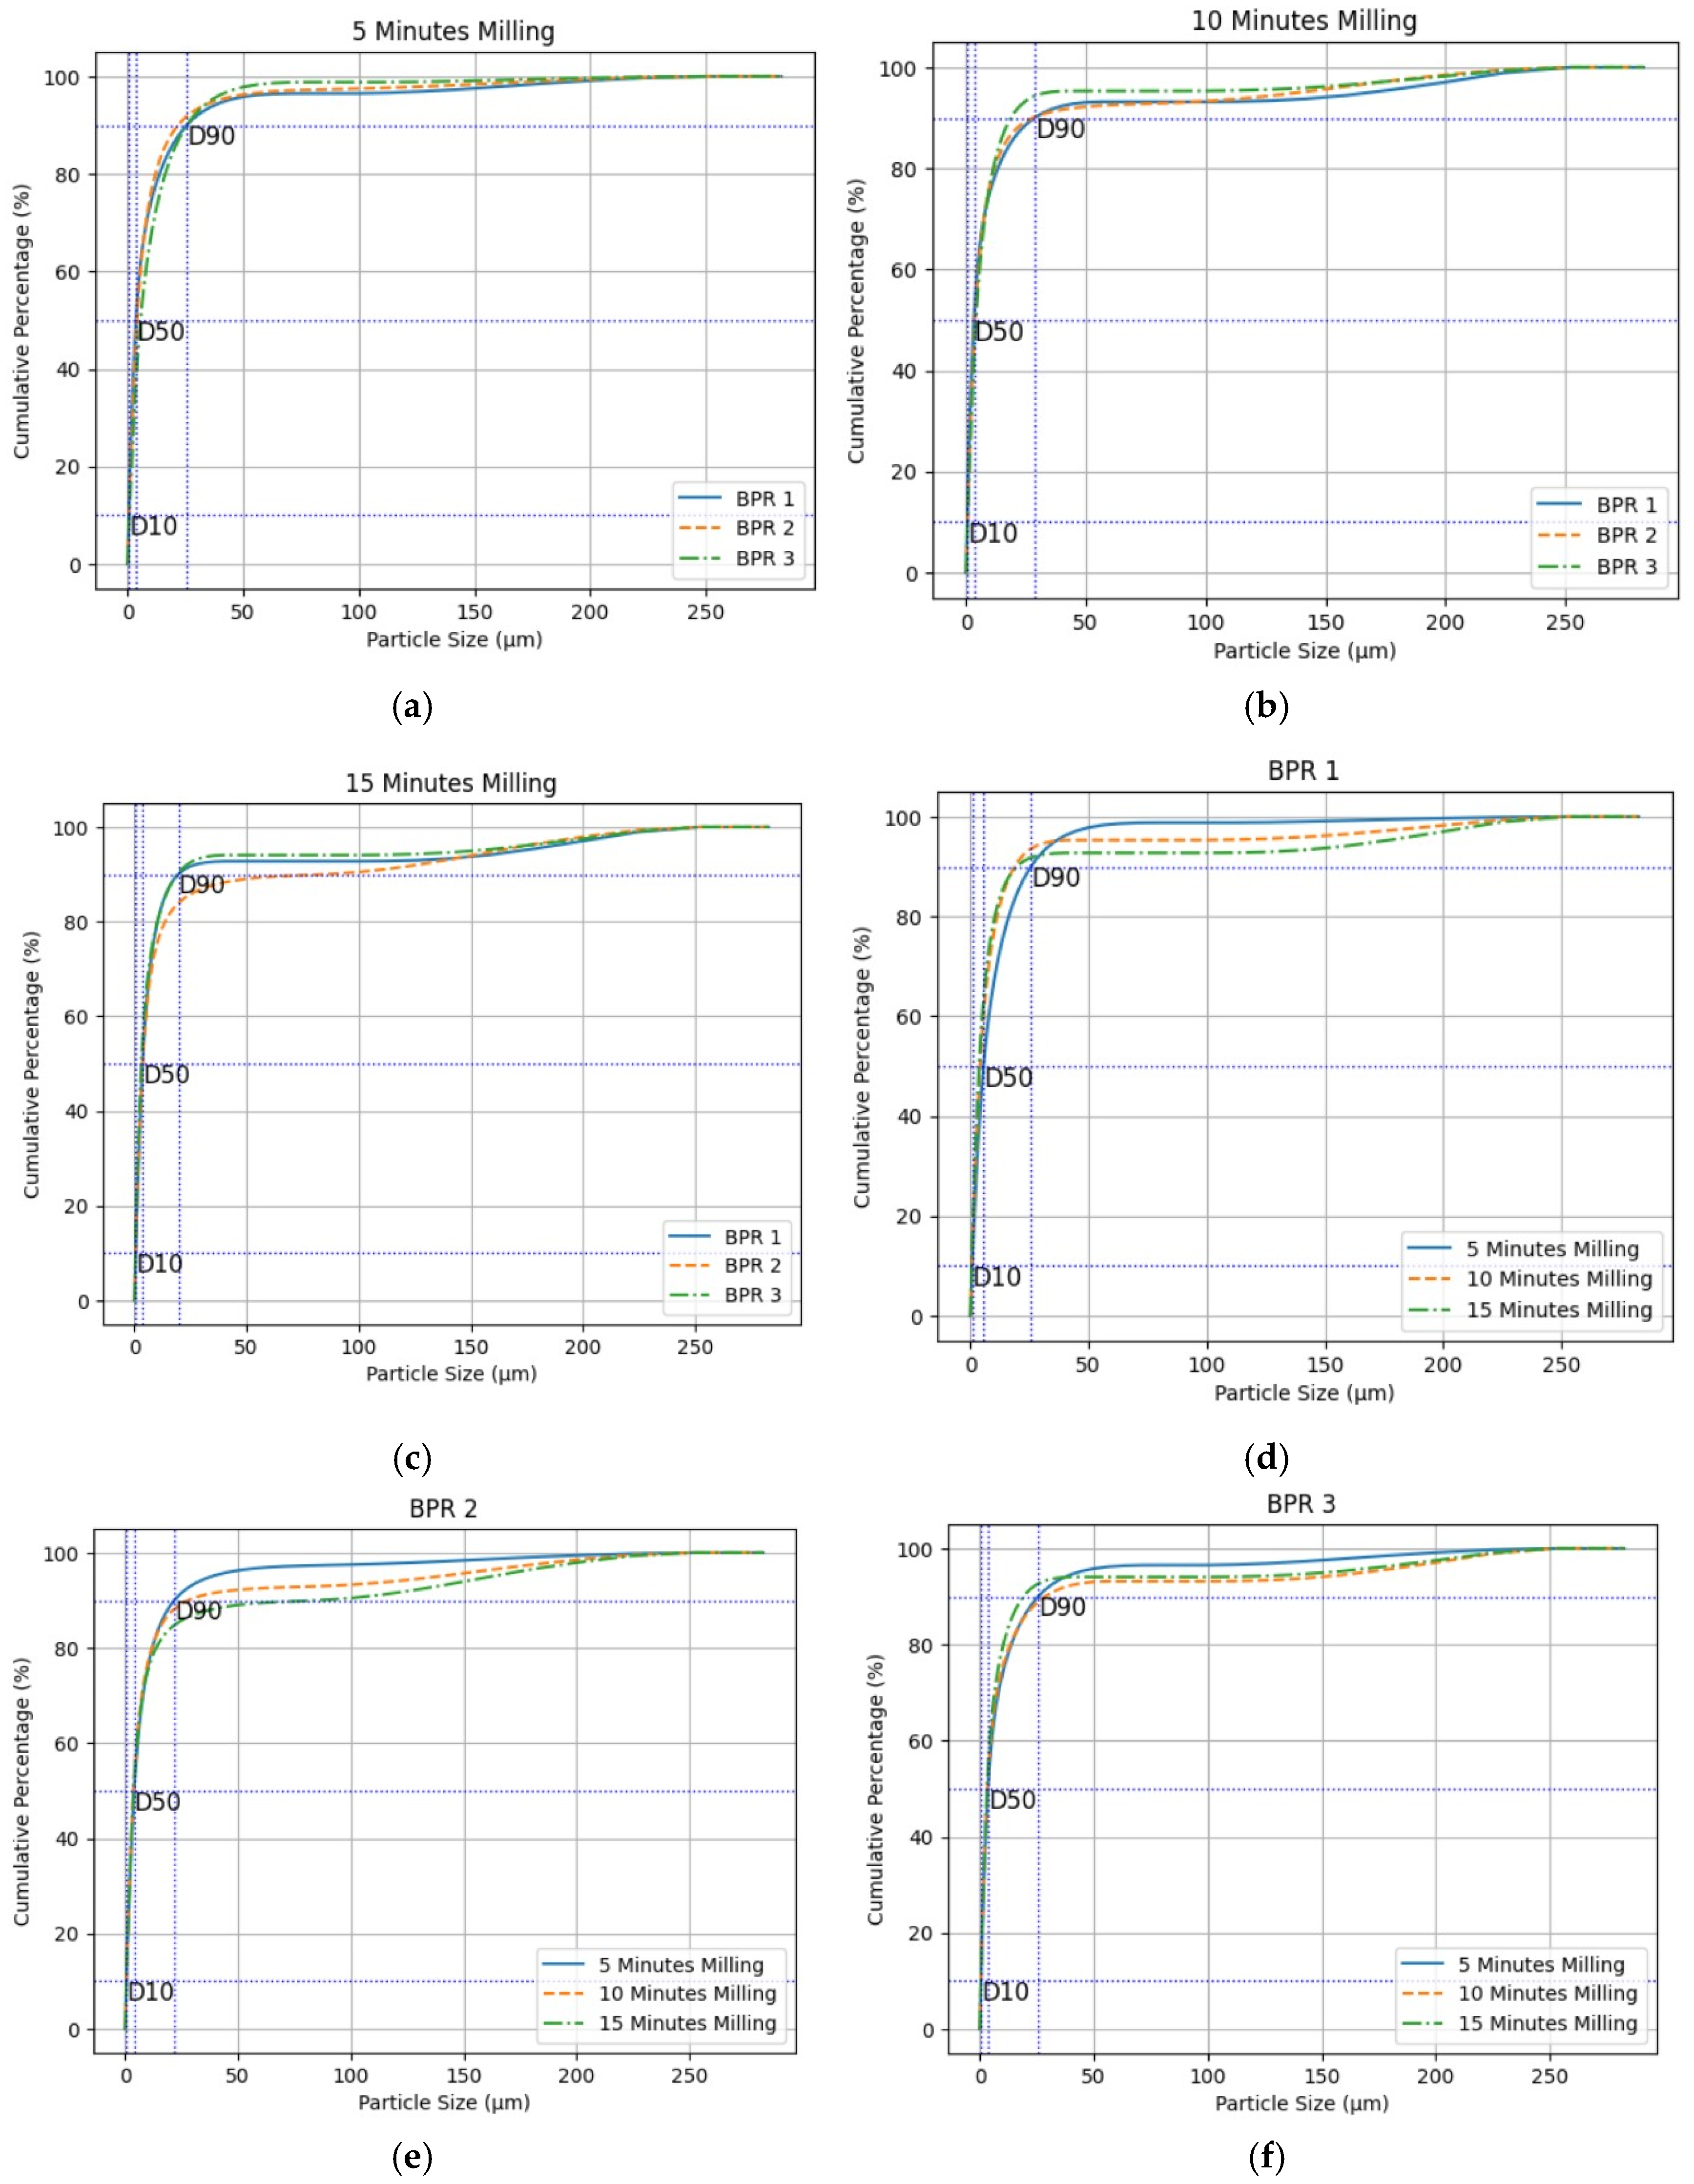
The particle size distribution of FS biochar is significantly influenced by both ball-to-powder ratio (BPR) and milling time. At a low BPR of 4.533 g/g with 5 min of milling, as seen in Figure 3a, the distribution was broad, with the largest particles at D90, while there was no visible difference in particle size at D90 for 10 and 15 min of milling. The minimal fragmentation at BPR 1 indicates insufficient energy transfer, resulting in larger particles. Increasing the BPR to 9.067 g/g (Figure 3b) narrows the distribution as D10, D50, and D90 shift towards smaller sizes, though larger particles persist due to the short milling time. At 10.5 g/g (Figure 3c), the higher energy input effectively reduces particle size, resulting in a more concentrated distribution, although some coarse particles remain unbroken. Extending the milling time to 10 min at 4.533 g/g (Figure 3d) shows improved particle fragmentation and lower D90 values, though the low BPR limits the degree of size reduction. At 9.067 g/g and 10 min (Figure 3e), the particle size distribution becomes significantly more uniform, with reduced mean particle size at D50 and minimal coarse particles at D90. The finest and most uniform particle sizes are achieved at 10.5 g/g with 10 min of milling, as seen in Figure 3f, where D10, D50, and D90 are the lowest, reflecting efficient fragmentation and consistent distribution. The combination of high BPR and extended milling time maximizes energy transfer and avoids over-milling effects like agglomeration. These findings demonstrate that the optimal condition for achieving the smallest and most uniform particle size is a BPR of 10.5 g/g with 10 min of milling. This enhances surface area and particle morphology, making the biochar ideal for applications requiring high adsorption capacity, such as wastewater treatment, gas adsorption, and catalytic support in pollutant degradation, as reported by Harindintwali, He [34]. The relationship between milling parameters and particle distribution highlights the importance of optimizing both BPR and the time to achieve targeted properties for specific applications [35].

4.3. Surface Morphology

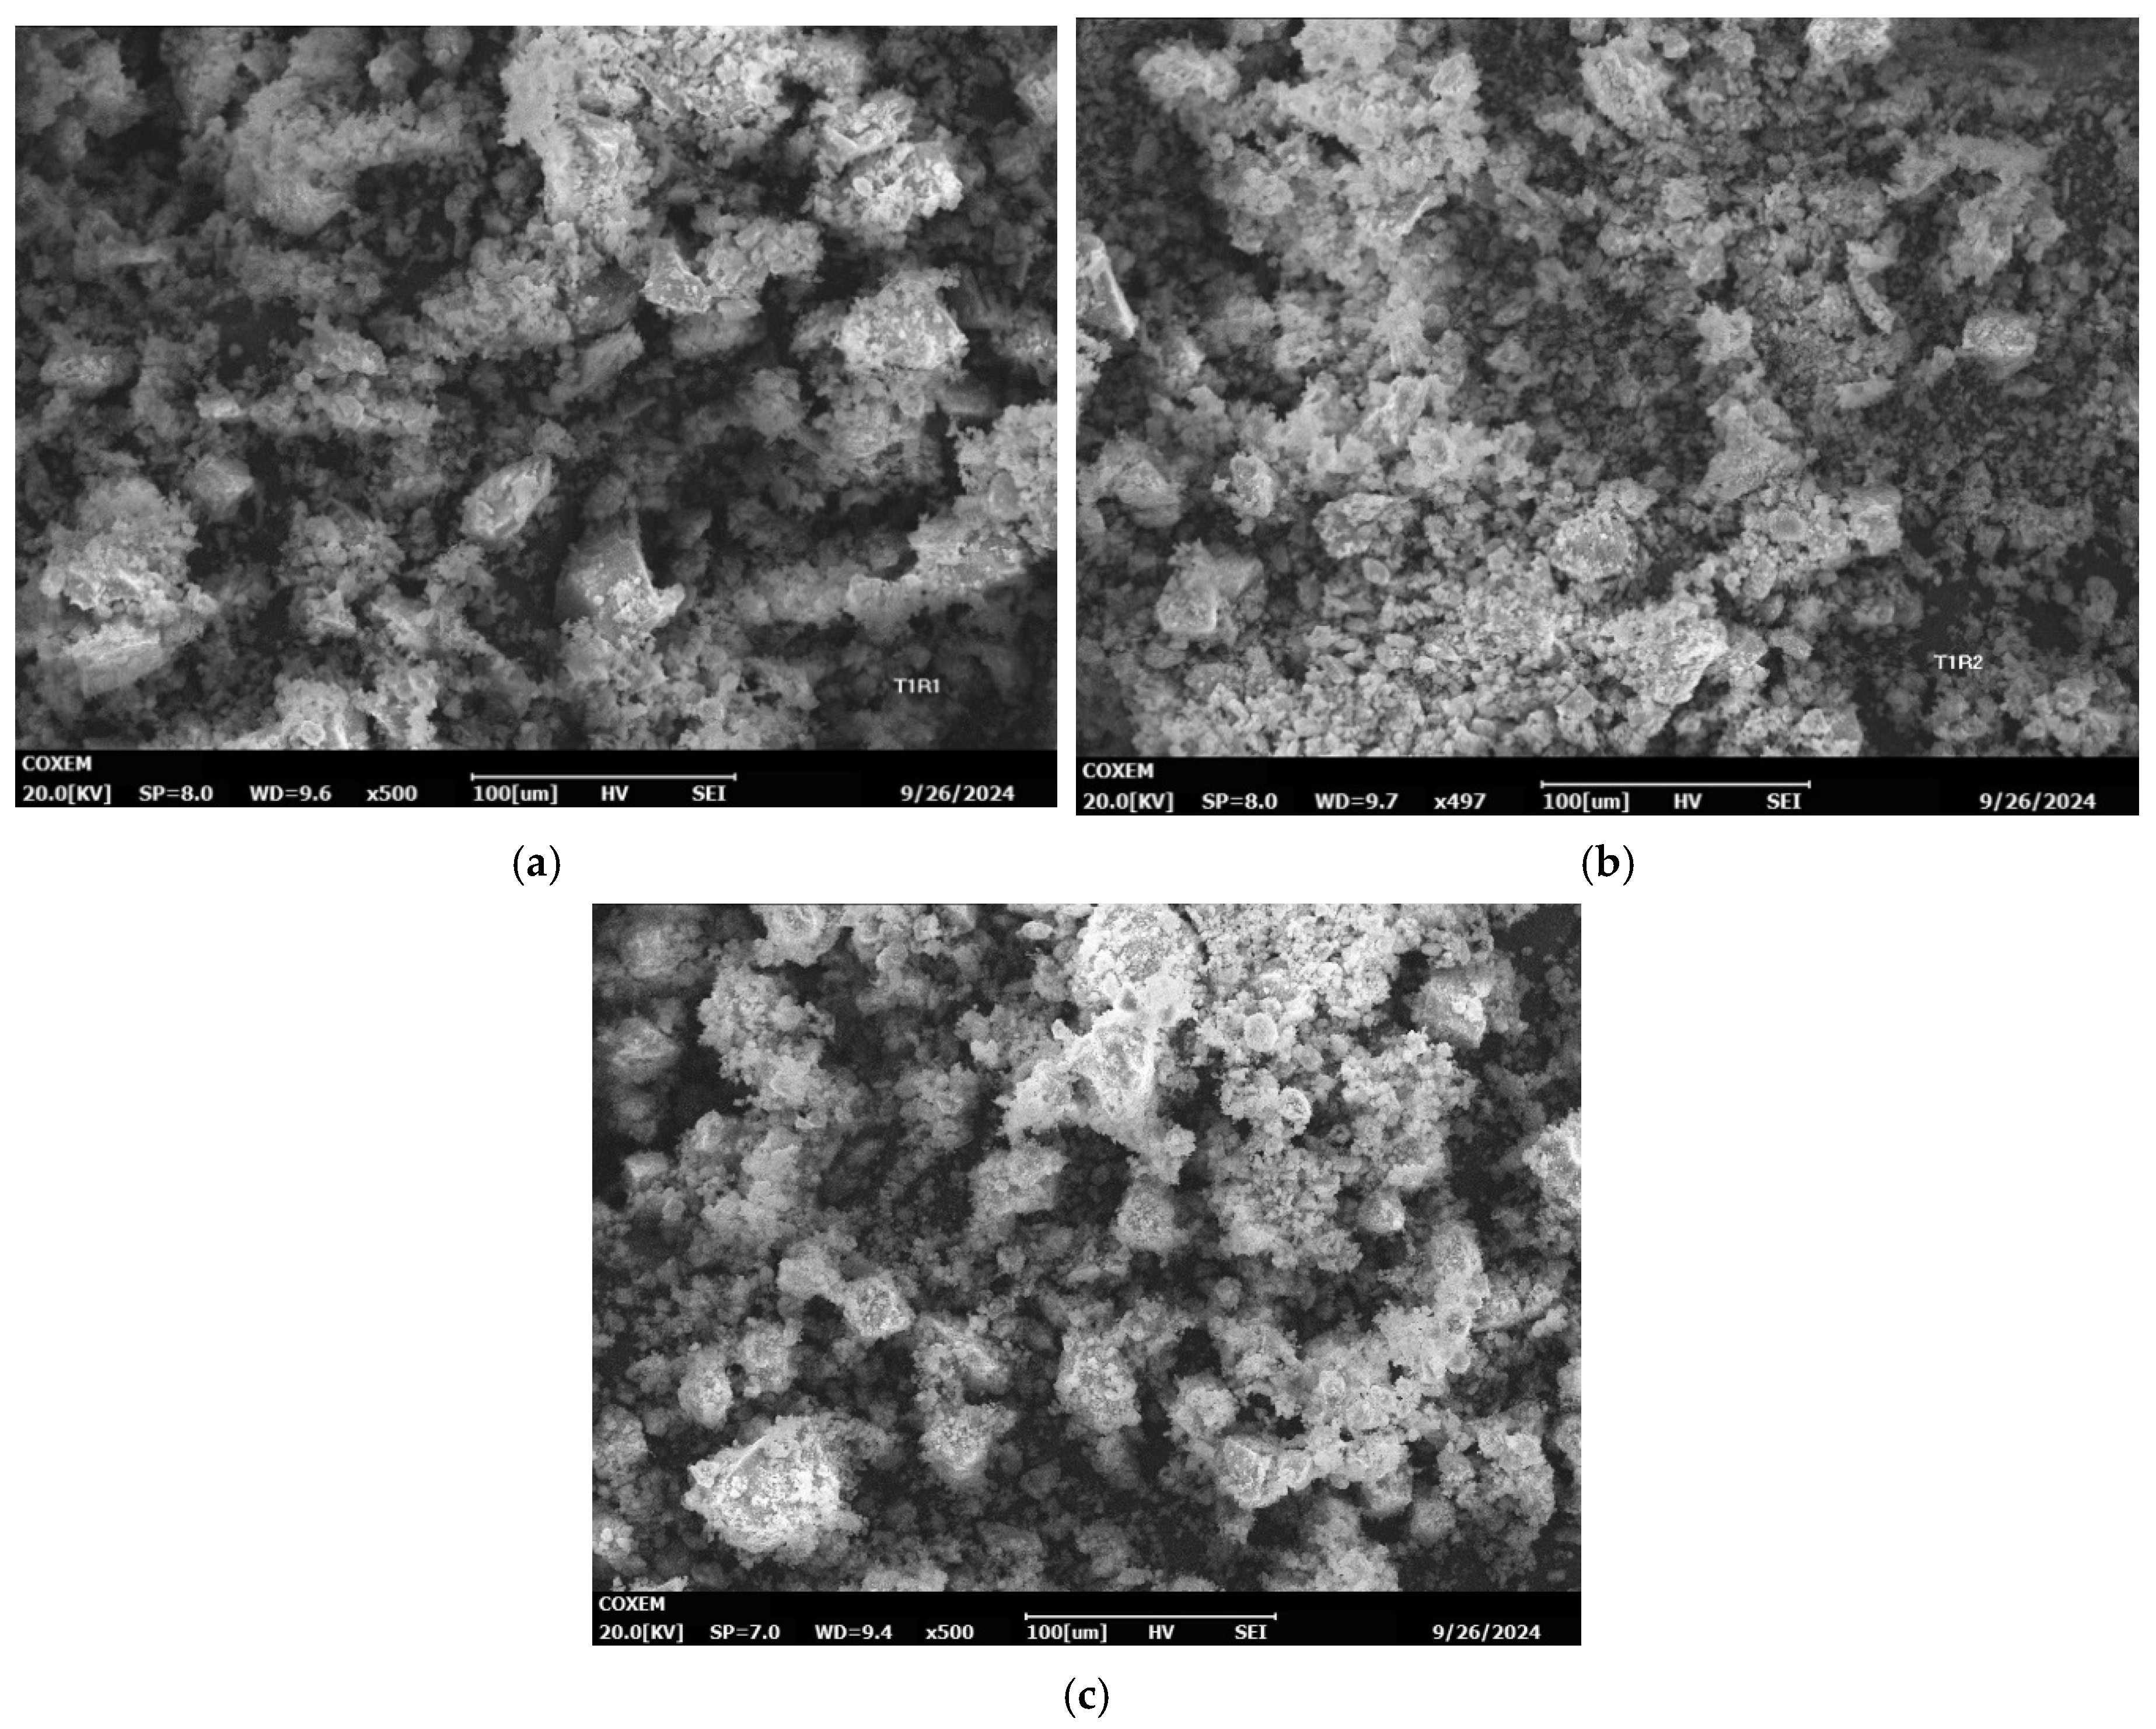
The SEM images at a magnification of ×500 in Figure 4 reveal significant variations in the surface morphology of FS biochar particles influenced by milling time and ball-to-powder ratio (BPR). At a milling time of 5 min, particles with a BPR of 4.533 g/g in Figure 4a exhibit coarse and clustered structures, while increasing the BPR to 9.067 g/g in Figure 4b results in noticeable particle size reduction and agglomeration due to enhanced energy transfer. At 10.5 g/g, finer particles with increased agglomeration and welding are observed in Figure 4c. With a milling time of 10 min, the morphology becomes more refined as seen in Figure 5, with smoother surfaces and reduced roughness at a BPR of 4.533 g/g in Figure 5a. At 9.067 g/g in Figure 5b, further refinement and improved uniformity are evident, while at 10.5 g/g in Figure 5c, agglomeration and particle welding are more pronounced due to excessive energy. At 15 min as seen in Figure 6, the morphology at 4.533 g/g in Figure 6a is finer and more uniform, while 9.067 g/g in Figure 6b provides the best balance between particle size reduction and smoothness. However, at 10.5 g/g in Figure 6c, severe agglomeration and welding dominate. The rise in BET surface area to a maximum at 10 min, especially at BPR ≈ 10.5 g/g, tracks the SEM evidence of effective fragmentation and pore development (finer, more uniform particles with a limited coarse tail). Beyond this point, the drop in BET at 15 min aligns with SEM-observed agglomeration and particle welding, consistent with pore collapse/occlusion under excessive impact energy. Notably, BPR ≈ 9.07 g/g for 10 min provides the best balance in both datasets, yielding a high surface area while minimizing agglomeration, whereas higher BPR or longer time drives morphological changes that negate surface-area gains.
The results highlight that a milling time of 10 min and a BPR of 9.067 g/g offer the optimal balance for refining FS biochar particles with minimal agglomeration. These FS biochar particles, with their enhanced surface area and uniform morphology, have potential applications in environmental remediation, such as adsorption of wastewater pollutants and carbon sequestration, as well as in agriculture as soil amendments to improve nutrient retention and water-holding capacity.

4.4. Functional Groups

The FTIR analysis of the FS biochar samples reveals the presence of several functional groups, including hydroxyl (-OH), carbonyl (C=O), aromatic C=C, aliphatic C-H, ether (C-O-C), and alcohol (C-OH) groups, all of which vary with milling time and ball-to-powder ratio. Hydroxyl groups, identified by strong peaks at 3200–3600 cm−1, are most abundant at 10 min of milling and a ball-to-powder ratio of 9.067 g/g, where moderate mechanical energy enhances surface functionalization without causing structural damage. Excessive milling (15 min at 10.5 g/g) reduces their intensity due to structural degradation. Carbonyl groups, characterized by peaks near 1650–1750 cm−1, follow a similar trend, with maximum intensity at 10 min and 9.067 g/g, where increased functionalization occurs without compromising the FS biochar’s integrity. Aromatic C=C groups, appearing at 1500–1600 cm−1, become more prominent with higher ball-to-powder ratios like 10.5 g/g, as structural reorganization exposes aromatic domains, though prolonged milling diminishes these effects. Aliphatic C-H groups (2800–3000 cm−1) are most pronounced at 5 min and 4.533 g/g but diminish with increasing milling time and ratio, indicating a transition to a more aromatic and functionalized structure. Ether (C-O-C) and alcohol (C-OH) groups, located in the 1000–1300 cm−1 region, show increased intensity at 10 min and 9.067 g/g, enhancing surface reactivity, but decline with over-milling due to pore collapse and reduced surface area.
These functional groups collectively enhance the adsorption capabilities of FS biochar, making it effective for various applications [36]. Hydroxyl and carbonyl groups improve the adsorption of heavy metals like Pb2+, Cd2+, and Zn2+ through hydrogen bonding and coordination complex formation, while aromatic C=C groups facilitate π-π interactions with nonpolar organic molecules, including dyes, polycyclic aromatic hydrocarbons (PAHs), and volatile organic compounds (VOCs) [37]. Ether and alcohol groups further enhance adsorption through donor–acceptor interactions and hydrogen bonding [38,39]. Among all parameters, a milling time of 10 min and a ball-to-powder ratio of 9.067 g/g emerge as the most suitable, balancing functional group density, structural integrity, and pore volume. This parameter produces FS biochar with optimal adsorption properties capable of addressing a wide range of industrial and environmental challenges, such as water treatment and catalytic support in pollutant degradation.

4.5. BET Surface Area and Pore Volume

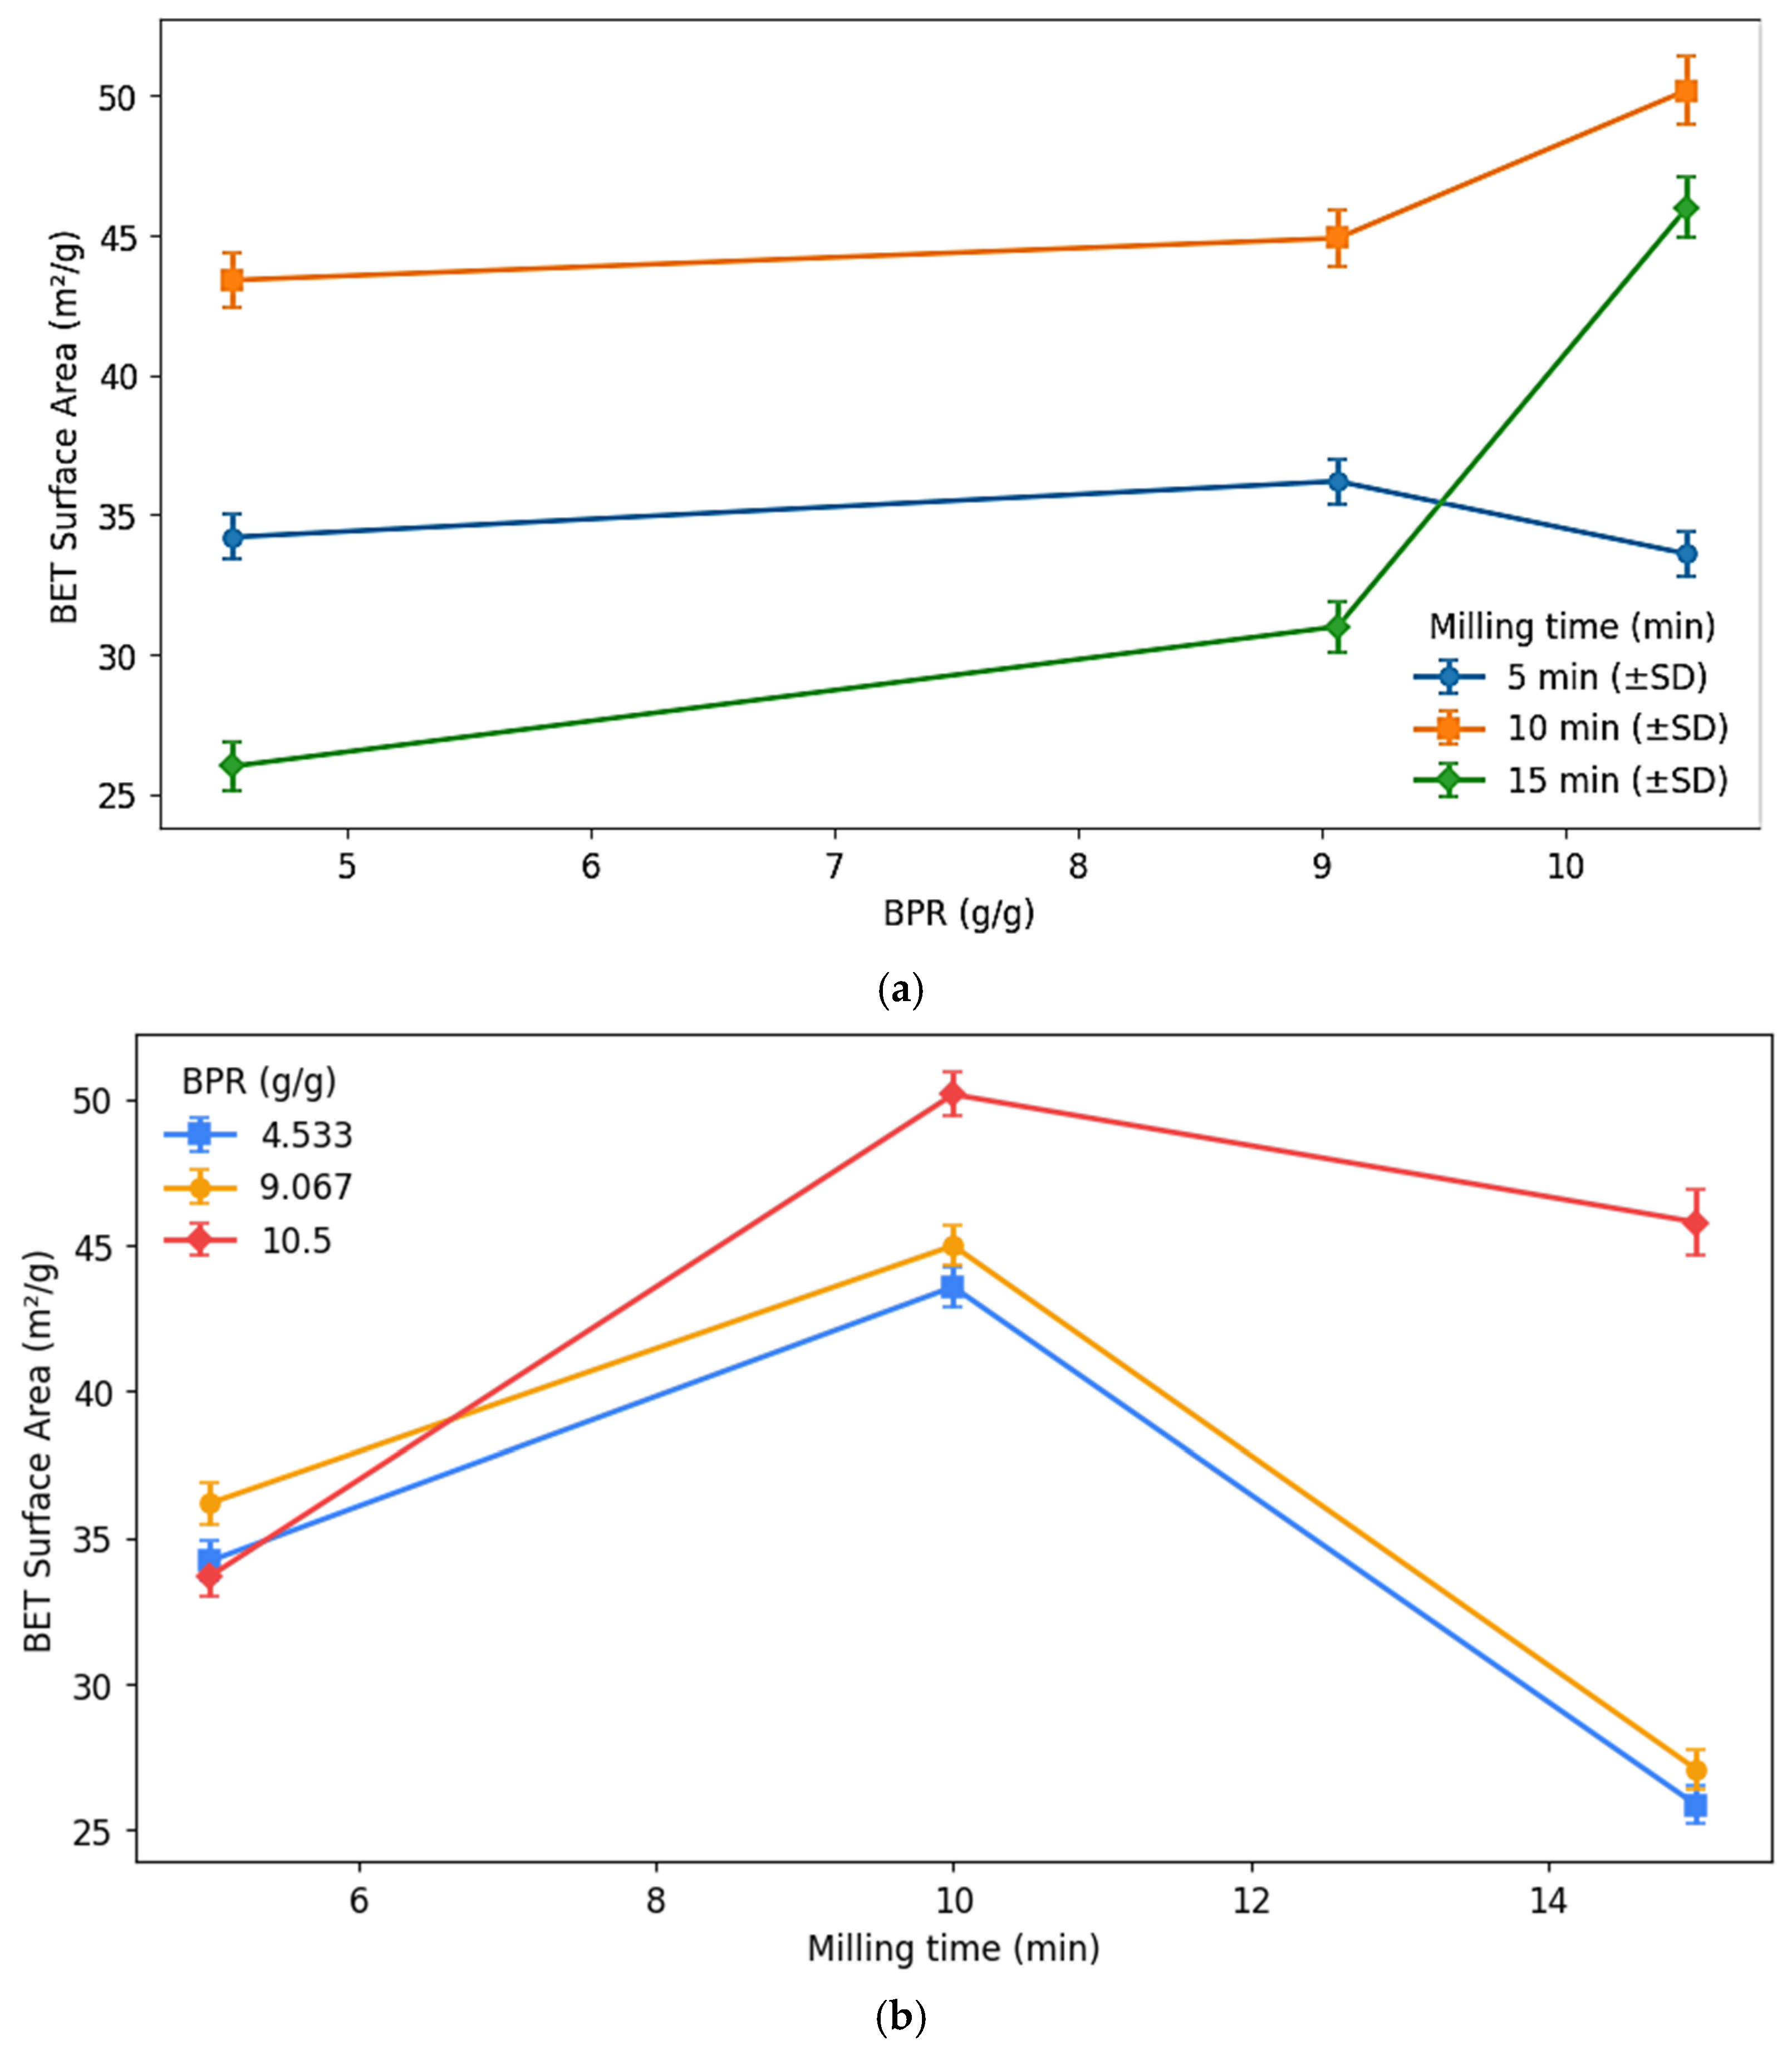
As observed in Figure 7a, the BET surface area exhibited significant variation with changes in BPR, with a clear dependence on the milling time. For a milling duration of 5 min, the surface area remained relatively consistent across all BPR values. This indicates that at shorter milling times, the energy imparted is insufficient to cause substantial changes in the particle size or pore structure, regardless of the ball-to-powder ratio. However, at a milling time of 10 min, a BPR of 10.5 g/g produced the highest BET surface area of 50 m2/g. This outcome highlights the optimal balance between the number of milling balls and powder volume, ensuring effective energy transfer and particle comminution. In contrast, lower BPRs of 9.067 g/g and 4.533 g/g resulted in lower surface areas, suggesting reduced milling efficiency due to fewer collisions between the balls and FS biochar particles.
At 15 min, the BET surface area decreased for all BPR values, with the most pronounced decline occurring at a BPR of 4.533 g/g, where the surface area dropped to 25 m2/g, as similarly reported by Abbas, Al Ahmad [40]. This decrease can be attributed to excessive milling, leading to particle agglomeration, pore collapse, or structural degradation [40]. These results show the combined effect of BPR: while a higher ratio facilitates pore development by intensifying collisions, prolonged milling may counteract these benefits by inducing adverse morphological changes.
Milling time directly influences the duration over which mechanical energy is applied to the FS biochar particles, as seen in Figure 7b. The results indicate that the relationship between milling time and surface area varies with the ball-to-powder ratio. For all BPR values, the BET surface area initially increased with time, peaking at 10 min before declining with further milling. For the highest BPR (10.5 g/g), the BET surface area exhibited a sharp increase from 5 min to 10 min, reaching approximately 50 m2/g. This trend reflects enhanced particle fragmentation and pore formation, as the extended milling duration allows for more energy to be imparted. However, at 15 min, the surface area decreased, likely due to over-milling effects such as particle agglomeration or the collapse of fragile micropores. Lower BPRs (9.067 g/g and 4.533 g/g) showed similar but less pronounced trends. At these ratios, the energy imparted during milling may be insufficient to sustain optimal fragmentation over time, leading to smaller gains in surface area. The decline in surface area at 15 min was more pronounced for lower BPRs, suggesting that longer milling exacerbates inefficiencies in energy transfer and structural instability [41]. These findings highlight the importance of optimizing milling time to avoid the diminishing returns associated with prolonged mechanical stress. The peak surface area observed at 10 min suggests that this duration represents the optimal balance between sufficient energy input and preservation of structural integrity.
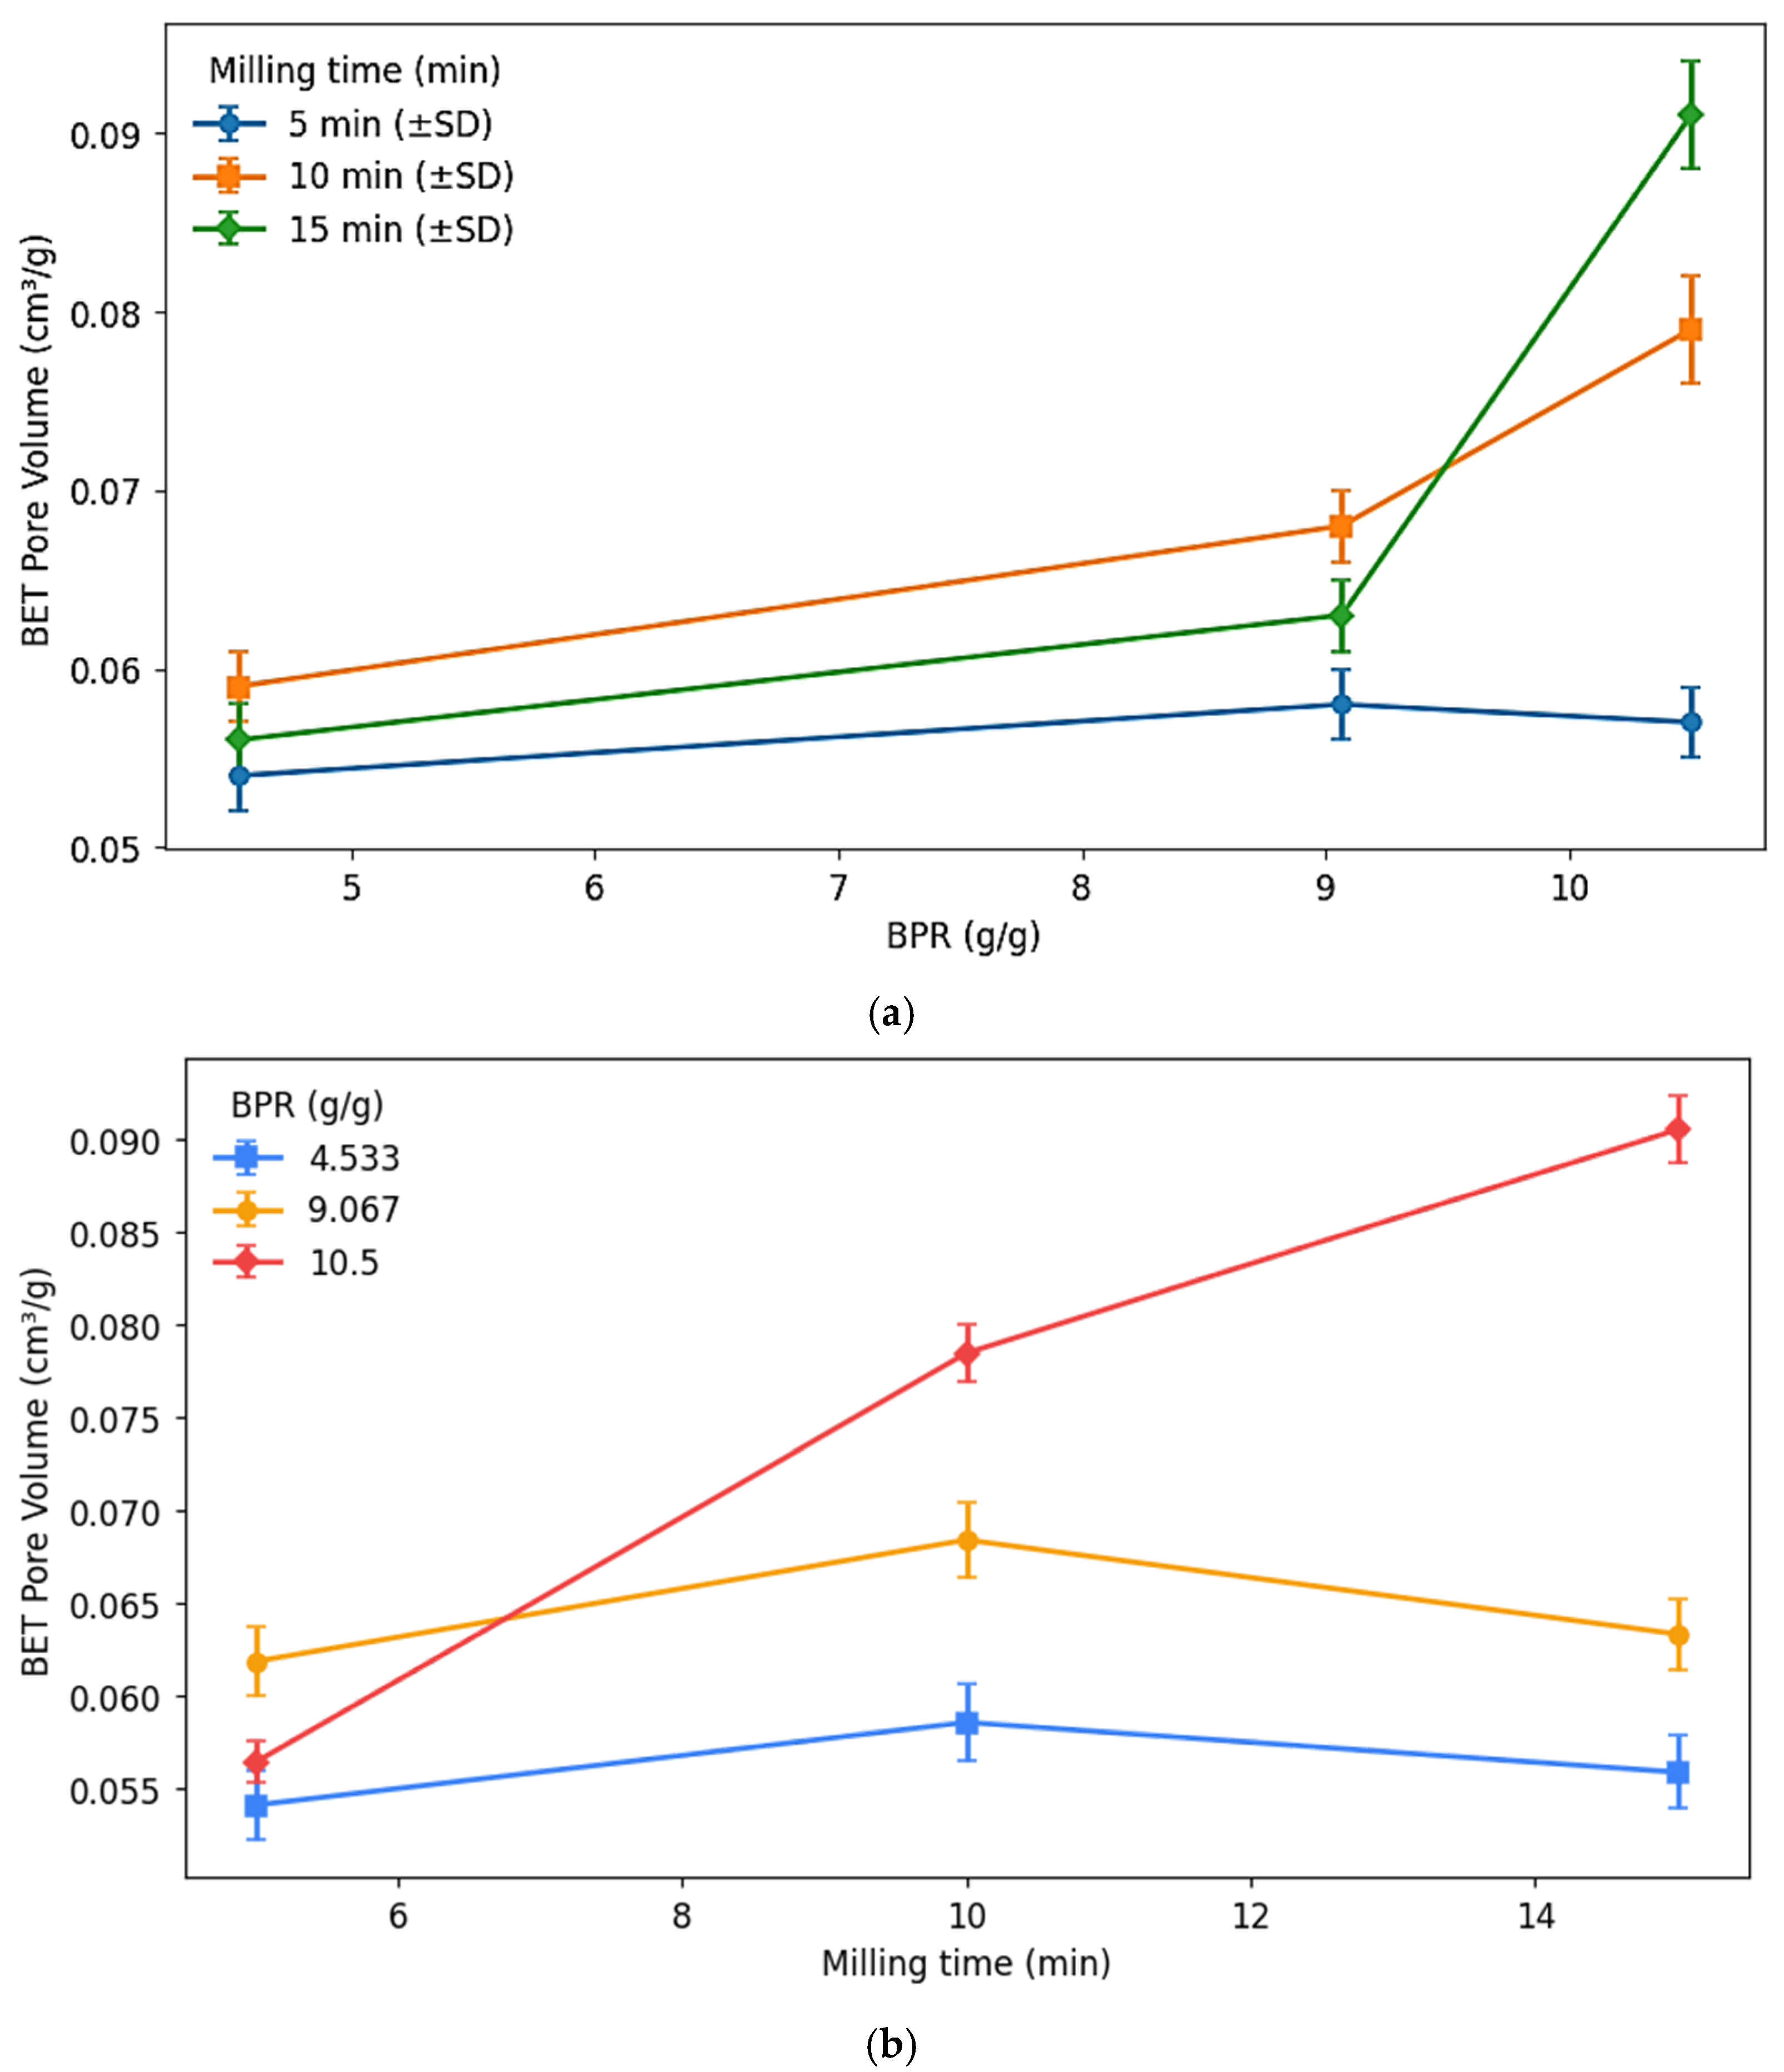
According to Figure 8, BET pore volume rises with BPR at short milling times (5–10 min), peaking at ≈9.07 g g−1, then drops to 10.5 g g−1 due to agglomeration/pore collapse. At 15 min, pore volume increases roughly linearly with BPR, making 10.5 g g−1 × 15 min the most porous condition. Varying time at low BPR (≈4.53 g g−1) yields little gain or even losses because limited energy promotes re-agglomeration, whereas medium/high BPR (≈9.07–10.5 g g−1) plus a longer time effectively fragments particles and open pores. Material response helps as follows: rice husk char (brittle and carbon-rich) readily refines to expose porosity, while fecal sludge char (mineral-stiffened) preserves a stable framework that supports newly opened pores. Overall, pore development depends on a balanced BPR–time window: moderate BPR optimizes porosity at short times, while high BPR requires longer milling to avoid agglomeration and maximize accessible pore volume.

4.6. Methylene Blue Adsorption

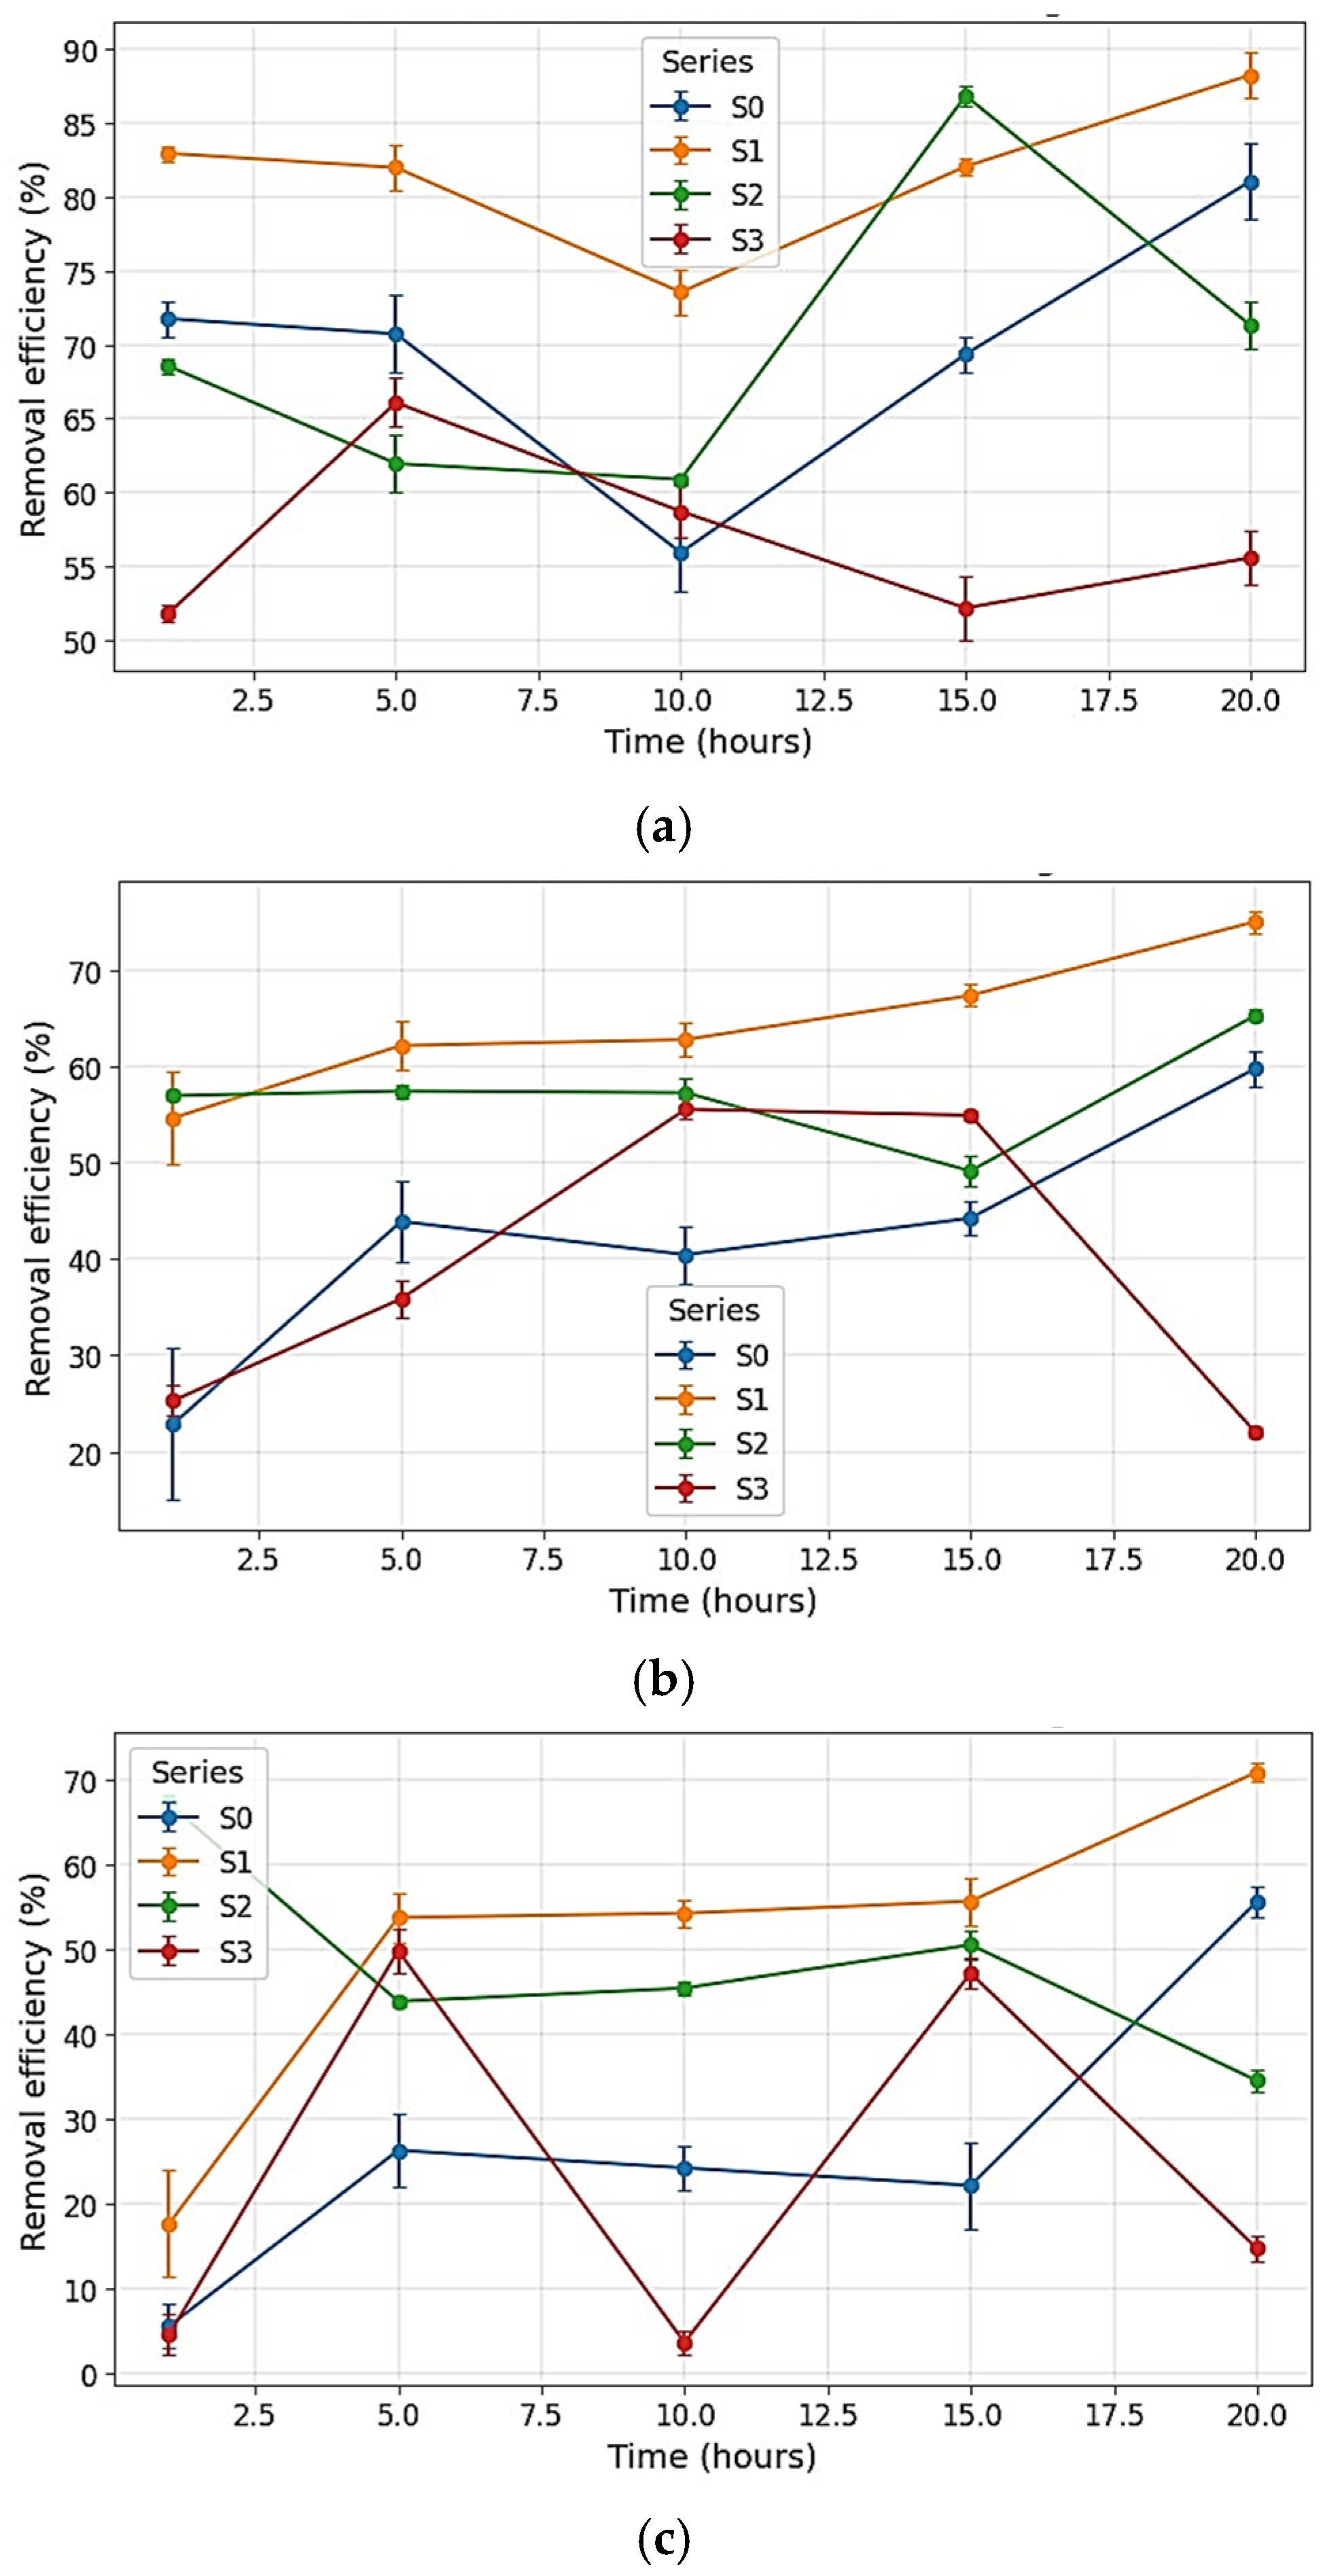
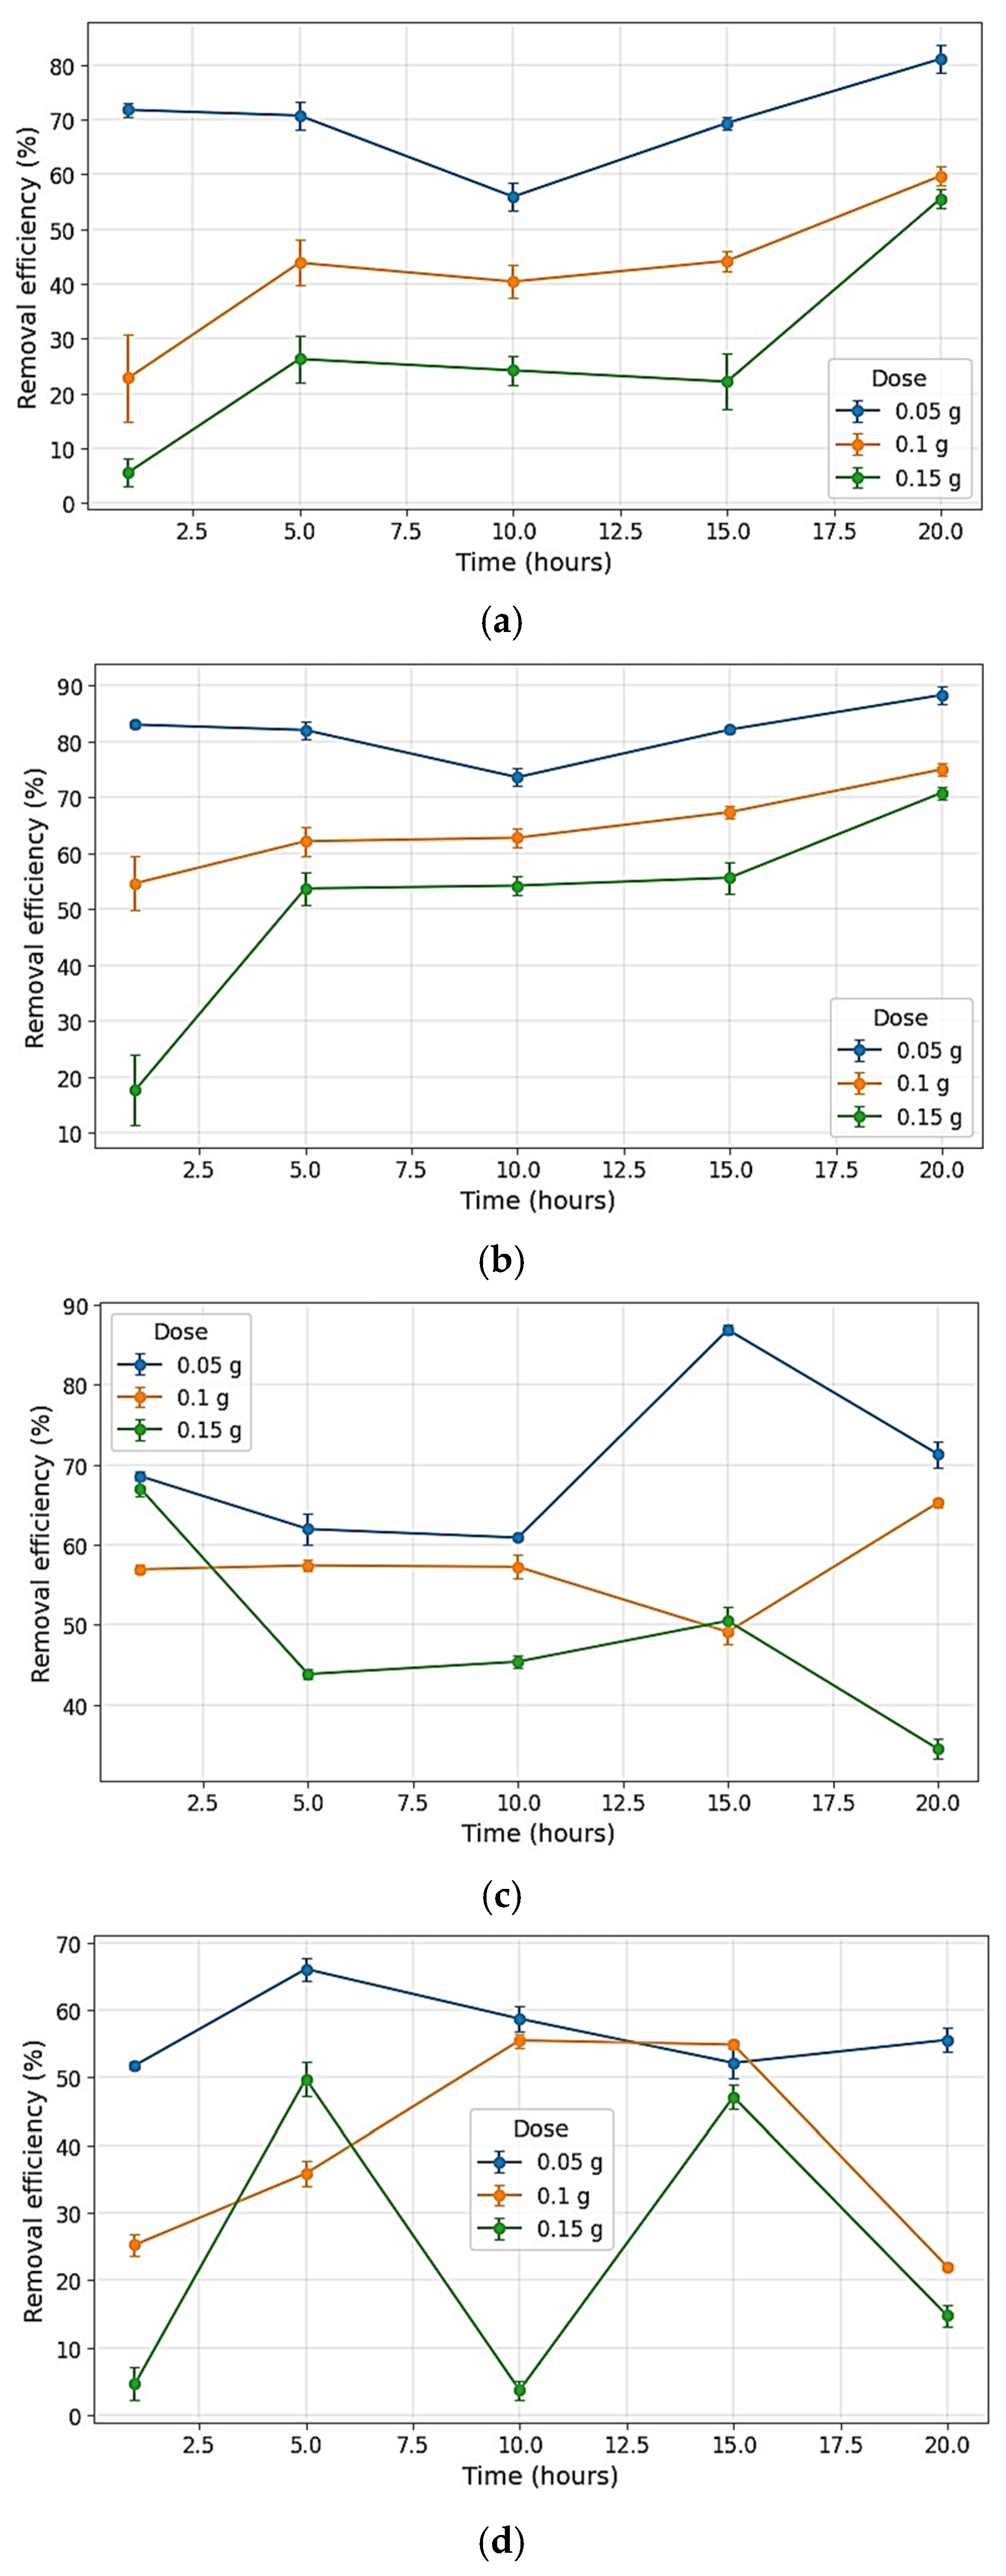
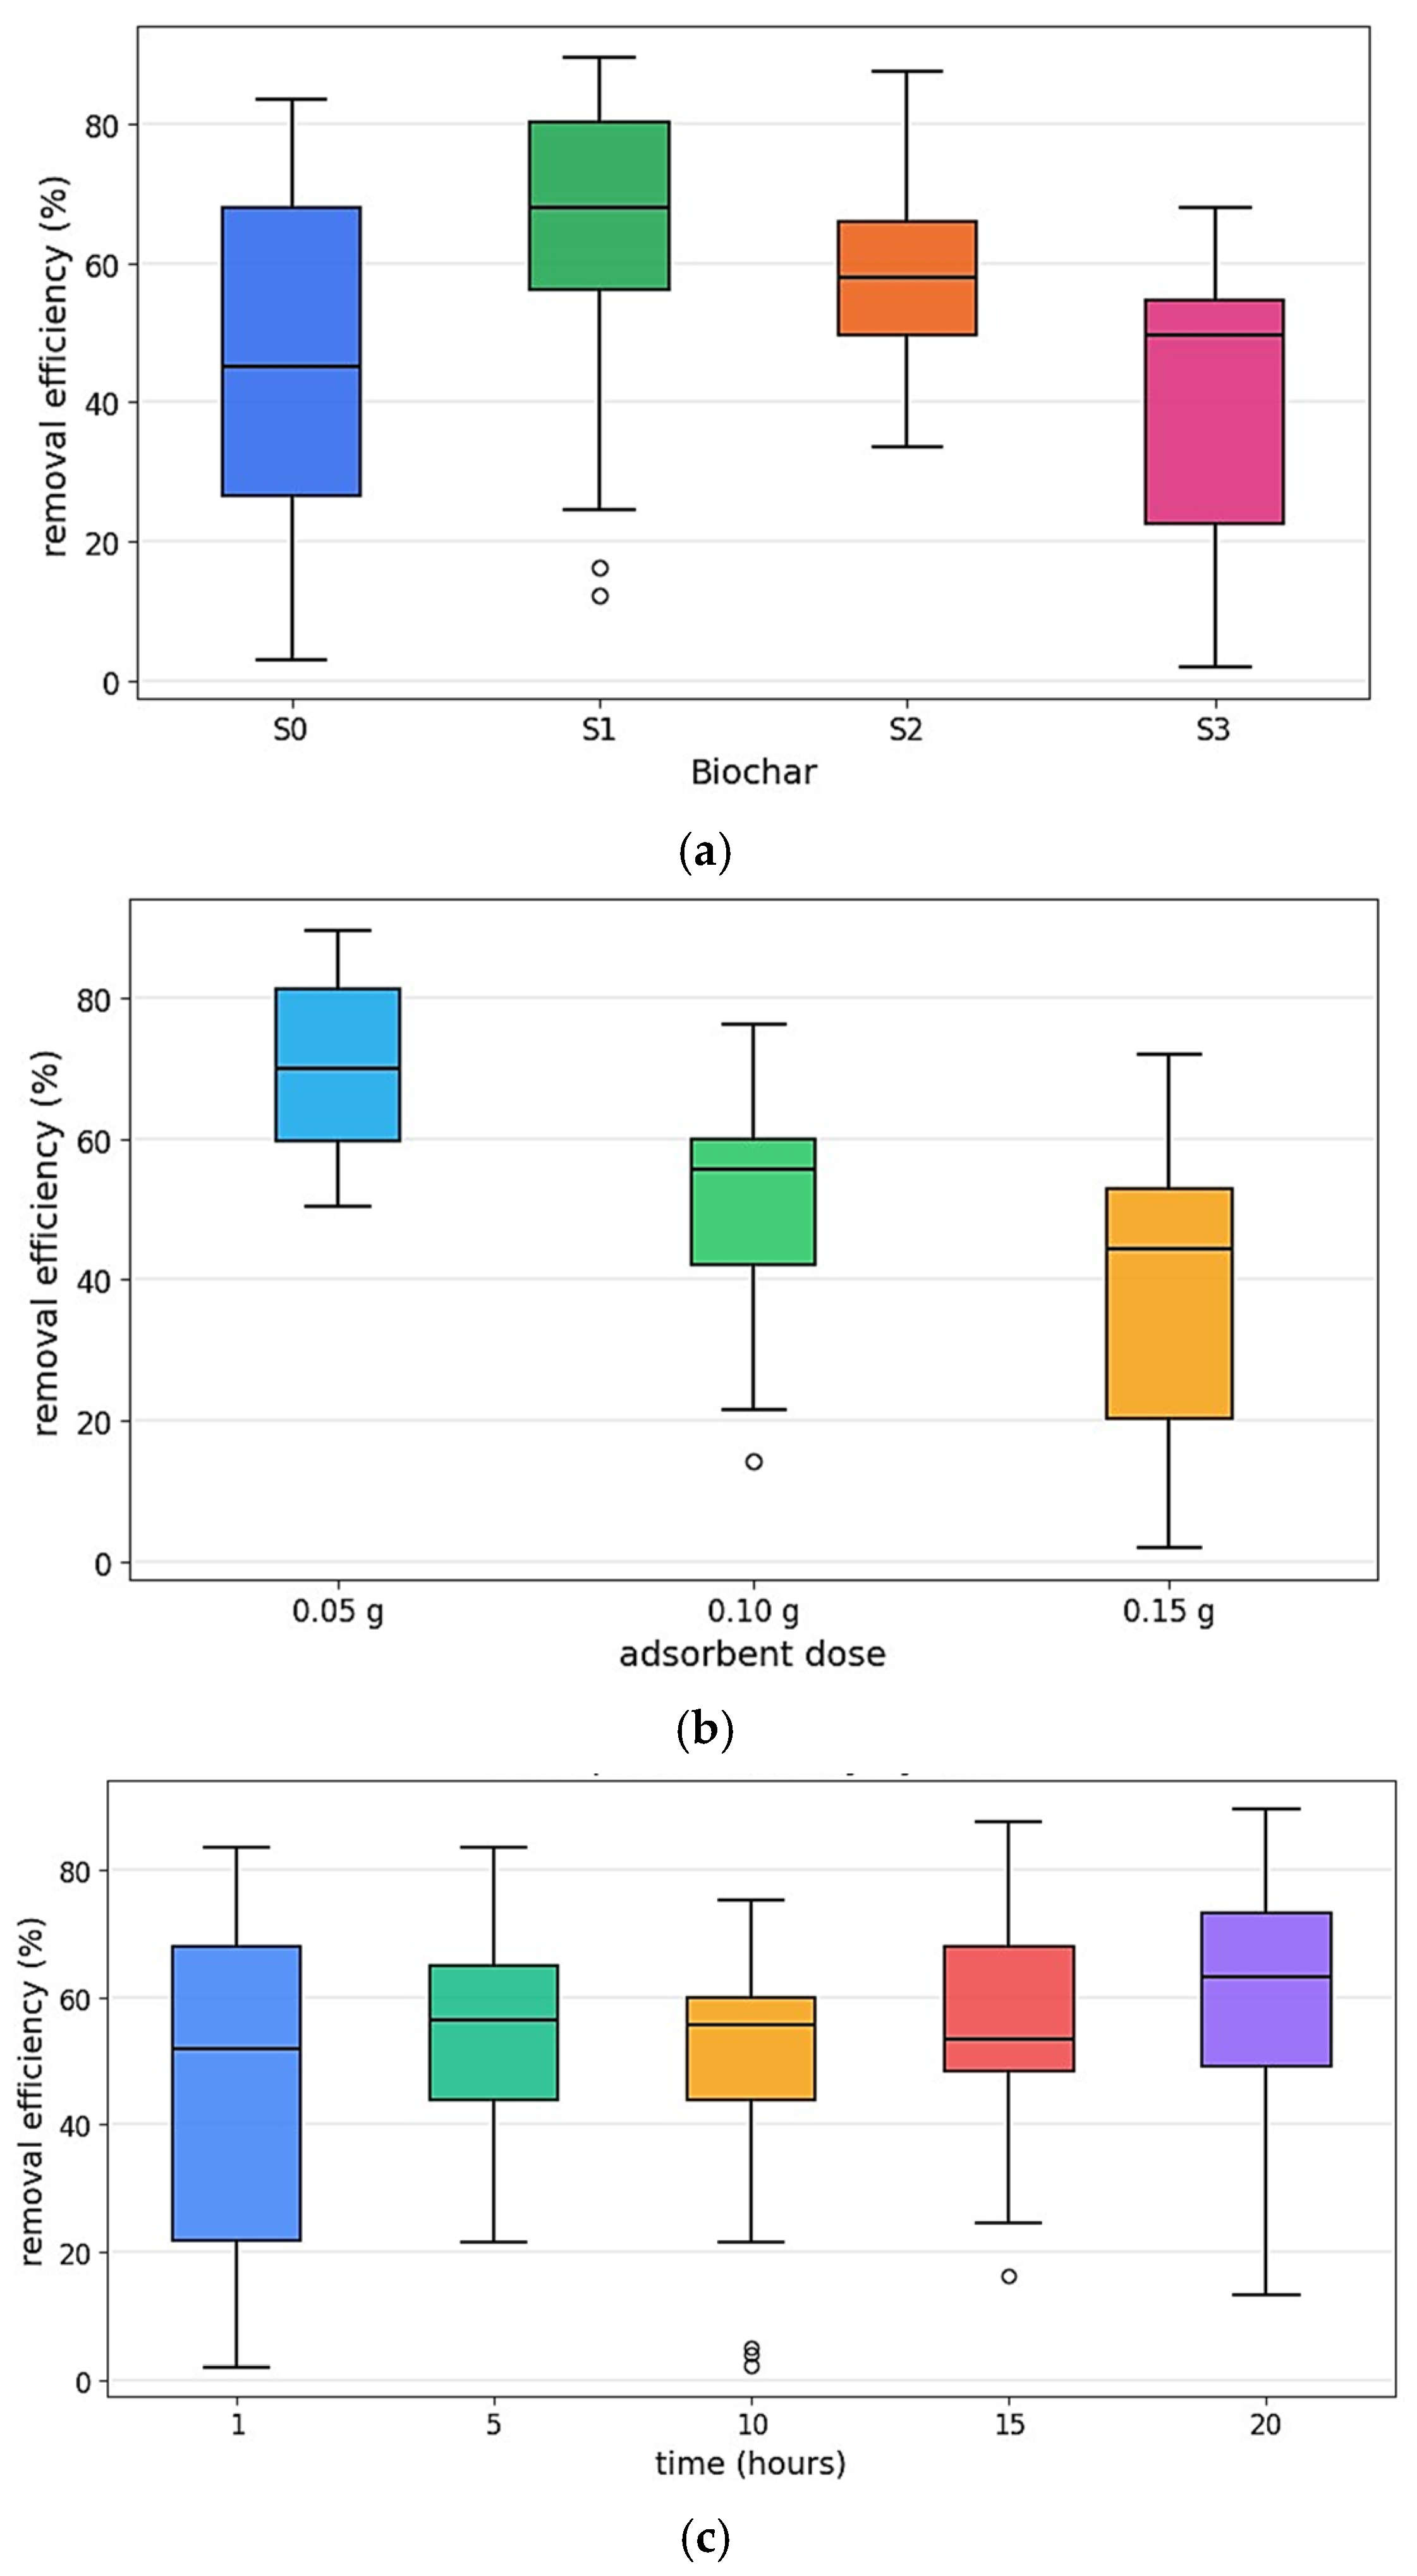
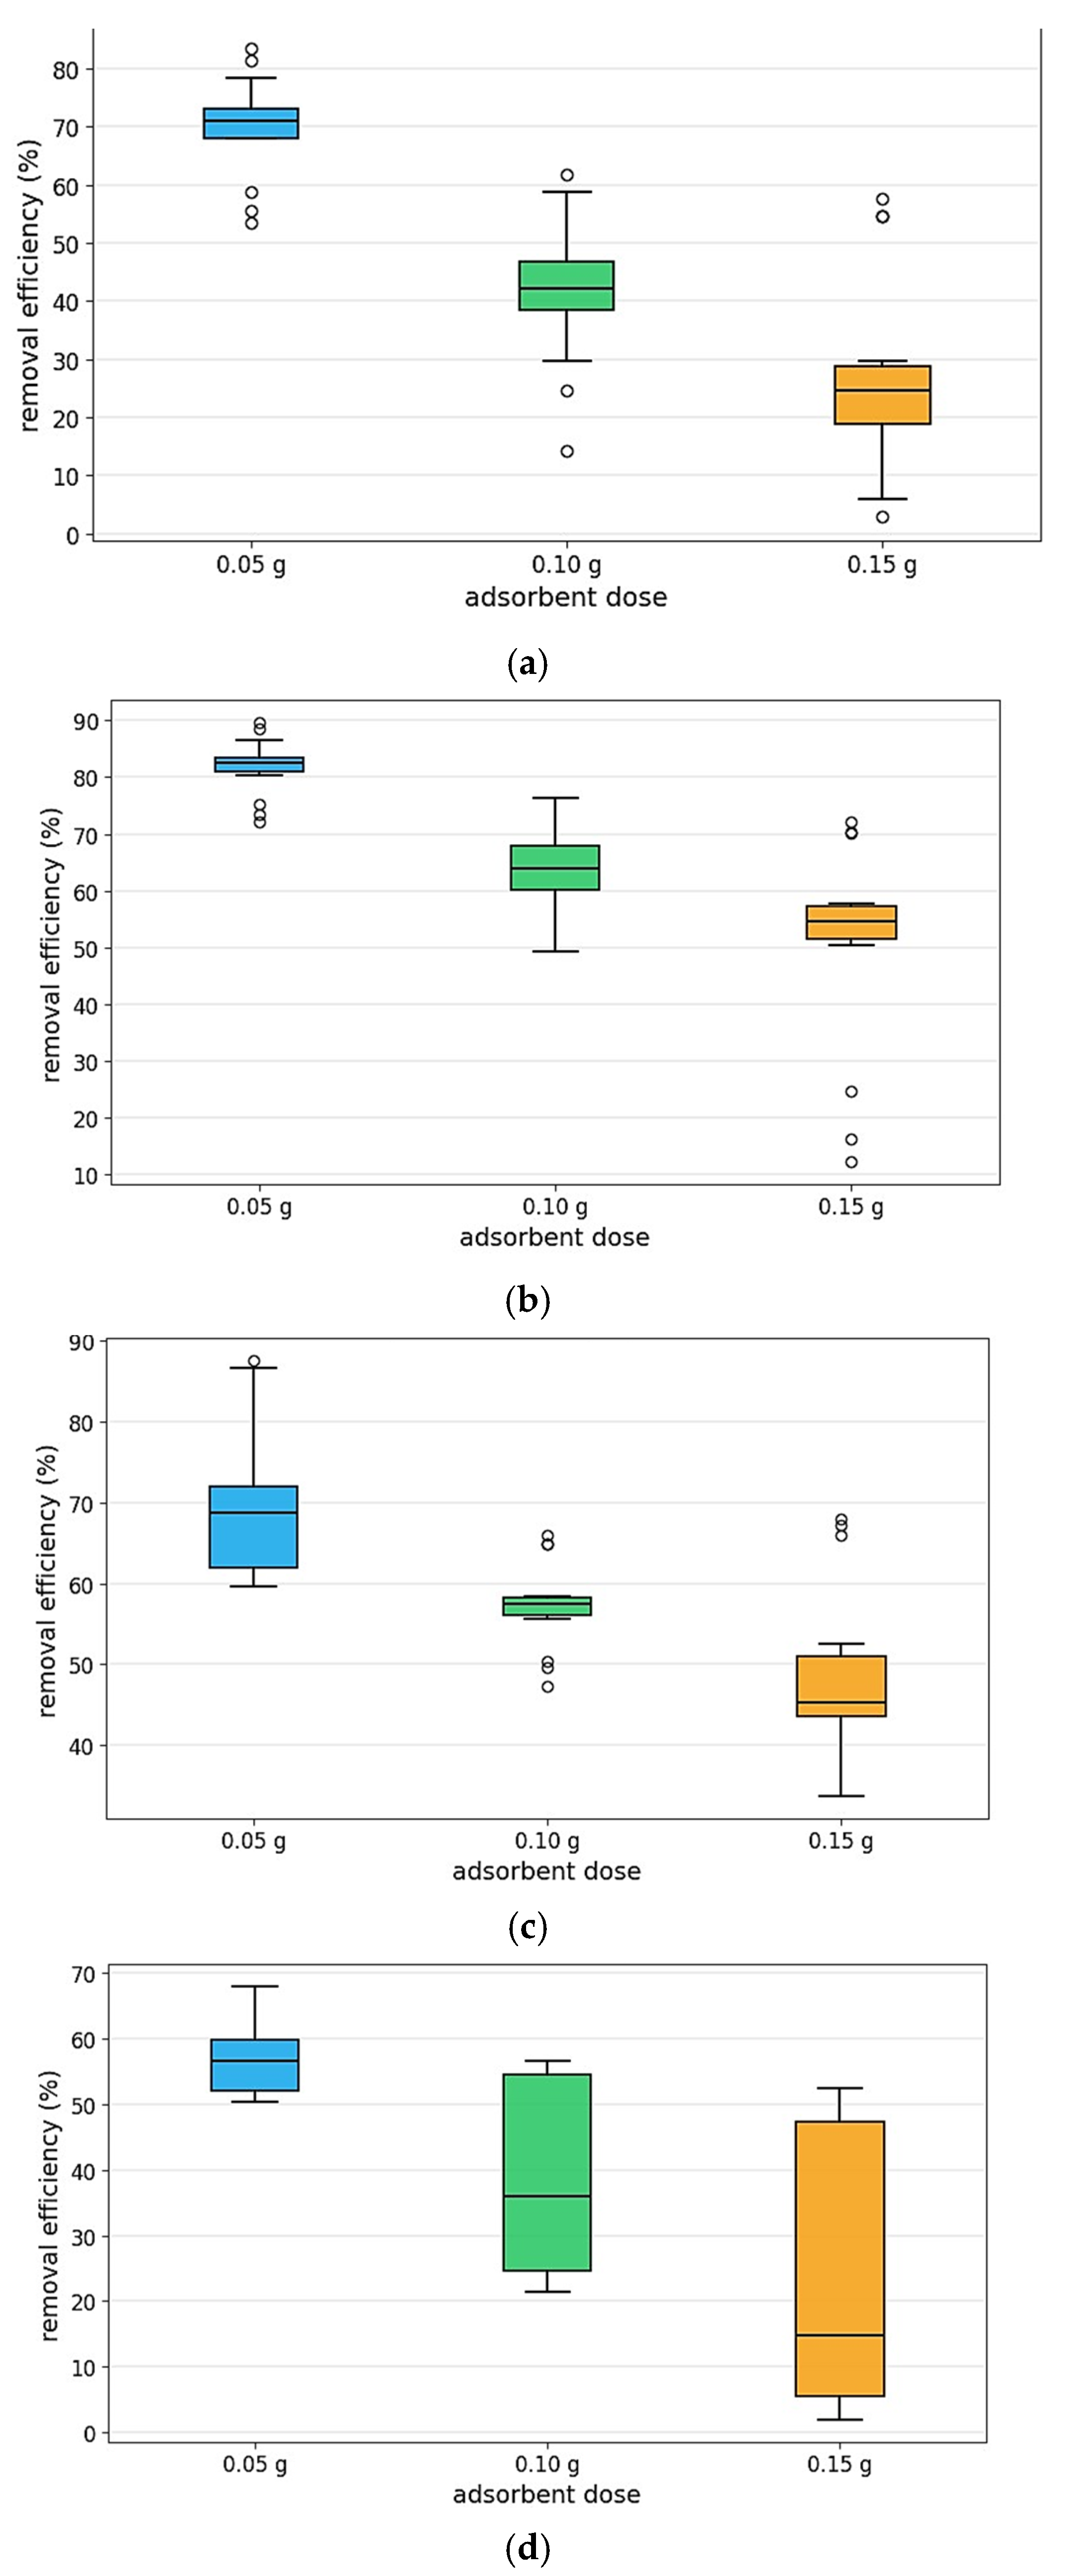
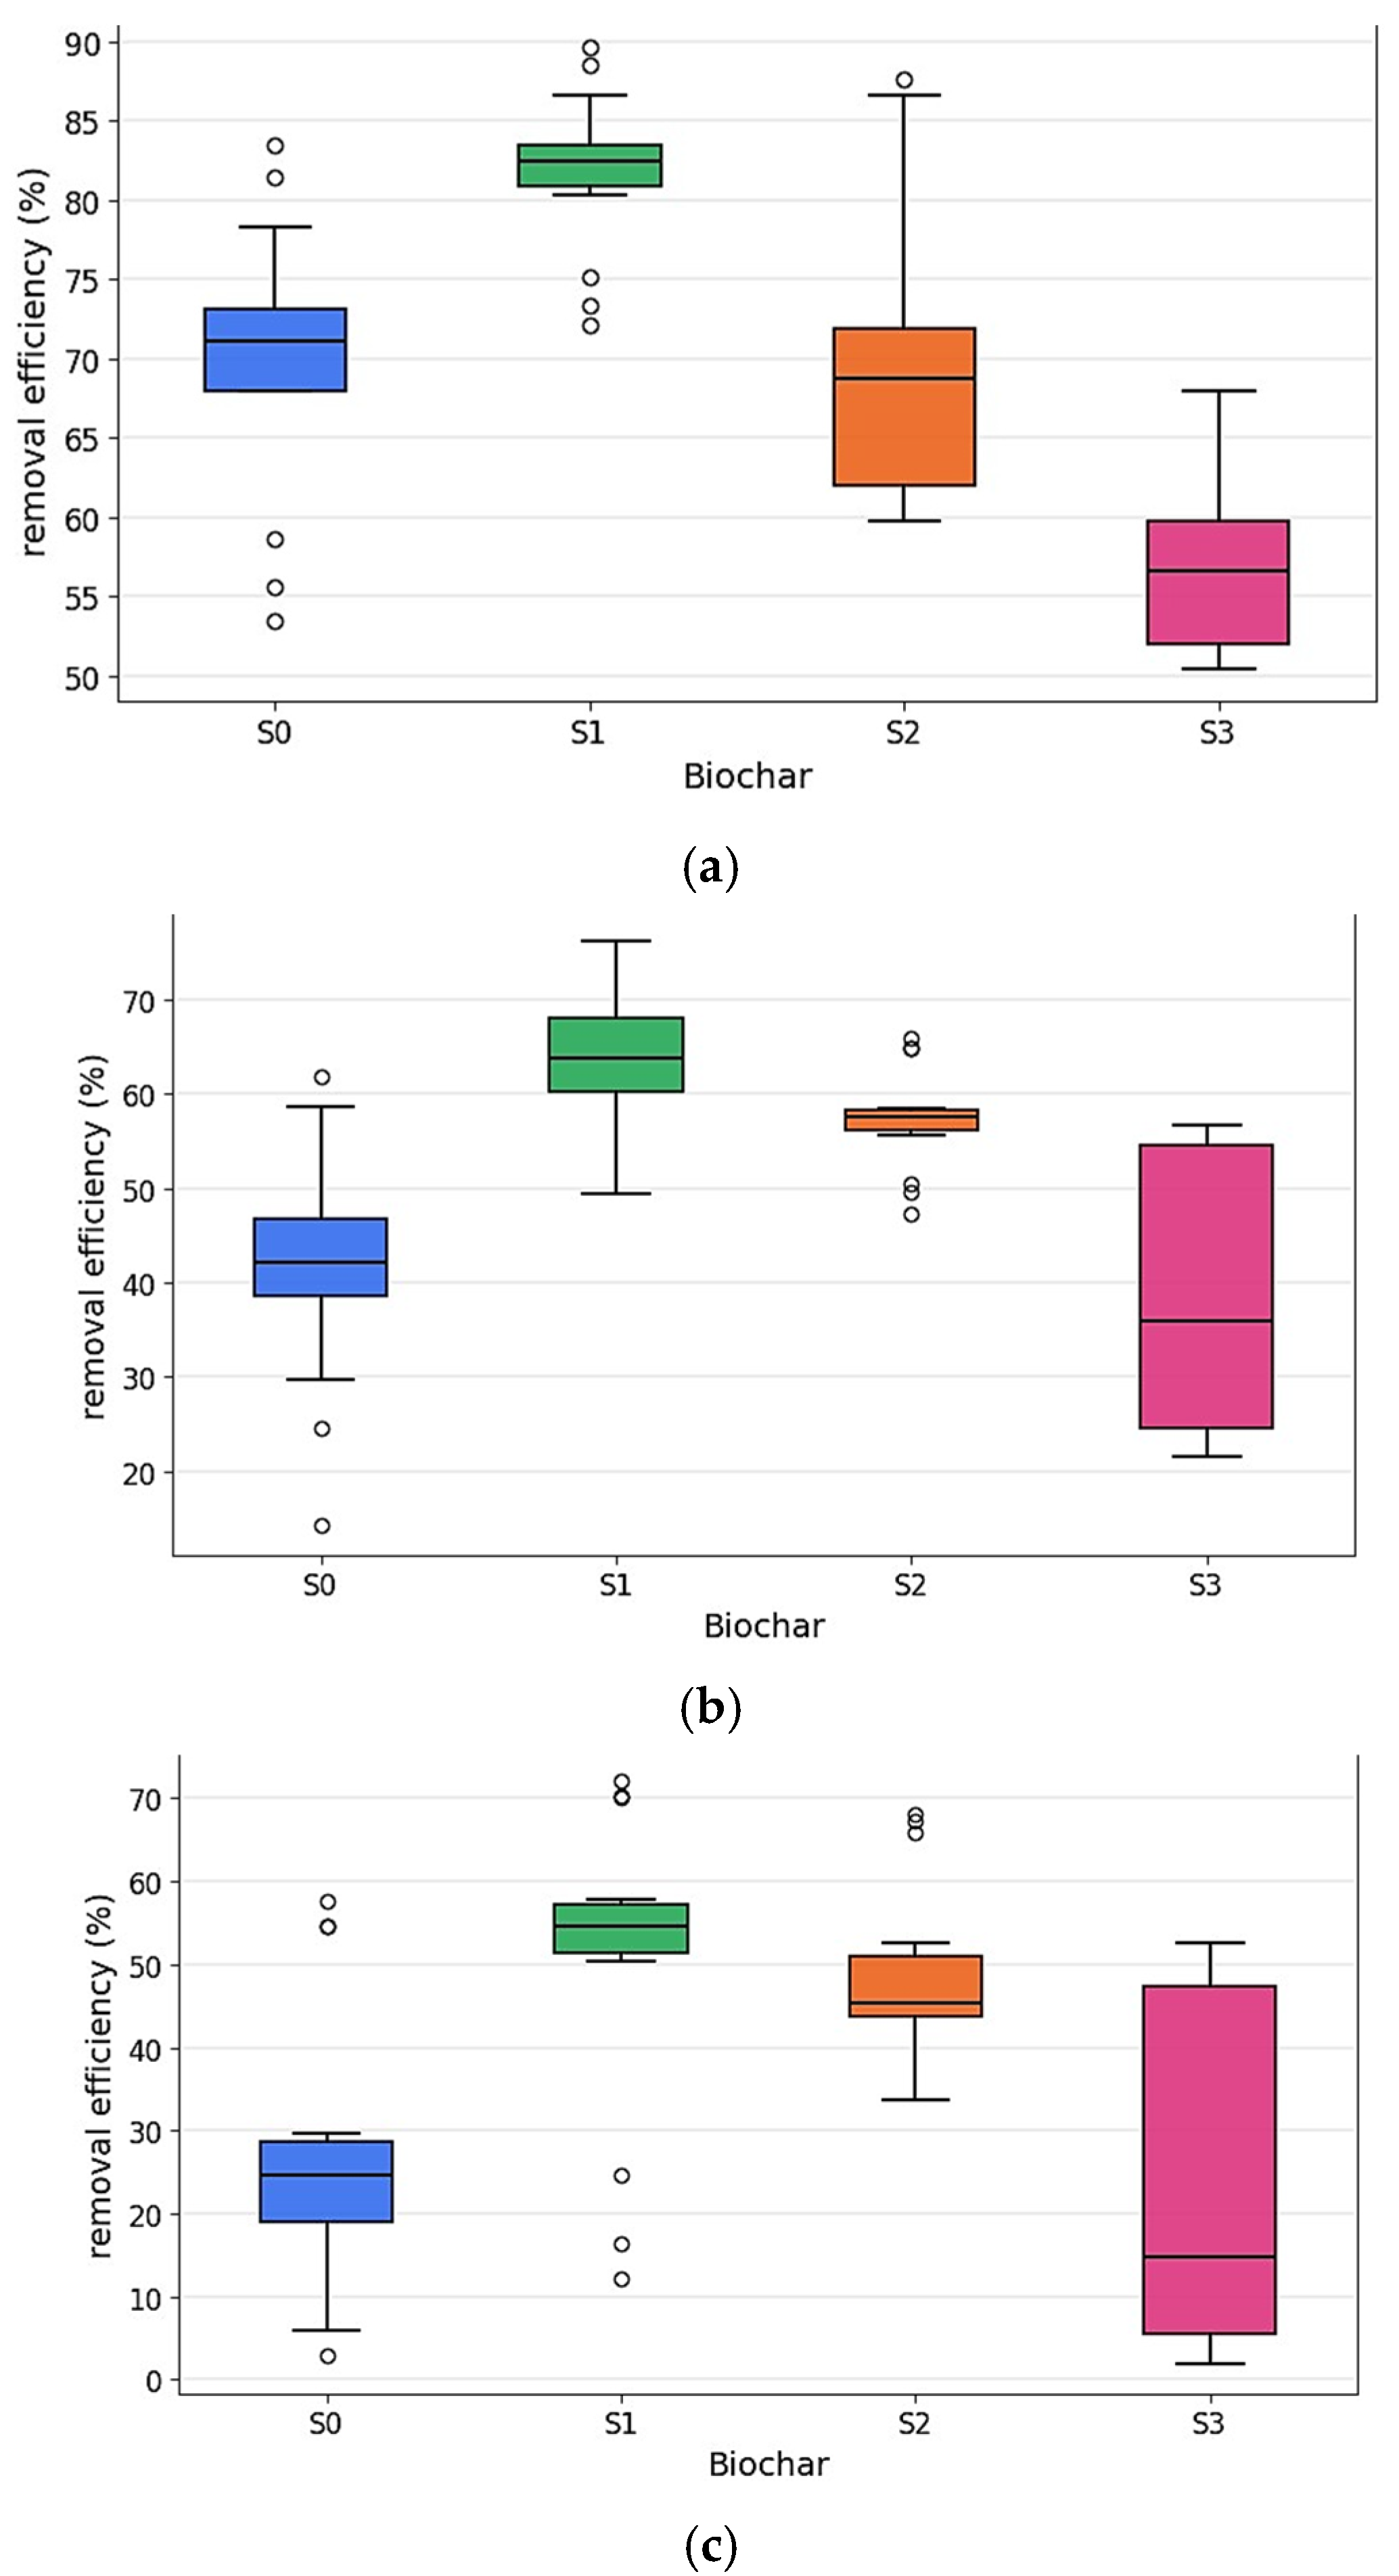
The adsorption efficiency of FS biochar towards methylene blue (MB), a cationic dye, is determined by both its surface chemistry, particularly the presence of functional groups, and its textural properties, such as BET surface area and pore volume. MB interacts with adsorbents through electrostatic attraction, hydrogen bonding, π–π stacking, and donor–acceptor mechanisms. The three FS biochar samples exhibited distinct adsorption behaviors and efficiencies, as seen in Figure 9, Figure 10, Figure 11, Figure 12 and Figure 13 due to differences in milling time and ball-to-powder ratio (BPR), which in turn affected their surface chemistry and physical structure. S1 was FS biochar-milled for 10 min at a BPR of 9.067 g/g, S2 was FS biochar-milled for 10 min at a BPR of 10.5 g/g, S3 was FS biochar-milled for 15 min at a BPR of 10.5 g/g, and S0 is unmilled FS biochar.
S1 demonstrated the highest adsorption efficiency across all adsorbent doses. This superior performance can be attributed to a balanced synergy between surface functionality and structural integrity. FTIR analysis revealed a high abundance of polar functional groups, especially hydroxyl (-OH), carbonyl (C=O), ether (C-O-C), and alcohol (C-OH), which were preserved due to the moderate mechanical energy input. These oxygen-containing groups are critical for strong electrostatic interactions and hydrogen bonding with MB molecules. While the BET surface area of S1 was moderate compared to the other samples, it was sufficient to expose an ample number of adsorption sites. Moreover, the preserved microporous structure provided good pore volume, facilitating effective dye diffusion and adsorption. Thus, S1 represents an optimal milling condition where both chemical reactivity and physical accessibility are maximized, allowing for efficient interaction with methylene blue through multiple mechanisms.
S2 exhibited a slightly lower adsorption efficiency despite having the highest BET surface area (~50 m2/g). Theoretically, this surface area would offer more adsorption sites; however, the increased mechanical force from the higher BPR likely led to partial degradation of surface functional groups, particularly hydroxyl and carbonyl groups. These polar groups are crucial for electrostatic and hydrogen bonding with MB, and their loss diminishes chemical adsorption potential. Additionally, while the higher surface area may have exposed more physical sites, the reduced pore volume due to partial pore collapse and particle agglomeration limited the accessibility of internal adsorption sites. S2 showed some enhancement in aromatic C=C domains, which could contribute to π–π stacking with MB, but these interactions were not sufficient to compensate for the reduction in electrostatically active sites. Consequently, despite its high surface area, S2 underperformed relative to S1 because of reduced chemical functionality and compromised pore structure.
S3 showed the lowest adsorption performance of all three samples. Prolonged milling induced over-processing effects, resulting in substantial degradation of key functional groups, including hydroxyl, carbonyl, ether, and alcohol groups. This diminished the sample’s capacity to form hydrogen bonds and electrostatic interactions with methylene blue. Interestingly, S3 exhibited a relatively high BET pore volume, which indicates that longer milling time may have exposed some new pores. However, this came at the cost of functional group density and overall structural integrity, as evidenced by pore collapse and particle agglomeration. The increase in aromatic character might have favored some π–π interactions, yet the overall loss of surface polarity and reduction in accessible micropores significantly limited adsorption capacity.
Milling improved methylene blue removal compared with the unmilled FS biochar (S0), with the benefit peaking at moderate milling intensity. The 10 min, lower-BPR condition (S1; BPR ≈ 9.07 g g−1) showed the highest central tendency and upper range of efficiencies, indicating the most effective activation of sorption sites. Increasing the BPR at the same milling time (S2; 10 min, BPR ≈ 10.5 g g−1) produced slightly lower but more consistent removals, suggesting diminishing returns at higher impact energy, while extending milling to 15 min at the higher BPR (S3; BPR ≈ 10.5 g g−1) further reduced the median and increased spread, which is consistent with over-milling (e.g., pore collapse, agglomeration, and loss of functional groups). These trends were quantified using a one-way ANOVA on removal efficiency across all doses, times, and replicates, which indicated a significant treatment effect, F(3176) = 17.84, p = 3.7 × 10⁻¹⁰; normality and variance assumptions were evaluated with Shapiro–Wilk and Levene tests (the latter significant), and pairwise differences were assessed with Tukey’s HSD (S1 > S0, S1 > S2, S1 > S3; S2, S3 > S0). Taken together, the data indicate an optimum around 10 min at BPR ≈ 9.07 g g−1, beyond which additional energy input does not translate into higher dye removal and may degrade performance; Welch’s ANOVA provides a robustness check when given unequal variance. Adsorption trends were consistent with the BET and SEM. The highest removals at 10 min, BPR ≈ 9.07 g g−1 (S1), coincide with the BET peak at 10 min and the SEM images showing fine, uniform particles with limited agglomeration conditions that maximize accessible surface and pore connectivity. By contrast, raising BPR to 10.5 g g−1 (S2) or extending the time to 15 min at 10.5 g g−1 (S3) aligns with SEM-visible agglomeration/welding and the decline in BET surface area, reducing accessible porosity and functional site exposure. Thus, the structure property link (BET/SEM accessibility) explains why S1 outperforms S2/S3 and defines an operational optimum around 10 min at moderate BPR.

5. Conclusions

Optimizing milling is key to improving FS biochar adsorption. Across S0–S3, performance differed significantly (one-way ANOVA, F (3176) =17.84, p ≪ 0.001), with the best removal at 10 min, BPR ≈ 9.07 g g−1 (S1). This indicates that surface chemistry and accessibility of polar oxygenated groups drive uptake more than BET area alone: S1 preserved functionality with an open, stable pore network; S2’s higher area did not compensate for diminished polar groups; and over-milling (S3; longer time at high BPR) degraded functionality/structure and reduced efficiency. In practice, target moderate milling to balance surface chemistry and texture; further energy input offers no gain and can harm performance. This principle should guide the engineering of FS biochar for dye removal and broader remediation applications, with surface functionality and pore accessibility optimized in tandem. This study establishes a clear structural property link between mechanochemical milling conditions (time and BPR) and adsorption performance, grounded in complementary physical characterization and statistical analysis. Unlike prior work that treats surface area alone or varies a single factor, we integrate morphology, porosity, and performance to define an evidence-based operating window for milling.

6. Recommendations

For future work, we recommend systematically varying temperature and pH in a factorial design to map their interactive effects on uptake, kinetics, and regeneration. These tests should be extended to real wastewater matrices (textile effluent, municipal secondary effluent, and high-salinity streams) to capture competition from co-ions and turbidity, with parallel spike-recovery controls for comparability to synthetic solutions. Complementary measurements (zeta potential vs. pH, Boehm titration/FTIR for surface chemistry, and reusability over ≥5 adsorption–desorption cycles) will clarify mechanisms and operational robustness under realistic conditions.

Author Contributions

E.B.: Conceptualization, methodology, formal analysis, investigation, and writing—original draft. A.J.K.: Supervision, conceptualization, writing—review and editing, and funding acquisition. S.S.K.: Review and editing. T.S.: Review and editing. R.D.L.: Review and editing. All authors have read and agreed to the published version of the manuscript.

Funding

This work is funded by the Austrian Partnership Programme in Higher Education and Research for Development (APPEAR), a Programme of the Austrian Development Corporation (ADC) and implemented by Austria’s Agency for Education and Internationalisation (OeAD)-GmbH. The study is part of the Project “Clean and Prosperous Uganda-Faecal Sludge and Solid Waste Management for Improved Livelihoods (CPUg) (project #256, 2022).

Data Availability Statement

The datasets generated and analyzed during the current study are available from the corresponding author upon reasonable request.

Conflicts of Interest

The authors declare no conflicts interest.

References

  1. Khaydarov, R.; Khaydarov, R.; Gapurova, O. (Eds.) Application of carbon nanoparticles for water treatment. In Proceedings of the Water Treatment Technologies for the Removal of High-Toxicity Pollutants, Košice, Slovakia, 13–17 September 2008; Springer: Berlin/Heidelberg, Germany, 2010; pp. 253–258. [Google Scholar]
  2. Nasrollahzadeh, M.; Sajadi, S.M.; Sajjadi, M.; Issaabadi, Z. Applications of nanotechnology in daily life. Interface Sci. Technol. 2019, 28, 113–143. [Google Scholar]
  3. Rashidi, L.; Khosravi-Darani, K. The applications of nanotechnology in food industry. Crit. Rev. Food Sci. Nutr. 2011, 51, 723–730. [Google Scholar] [CrossRef] [PubMed]
  4. Surendiran, A.; Sandhiya, S.; Pradhan, S.; Adithan, C. Novel applications of nanotechnology in medicine. Indian J. Med. Res. 2009, 130, 689–701. [Google Scholar]
  5. Song, Q.; Kong, F.; Liu, B.-F.; Song, X.; Ren, H.-Y. Biochar-based composites for removing chlorinated organic pollutants: Applications, mechanisms, and perspectives. Environ. Sci. Ecotechnol. 2024, 21, 100420. [Google Scholar] [CrossRef]
  6. Liang, L.; Xi, F.; Tan, W.; Meng, X.; Hu, B.; Wang, X. Review of organic and inorganic pollutants removal by biochar and biochar-based composites. Biochar 2021, 3, 255–281. [Google Scholar] [CrossRef]
  7. Oleszczuk, P.; Ćwikła-Bundyra, W.; Bogusz, A.; Skwarek, E.; Ok, Y.S. Characterization of nanoparticles of biochars from different biomass. J. Anal. Appl. Pyrolysis 2016, 121, 165–172. [Google Scholar] [CrossRef]
  8. Wang, W.; Martin, J.C.; Fan, X.; Han, A.; Luo, Z.; Sun, L. Silica nanoparticles and frameworks from rice husk biomass. ACS Appl. Mater. Interfaces 2012, 4, 977–981. [Google Scholar] [CrossRef]
  9. Jacob, R.H.; Shanab, S.M.; Shalaby, E.A. Algal biomass nanoparticles: Chemical characteristics, biological actions, and applications. Biomass Convers. Biorefin. 2021, 13, 11441–11455. [Google Scholar]
  10. Naghdi, M.; Taheran, M.; Brar, S.K.; Rouissi, T.; Verma, M.; Surampalli, R.Y.; Valero, J.R. A green method for production of nanobiochar by ball milling-optimization and characterization. J. Clean. Prod. 2017, 164, 1394–1405. [Google Scholar] [CrossRef]
  11. Soares, O.; Rocha, R.; Gonçalves, A.; Figueiredo, J.; Órfão, J.; Pereira, M. Easy method to prepare N-doped carbon nanotubes by ball milling. Carbon 2015, 91, 114–121. [Google Scholar] [CrossRef]
  12. Fecht, H.; Hellstern, E.; Fu, Z.; Johnson, W. Nanocrystalline metals prepared by high-energy ball milling. Metall. Trans. A 1990, 21, 2333–2337. [Google Scholar] [CrossRef]
  13. Salah, N.; Habib, S.S.; Khan, Z.H.; Memic, A.; Azam, A.; Alarfaj, E.; Zahed, N.; Al-Hamedi, S. High-energy ball milling technique for ZnO nanoparticles as antibacterial material. Int. J. Nanomed. 2011, 6, 863–869. [Google Scholar] [CrossRef]
  14. Stolle, A.; Szuppa, T.; Leonhardt, S.E.; Ondruschka, B. Ball milling in organic synthesis: Solutions and challenges. Chem. Soc. Rev. 2011, 40, 2317–2329. [Google Scholar] [CrossRef]
  15. Bullen, H.A.; Garrett, S.J. TiO2 nanoparticle arrays prepared using a nanosphere lithography technique. Nano Lett. 2002, 2, 739–745. [Google Scholar] [CrossRef]
  16. Kim, M.; Osone, S.; Kim, T.; Higashi, H.; Seto, T. Synthesis of nanoparticles by laser ablation: A review. KONA Powder Part. J. 2017, 34, 80–90. [Google Scholar] [CrossRef]
  17. Semaltianos, N. Nanoparticles by laser ablation. Crit. Rev. Solid State Mater. Sci. 2010, 35, 105–124. [Google Scholar] [CrossRef]
  18. Romano, L.; Kagias, M.; Vila-Comamala, J.; Jefimovs, K.; Tseng, L.-T.; Guzenko, V.A.; Stampanoni, M. Metal assisted chemical etching of silicon in the gas phase: A nanofabrication platform for X-ray optics. Nanoscale Horiz. 2020, 5, 869–879. [Google Scholar] [CrossRef] [PubMed]
  19. Salavati-Niasari, M.; Javidi, J.; Dadkhah, M. Ball milling synthesis of silica nanoparticle from rice husk ash for drug delivery application. Comb. Chem. High Throughput Screen. 2013, 16, 458–462. [Google Scholar] [CrossRef] [PubMed]
  20. Sharma, N.; Lolkema, B.; Mawioo, P.; Hooijmans, C.M.; Dupont, C. Systematic characterization of faecal sludge from various sources for its use as a solid fuel. Biomass Convers. Biorefin. 2023, 15, 2779–2789. [Google Scholar] [CrossRef]
  21. Muspratt, A.M.; Nakato, T.; Niwagaba, C.; Dione, H.; Kang, J.; Stupin, L.; Regulinski, J.; Mbéguéré, M.; Strande, L. Fuel potential of faecal sludge: Calorific value results from Uganda, Ghana and Senegal. J. Water Sanit. Hyg. Dev. 2014, 4, 223–230. [Google Scholar] [CrossRef]
  22. Chandana, N.; Rao, B. Evaluating the physicochemical, nutrient, and pathogenic characteristics of fecal sludge for fertilizer application: Case from vadgaon maval, Maharashtra, India. J. Environ. Eng. 2021, 147, 04021003. [Google Scholar] [CrossRef]
  23. Xu, X.; Xu, Z.; Huang, J.; Gao, B.; Zhao, L.; Qiu, H.; Cao, X. Sorption of reactive red by biochars ball milled in different atmospheres: Co-effect of surface morphology and functional groups. Chem. Eng. J. 2021, 413, 127468. [Google Scholar] [CrossRef]
  24. Mi, L.; Liu, Y.; Huang, Q.; Zhao, L.; Qin, X.; Sun, Y.; Li, B. Enhanced adsorption and regulation mechanism of ball milling-modified biochar on Cd and atrazine in soil. Environ. Sci. Pollut. Res. 2025, 32, 5091–5105. [Google Scholar] [CrossRef]
  25. Kim, D.-Y.; Jung, G.-B. Effects of pyrolysis and ball-milling on the physicochemical and rhodamine b removal characteristics of rice-bran-derived biochar. Appl. Sci. 2023, 13, 4288. [Google Scholar] [CrossRef]
  26. Lopez-Tenllado, F.J.; Motta, I.L.; Hill, J.M. Modification of biochar with high-energy ball milling: Development of porosity and surface acid functional groups. Bioresour. Technol. Rep. 2021, 15, 100704. [Google Scholar] [CrossRef]
  27. Lyu, H.; Gao, B.; He, F.; Zimmerman, A.R.; Ding, C.; Huang, H.; Tang, J. Effects of ball milling on the physicochemical and sorptive properties of biochar: Experimental observations and governing mechanisms. Environ. Pollut. 2018, 233, 54–63. [Google Scholar] [CrossRef]
  28. Dissanayake, P.D.; You, S.; Igalavithana, A.D.; Xia, Y.; Bhatnagar, A.; Gupta, S.; Kua, H.W.; Kim, S.; Kwon, J.-H.; Tsang, D.C. Biochar-based adsorbents for carbon dioxide capture: A critical review. Renew. Sustain. Energy Rev. 2020, 119, 109582. [Google Scholar] [CrossRef]
  29. Guo, S.; Li, Y.; Wang, Y.; Wang, L.; Sun, Y.; Liu, L. Recent advances in biochar-based adsorbents for CO2 capture. Carbon Capture Sci. Technol. 2022, 4, 100059. [Google Scholar] [CrossRef]
  30. Ajala, O.A.; Akinnawo, S.O.; Bamisaye, A.; Adedipe, D.T.; Adesina, M.O.; Okon-Akan, O.A.; Adebusuyi, T.A.; Ojedokun, A.T.; Adegoke, K.A.; Bello, O.S. Adsorptive removal of antibiotic pollutants from wastewater using biomass/biochar-based adsorbents. RSC Adv. 2023, 13, 4678–4712. [Google Scholar] [CrossRef] [PubMed]
  31. Brassard, P.; Godbout, S.; Lévesque, V.; Palacios, J.H.; Raghavan, V.; Ahmed, A.; Hogue, R.; Jeanne, T.; Verma, M. Biochar for soil amendment. In Char and Carbon Materials Derived from Biomass; Elsevier: Amsterdam, The Netherlands, 2019; pp. 109–146. [Google Scholar]
  32. Adhikari, S.; Timms, W.; Mahmud, M.P. Optimising water holding capacity and hydrophobicity of biochar for soil amendment–A review. Sci. Total Environ. 2022, 851, 158043. [Google Scholar] [CrossRef] [PubMed]
  33. Anto, S.; Sudhakar, M.; Ahamed, T.S.; Samuel, M.S.; Mathimani, T.; Brindhadevi, K.; Pugazhendhi, A. Activation strategies for biochar to use as an efficient catalyst in various applications. Fuel 2021, 285, 119205. [Google Scholar] [CrossRef]
  34. Harindintwali, J.D.; He, C.; Xiang, L.; Dou, Q.; Liu, Y.; Wang, M.; Wen, X.; Fu, Y.; Islam, M.U.; Chang, S.X. Effects of ball milling on biochar adsorption of contaminants in water: A meta-analysis. Sci. Total Environ. 2023, 882, 163643. [Google Scholar] [CrossRef]
  35. Yuan, Y.; Zhang, N.; Hu, X. Effects of wet and dry ball milling on the physicochemical properties of sawdust derived-biochar. Instrum. Sci. Technol. 2020, 48, 287–300. [Google Scholar] [CrossRef]
  36. Tan, X.-F.; Zhu, S.-S.; Wang, R.-P.; Chen, Y.-D.; Show, P.-L.; Zhang, F.-F.; Ho, S.-H. Role of biochar surface characteristics in the adsorption of aromatic compounds: Pore structure and functional groups. Chin. Chem. Lett. 2021, 32, 2939–2946. [Google Scholar] [CrossRef]
  37. Liu, X.; Yin, H.; Liu, H.; Cai, Y.; Qi, X.; Dang, Z. Multicomponent adsorption of heavy metals onto biogenic hydroxyapatite: Surface functional groups and inorganic mineral facilitating stable adsorption of Pb (II). J. Hazard. Mater. 2023, 443, 130167. [Google Scholar] [CrossRef]
  38. Mardis, K.L.; Brune, B.J.; Vishwanath, P.; Giorgis, B.; Payne, G.F.; Gilson, M.K. Intramolecular versus intermolecular hydrogen bonding in the adsorption of aromatic alcohols onto an acrylic ester sorbent. J. Phys. Chem. B 2000, 104, 4735–4744. [Google Scholar] [CrossRef]
  39. Ahmed, M.B.; Zhou, J.L.; Ngo, H.H.; Johir, M.A.H.; Sun, L.; Asadullah, M.; Belhaj, D. Sorption of hydrophobic organic contaminants on functionalized biochar: Protagonist role of π-π electron-donor-acceptor interactions and hydrogen bonds. J. Hazard. Mater. 2018, 360, 270–278. [Google Scholar] [CrossRef]
  40. Abbas, F.M.; Al Ahmad, Z.A.; Elgezouly, R.O.E.; Abdelrahman, A.E. Characterization of Pores Size, Surface area and Fractal Di-mensions of Activated Carbon Powder Prepared from Date Palm Leaves. Mol. Biol. 2022, 11, 94544. [Google Scholar]
  41. Peterson, S.C.; Jackson, M.A.; Kim, S.; Palmquist, D.E. Increasing biochar surface area: Optimization of ball milling parameters. Powder Technol. 2012, 228, 115–120. [Google Scholar] [CrossRef]
Figure 1. Sequence of surface area, pore volume, and pore size analysis steps.
Biomass 05 00074 g001
Figure 2. Effect of milling time and BPR on carbon and nitrogen.
Biomass 05 00074 g002
Figure 3. Effect of milling time for (a) 5 min, (b) 10 min, (c) 15 min, and ball-to-powder ratio at (d) 4.533 g/g, (e) 9.067 g/g and, and (f) 10.5 g/g on particle size distributions.
Biomass 05 00074 g003
Figure 4. SEM images after 5 min of milling at different BPR: (a) 4.533 g/g, (b) 9.067 g/g, and (c) 10.5 g/g.
Biomass 05 00074 g004
Figure 5. SEM images after 10 min of milling at different BPR: (a) 4.533 g/g, (b) 9.067 g/g, and (c) 10.5 g/g.
Biomass 05 00074 g005
Figure 6. SEM images after 15 min of milling at different BPR: (a) 4.533 g/g, (b) 9.067 g/g, and (c) 10.5 g/g.
Biomass 05 00074 g006
Figure 7. Effect of BPR (a) and milling time (b) on BET surface area.
Biomass 05 00074 g007
Figure 8. How BET pore volume varies with (a) BPR and (b) milling time.
Biomass 05 00074 g008
Figure 9. Adsorption performance of FS biochar samples by adsorbent doses (a) 0.05, (b) 0.10, and (c) 0.15.
Biomass 05 00074 g009
Figure 10. Adsorption performance of different FS biochar sample adsorbent doses (a) S0, (b) S1, (c) S2, and (d) S3.
Biomass 05 00074 g010
Figure 11. Box plots showing adsorption efficiency distribution (a) by FS biochar type, (b) by adsorbent dose, and (c) by adsorbent time.
Biomass 05 00074 g011
Figure 12. Box plots of adsorption efficiency by FS biochar (a) S0, (b) S1, (c) S2, and (d) S3.
Biomass 05 00074 g012
Figure 13. Box plots showing removal efficiency distribution by adsorbent dose (a) 0.05 g, (b) 0.10 g, and (c) 0.15 g.
Biomass 05 00074 g013
Disclaimer/Publisher’s Note: The statements, opinions and data contained in all publications are solely those of the individual author(s) and contributor(s) and not of MDPI and/or the editor(s). MDPI and/or the editor(s) disclaim responsibility for any injury to people or property resulting from any ideas, methods, instructions or products referred to in the content.