Article

Fed-Batch Cultivation of Microalgae Using Effluent from the Anaerobic Digestion of Cattle Waste and Cultivation Scale-Up in 100 L Raceways

by
Francisco Gerhardt Magro
1,
Alan Rempel
2,
Christian Oliveira Reinehr
2 and
Luciane Maria Colla
1,*
1
Graduation Program in Civil and Environmental Engineering, University of Passo Fundo-UPF, BR 285 km 171, Passo Fundo CEP 99052-900, RS, Brazil
2
Chemical Engineering Course, University of Passo Fundo-UPF, BR 285 km 171, Passo Fundo CEP 99052-900, RS, Brazil
*
Author to whom correspondence should be addressed.
Biomass 2025, 5(4), 66; https://doi.org/10.3390/biomass5040066
Submission received: 15 August 2025 / Revised: 25 September 2025 / Accepted: 16 October 2025 / Published: 21 October 2025

Abstract

The search for sustainable development has led several production processes to adopt biorefineries. We evaluated the cultivation of Spirulina platensis and Scenedesmus obliquus in consortium (50/50%), with the addition of effluent of the anaerobic digestion (AD) of cattle waste, in fed-batch mode, to obtain biomass in 10 L raceways. Subsequently, cultivation was carried out at pilot scale in a 100 L raceway. Zarrouk medium (20%) was used, with the addition of 10% (v/v) of effluent in the fed-batch process. The biomasses were characterized to evaluate their application. In 10 L raceways, higher biomass concentrations were obtained in the cultivation of Spirulina with the addition of effluent, or with the microalgae consortia without the addition of effluent (around 1 g/L). The addition of the effluent reduced the carbohydrate content and increased the protein content during the cultivation. Scale-up (100 L raceways) with Spirulina showed similar results to those obtained in the 10 L raceways, with removals of 48%, 88% and 11% for COD, nitrogen and total phosphorus, respectively. The cultivation of microalgae in consortium and Spirulina can be used in the post-treatment of effluent of AD, allowing the production of biomass for different applications.

Graphical Abstract

1. Introduction

Microalgae are microorganisms that present photosynthetic metabolism and the possibility of directing cultures to obtain biomass with specific compositions, allowing their use in the production of various products, including biofuels [1,2], biofertilizers [3] and other high-value products [4,5].
Given the versatile chemical composition of algal biomass, it serves as a feedstock for the development of biorefineries, in which high-value-added products can be obtained in association with lower-value compounds, thereby enabling the full exploitation of the biomass potential. In biorefineries, renewable raw materials are used in a production process that does not generate waste, or generates minimal waste at the end of the process, with these concepts aligning with the principles of the circular bioeconomy [6,7].
A major bottleneck in algal biomass production processes is the cost of nutrients. Accordingly, residual fractions from agro-industrial processes can be employed to reduce cultivation medium expenses. The use of agro-industrial effluents in the production process does not preclude the use of the resulting biomass for applications such as bioethanol or biofertilizer production, thereby mitigating the environmental impacts associated with their inclusion in the production system [8]. In this context, several studies have sought alternative culture media, including the use of effluent as a source of nutrients [9,10,11,12,13].
The use of effluents from various sources is reported in several studies aimed at the cultivation of microalgae [12,14,15,16,17], providing strategic advantages for microalgal cultivation. The possibility of accumulating reserve compounds through the addition of effluents, due to cellular stress, induces microalgae to accumulate reserve compounds such as carbohydrates or proteins, which are essential for the production of bioethanol or biofertilizers [18,19,20,21,22].
An example of effluents are those generated from anaerobic digestion (AD), which can generate valuable byproducts such as biogas, a renewable energy source [23], and digestate, which has potential as a biofertilizer for agriculture [24]. The digestate or effluent from AD can be used for microalgae cultivation, enabling its valorization and allowing the production of microalgae-based bio inputs for soil fertilization, foliar application, and seed treatments [3,25,26] in agriculture. The biomass can still be used for other purposes, such as the production of bioethanol [27].
The use of effluents for microalgae cultivation enables their valorization and contributes to the reduction in environmental impacts through the removal of phosphorus and nitrogen. Furthermore, cooperation can occur between microorganisms already present in the effluents and the microalgae, providing benefits such as increased biomass production and enhanced removal of the aforementioned compounds [28,29].
Another synergistic approach, which also brings benefits, can be achieved by cultivating microalgae in consortia using multiple species. Such consortia have been shown to increase nutrient removal efficiency in wastewater while generating microalgal biomass for co-product production [30,31,32,33].
Microbial consortia for effluent treatment have also been reported by other authors, with microalga-bacteria and microalga-fungi consortia being the most common. Examples of microalgae that can be used include Chlorella and Scenedesmus [34] or in studies from our research group, Spirulina and Scenedesmus. Therefore, our study addresses gaps in the use of microalgal consortia, given the limited research on these consortia.
The literature still lacks reports on the level of tolerance of microalgae to each constituent, due to variation in chemical profiles across different types of effluents [35]. Thus, a strategy that has been shown to be successful in preventing effluent toxicity is the fed-batch culture mode, in which the effluent is gradually added to the culture medium [16].
The use of microalgae grown with residual fractions of agro-industrial processes in the context of biorefineries has the potential to reduce cultivation costs and enable the generation of more than one value-added product, thus providing an environmentally sustainable and economically viable process. The available literature on the combination of nutrient removal and cultivation of microalgae without sterilization, disinfection, or chemical pre-treatment in external photobioreactors at pilot scale is limited, making this knowledge necessary for the economic commercialization of microalgae-based biofuels [36] or biofertilizers. The present study evaluated the cultivation of a microalgal consortium (Spirulina platensis and Scenedesmus obliquus) with the addition of effluents from anaerobic digestion of cattle waste in fed-batch mode, aiming to obtain biomass for the potential generation of value-added bioproducts. In addition, a pilot-scale trial was conducted.

2. Materials and Methods

2.1. Effluent Characterization

The residual fraction was the effluent obtained after the anaerobic digestion (AD) of cattle waste, which contained high concentrations of chemical oxygen demand (COD), nitrogen, and phosphorus. This type is considered one of the most polluting effluents [37]. The effluent was filtered through cotton and was characterized according to the parameters of Total Kjeldahl Nitrogen (TKN) (Volumetric Method 4500-Norg B), COD (Colorimetry 5220 D), and Total Phosphorus (Potassium Persulfate Method 4500-PF), as described by the American Public Health Association [38], and pH (potentiometric method 4500-H+ B) according to AOAC [39].
The physical and chemical characteristics of the effluent used in 10 L raceways were as follows: TKN, pH, COD, and Total Phosphorus values were 97.3 ± 0.98 mg·L−1, 7.2 ± 0.2 mg·L−1, 370.14 ± 21.5 mg·L−1, and 18.71 ± 1.11 mg·L−1, respectively.
The physical and chemical characteristics of the effluent used in 100 L raceways were as follows: TKN, pH, COD, and Total Phosphorus values were 372.23 ± 4.65 mg·L−1, 7.1 ± 0.2 mg·L−1, 3048.14 ± 108.9 mg·L−1, and 55.24 ± 1.53 mg·L−1, respectively.

2.2. Microalgae Cultivation

2.2.1. Cultivation in 10 L Raceways

The microalgae inoculum preparation and the cultivations were performed using Spirulina platensis (Sp) and Scenedesmus obliquus (Sc), obtained from the strain bank at the Biochemistry and Bioprocess Laboratory of the University of Passo Fundo (UPF). The Zarrouk medium, diluted to 20% under sterile conditions, was used. The composition of the Zarrouk culture medium diluted to 20% is: NaHCO3 (3.36 mg·L−1), K2HPO4 (0.1 mg·L−1), NaNO3 (0.5 mg·L−1), K2 SO4 (0.2 mg·L−1), NaCl (0.2 mg·L−1), MgSO4·7H2O (0.04 mg·L−1), CaCl2 (0.008 mg·L−1), FeSO4·7H2O (0.002 mg·L−1), EDTA (0.016 mg·L−1).
The cultivations were conducted with isolated Spirulina and using the consortium of Spirulina and S. obliquus at an initial cell concentration of 0.15 g·L−1, being 0.075 g·L−1 of each microalga, standardized by measuring the concentration with a standard curve of each microalga at 670 nm. The cultivation of isolated Scenedesmus was not carried out due to the lack of adaptation in the 10 L raceways under the greenhouse lighting conditions. The design of the study is presented in Table 1. Cultures were performed in duplicate in raceways with a working volume of 10 L, in a greenhouse with temperature control between 20 and 30 °C. The agitation of the cultures was carried out by submerged pumps of 220 L·h−1 (HBO-300, Shanghai Salvage Bureau Wuhu Diving Equipment Factory, Shanghai, China) [19]. The raceways used in the steps of this study were included in the graphical abstract, as well as the design of the 100 L raceway.
The experiments in this step were carried out with and without the addition of effluent. In the experiments with the addition of effluent, 10% (v/v) was added on the first day of cultivation, and then on the 5th and 10th days, in a fed-batch mode. Cultures were conducted for 15 days, until they reached the stationary or decline phase of growth.

2.2.2. Pilot-Scale: 100 L-Raceways

The microalgae Spirulina platensis was cultivated in a 100 L raceway. The initial cell concentration was set at 0.20 g·L−1 to prevent the occurrence of a long lag phase, and the effluent was added to the culture three times: when the culture reached a concentration of 0.5 g·L−1 (day 0 after 0.5 g·L−1), and then 5 and 10 days after this point, in fed-batch mode, with 10% (v/v) addition of effluent. The same medium and environmental conditions described in Section 2.2.1 were used. Cultures were conducted for 15 days after this first addition.

2.3. Biomass and Analytical Determinations During Cultivation

The monitoring of microalgae growth was performed by counting cells in a Neubauer chamber [40], and the results are expressed as cell number·mL−1. In parallel, optical density (OD) measurements were taken at 670 nm (spectrophotometer model UV-1600, Pró-Tools, Porto Alegre, Rio Grande do Sul, Brazil) [41]. Every 5 days, samples were collected to determine the dry mass by filtration using cellulose filters with 0.45 µm pores.
On days 0, 5, 10, and 15, samples were collected, centrifuged at 3500 rpm for 10 min (Centrifuge 5810, Eppendorf, Hamburg, Germany), and dried in an oven at 50 °C, while the supernatant was kept frozen until the determination of Total Kjeldahl Nitrogen (TKN) (Volumetric Method 4500-Norg B), COD (Colorimetry 5220 D), and Total Phosphorus (Potassium Persulfate Method 4500-PF), as described by the American Public Health Association [38].
The biomass obtained from the cultivation was characterized for carbohydrate and protein contents. The samples for quantification of carbohydrate and protein contents were prepared by sonicating 5 mg of dry biomass in 10 mL of distilled water and subjected to sonication for five 59 s cycles in a cell disruptor (Unique Tip Model DES500, Pubcompare, Itapira, Brazil). Carbohydrate content was determined using the phenol-sulfuric acid method [42]. Protein content in algal biomass was determined according to the methodology proposed by Lowry [43]. The contents of carbohydrates and proteins are expressed on a dry basis.

2.4. Data Processing and Statistical Analysis

Microorganism growth curves versus time were constructed. The final biomass concentration (Xf, g·L−1 or cells·mL−1), maximum biomass productivity (Pmax, g·L−1·d−1), and maximum specific growth rate (µmax, d−1) were evaluated [44]. The productivity of carbohydrates and proteins in cultivation (g·L−1·d−1) was also calculated [45]. For all statistical analyses, Statistica 5.5 software was used. Differences between the means of the evaluated parameters were analyzed using analysis of variance (ANOVA) at the 95% confidence level, followed by Tukey’s post hoc test. All tests were performed in duplicate. The results are expressed as mean ± standard deviation.

3. Results and Discussion

3.1. Cultivation in 10 L Raceways

3.1.1. Effects of Cultivation Variables on the Microalgae Growth

Table 1 presents the results of cell counts of Scenedesmus obliquus and Spirulina platensis and the maximum specific growth rates obtained during the exponential phase of growth. Spirulina platensis showed the highest number of cells when grown in consortium with Scenedesmus obliquus without the addition of effluent, and in isolation when cultivated with the addition of effluent (experiments 1 and 4). The cell number of Scenedesmus did not show differences in the consortium experiments (experiments 1 and 2), regardless of effluent addition (p > 0.05) (Table 1). However, an increase in µmax of Scenedesmus was observed with the addition of effluent in the consortium experiments (µmax from 0.11 to 0.19 d−1). This behavior was the opposite for Spirulina grown in consortium, where µmax decreased from 0.40 to 0.25 d−1. In the experiment with Spirulina grown alone, an increase in µmax was observed (from 0.10 to 0.25 d−1) with the addition of effluent.
In Figure 1a,b, Scenedesmus showed a greater cell number than Spirulina, possibly because Spirulina has spiral-shaped filaments, whereas Scenedesmus is a microalga with a rounded shape and smaller size [46], except at the final time points of experiment 1. The addition of effluent reduced the cell number of Spirulina, extending the cultivation period, as observed in Figure 1a,b. However, when counting Spirulina cells, each filament was considered as one cell, regardless of its length, and the number of cells did not take filament length into account. In these experiments, Scenedesmus increased its cell number when cultivated with the addition of effluent. When grown in consortium, there may be competition for both light and nutrients between the two microalgae, causing Spirulina to grow less in consortium compared with isolation.
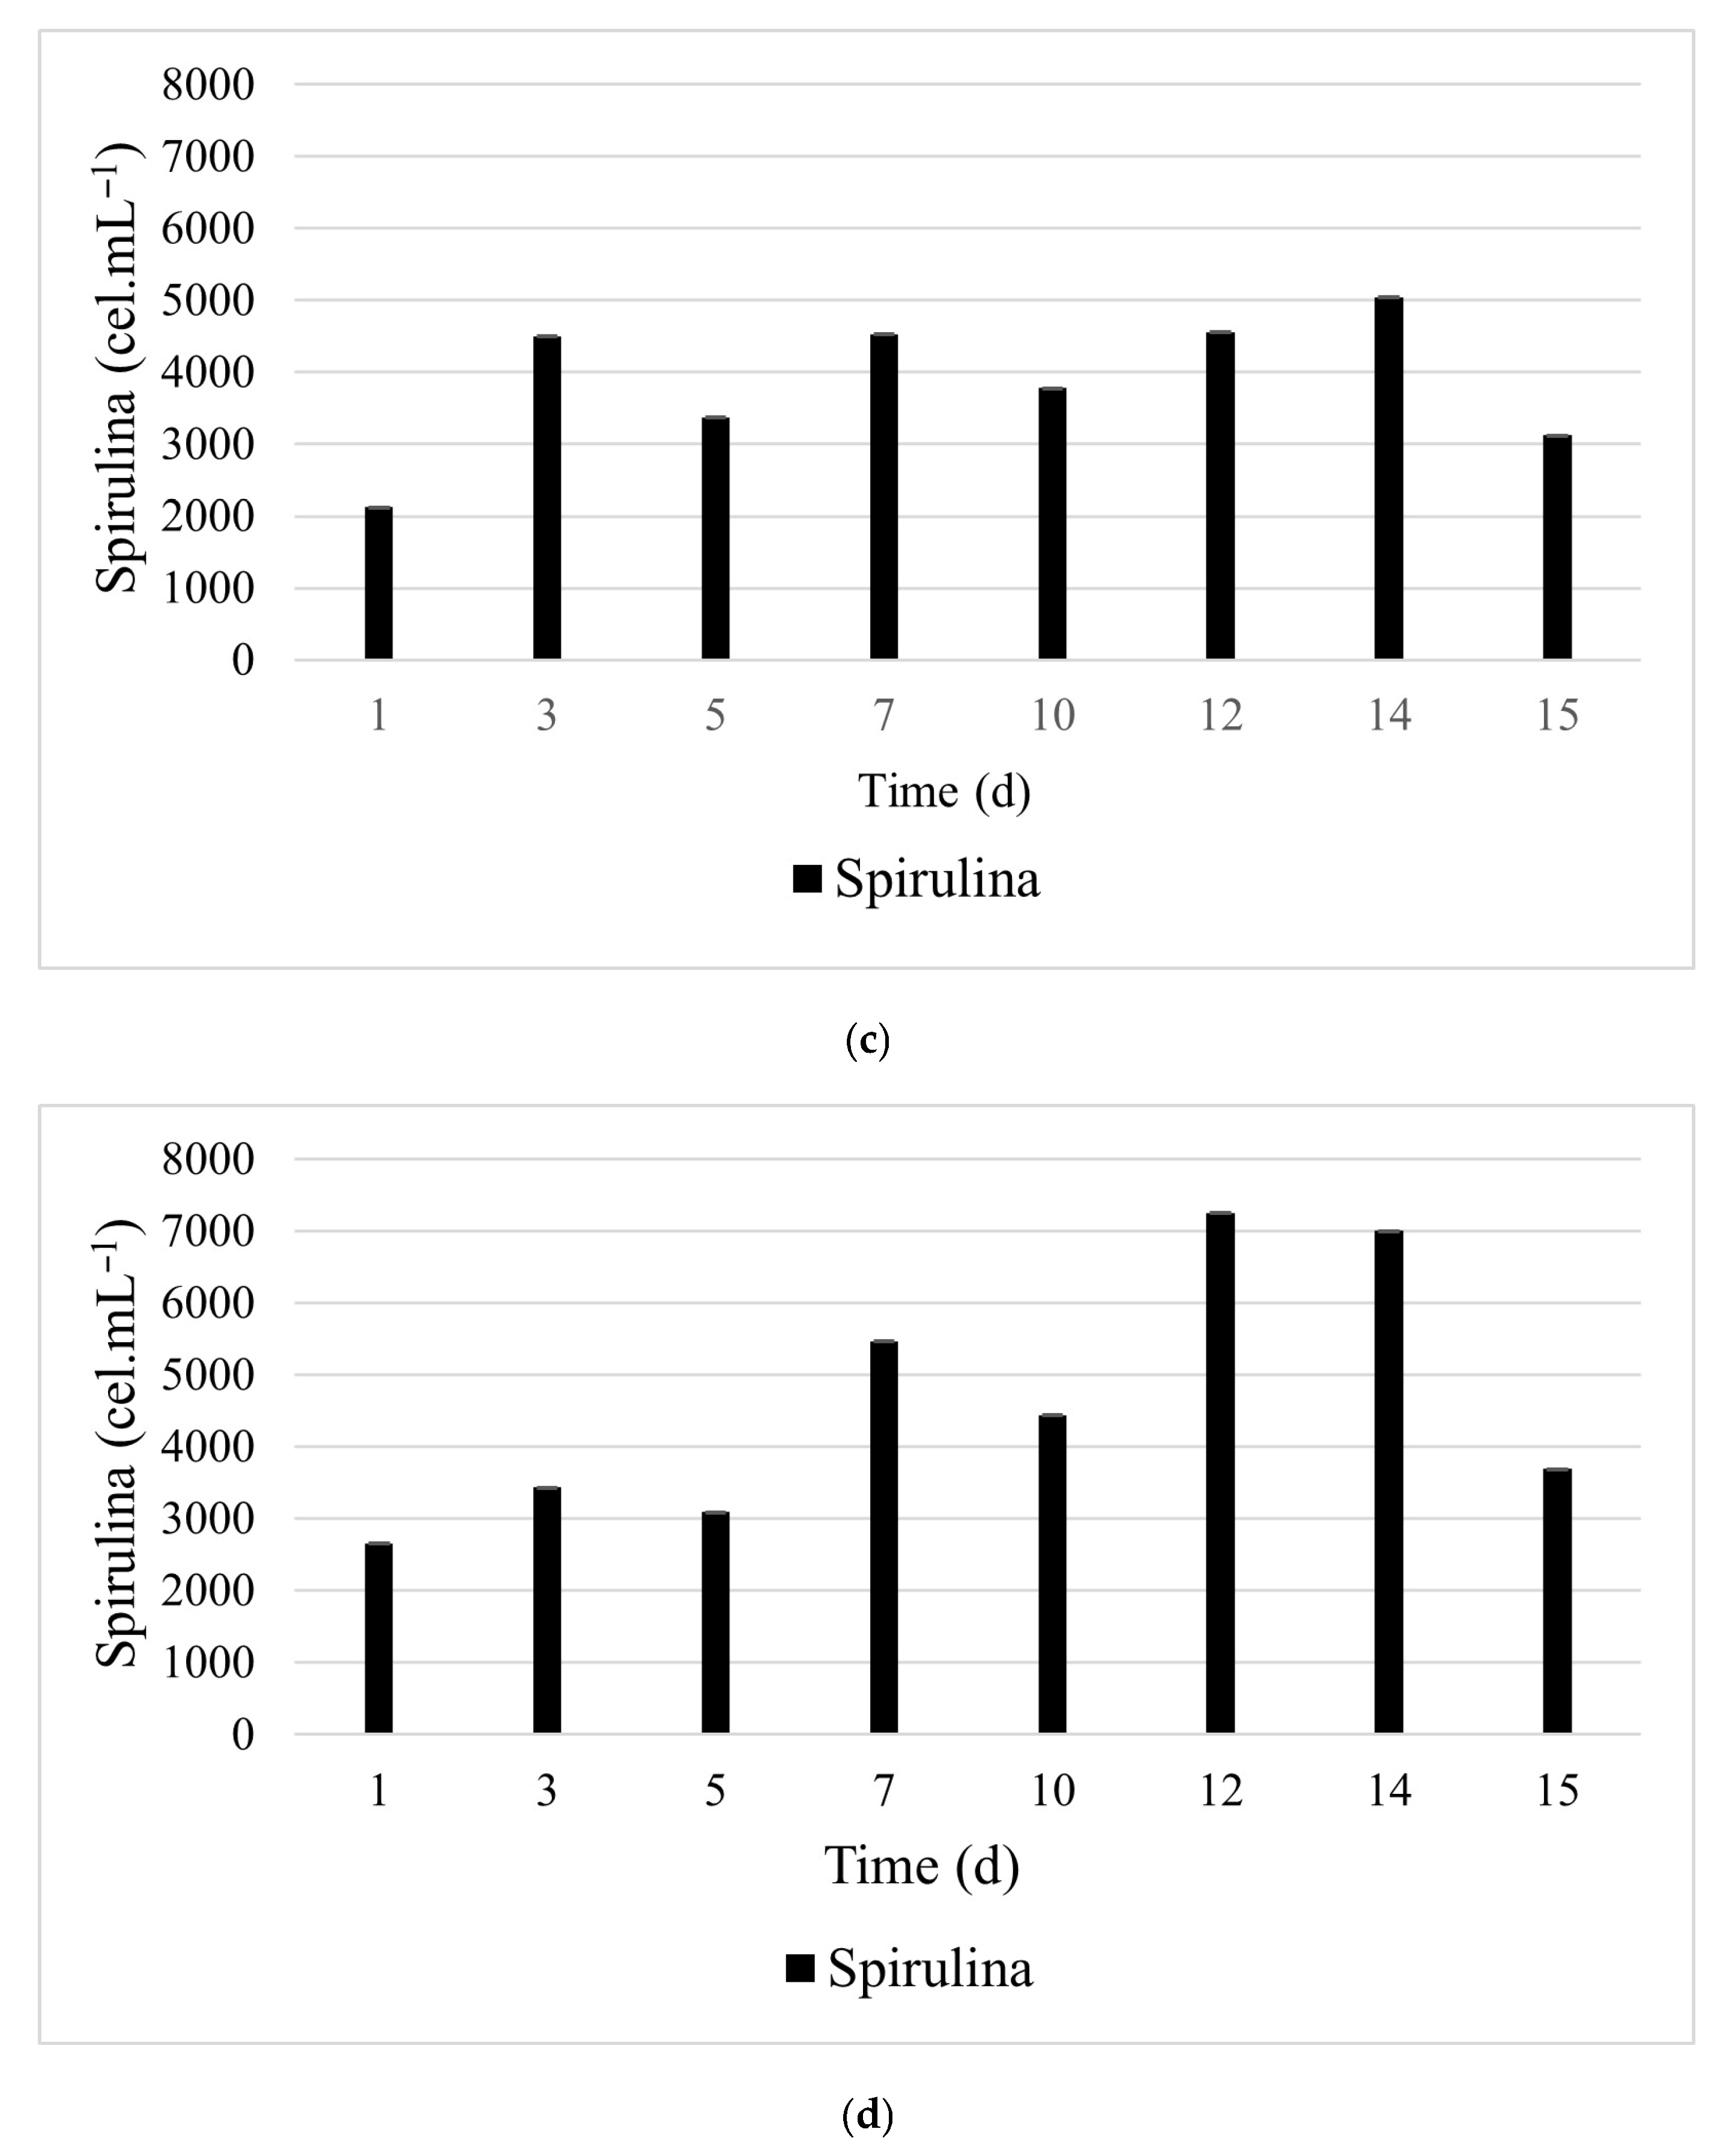
Spirulina, when cultivated in isolation (Figure 1c), reached approximately 4000–5000 cells·mL−1 after 3 days of cultivation, which represented the highest cell density observed. It is important to note that, being filamentous, Spirulina can continue to grow in filament length during the cultivation period. With the addition of effluent (Figure 1d), Spirulina reached around 7000 cells·mL−1 after 12 days of cultivation, highlighting the positive effect of effluent supplementation. Another explanation for the fluctuations in cell numbers is that, when using microscopy for measurements, high standard deviations can occur due to operator dependence, dilution, and sampling, as well as interactions between microalgae and competitive processes, in addition to the effects of effluent toxicity and metabolites during cultivation.
It can be hypothesized that Spirulina may provide protection to Scenedesmus against excessive light exposure, since Scenedesmus could not be cultivated alone under greenhouse conditions, as observed in previous experiments of our research group ). Ho et al. [47] reported that increasing light intensity to 540 µmol·m−2·s−1 resulted in a marked decrease in both CO2 fixation rate and biomass productivity of Scenedesmus, suggesting that excessive illumination can inhibit biomass production and CO2 fixation through the well-recognized photoinhibition effect.
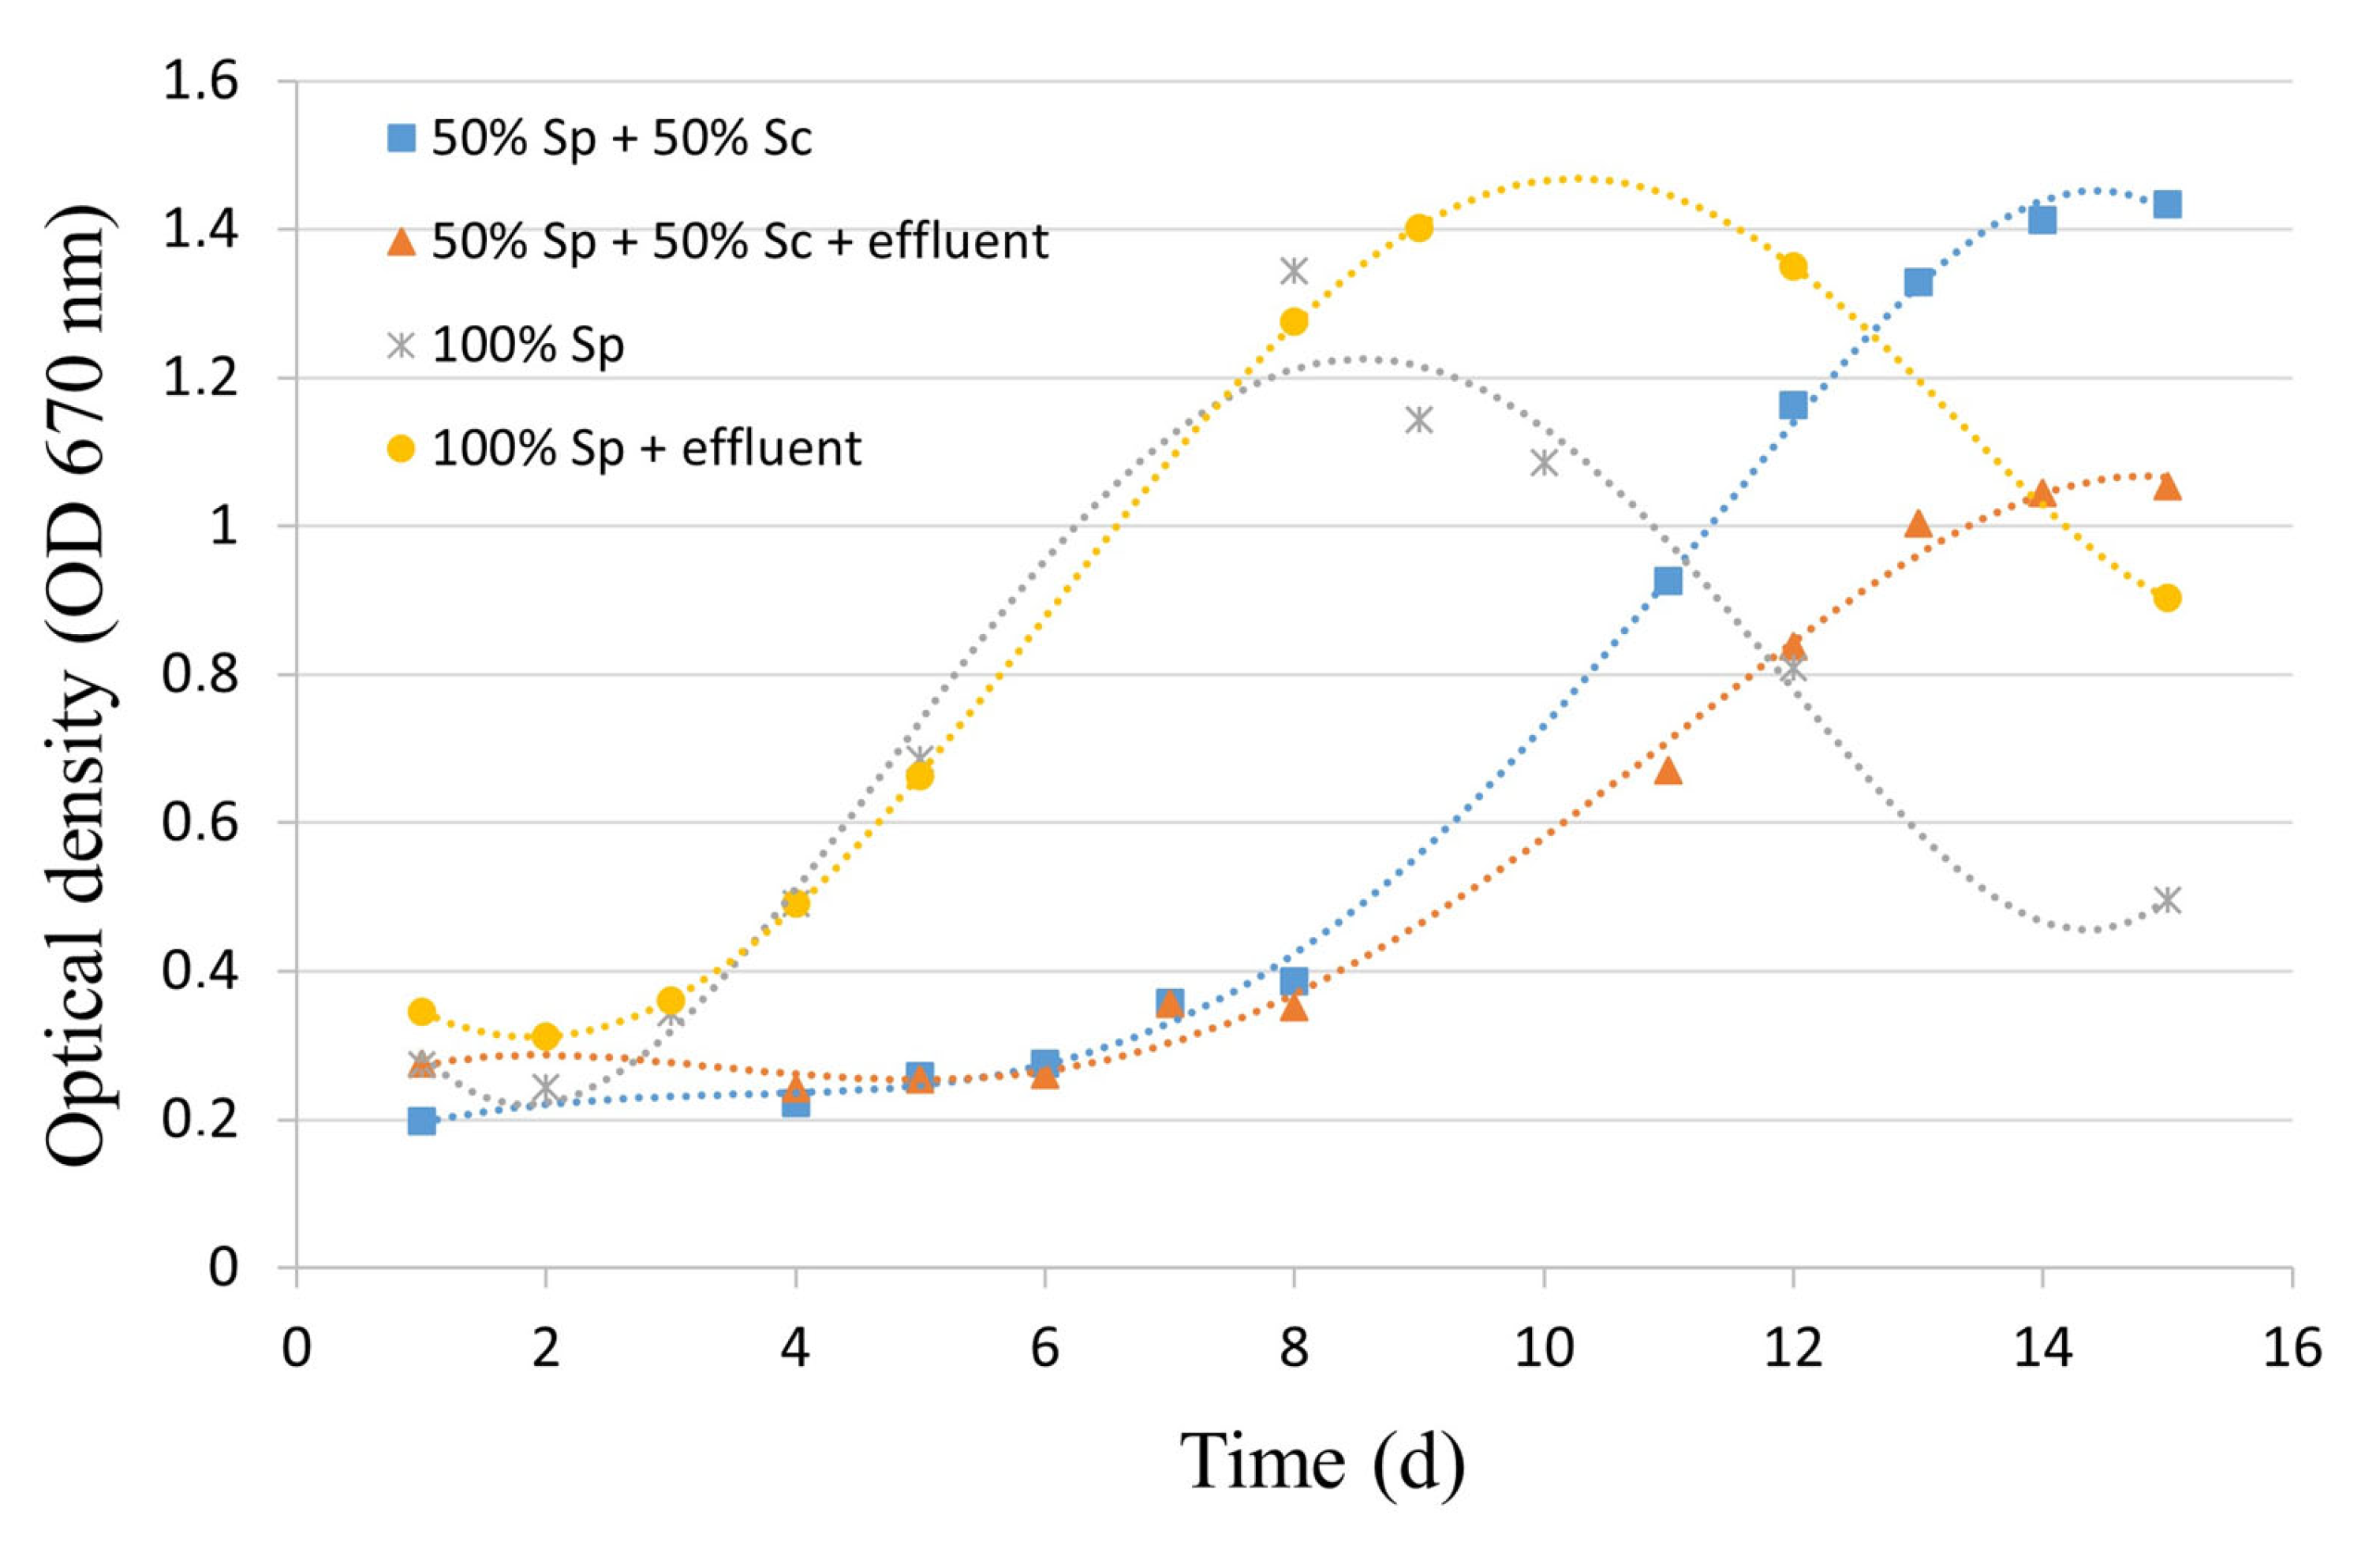
Comparison with optical density (OD) measurements (Figure 2) revealed higher OD values in the experiments carried out with the 50% Sp + 50% Sc consortium without effluent addition (experiment 1) and in the cultivation of Spirulina supplemented with 10% (v/v) effluent (experiment 4). In addition, the consortium experiments exhibited a longer adaptation phase (~8 days) compared with the cultivation of Spirulina alone, which entered exponential growth by the third day. Isolated Spirulina cultures showed higher OD values when grown with effluent addition (experiment 4), likely due to the supply of organic carbon sources, a behavior consistent with the well-documented mixotrophic growth of Spirulina [48,49]. Spirulina in isolation reached its maximum growth between days 8 and 9, after which it entered the decline phase, while the consortium cultures transitioned into the stationary phase only after 13–14 days of cultivation.
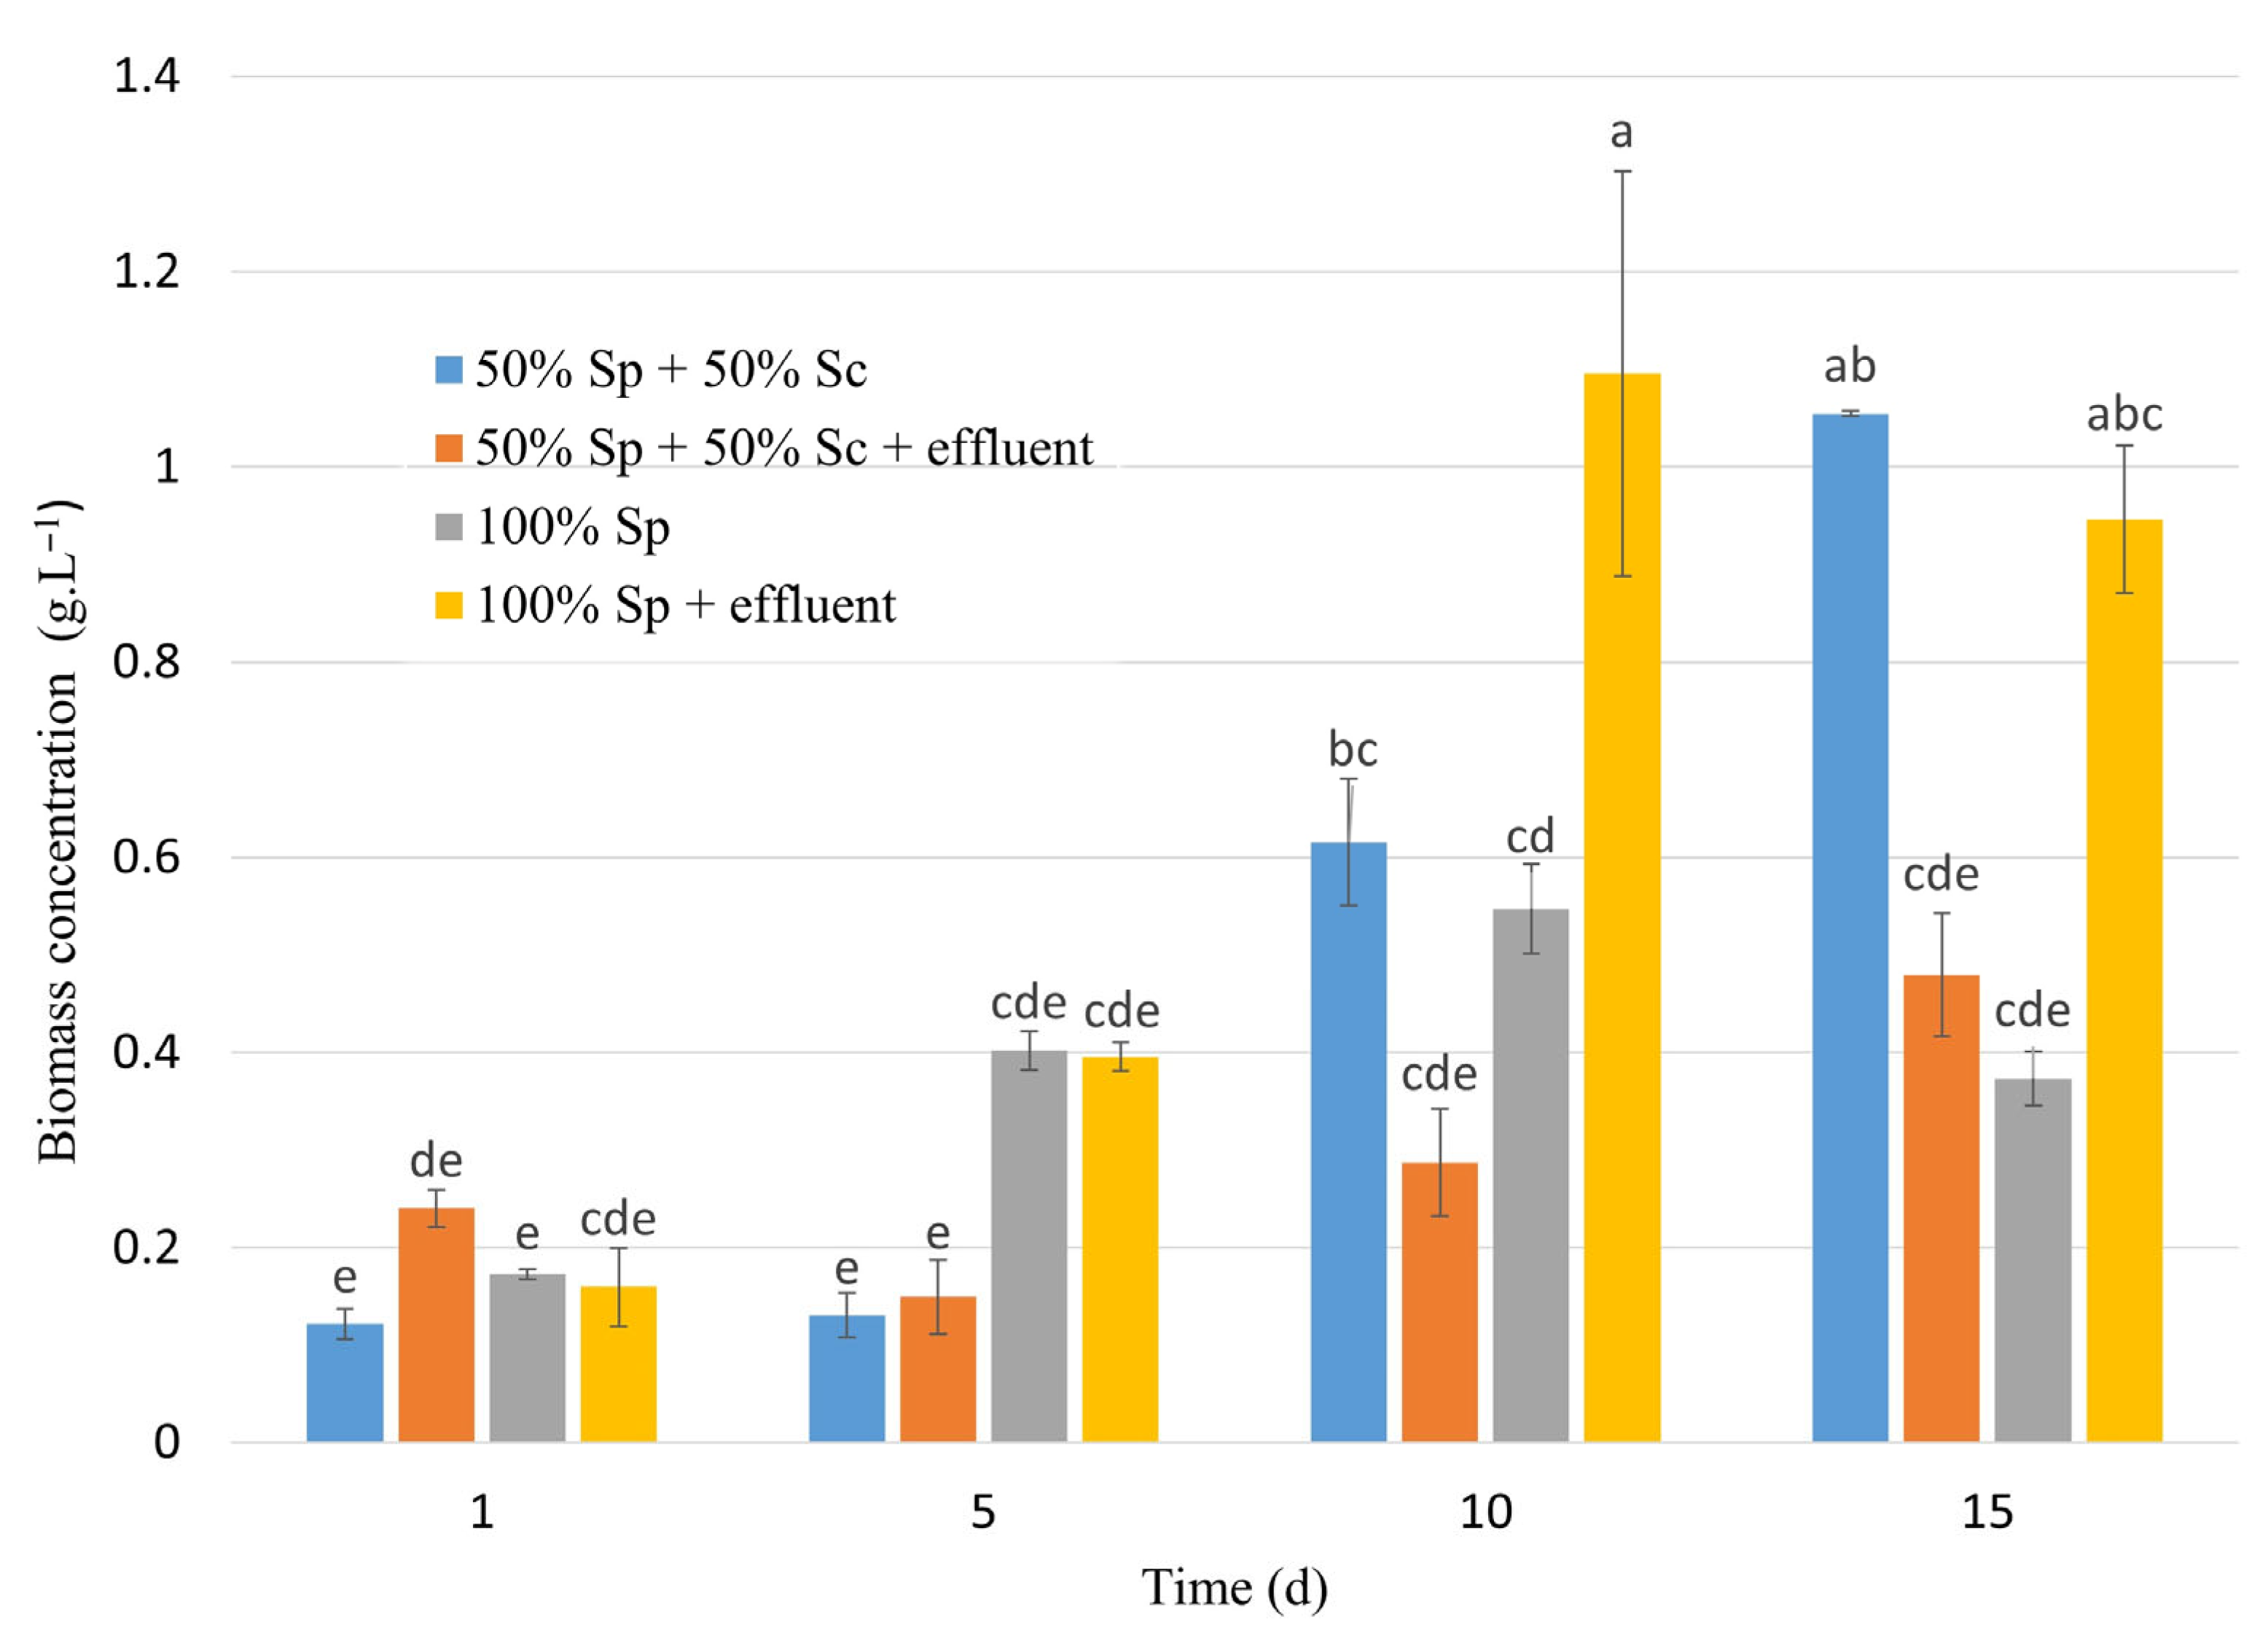
Figure 3 presents the biomass concentration measured as the dry weight of a culture volume during the cultivation period. The experiment that reached the highest dry mass was 50% Sc + 50% Sp (experiment 1) at 15 days of cultivation, followed by 100% Sp + effluent (experiment 4) at 10 and 15 days of cultivation, with no significant difference between them (Figure 3). It can be observed that biomass concentration increased over the cultivation period, except in experiment 3 (100% Sp without effluent), which reached its maximum concentration at day 10. Hultberg [12] tested the effluent of a biogas processing plant as a nutrient source for Spirulina cultivation and compared it with a conventional Spirulina medium. Biomass production in the effluent-based medium was comparable to that of the conventional Spirulina medium during the first 6 days. After this period, biomass decreased in the effluent-based medium, while it remained stable in the Spirulina medium.

3.1.2. Effects on Biomass Composition

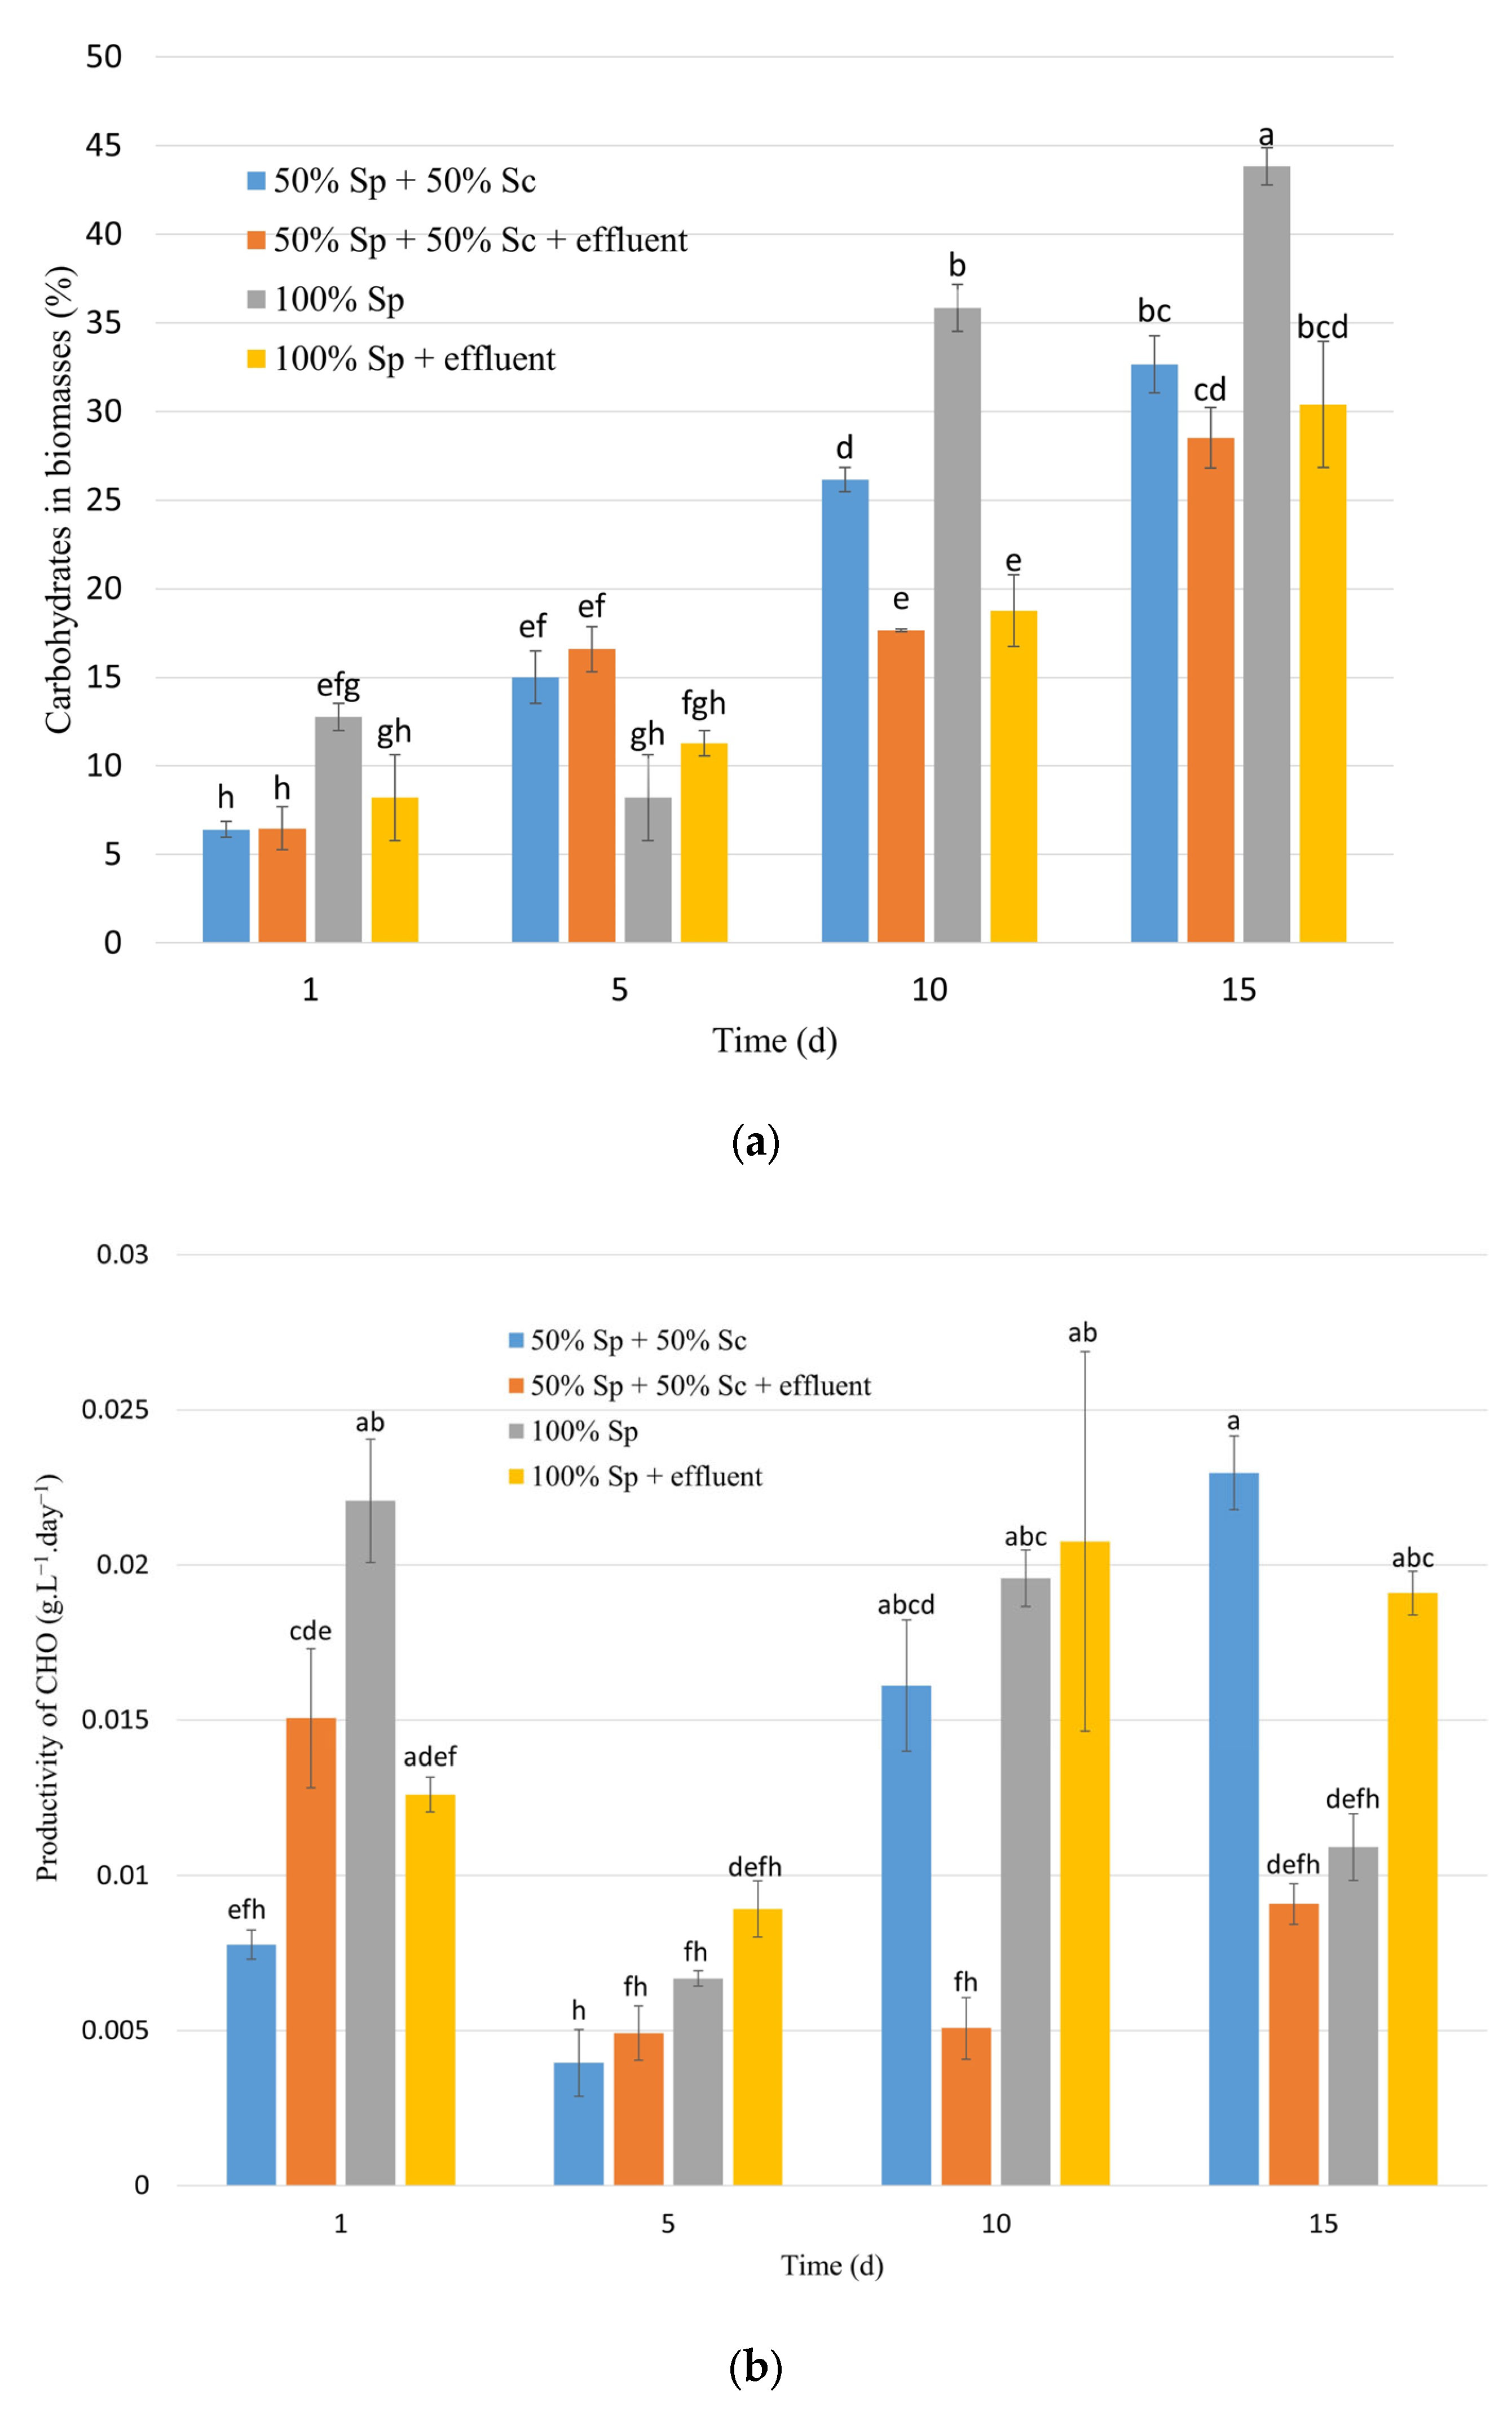
The highest percentage of carbohydrates (43.8%) was achieved in the experiment with Spirulina cultivated in isolation (experiment 3) after 15 days of cultivation (p < 0.05), followed by the same experiment (100% Sp) after 10 days of cultivation (35.8%). Similar results were obtained by Braun et al. [48] when cultivating Spirulina in 10 L raceways. In that study, the carbohydrate content was lower in the assay with whey addition (1% added every 3 days) (13.25%) compared to the control assay (18.36%), showing the same behavior observed in the present study, where effluent addition in fed-batch mode caused a reduction in carbohydrate percentage (close to 30%, Figure 4a). Thus, it can be concluded that Spirulina grown under the conditions of these experiments has a high capacity for intracellular carbohydrate accumulation (Figure 4).
Comparing the experiments with effluent addition, experiments 2 and 4 (50% Sp + 50% Sc + effluent and 100% Sp + effluent, respectively) presented lower carbohydrate concentrations at days 10 and 15 of cultivation compared with their counterparts without effluent addition. This is possibly due to the high nitrogen concentration in the effluent, which directs cellular metabolism toward protein accumulation rather than the accumulation of reserve substances such as carbohydrates. Markou [16] cultivated Spirulina platensis in a fed-batch regime in ammonia-rich wastewater derived from the anaerobic digestion of poultry manure. Spirulina platensis presented different biochemical compositions at the four levels of fed-batch addition used. A general observation was that, with increasing levels of total ammonia addition, the contents of proteins, lipids, phycocyanin, chlorophyll, and total carotenoids increased, while carbohydrate content decreased.
Another behavior observed in Figure 4 is that carbohydrate concentration increased over the cultivation period, due to nutrient depletion, causing the microalgae to direct metabolism toward reserve substances such as carbohydrates. Carbohydrate productivities were also higher (Figure 4b) on days 10 and 15 of cultivation in most experiments, reflecting the higher carbohydrate and dry mass concentrations on those days.
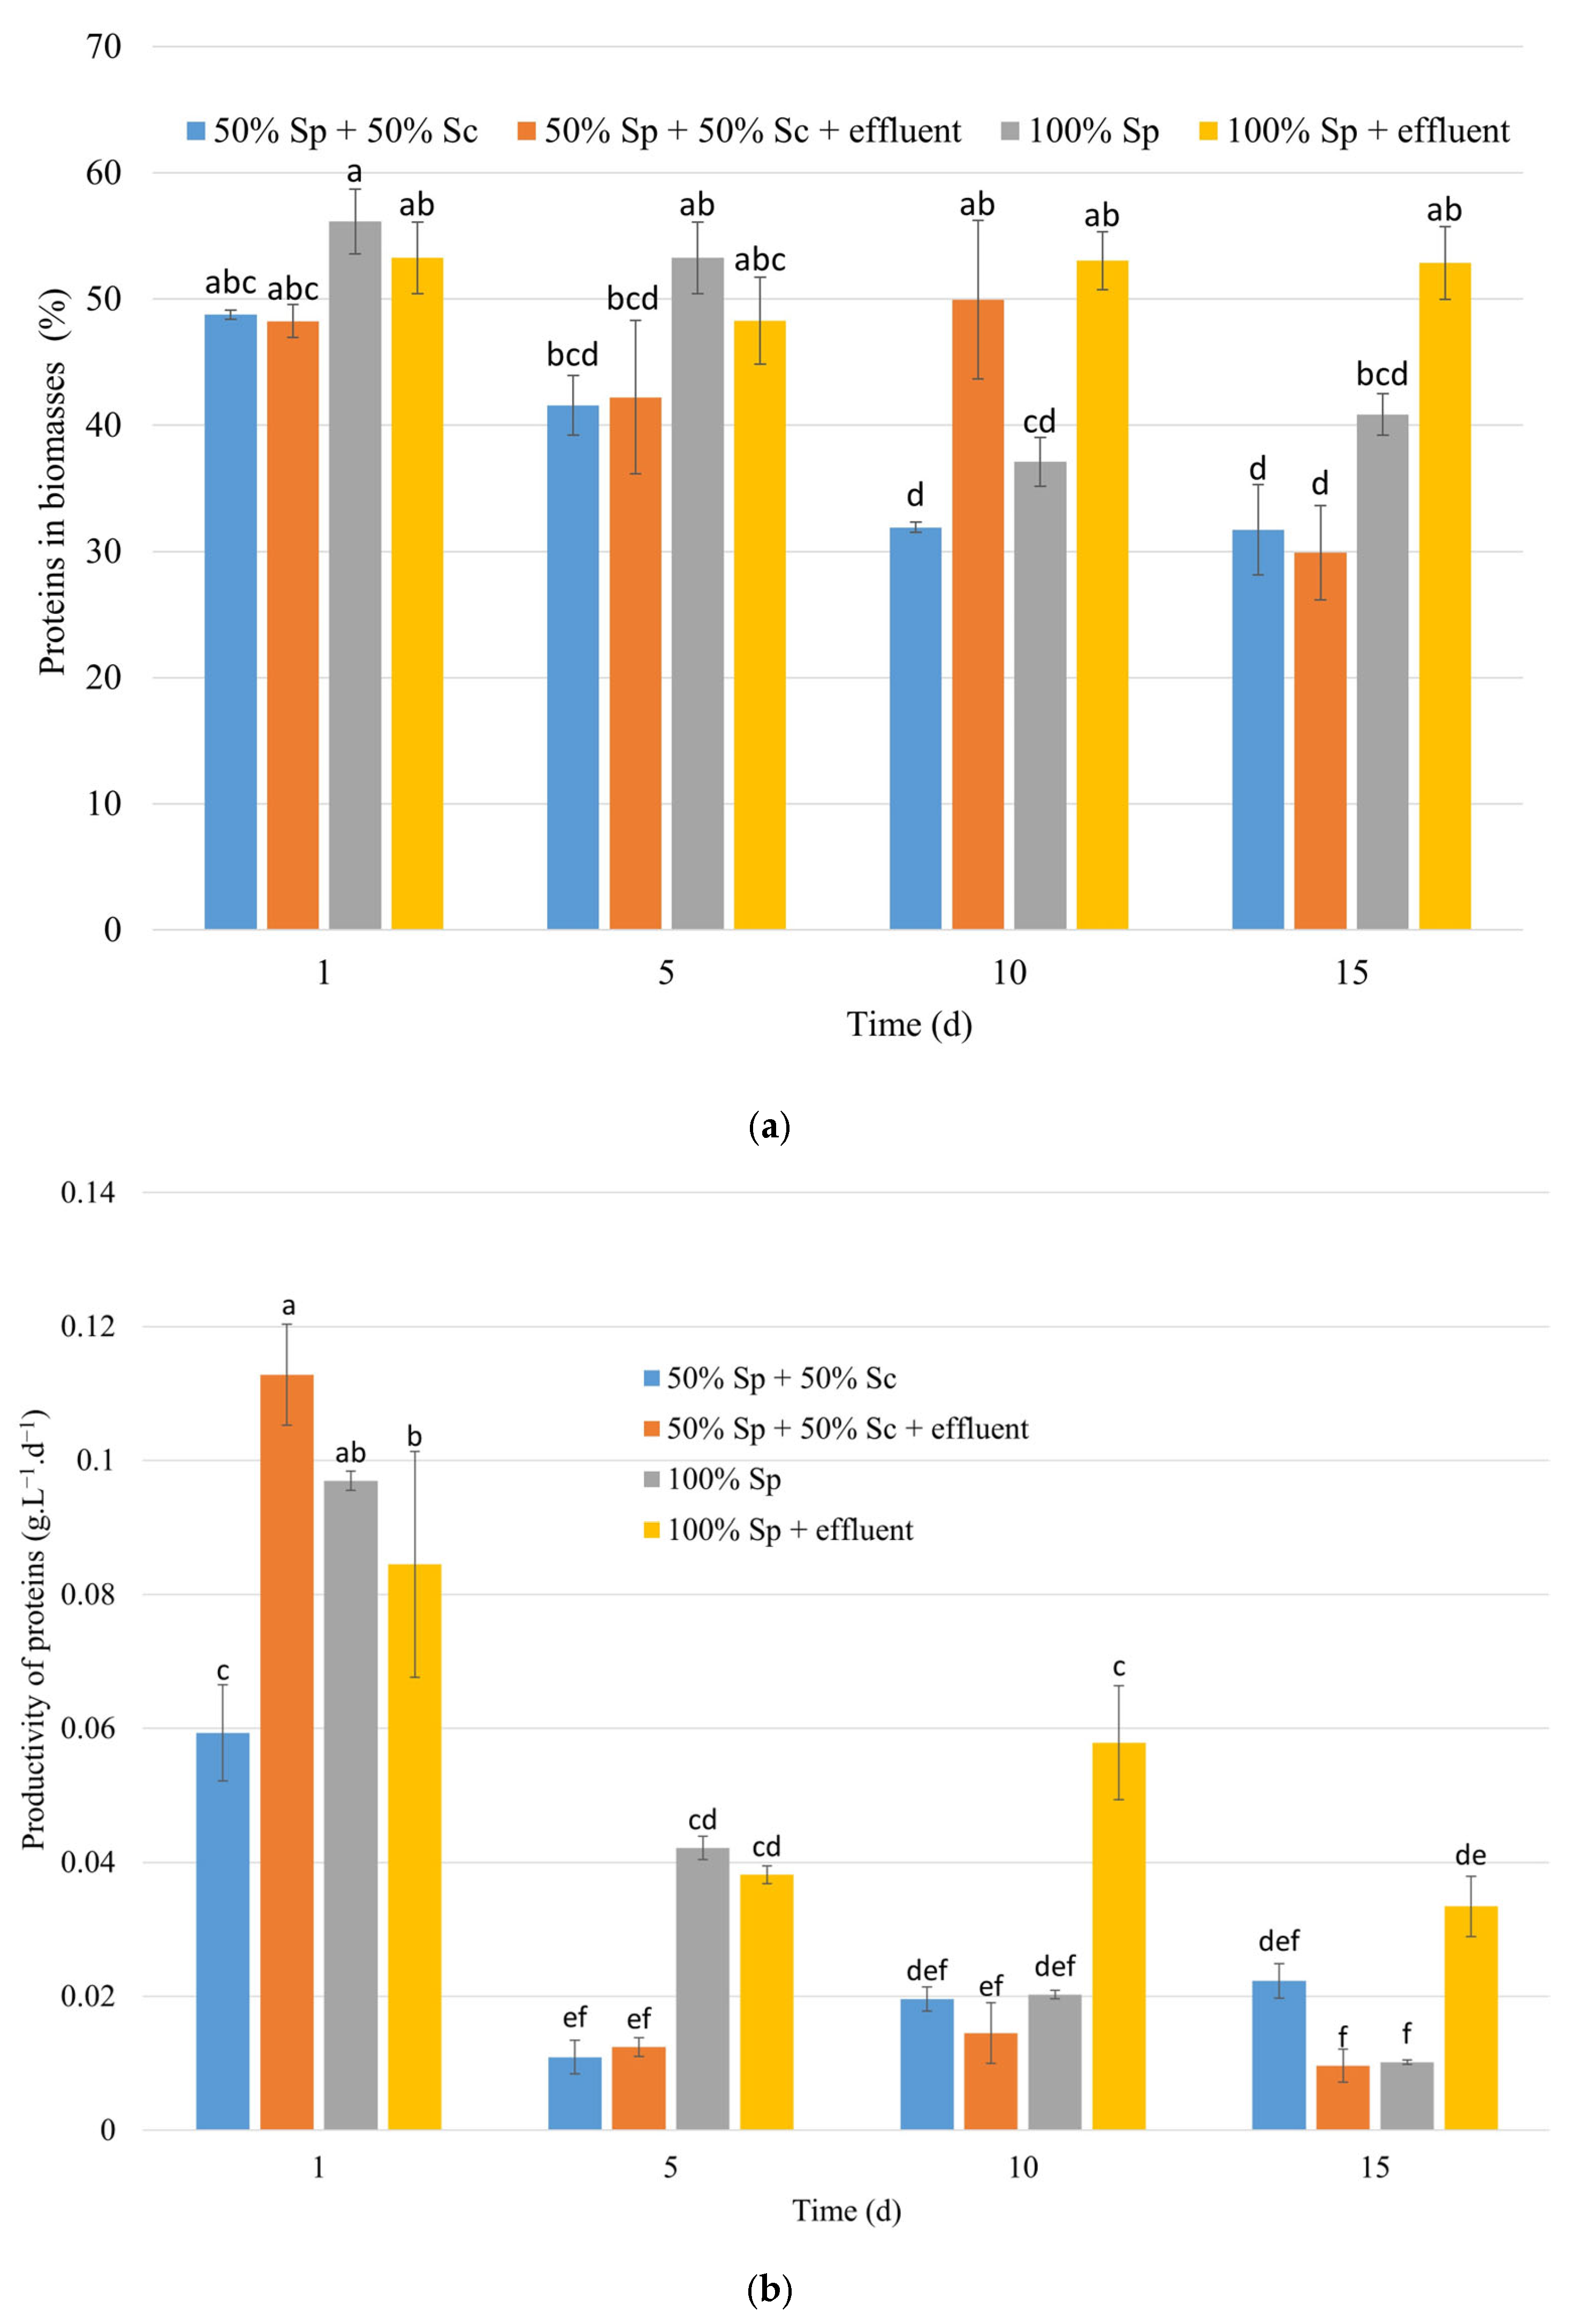
Figure 5a shows that, in most cases, higher protein percentages were obtained in the experiments containing 100% Spirulina (around 55%). The lower protein percentages were observed on days 10 and 15 in the consortium experiments (around 30%) (p < 0.05). Protein concentrations, in contrast to carbohydrate concentrations, were higher during the first days due to higher nitrogen availability at the beginning of cultivation. Considering days 10 and 15, protein concentrations were higher in the experiments with effluent addition (Figure 5a). The highest volumetric protein productivity after the initial period was observed in the experiment with 100% Spirulina supplemented with effluent after 10 days of cultivation. Hultberg [12], in a similar study using biogas effluent from vegetable waste processing, obtained, in biomass harvested after 6 days of growth, total protein concentrations expressed as % of dry mass of 60.5 ± 6.2 and 63.3 ± 2.7 for the Spirulina medium and effluent-based medium, respectively, with no significant differences observed between treatments.

3.1.3. COD, Nitrogen and Phosphorus Concentrations

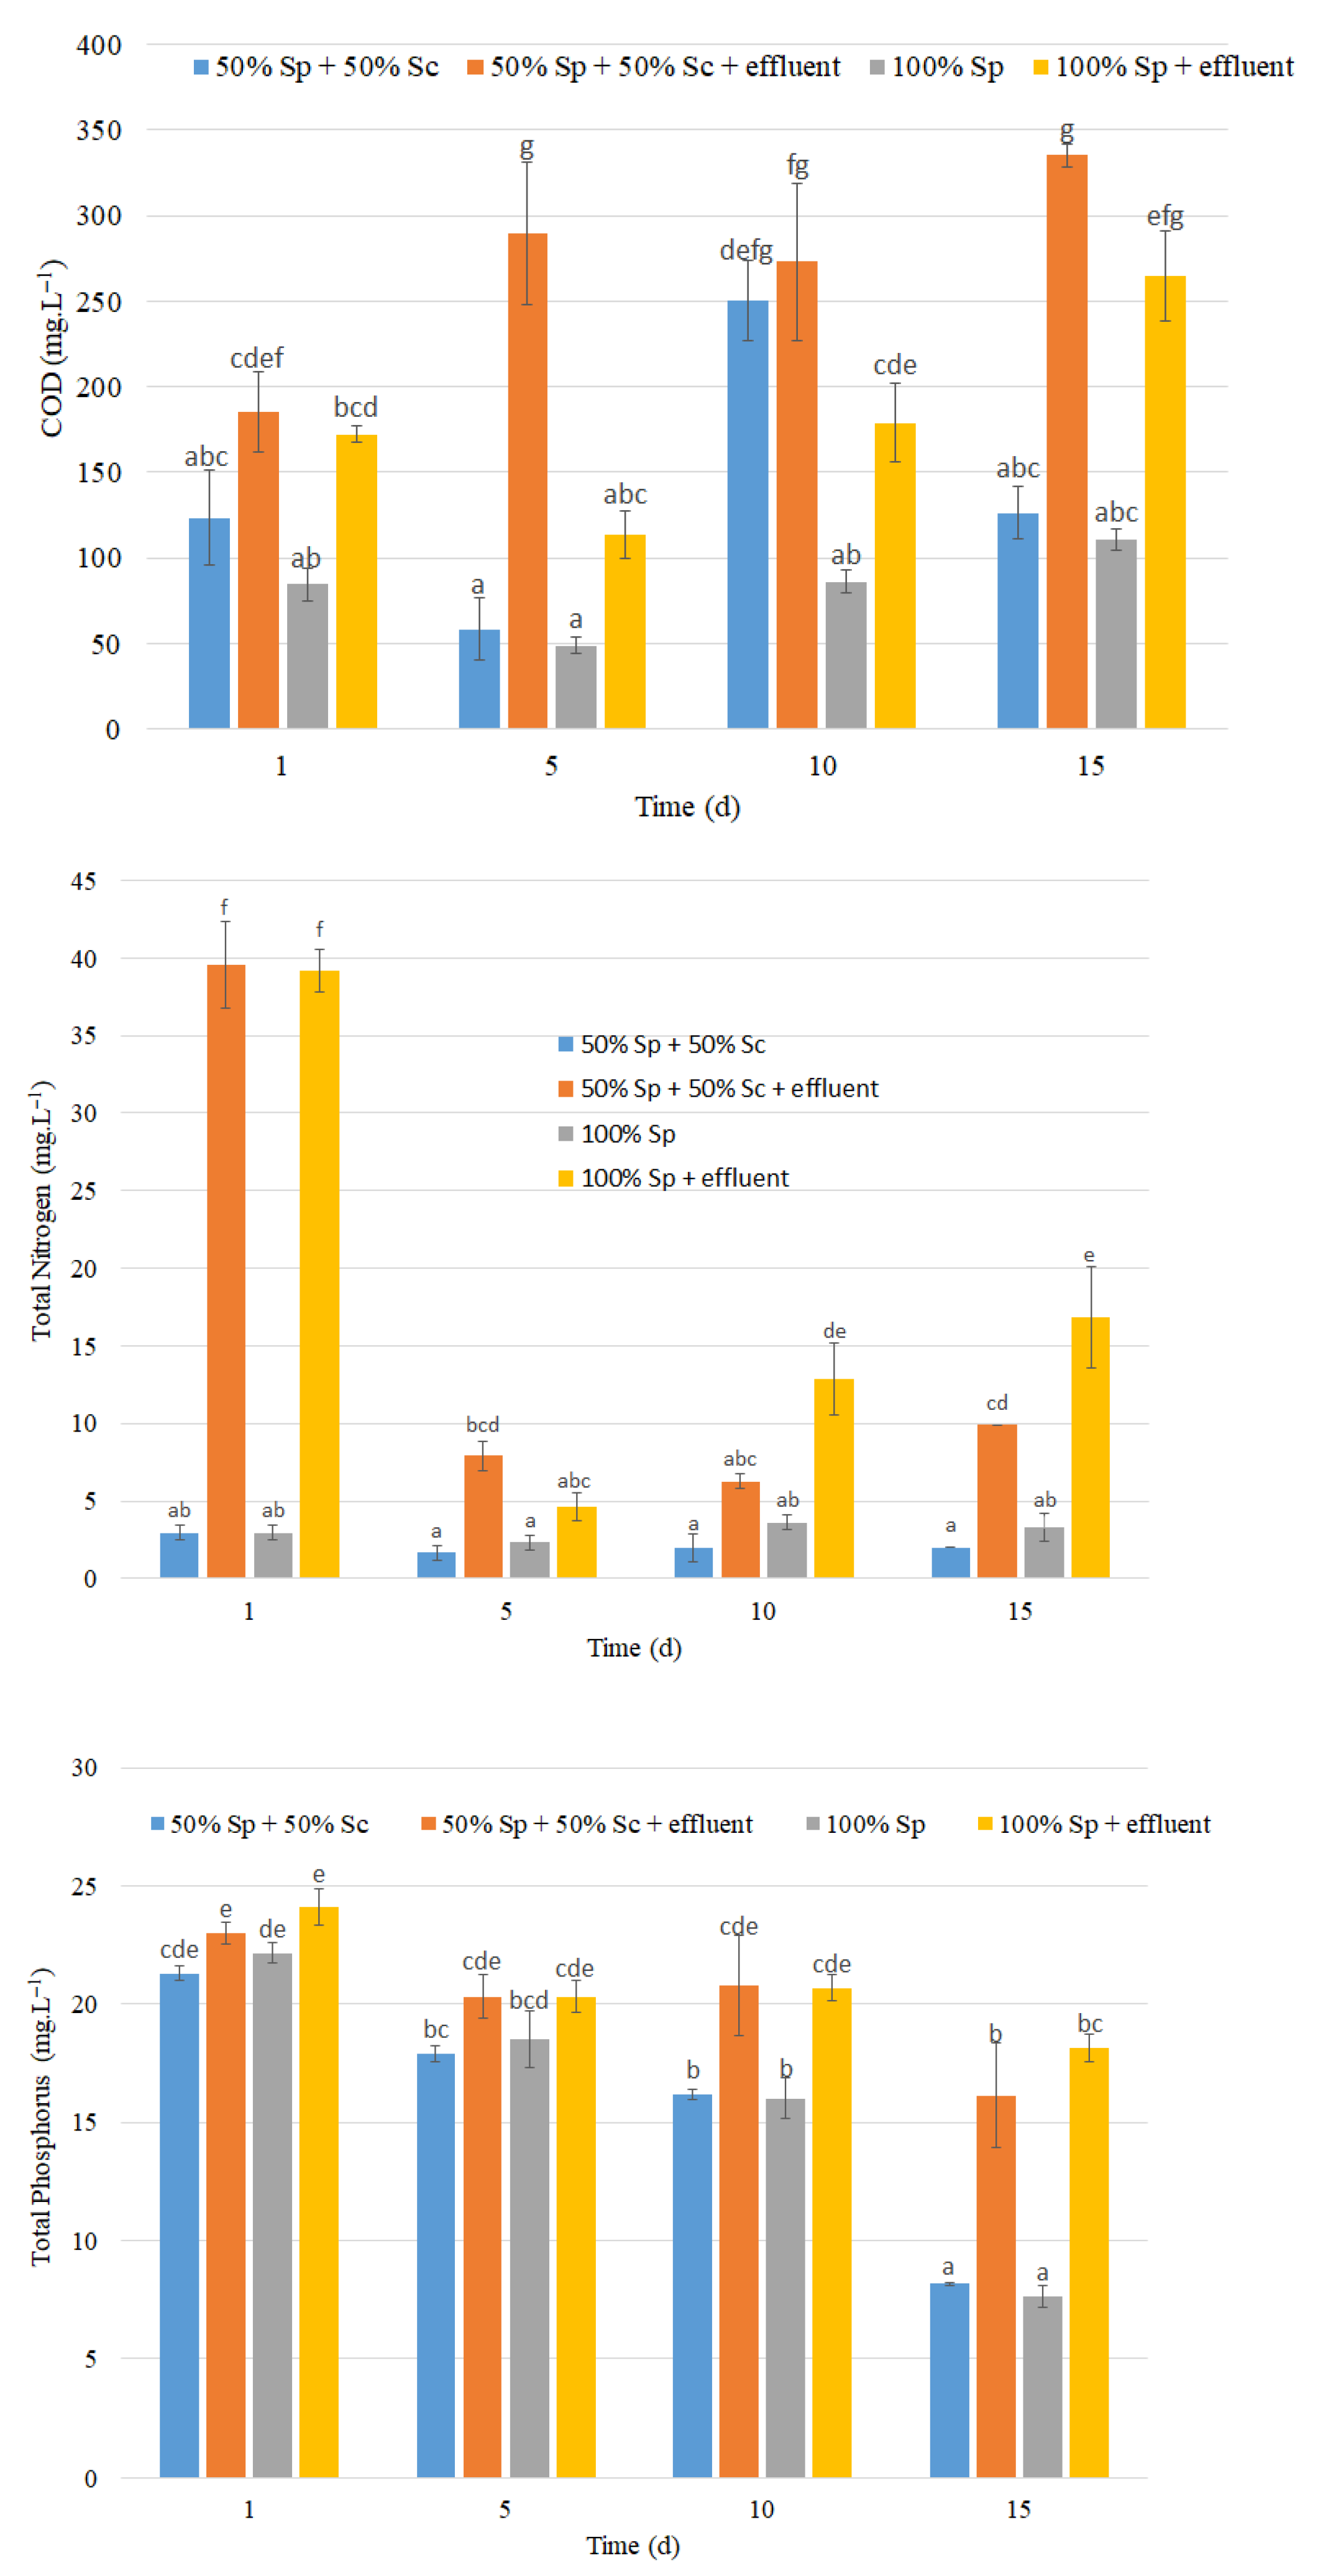
In the tests without effluent addition, COD remained in the same range with no significant differences (p > 0.05) during cultivation, except for the assay with 50% Sc + 50% Sp, probably because cell residues remained in the supernatant after centrifugation, increasing COD in this sample. In cultures supplemented with effluent, COD concentrations were higher due to the addition of 10% (v/v) effluent containing 370.14 ± 21.5 mg·L−1 of COD.
The highest nitrogen concentrations were observed in the experiments during the first effluent addition (around 40 mg·L−1). For the other cultivation times and experiments, nitrogen concentration remained below 10 mg·L−1, except in the Spirulina experiments with effluent addition on days 10 and 15 (around 15 mg·L−1).
For phosphorus removal, all experiments showed significant phosphorus removal until day 15 (p < 0.05), since approximately 18.71 ± 1.11 mg of phosphorus was added to the cultures with effluent. Phosphorus is essential for algal growth as it is involved in many cellular processes [50], although it constitutes less than 1% of biomass [51]. It can be concluded that the nutrients added through effluent were utilized by microalgae for conversion into biomass. The time course of COD, nitrogen, and phosphorus concentrations is shown in Appendix A.
Koreiviene et al. [33] reported that a Chlorella/Scenedesmus consortium eliminated up to 99.7–99.9% of inorganic phosphorus and 88.6–96.4% of inorganic nitrogen from wastewater within three weeks. Scherer et al. [52] showed that Scenedesmus sp. cultivated in cattle manure effluent caused a decrease in all physico-chemical parameters, with reductions of 92.5% of total nitrogen, 51.9% of phosphorus, and 53.6% of COD. In a study with Arthrospira platensis (Spirulina) grown in dairy farm effluent for biodiesel production, COD, phosphorus, and nitrogen concentrations were reduced by more than 98% within 4–5 days of cultivation [53].

3.2. Pilot-Scale in 100 L Raceway

The scale-up test was performed only with Spirulina, as it was the microalga that reached the highest dry mass (0.94 g·L−1) and the highest volumetric carbohydrate productivity (0.019 g·L−1·d−1) with effluent addition in the 10 L raceway experiments.
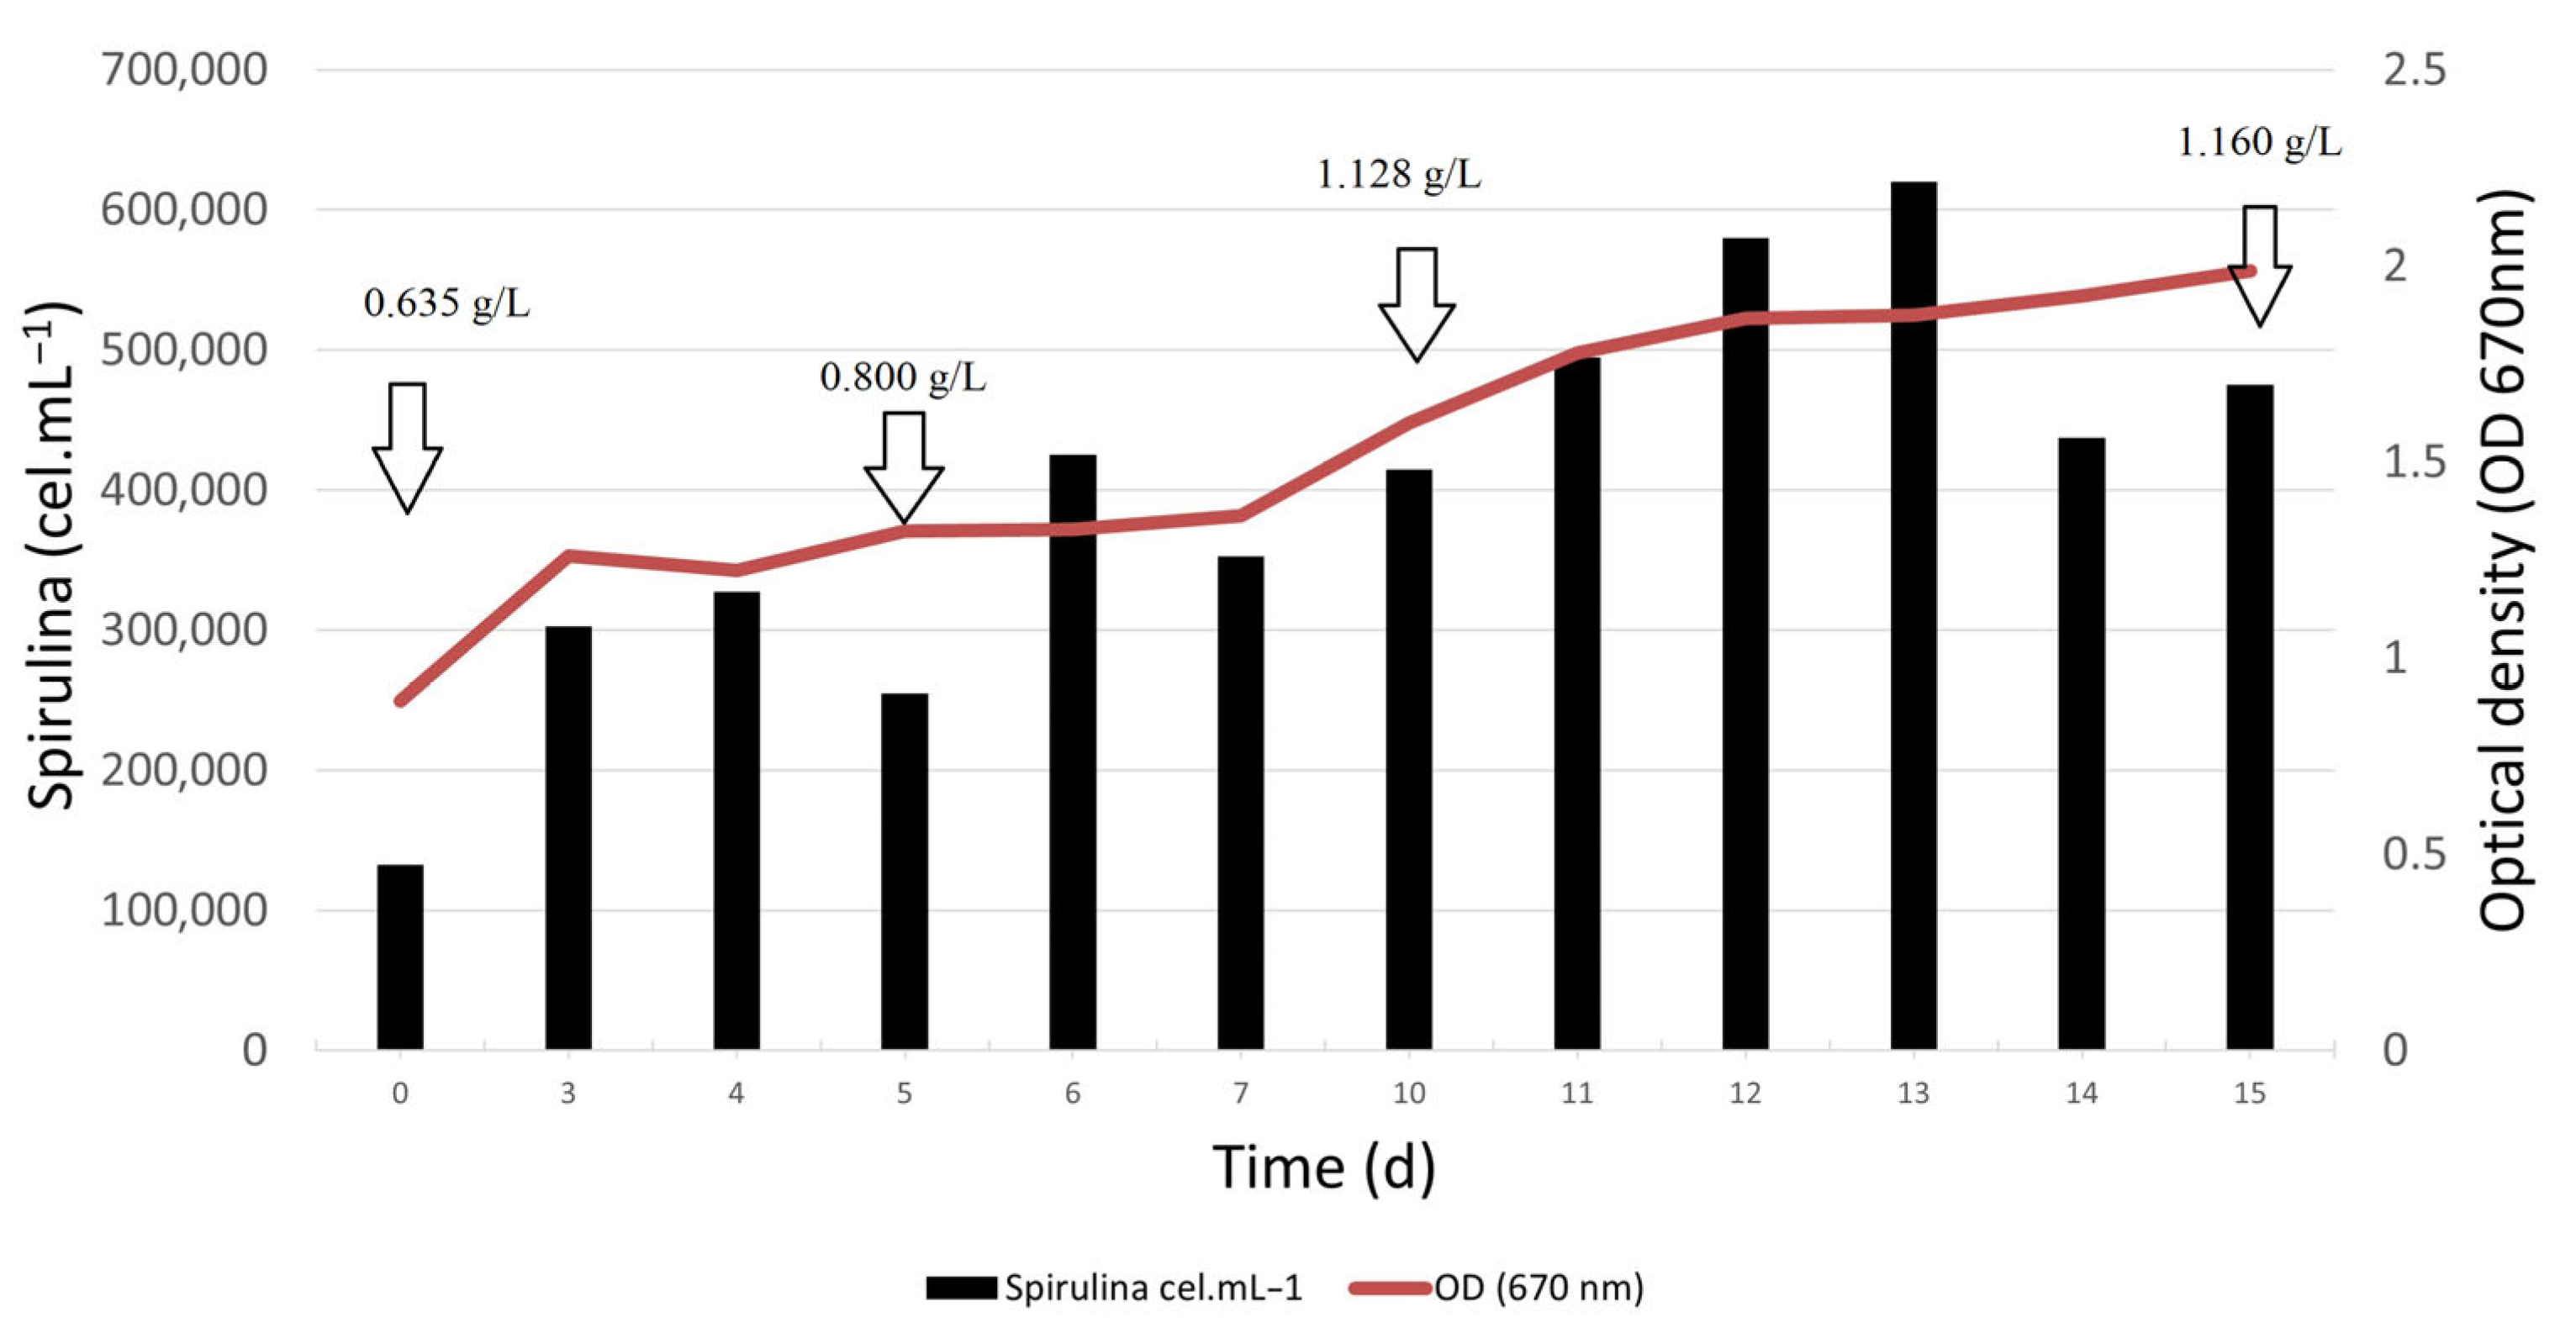
Through the growth curves (OD670) (Figure 6), it can be noted that Spirulina reached exponential growth more quickly than in the 10 L raceways. This occurs because effluent was added only after the culture reached a biomass concentration of 0.5 g·L−1. An increase in cell number was observed each time effluent was added (on days 0, 5, and 10), and in Figure 6, the moments of effluent addition are indicated using arrows. After 15 days from the start of effluent addition, the highest dry mass obtained was 1.66 g·L−1.
Compared with the 10 L raceway, cultures reached 1.095 and 0.940 g·L−1 at 15 and 10 days of cultivation (Figure 3), respectively, using the same effluent volume but with addition at the beginning of cultivation. These results demonstrate that it is preferable to start effluent addition after microorganism adaptation, in this case, when the culture reaches 0.5 g·L−1 of biomass.
Table 2 presents the results of biomass composition analysis and volumetric productivities (g·L−1·d−1) of carbohydrates and proteins during Spirulina platensis cultivation in a 100 L raceway. The highest carbohydrate concentration (28.8%) was achieved after 15 days of cultivation, compared with 30.4% in the cultivation carried out with Spirulina in the 10 L raceway.
Protein percentages were similar to those obtained in the 10 L raceway (around 50%). These results show that Spirulina platensis cultivation with 10% (v/v) effluent addition maintained the same behavior during scale-up from 10 L to 100 L, which is desirable for a microorganism intended for large-scale applications. Magro et al. [17] conducted experiments with a similar effluent derived from anaerobic digestion of cattle waste and produced Spirulina biomass with 19% carbohydrates and 48% proteins by adding 10% of this effluent in 1 L Erlenmeyer experiments.
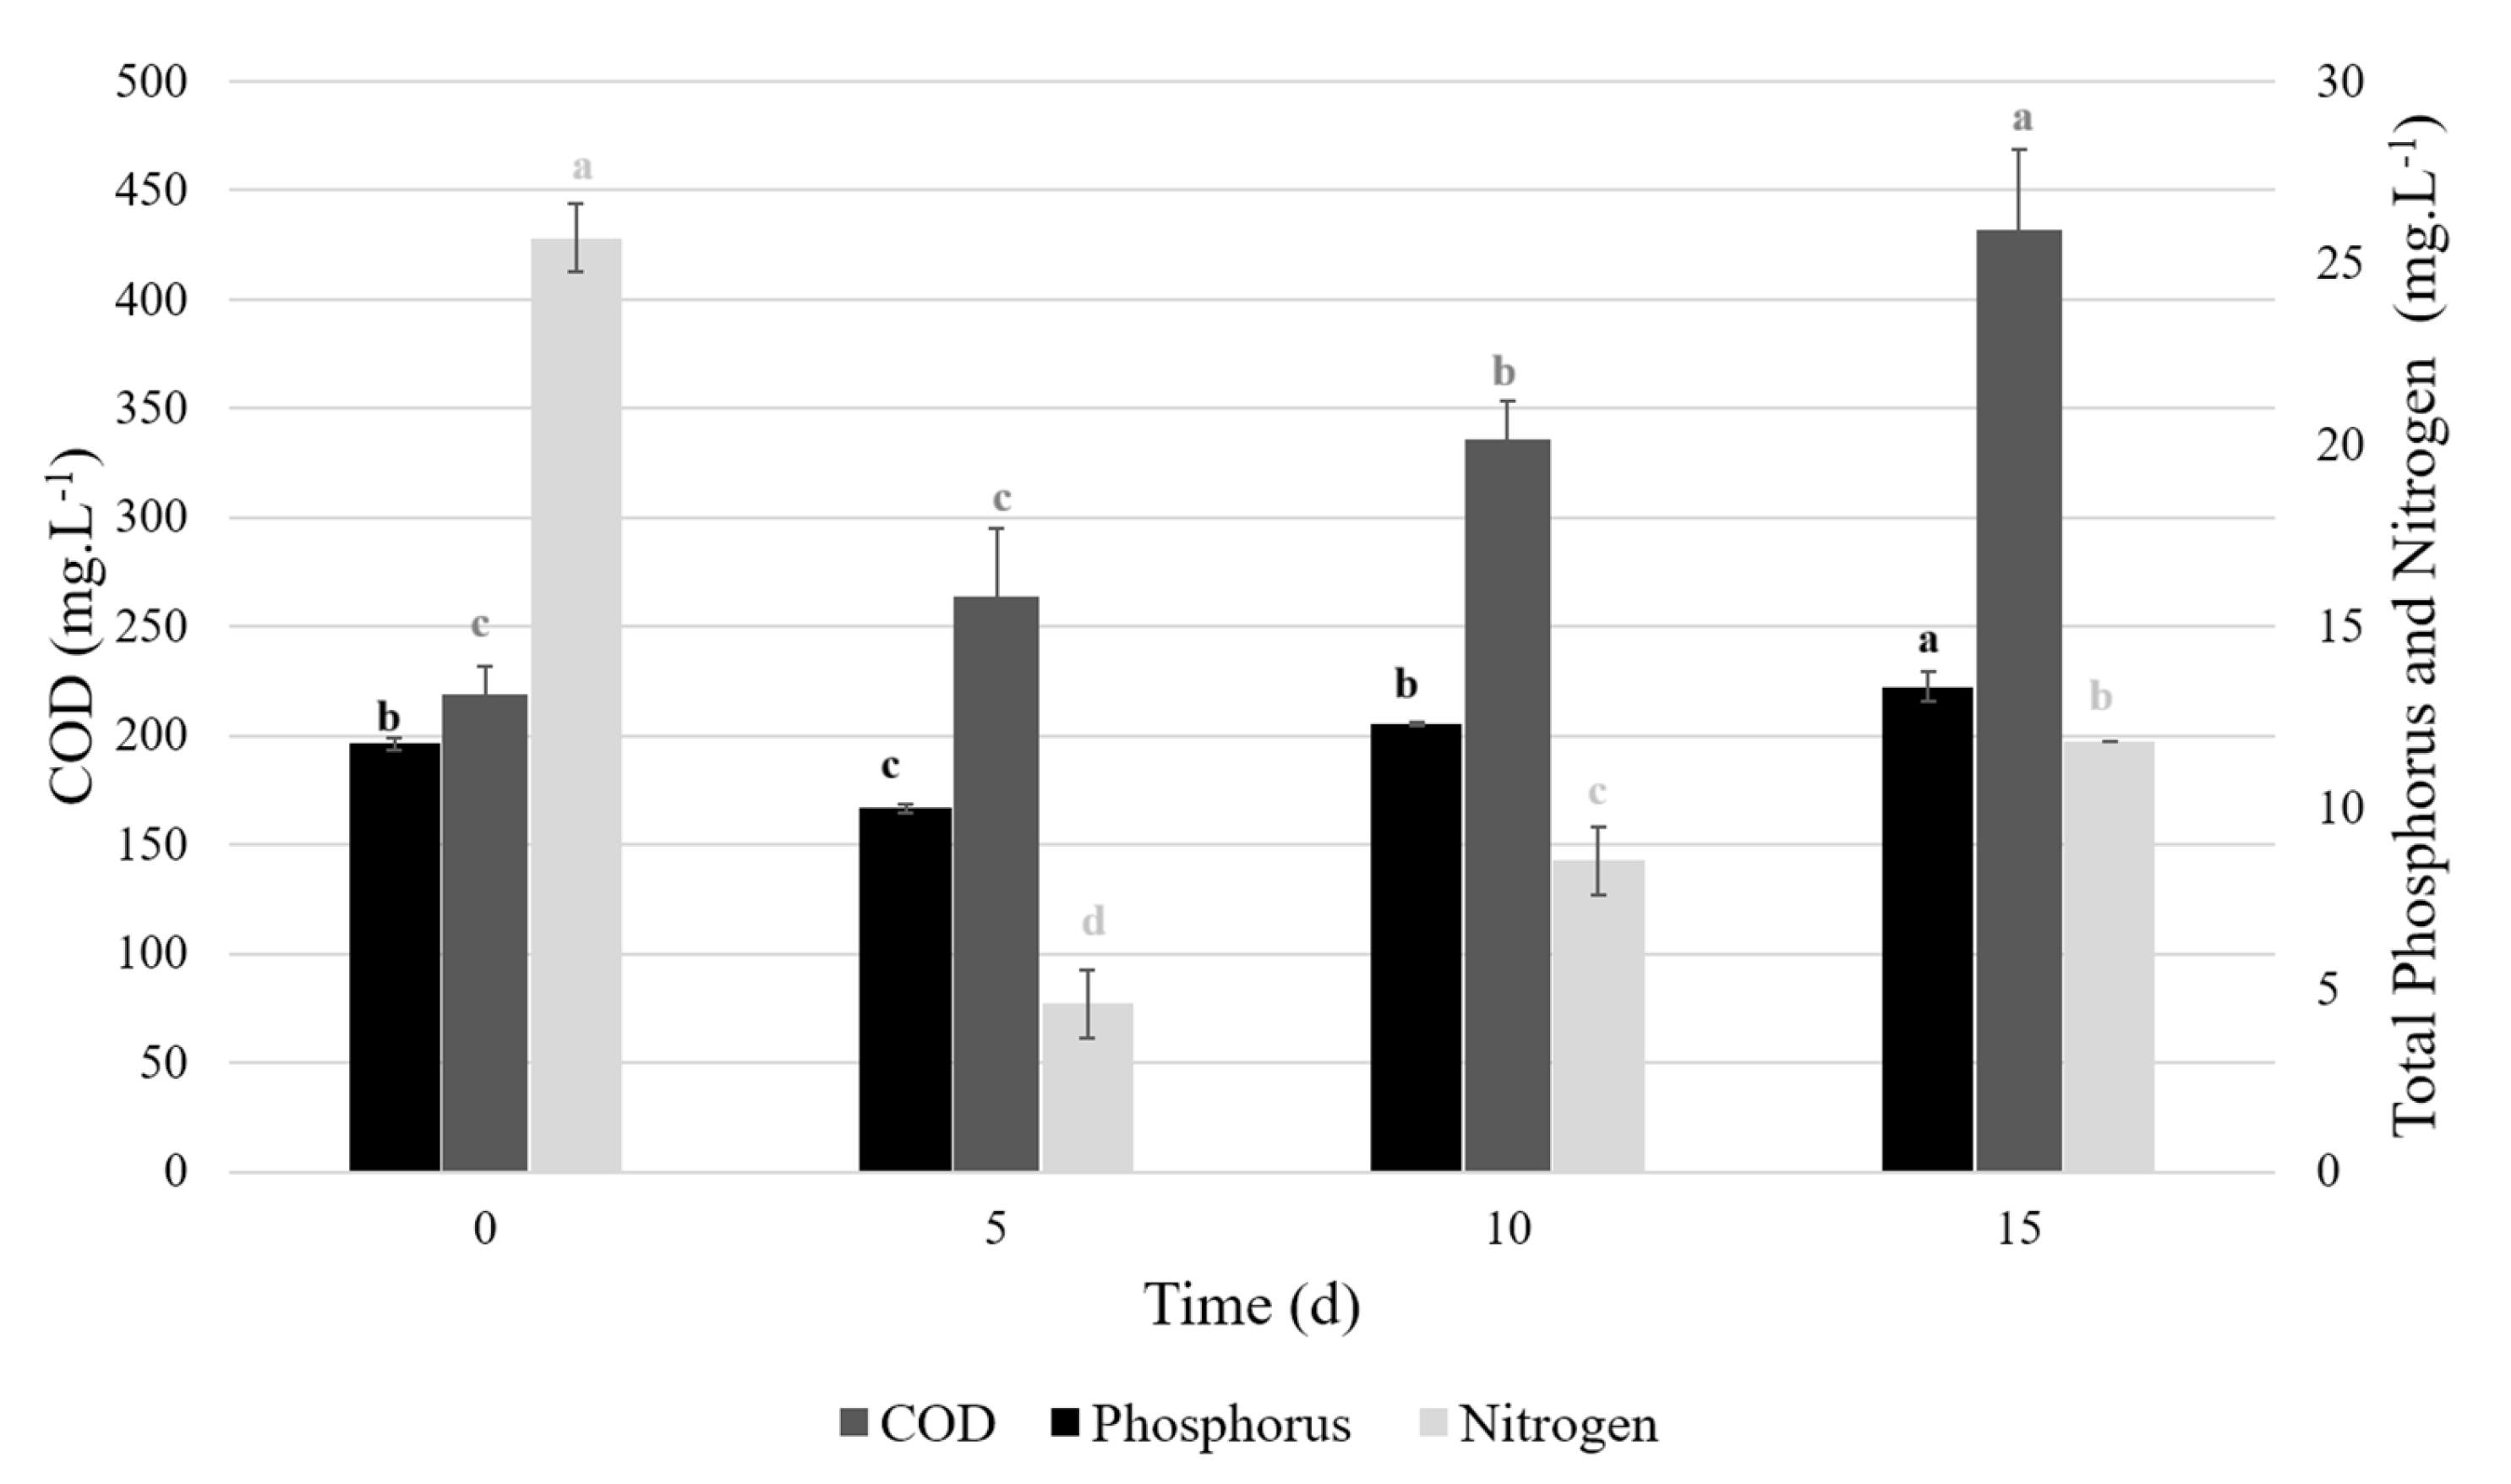
Figure 7 presents the concentrations of COD, nitrogen, and phosphorus during Spirulina cultivation with 10% (v/v) effluent addition in fed-batch mode in a 100 L raceway. An increase in COD was observed over the cultivation period due to the 10% (v/v) effluent additions, corresponding to 3 additions on days 0, 5, and 10 (totaling 30 L of effluent), resulting in a final volume of 110 L in the raceway after each addition. Approximately 91,440 mg of COD, 11,160 mg of total nitrogen, and 1650 mg of total phosphorus were added during cultivation. Considering only the amounts of COD, nitrogen, and phosphorus added through the effluent, the removals after 15 days of cultivation were 48%, 88%, and 11%, respectively, for COD, nitrogen, and total phosphorus.
Magro et al. [17] achieved removals of 25%, 84%, and 33% for COD, nitrogen, and phosphorus, respectively, under laboratory conditions using a similar effluent and the same effluent addition volume. These differences may be attributed not only to the differences in production scale but also to the use of different effluent batches and the distinct light conditions available in the 100 L raceway, which was located in a greenhouse rather than under laboratory conditions.

4. Conclusions

Spirulina achieved higher biomass concentrations than the Spirulina–Scenedesmus consortia in the experiments with effluent supplementation. The addition of effluent during cultivation led to a reduction in carbohydrate content in the biomass, suggesting that the resulting biomass could be applied in agriculture as a biofertilizer or biostimulant, instead of bioethanol production. During cultivation in 20% Zarrouk medium, COD, phosphorus, and nitrogen were effectively removed. To our knowledge, this study is the first to report the use of effluent from the anaerobic digestion of cattle waste at a 100 L raceway scale with fed-batch effluent supplementation. Moreover, the scale-up from 10 L to 100 L for Spirulina cultivation yielded comparable results, demonstrating the stability and reproducibility of the process.

Author Contributions

F.G.M.—Investigation, Methodology, Writing—original draft; Writing—review & editing. A.R.—Writing—review & editing. C.O.R.—Writing—review & editing. L.M.C.—Conceptualization, Supervision, Visualization, Writing—review & editing. All authors have read and agreed to the published version of the manuscript.

Funding

This work was supported by Coordenação de Aperfeiçoamento de Pessoal de Nível Superior, Capes, Finance code 001, and by Conselho Nacional de Pesquisa e Desenvolvimento, Brasil.

Data Availability Statement

The original contributions presented in this study are included in the article. Further inquiries can be directed to the corresponding author.

Conflicts of Interest

The authors declare no conflicts of interest.

Appendix A

Figure A1. Time course of the concentrations of COD, nitrogen and phosphorus in the cultures performed in 10 L raceways. Identical letters in the tests indicate no significant differences at the 95% confidence level (p > 0.05).
Biomass 05 00066 g0a1

References

  1. Sarwer, A.; Hamed, S.; Osman, A.; Jamil, F.; Al-Muhtaseb, A.H.; Alhajeri, N.S.; Rooney, D.W. Algal biomass valorization for biofuel production and carbon sequestration: A review. Environ. Chem. Lett. 2022, 20, 2797–2851. [Google Scholar] [CrossRef]
  2. Figueroa-Torres, G.; Mahmood, W.; Pittman, J.; Theodoropoulos, C. Microalgal biomass as a biorefinery platform for biobutanol and biodiesel production. Biochem. Eng. J. 2020, 153, 107396. [Google Scholar] [CrossRef]
  3. Braun, J.C.A.; Simon, V.; Bortoluzzi, E.C.; Langaro, N.C.; Colla, L.M. Biofertilizers as a potential tool towards sustainable agriculture. Rev. Tecnol. E Soc. 2025, 21, 271–287. [Google Scholar] [CrossRef]
  4. Tang, D.; Khoo, K.; Chew, K.; Tao, Y.; Ho, S.-H.; Show, P.L. Potential utilization of bioproducts from microalgae for the quality enhancement of natural products. Bioresour. Technol. 2020, 304, 122997. [Google Scholar] [CrossRef]
  5. Astolfi, A.L.; Rempel, A.; Cavanhi, V.A.F.; Alves, M.; Deamici, K.M.; Colla, L.M.; Costa, J.A.V. Simultaneous saccharification and fermentation of Spirulina sp. and corn starch for the production of bioethanol and obtaining biopeptides with high antioxidant activity. Bioresour. Technol. 2020, 301, 122698. [Google Scholar] [CrossRef]
  6. Singh, A.; Srivastava, R.; Pal, P.; Mandal, S.; Sahoo, U.K.; Prakash, A.; Sridhar, K.; Sharma, M.; Sarangi, P.K.; Inbaraj, B.S. Microalgal biorefinery as a sustainable and cost-effective platform for co-production of high-value-added products/metabolites: An insight into emerging trends, challenges, and opportunities. Biocatal. Agric. Biotechnol. 2024, 58, 103192. [Google Scholar] [CrossRef]
  7. Cheirsilp, B.; Maneechote, W.; Srinuanpan, S.; Angelidaki, I. Microalgae as Tools for Bio-Circular-Green Economy: Zero-waste Approaches for Sustainable Production and Biorefineries of Microalgal Biomass. Bioresour. Technol. 2023, 387, 129620. [Google Scholar] [CrossRef]
  8. Freitag, J.F.; Fagundes, V.D.; Simon, V.; de Souza Schneider, R.D.C.; Colla, L.M. Life cycle analysis of microalgae bioethanol production scenarios. Biomass Bioenergy 2026, 204, 108398. [Google Scholar] [CrossRef]
  9. Vendruscolo, L.P.; Rubert, A.; Nazari, M.T.; Sossella, F.d.S.; Colla, L.M.; Costa, J.A.V.; Hemkemeier, M. Simultaneous Biomass Production, Carbohydrate Accumulation, and Contaminants Removal Using Malting Wastewater in Microalgae Cultivation. Bioenergy Res. 2023, 17, 612–621. [Google Scholar] [CrossRef]
  10. Malakar, B.; Das, D.; Mohanty, K. Utilization of waste peel extract for cultivation of microalgal isolates: A study of lipid productivity and growth kinetics. Biomass Convers. Biorefin. 2023, 13, 17017–17026. [Google Scholar] [CrossRef]
  11. Beigbeder, J.B.; Lavoie, J.M. Effect of photoperiods and CO2 concentrations on the cultivation of carbohydrate-rich P. kessleri microalgae for the sustainable production of bioethanol. J. CO2 Util. 2022, 58, 101934. [Google Scholar] [CrossRef]
  12. Hultberg, M.; Lind, O.; Birgersson, G.; Asp, H. Use of the effluent from biogas production for cultivation of Spirulina. Bioprocess Biosyst. Eng. 2017, 40, 625–631. [Google Scholar] [CrossRef]
  13. Zeng, X.; Guo, X.; Su, G.; Danquah, M.K.; Zhang, S.; Lu, Y.; Sun, Y.; Lin, L. Bioprocess considerations for microalgal-based wastewater treatment and biomass production. Renew. Sustain. Energy Rev. 2015, 42, 1385–1392. [Google Scholar] [CrossRef]
  14. Jareonsin, S.; Mahanil, K.; Duangjan, K.; Srinuanpan, S.; Pekkoh, J.; Ishii, M.; Pumas, C. Dark mode of microalga—A sustainable and economical solution for microalgal biofuel production and waste treatment. Bioresour. Technol. Rep. 2023, 23, 101574. [Google Scholar] [CrossRef]
  15. Ansari, F.A.; Ravindran, B.; Gupta, S.K.; Nasr, M.; Rawat, I.; Bux, F. Techno-economic estimation of wastewater phycoremediation and environmental benefits using Scenedesmus obliquus microalgae. J. Environ. Manag. 2019, 240, 293–302. [Google Scholar] [CrossRef]
  16. Markou, G. Fed-batch cultivation of Arthrospira and Chlorella in ammonia-rich wastewater: Optimization of nutrient removal and biomass production. Bioresour. Technol. 2015, 193, 35–41. [Google Scholar] [CrossRef]
  17. Paddock, M.B.; Fernández-Bayo, J.D.; VanderGheynst, J.S. The effect of the microalgae-bacteria microbiome on wastewater treatment and biomass production. Appl. Microbiol. Biotechnol. 2020, 104, 893–905. [Google Scholar] [CrossRef] [PubMed]
  18. Vieira Salla, A.C.; Margarites, A.C.; Seibel, F.I.; Holz, L.C.; Brião, V.B.; Bertolin, T.E.; Colla, L.M.; Costa, J.A.V. Increase in the carbohydrate content of the microalgae Spirulina in culture by nutrient starvation and the addition of residues of whey protein concentrate. Bioresour. Technol. 2016, 209, 133–141. [Google Scholar] [CrossRef]
  19. Magro, F.G.; Freitag, J.F.; Bergoli, A.; Costa, J.A.V.; Colla, L.M. Microalgae Consortia for Post-treating Effluent of Anaerobic Digestion of Cattle Waste and Evaluation of Biochemical Composition of Biomass. BioEnergy Res. 2021, 15, 371–384. [Google Scholar] [CrossRef]
  20. John, R.P.; Anisha, G.S.; Nampoothiri, K.M.; Pandey, A. Micro and macroalgal biomass: A renewable source for bioethanol. Bioresour. Technol. 2011, 102, 186–193. [Google Scholar] [CrossRef]
  21. Zaparoli, M.; Ziemniczak, F.G.; Mantovani, L.; Costa, J.A.V.; Colla, L.M. Cellular Stress Conditions as a Strategy to Increase Carbohydrate Productivity in Spirulina platensis. BioEnergy Res. 2020, 13, 1221–1234. [Google Scholar] [CrossRef]
  22. Magro, F.G.; Margarites, A.C.; Reinehr, C.O.; Gonçalves, G.C.; Rodigheri, G.; Costa, J.A.V.; Colla, L.M. Spirulina platensis biomass composition is influenced by the light availability and harvest phase in raceway ponds. Environ. Technol. 2017, 39, 1868–1877. [Google Scholar] [CrossRef]
  23. Rasapoor, M.; Young, B.; Brar, R.; Sarmah, A.; Zhuang, W.Q.; Baroutian, S. Recognizing the challenges of anaerobic digestion: Critical steps toward improving biogas generation. Fuel 2020, 261, 116497. [Google Scholar] [CrossRef]
  24. Akinbomi, J.G.; Patinvoh, R.J.; Taherzadeh, M.J. Current challenges of high-solid anaerobic digestion and possible measures for its effective applications: A review. Biotechnol. Biofuels Bioprod. 2022, 15, 52. [Google Scholar] [CrossRef]
  25. Braun, J.C.A.; Sommer, F.; Sans, G.A.; Rempel, A.; Lângaro, N.C.; Colla, L.M. Microalgal biomass as a partial replacement for chemical fertilizers in barley cultivation. Cad. Pedagógico 2025, 22, e19372. [Google Scholar] [CrossRef]
  26. Maschio, L.D.G.; Tonello, C.Z.; Souza, L.C.B.; Colla, L.M.; Lângaro, N.C. Spirulina platensis no tratamento de sementes de cereais. Contrib. A Las Cienc. Soc. 2025, 18, e19709. [Google Scholar] [CrossRef]
  27. Rempel, A.; de Souza Sossella, F.; Margarites, A.C.; Astolfi, A.L.; Steinmetz, R.L.R.; Kunz, A.; Colla, L.M. Bioethanol from Spirulina platensis biomass and the use of residuals to produce biomethane: An energy efficient approach. Bioresour. Technol. 2019, 288, 121588. [Google Scholar] [CrossRef] [PubMed]
  28. Aditya, L.; Mahlia, T.; Nguyen, L.; Vu, H.P.; Nghiem, L.D. Microalgae-bacteria consortium for wastewater treatment and biomass production. Sci. Total Environ. 2022, 838, 155871. [Google Scholar] [CrossRef] [PubMed]
  29. Wang, Y.; Wang, S.; Sun, L.; Sun, Z.; Li, D. Screening of a Chlorella-bacteria consortium and research on piggery wastewater purification. Algal Res. 2020, 47, 101840. [Google Scholar] [CrossRef]
  30. Chieti, M.; Petrucciani, A.; Mollo, L.; Gerotto, C.; Eusebi, A.; Fatone, F.; Norici, A.; González-Camejo, J. Acclimated green microalgae consortium to treat sewage in an alternative urban WWTP in a coastal area of Central Italy. Sci. Total Environ. 2024, 945, 174056. [Google Scholar] [CrossRef]
  31. Huy, M.; Kumar, G.; Kim, H.W.; Kim, S.H. Photoautotrophic cultivation of mixed microalgae consortia using various organic waste streams towards remediation and resource recovery. Bioresour. Technol. 2018, 247, 576–581. [Google Scholar] [CrossRef]
  32. Bélanger-Lépine, F.; Lemire-Lamothe, M.; Tremblay, A.; Rondeau, S.; Marchand, P.; Huot, Y.; Barnabé, S. Cultivation of an Algae-Bacteria Consortium in a Mixture of Industrial Wastewater to Obtain Valuable Products for Local Use. Ind. Biotechnol. 2020, 16, 33–42. [Google Scholar] [CrossRef]
  33. Koreiviene, J.; Valčiukas, R.; Karosiene, J.; Baltrenas, P. Testing of Chlorella/Scenedesmus microalgae consortia for remediation of wastewater, CO2 mitigation and algae biomass feasibility for lipid production. J. Environ. Eng. Landsc. Manag. 2014, 22, 105–114. [Google Scholar] [CrossRef]
  34. Qin, L.; Wang, Z.; Sun, Y.; Shu, Q.; Feng, P.; Zhu, L.; Xu, J.; Yuan, Z. Microalgae consortia cultivation in dairy wastewater to improve the potential of nutrient removal and biodiesel feedstock production. Environ. Sci. Pollut. Res. 2016, 23, 8379–8387. [Google Scholar] [CrossRef] [PubMed]
  35. Choong, Y.J.; Yokoyama, H.; Matsumura, Y.; Lam, M.K.; Uemura, Y.; Dasan, Y.K.; Kadir, W.N.A.; Lim, J.W. The potential of using microalgae for simultaneous oil removal in wastewater and lipid production. Int. J. Environ. Sci. Technol. 2020, 17, 2755–2766. [Google Scholar] [CrossRef]
  36. Lu, W.; Wang, Z.; Wang, X.; Yuan, Z. Cultivation of Chlorella sp. using raw dairy wastewater for nutrient removal and biodiesel production: Characteristics comparison of indoor bench-scale and outdoor pilot-scale cultures. Bioresour. Technol. 2015, 192, 382–388. [Google Scholar] [CrossRef]
  37. Lv, J.; Guo, J.; Feng, J.; Liu, Q.; Xie, S. A comparative study on flocculating ability and growth potential of two microalgae in simulated secondary effluent. Bioresour. Technol. 2016, 205, 111–117. [Google Scholar] [CrossRef] [PubMed]
  38. APHA American Public Health Association. Standard Methods for the Examination of Water and Wastewater, 19th ed.; American Public Health Association: Washington, WA, USA, 1995. [Google Scholar]
  39. AOAC. Official Methods of Analysis of AOAC International, 17th ed.; Association of Official Analytical Collaboration (AOAC) International: Rockville, MD, USA, 2000. [Google Scholar]
  40. Gómez-Serrano, C.; Morales-Amaral, M.M.; Acién, F.G.; Escudero, R.; Fernández-Sevilla, J.M.; Molina-Grima, E. Utilization of secondary-treated wastewater for the production of freshwater microalgae. Appl. Microbiol. Biotechnol. 2015, 99, 6931–6944. [Google Scholar] [CrossRef]
  41. Costa, J.A.V.; Colla, L.M.; Filho, P.D. Modelling of Spirulina platensis growth in fresh water using response surface methodology. World J. Microbiol. Biotechnol. 2002, 18, 603–607. [Google Scholar] [CrossRef]
  42. Dubois, M.; Gilles, K.; Hamilton, J.; Rebers, P.A.; Smith, F. Colorimetric method for determination of sugars and related substances. Anal. Chem. 1956, 28, 350–356. [Google Scholar] [CrossRef]
  43. Lowry, O.H. Protein measurement with the Folin-Phenol reagent. J. Biol. Chem. 1951, 193, 265–276. [Google Scholar] [CrossRef] [PubMed]
  44. Schmidell, W.; Lima Ude, A.; Aquarone, E.; Borzani, W. Biotecnologia Industrial Vol. 2: Engenharia Bioquímica; Blucher: São Paulo, Brazil, 2001; ISBN 978-85-212-1518-9. [Google Scholar]
  45. Margarites, A.C.; Volpato, N.; Araújo, E.; Cardoso, L.G.; Bertolin, T.E.; Colla, L.M.; Costa, J.A.V. Spirulina platensis is more efficient than Chlorella homosphaera in carbohydrate productivity. Environ. Technol. 2016, 1, 2209–2216. [Google Scholar] [CrossRef]
  46. Fabra, M.; Martínez-Sanz, M.; Gómez-Mascaraque, L.G.; Gavara, R.; López-Rubio, A. Structural and physicochemical characterization of thermoplastic corn starch films containing microalgae. Carbohydr. Polym. 2018, 186, 184–191. [Google Scholar] [CrossRef] [PubMed]
  47. Ho, S.H.; Chen, C.Y.; Chang, J.S. Effect of light intensity and nitrogen starvation on CO2 fixation and lipid/carbohydrate production of an indigenous microalga Scenedesmus obliquus CNW-N. Bioresour. Technol. 2012, 113, 244–252. [Google Scholar] [CrossRef] [PubMed]
  48. Braun, J.C.A.; Balbinot, L.; Beuter, M.A.; Rempel, A.; Colla, L.M. Mixotrophic cultivation of microalgae using agro-industrial waste: Tolerance level, scale up, perspectives and future use of biomass. Algal Res. 2024, 80, 103554. [Google Scholar] [CrossRef]
  49. Pereira, M.; Chagas, B.; Sassi, R.; Medeiros, G.F.; Aguiar, E.M.; Borba, L.H.F.; E Silva, E.P.; Neto, J.C.A.; Rangel, A.H.N. Mixotrophic cultivation of Spirulina platensis in dairy wastewater: Effects on the production of biomass, biochemical composition and antioxidant capacity. PLoS ONE 2019, 14, e0224294. [Google Scholar] [CrossRef]
  50. Bossa, R.; Di Colandrea, M.; Salbitani, G.; Carfagna, S. Phosphorous Utilization in Microalgae: Physiological Aspects and Applied Implications. Plants 2024, 13, 2127. [Google Scholar] [CrossRef]
  51. del Morales-Amaral, M.M.; Gómez-Serrano, C.; Acién, F.G.; Fernández-Sevilla, J.M.; Molina-Grima, E. Outdoor production of Scenedesmus sp. in thin-layer and raceway reactors using centrate from anaerobic digestion as the sole nutrient source. Algal Res. 2015, 12, 99–108. [Google Scholar] [CrossRef]
  52. Scherer, M.D.; de Oliveira, A.C.; Filho, F.J.C.M.; Ugaya, C.M.L.; Mariano, A.B.; Vargas, J.V.C. Environmental study of producing microalgal biomass and bioremediation of cattle manure effluents by microalgae cultivation. Clean Technol. Environ. Policy 2017, 19, 1745–1759. [Google Scholar] [CrossRef]
  53. Hena, S.; Znad, H.; Heong, K.T.; Judd, S. Dairy farm wastewater treatment and lipid accumulation by Arthrospira platensis. Water Res. 2018, 128, 267–277. [Google Scholar] [CrossRef]
Figure 1. Cell growth of microalgae (cell mL−1) with and without effluent addition. (a) Experiment 1 (50% Spirulina e 50% Scenedesmus), (b) Experiment 2 (50% Spirulina e 50% Scenedesmus + effluent), (c) Experiment 3 (100% Spirulina), (d) Experiment 4 (100% Spirulina + effluent).
Biomass 05 00066 g001aBiomass 05 00066 g001b
Figure 2. Growth curve (OD670) for the cultivation of Spirulina and Spirulina + Scenedesmus consortium, with and without effluent addition (10% (v/v) of anaerobic digestion of cattle waste). Experiments: (1) 50% Sp + 50% Sc; (2) 50% Sp + 50% Sc; (3) 100% Sp; (4) 100% Sp.
Biomass 05 00066 g002
Figure 3. Biomass concentration (g/L) of Spirulina or Spirulina + Scenedesmus during cultivation with or without effluent addition. Experiments: (1) 50% Sp + 50% Sc; (2) 50% Sp + 50% Sc; (3) 100% Sp; (4) 100% Sp. Average values of tests performed in duplicates ± standard deviation. Identical letters in the tests indicate no significant differences at the 95% confidence level (p > 0.05).
Biomass 05 00066 g003
Figure 4. Percentual (%) of intracellular carbohydrate in the biomass (a) and volumetric carbohydrate productivity (g·L−1·day−1) (b) for the experiments of Spirulina or Spirulina + Scenedesmus during cultivation with or without effluent addition. Experiments: (1) 50% Sp + 50% Sc; (2) 50% Sp + 50% Sc; (3) 100% Sp; (4) 100% Sp. Average values of tests performed in duplicates ± standard deviation. Identical letters in the tests indicate no significant differences at the 95% confidence level (p > 0.05).
Biomass 05 00066 g004
Figure 5. Percentual (%) of intracellular proteins in the biomass (a) and volumetric protein productivity (g·L−1·day−1) (b) for the experiments of Spirulina or Spirulina + Scenedesmus during cultivation with or without the effluent addition. Experiments: (1) 50% Sp + 50% Sc; (2) 50% Sp + 50% Sc; (3) 100% Sp; (4) 100% Sp. Average values of tests performed in duplicates ± standard deviation. Identical letters in the tests indicate no significant differences at the 95% confidence level (p > 0.05).
Biomass 05 00066 g005
Figure 6. (OD670), Cell count (cell mL−1) and Biomass concentration (red line) measured through the relation of absorbance at 670 nm and cell concentration throughout o standard curve, during cultivation. Arrows indicate the addition of effluent after the culture reached 0.5 g/L of biomass.
Biomass 05 00066 g006
Figure 7. Concentration of COD, nitrogen and phosphorus in the culture medium. Average values of tests performed in duplicates ± standard deviation. Same letters in the columns with the same color indicate that they showed no significant difference in the 95% confidence level (p > 0.05).
Biomass 05 00066 g007
Table 1. Study design for Spirulina and Scenedesmus cultivations in consortia in 10 L raceways, and results of cell counts and the kinetic parameter (µmax).
Scenedesmus obliquusSpirulina platensis
Experiments *Effluent AdditionXmax (cells mL−1)µmax (d−1)Xmax (cells mL−1)µmax (d−1)
(1) 50% Sp + 50% ScNo1.15 × 104 ± 7.51 × 10² a0.11 ± 0.01 b1.02.104 ± 2.21 × 10² a0.40 ± 0.00 a
(2) 50% Sp + 50% ScYes2.11 × 104 ± 3.89 × 10³ a0.19 ± 0.02 a1.56.103 ± 1.77 × 10² c0.25 ± 0.03 b
(3) 100% Sp No--5.05.103 ± 2.19 × 10² b0.10 ± 0.01 c
(4) 100% Sp Yes--8.44.103 ± 8.84 × 10² a0.25 ± 0.02 b
* Proportions of each microalga to obtain the initial concentration of 0.15 gcells/L (-). Fields without values refer to pure cultivation, with no cells of these species. μmax: maximum specific growth rate (d−1). Xmax: Final biomass concentration (Xf) (cells mL−1). Identical letters in the tests indicate no significant differences at the 95% confidence level (p > 0.05).
Table 2. Percents (%) and volumetric productivities (g·L−1·day−1) of carbohydrates and proteins during the cultivation of Spirulina platensis in 100 L—raceway with the addition of 10% of effluent (v/v) every 5 days.
Time of Cultivation (days) *Carbohydrates
(%)
Proteins
(%)
PCHO
(g·L−1·day−1)
PPTN
(g·L−1·day−1)
013.189 ± 0.726 a69.380 ± 4.431 a0.084 ± 0.005 a0.441 ± 0.028 a
512.731 ± 2.479 a51.001 ± 3.989 b0.020 ± 0.004 c0.081 ± 0.006 b
1025.095 ± 1.353 b51.141 ± 2.071 b0.028 ± 0.002 bc0.058 ± 0.002 b
1528.807 ± 3.912 b55.030 ± 2.671 b0.032 ± 0.004 b0.061 ± 0.003 b
The time “day 0” is counted after the culture reaches 0.5 g·L−1, corresponding to the start of effluent addition to the culture. Identical letters in the tests indicate no significant differences at the 95% confidence level (p > 0.05). * Proportions of each microalga to obtain the initial concentration of 0.15 g cells/L (-).
Disclaimer/Publisher’s Note: The statements, opinions and data contained in all publications are solely those of the individual author(s) and contributor(s) and not of MDPI and/or the editor(s). MDPI and/or the editor(s) disclaim responsibility for any injury to people or property resulting from any ideas, methods, instructions or products referred to in the content.