Article

Biomass Demineralization and Pretreatment Strategies to Reduce Inhibitor Concentrations in Itaconic Acid Fermentation by Aspergillus terreus

by
Gregory J. Kennedy
1,*,
Michael J. Bowman
1,
Kim L. Ascherl
2,
Nancy N. Nichols
1 and
Badal C. Saha
1
1
USDA, Agricultural Research Service, National Center for Agricultural Utilization Research, Bioenergy Research Unit, 1815 N. University, Peoria, IL 61604, USA
2
Bio-Oils Research Unit, 1815 N. University, Peoria, IL 61604, USA
*
Author to whom correspondence should be addressed.
Biomass 2024, 4(4), 1122-1141; https://doi.org/10.3390/biomass4040062
Submission received: 16 August 2024 / Revised: 26 September 2024 / Accepted: 22 October 2024 / Published: 27 October 2024

Abstract

Itaconic acid (IA) is a platform chemical, derived from non-petroleum sources, produced through the fermentation of glucose by Aspergillus terreus. However, producing IA from alternative sugar sources (e.g., lignocellulose) has been shown to be problematic, requiring post-hydrolysis mitigation to allow growth and IA production by the fungus. It is well known that the side products of lignocellulosic biomass conversion to sugars act as microbial growth inhibitors. An uncommon feature of fungal organic acid fermentations is production inhibition caused by mineral ions in biomass hydrolysate after pretreatment and enzymatic hydrolysis. To minimize mineral introduction during pretreatment and hydrolysis, we determined the sources of growth and production inhibitors at each of these steps. Biomass demineralization and four pretreatment strategies were evaluated for inhibitor introduction. Dilution assays determined the approximate degree of inhibition for each hydrolysate. An ammonium hydroxide pretreatment of demineralized wheat straw presented the lowest concentration of inhibitors and concomitant lowest inhibition: subsequent fermentations produced 35 g L−1 IA from wheat straw hydrolysate (91 g L−1 sugar) without post-hydrolysis mitigation.

Graphical Abstract

1. Introduction

Itaconic acid (2-methylidenebutanedioic acid; IA) is a high-value organic acid industrially produced from glucose by A. terreus fermentation [1]. IA can be used for the production of a range of products in medicine, agriculture, and the chemical industry. As a platform chemical, it has uses in plastics, resins, surfactants, and detergents derived from renewable biomass instead of petroleum [2,3,4]. For a biobased economy to become economically feasible, a diverse catalog of products derived from whole biomass is required [5]. Cost reduction in production processes for chemicals and fuels, by using the various sugars derived from lignocellulosic biomass, has been the focus of many studies [6,7]. Enzymatic release of sugars from lignocellulose feedstocks requires pretreatment. This is often a combination of physical; chemical; and/or thermal conditions to render the lignocellulose matrix accessible [8]. This need for pretreatment combined with the complex composition of lignocellulosic biomass often generates undesired side products that can reduce the fermentative yield of the desired product.
Producing IA from lignocellulosic sugar sources has proven difficult due to inhibition by undesired side products [9]. Sources of microbial growth inhibitors can come from sugar degradation products (e.g., furfural and 5-hydroxymethylfurfural (HMF)); acetic acid from hemicellulose; and phenolic compounds from lignin degradation [10]. Additionally, IA fermentations using A. terreus are sensitive to trace elements and ions, particularly Mn2+ and PO43− [11,12,13]. Saha et al. [13] have also shown other ions, including Fe3+, Mg2+, and Ca2+, have the capacity for inhibition at high concentrations. While high concentrations of some ions would not be expected from many traditional sugar sources such as sugar cane and starch-rich crops, they must be considered when using lignocellulosic biomass hydrolysates. Multiple strategies for mitigating and/or detoxifying have been demonstrated for a wide range of fermentations. Physical and chemical strategies often used include activated charcoal [14], over-liming [15], ion exchange [16], or electrodialysis [17]. Biological abatement using Coniochaeta ligniaria has been shown to be effective in remediating dilute acid pretreated corn stover of phenolics, furans, and acetic acid [18]. Evaporation, often used for concentrating sugars, can effectively remove volatile compounds (e.g., furfural and acetic acid) [19].
Multiple research efforts demonstrated IA production from various biomass sources, yielding from 0.6 to 49.6 g L−1 of IA [16,20,21,22,23,24,25]. These efforts have confirmed the need for post-hydrolysis inhibition mitigation (detoxification) of lignocellulosic hydrolysates, in which lower yields were observed with the unmitigated hydrolysate. Each method of hydrolysate detoxification has its merits and deficiencies. Due to the complex nature of hydrolysates, multiple steps are often required, and each step adds cost and time to the preparation of the substrate. Additional detoxification steps make the production of IA from hydrolysates less appealing. While recent studies show improved IA yield from lignocellulosic biomass hydrolysates undergoing fewer mitigation steps [16,25], research was still needed to determine the sources of inhibitors accumulated during various pretreatment processes and those inherent in the biomass source. The determination of inhibitor sources would allow for the development of tailored processes that minimize inhibitor production from a specific biomass source. In the present study, a process to produce a wheat straw hydrolysate (WSH) with no need for post-hydrolysis detoxification enables the production of IA at industrially relevant concentrations by A. terreus.

2. Materials and Methods

2.1. Pretreatment of Wheat Straw

Wheat straw (WS) was purchased locally (central Illinois, IL, USA). WS was air-dried to approximately 5% moisture, milled using a hammer mill to 1.27 mm size, and stored under dry conditions at room temperature [26]. Prior to “conventional” pretreatment, WS was treated in two separate process streams. One portion designated as raw WS (rWS) was used “as is”, while the other portion was demineralized by statically soaking 50 g wheat straw in one liter of 1% (v/v) HCl in water for 24 h in glass bottles at room temperature. Biomass was recovered by filtration and washing with 3 L 18 MΩ deionized (DI) water to neutral pH and a 99.1% reduction in conductivity to provide washed, demineralized wheat straw (dWS). The material was then oven-dried at 55 °C for 24 h. Four representative pretreatments were conducted on both rWS and dWS, each in duplicate. Dilute sulfuric acid pretreatment (DSA) materials were prepared by the procedure described in [26]; briefly, 15 g rWS or dWS in 100 mL 0.75% (v/v) H2SO4 (in water) was heated to 160 °C for 10 min holding time. Hydrothermal pretreatment (HTP) materials were similarly treated with the following modification: 15 g rWS or dWS in 100 mL DI water was heated at 200 °C for 10 min holding time. Calcium hydroxide pretreatment (CHP) materials were prepared by combining 15 g rWS or dWS and 1.5 g Ca(OH)2 in 100 mL DI water at 160 °C for 10 min holding time. Ammonium hydroxide pretreatment (AHP) materials were prepared by the procedure described previously [27]. Briefly, 4.9 g of 28% (w/v) ammonium hydroxide was added to 6 g of rWS or dWS, mixed thoroughly, and incubated statically at 110 °C for 48 h. After the AHP, the material was dried in a fume hood for 24 h to remove ammonia. All pretreatments were conducted in high-temperature infrared-heated 200 mL rotating sealed stainless-steel reactors with a heating rate of 2.5 °C min−1 and a cooling rate of 6 °C min−1 (Labomat BFA-12v200, Mathis USA, Inc. Concord, NC, USA). Reactors were constructed of 1.4435 stainless-steel with an approximate composition of 62% iron, 18% chromium, 14% nickel, 3% molybdenum, 2% manganese, 1% silica, and less than 1% of carbon, phosphorous, and sulfur [28]. Control vessels, without wheat straw, were treated under the same conditions to confirm stainless steel as a potential process source of ions.

2.2. Enzyme Buffer Exchange and Hydrolysis of Wheat Straw

Cellulase and hemicellulase enzyme mixture (Cellic Ctec2®) used in this study was purchased from Sigma, St. Louis, MO, and contains a blend of activities including cellulases, ß-glucosidases, and hemicellulase, which together depolymerize biomass carbohydrates to monomeric sugars. The commercial enzyme solution was buffer exchanged using a size-exclusion AKTA FPLC chromatography system (GE Healthcare, Uppsala, Sweden) using P6-DG resin gel (Bio-Rad, Hercules, CA, USA) in a 5 cm × 50 cm glass column and an isocratic elution with 50 mM sodium citrate buffer (pH 5.0). A total of 15 mL of the enzyme was desalted at a flow rate of 10 mL min−1 while monitoring conductivity and UV (λ = 254). Two fractions were collected, the early eluting protein fraction as determined by UV, whereas the second late eluting fraction contained the salts present in the enzyme preparation as determined by in-line conductivity measurements. This buffer exchange step diluted the enzyme by approximately 20 times. This dilution was accounted for during enzyme hydrolysis and the protein fraction was re-assayed to quantify the retained enzymatic activities. Carboxymethyl cellulase (CMCase), β-glucosidase, xylanase, β-xylosidase, and α-l-arabinofuranosidase activity assays were conducted as described previously [15]. Filter paper activity was assayed as described by Xiao et al. [29] and expressed as filter paper unit (FPU). The assays were performed at pH 5.0 and 50 °C. The activities are reported in terms of international units (IU, μmol product formed per min) and conducted in triplicate with the mean reported. The enzyme protein content was determined using the Bradford protein assay (Bio-Rad, Hercules, CA, USA). Due to pH adjustment and dilution of the buffer exchanged enzyme increasing the volume of the reactions, the enzymatic hydrolysis of pretreated wheat straw was performed at 125 g solids per L (12.5%) for DSA, CHP, and HTP. Prior to enzymatic hydrolysis, pH was adjusted to 5.0 with either solid Ca(OH)2 (DSA), concentrated H2SO4 (CHP), or 0.5 M NaOH (HTP). After the evaporation of ammonia from AHP no pH adjustment was needed; therefore, AHP was resuspended directly in 50 mM citrate buffer pH 5.0 prior to the start of enzymatic hydrolysis at 200 g solids per L (20%). With an enzyme loading of 5 FPU per g wheat straw, hydrolysis was carried out over 72 h with rotational mixing at 45 °C in a hybridization oven (HYBAID H-9360, Marshall Scientific, Cambridge, MA, USA). Solids were removed by coarse filtration followed by filter sterilization (Thermo Scientific Nalgene, PES Filter, 0.22 micron).
For comparison of pre- and post-hydrolysis detoxification, a portion of rDSA wheat straw hydrolysate was subjected to multi-step post-enzymatic hydrolysis inhibitor mitigation. In the first step, rDSA hydrolysate was treated for 60 min at 30 °C and shaken at 120 rpm with 5.0% (w/v) powdered activated charcoal, followed by filtration of the charcoal residue, as described by Mussatto and Roberto [14]. In the second step, ion removal was accomplished using 10 g mixed ion exchange resin AG501-X8(D) (BioRad, Hercules, CA, USA) per L mixed at 120 rpm, 30 °C for 60 min. This step was repeated at which point the conductivity of the rDSA had been reduced by ~99%. Conductivity was measured using an Orion Star A215 m (Thermo Scientific). Note that sugar losses were observed following these post-enzymatic mitigation steps. To allow for comparison to clean sugar (i.e., standard) and unmitigated WSH fermentations, sugar concentrations were returned to their original levels by the addition of these depleted sugars followed by filter sterilization.

2.3. Fungal Strain and Inoculum Preparation

Fermentations were conducted utilizing A. terreus strain NRRL 1972 obtained from ARS Culture Collection (Peoria, IL, USA). The strain was stored in the form of conidiospores at −80 °C as a 70% glycerol stock. Unless otherwise specified, conidiospores (spores) were utilized for inoculation. The spores were collected from 7- to 9-day-old cultures on Czapek–Dox agar Petri plates incubated at 30 °C by shaving and extracting spores using sterile deionized water with 0.04% (v/v) Tween 80. Spore counts for inoculum were performed using a hemocytometer and diluted with sterile deionized water such that the final concentration was 106 spores per mL of the medium. In specific fermentations, seed cultures were utilized, which started with 2 × 10⁷ spores per mL of medium, and were grown in 125 mL Erlenmeyer flasks with 25 mL medium using foam stoppers at an initial pH of 3.1, at 33 °C in a rotary shaker at 200 rpm for two days. A 5% v/v dilution of these seed cultures were used in specified fermentations.

2.4. Cultivation of A. terreus

Unless otherwise stated, the mineral medium (A) used for testing inhibitor levels contained 0.8 g KH2PO4, 3 g NH4NO3, 1 g MgSO4·7H2O, 5 g CaCl2· 2 H2O, 1.67 mg FeCl3·6H2O, 8 mg ZnSO4·7H2O, and 15 mg CuSO4·5H2O per L (concentrations represented in Figure 1 and Figure 2 as green dotted lines, ideal concentrations for A. terreus strain NRRL 1972 IA production) [13]. Inductively Coupled Plasma-Optical Emission Spectrometry (ICP-OES) analysis indicated this media preparation contained <1 μg L−1 Mn2+. IA production inhibition levels for PO43−, Mn2+, Fe3+, Mg2+, K+, Ca2+, Cu2+, acetic acid, furfural, and HMF were previously tested at various concentrations [9,13,30]. Variations to mineral medium (A), relating to the strong inhibition interactions between PO43−, Mn2+, and Fe3+, are described in the discussion. This study adds determinations of inhibitory levels for Ni2+ and Cr3+ following the previously used protocols [30]. For establishing inhibition levels, 80 g L−1 mixed sugar, containing glucose–xylose–arabinose at a weight ratio of 4:3:1, was used. Seed cultures were grown in mineral media (A) with 50 g glucose per L as substrate before being added to fermentations at (5% v/v).
Mineral medium (B) was optimized for IA production in the presence of low levels of Mn2+ [31] and used for the hydrolysate inhibitor dilution bioassay of the multiple versions of WSH. Mineral medium B contained 0.08 g KH2PO4, 3 g NH4NO3, 1 g MgSO4·7H2O, 5 g CaCl2· 2 H2O, 0.84 mg FeCl3·6H2O, 8 mg ZnSO4·7H2O, and 45 mg CuSO4·5H2O per L. The media was supplemented with 80 g L−1 mixed sugar (glucose–xylose–arabinose weight ratio of 4:3:1), mimicking the sugar composition of wheat straw hydrolysate (sugar and media solution subsequently termed mock WSH). To remove any contaminating Mn2+ from chemical grade sugars, each was separately dissolved in deionized water and passed through a column of Dowex 50-X8 cation exchange resin [11]. Sugars and all other components were added from sterile stock solutions. Unless otherwise stated, the initial pH of the medium (pHi) excluding CaCl2 was adjusted to 3.1 with 0.5 M H2SO4 followed by the addition of CaCl2 and inoculation with the spore preparation. Fermentations were performed in MTP [30] where pH was not controlled. Briefly, 100 µL fermentations containing WSH diluted with mock WSH (dilution ratios of 1.5, 2, 5, 10, 20, and 50) and spore suspension were shaken at 950 rpm, incubated at 33 °C for 7 days in a 96-well (400 µL well capacity) Nunc Edge MTP (ThermoFisher Scientific, Waltham, MA, USA) with sterile DI water added to the surrounding moat, lidded, and wrapped in parafilm. MTP cultures were incubated in a thermoshaker incubator (MB 100-4A, Allsheng Inst. Co., Hangzhou City, China).
dWS pretreated with ammonium hydroxide and enzymatically hydrolyzed (dAHP) was used for scaled-up flask fermentations. Flask fermentations also employed the media components (media B) optimized for contaminating levels of Mn2+ described for the MTP bioassay [31]. However, dAHP WSH preparations were analyzed for ions present, followed by supplementation of any components present at lower than optimal concentrations with dry salts to the optimal levels with pH adjustment to 3.1 (or 2.5 when utilizing seed cultures) using 0.5 M H2SO4 followed by filter sterilization. Shake flask fermentations were performed with 25 mL medium in 125 mL Erlenmeyer flasks using foam stoppers, an initial pH of 3.1, and 33 °C in a rotary shaker at 200 rpm for up to 12 days. Dissolved oxygen (DO) was monitored continuously utilizing sensor spots and a shake flask reader (PreSens SFR System and PreSens Software V1.2.0, Regensburg, DE, Germany). For fermentations in which seed culture was used, the initial pH of media/hydrolysate was reduced to 2.5 using 0.5 M H2SO4. The pH drifts down from this starting point during the fermentations. All fermentation experiments were performed in triplicate. Sugars, charcoal, furfural, HMF, acetic acid, and media components were purchased from Millipore Sigma, St. Louis, MO, USA.

2.5. Analytical Procedures

Sugars (glucose, xylose, arabinose, and galactose), organic acids (IA and propionic acid), hydroxymethyl furfural (HMF), and furfural were quantified by using high-performance liquid chromatography (HPLC, Shimadzu Prominence Series (Shimadzu America, Inc., Columbia, MD, USA)) as previously described [13]. In separate analyses, sugars (Aminex HPX-87P column, 300 × 7.8 mm with deashing and Carbo-P guard cartridge maintained at 85 °C, elution with 18 MΩ water at a flow rate of 0.6 mL/min) and organic acids (Aminex HPX 87H column, 300 × 7.8 mm with a Cation-H guard cartridge maintained at 65 °C, isocratic elution with 5 mM H2SO4 prepared using 18 MΩ water at a flow rate of 0.5 mL/min) were determined. The peaks were detected by refractive index or UV absorption at 210 nm and were identified and quantified by comparison with authentic standards. Propionic acid (1%, w/v) was used as an internal standard to be used for calculating an estimate of evaporative loss during the shaken aerobic fermentation.
Ions PO43−, SO42−, NO33−, Cl, and NH4+ were quantified by HPLC using a Dionex Dual Ion Chromatography System, ICS 1500/2000 (Thermo Scientific Dionex, Sunnyvale, CA, USA) and Chromeleon 7.2 software. Elution of anions was accomplished on an IonPac AS18 column with an IonPac AG18 guard column using an isocratic 32 mM KOH eluent at a flow rate of 1 mL min−1. Column and detector temperatures were maintained at 30 °C with a post-column suppression system AERS 500 at 80 mA. Elution of cations was accomplished on an IonPac CS12 column with an IonPac CG1359 guard column using an isocratic 11 mM methanesulfonic acid eluent at a flow rate of 1.5 mL min−1. Column and detector temperatures were maintained at 30 °C with a post-column suppression system CSRS 500 at 44 mA. The peaks were detected by conductivity (DS6). The injection volume was 25 mL with a lower limit of detection at 1 µM.
Elemental analysis was performed using a Perkin-Elmer Optima 7000DV (Shelton, CT, USA) Inductively Coupled Plasma-Optical Emission Spectrometer (ICP-OES). A three-point calibration curve was constructed using samples prepared from an external 1000 mg/L standard by appropriate individual dilution. An independent verification sample was prepared and tested before and after all samples. All samples were diluted 1:10 volumetrically before they were tested using five replicates. The concentration was calculated using the peak area, with seven peaks per point. Each sample was measured in triplicate.
Cell dry weight (CDW) was measured at the final time point of flask cultivations using the dry weight of a twice-rinsed cell pellet dried at 60 °C until constant weight was achieved. pH was monitored using a Beckman pH meter with gel-filled probe. The pH of the medium after fermentation in MTP was visualized using a 0.04% (w/v) thymol blue in water solution as described [30]. Growth in MTP was photographed for qualitative comparison purposes. Spore counts and pellet images were captured using an Olympus BX60 microscope with a DP70 camera (Olympus Scientific Corp., Waltham, MA, USA).

2.6. Data Analysis

All pretreatment and hydrolysis experiments were performed in duplicate with averages and ranges reported. The fermentation experiments were performed in triplicate with averages and standard deviations reported. For IA production inhibition thresholds, lines were fitted using IA yields (triplicate average fermentation) over a range of inhibitor concentrations (r2 > 0.85) using Excel (Microsoft Version 2408). The inhibition threshold was defined as the concentration of ion/inhibitor that would achieve a 30% drop in IA yield after 7 days of fermentation as compared to the maximum of the positive control from the same data set.

3. Results and Discussion

3.1. Fermentation of Detoxified Dilute Sulfuric Acid Pretreated Raw Wheat Straw Hydrolysate

Using the DSA pretreated and enzyme hydrolyzed raw wheat straw (rDSA) as a substrate showed no IA production even when diluted 100 times with mock WSH [30]. As a demonstration of common post-hydrolysis strategies to overcome inhibition, a two-step mitigation was performed on a subset sample of the rDSA WSH. First, rDSA was treated with activated charcoal followed by ion removal with ion exchange resin. This resulted in a sugar solution that was fermentable and with an IA yield from A. terreus NRRL 1972 of 35.7 ± 5.0 g L−1 in 168 h from 80.1 g L−1 mixed sugars. While this two-step process demonstrated the ability to detoxify effectively, it was unsatisfactory in three ways. First, this kind of detoxification is costly when scaled up, undermining the presumption that lignocellulosic biomass substrate serves as a cheap alternative to glucose. Second, sugar loss is common during detoxification steps. Third, this result provides little information on the quantities and sources of inhibitors during the pretreatment and enzymatic hydrolysis process. It is also worth noting that both steps were required for complete inhibitor detoxification; using either of the steps singly was ineffective in producing IA from rDSA.

3.2. Demineralization of Wheat Straw

Previous studies have demonstrated the need to limit many ions to achieve a successful IA fermentation utilizing A. terreus [9,13,30,31]. Typically, this is achieved by controlling the inputs when formulating the media and utilizing clean sugar substrates. However, utilization of biomass as a source of sugars causes the introduction of minerals and ions of uncontrolled quantities inherently present in biomass, a serious obstacle to successful IA production. Demineralizing the biomass prior to pretreatment leverages the relative insolubility of cellulose and hemicellulose to conveniently wash out ions without the need for ion exchange resin. The process of demineralizing has been shown to effectively remove ash (i.e., ions and minerals) prior to biomass use in thermochemical conversion processes, which reduces slagging, catalyst poisoning, and corrosion of production equipment [32,33]. Recently, Hörhammer et al. [34] and He et al. [35] demonstrated improved sugar yield and ethanol production as a result of demineralizing poplar wood chips and corn stover, respectively, prior to pretreatment. They attributed this improvement to the reduction in the buffering capacity of the biomass. We used low-temperature dilute acid incubation and leaching washes to maximize the mineral ion depletion from wheat straw while leaving the structural components of the biomass relatively unchanged [32,33,36]. Wheat straw mass loss from demineralization was 4.62 ± 1.44%. Leachate was analyzed for ion content and related back to the starting wheat straw mass. Demineralization removed 0.23 ± 0.01 mg Mn2+, 1.48 ± 0.01 mg Ca2+, 8.22 ± 4.4 mg K+, 0.70 ± 0.01 mg Mg2+, and 1.85 ± 0.02 mg PO43− per g wheat straw. These ion reductions are important for the final ion concentration when considering WSH was produced using 125 to 200 g L−1 of wheat straw. Figure 1a,b,d–f illustrate the removal of ions from rWS.

3.3. Enzymatic Hydrolysis of Pretreated Wheat Straw

The inhibitory effect of cellulolytic enzyme preparations on IA production has been demonstrated with two different enzyme preparations [13,16]. In this study, a third enzyme preparation was used (Cellic Ctec2®). To eliminate the enzyme formulation ionic content as an inhibition source, the commercially available enzyme was subjected to desalting by size-exclusion chromatography using saccharification buffer as the eluent. Two fractions were collected: an early protein fraction determined by UV and a later eluting ion fraction determined by conductance. The ion content and enzyme activity of the protein fraction are shown in Table 1. Buffer exchange removed the bulk of ions present in the original enzyme solution, with marginally reduced enzyme activity. Several ions present in low concentrations were not effectively removed (Cu2+, Ni2+, Cr3+, and Fe3+) from the protein fraction. Many cellulolytic enzymes utilize metal cofactors in which the ion is held relatively tightly to the protein and would, thus, remain with the enzyme during chromatographic separation [37].
Sugar yields from the enzymatic hydrolysis of the various pretreatment conditions are in Table 2. The pretreatments selected had been previously determined to be effective at sugar release from similar biomass sources [26,27]. While the optimum sugar release may be obtained under slightly different conditions, these conditions were used to generate inhibitors typical of these pretreatments. Aside from DSA, it was observed that demineralizing WS improved sugar yield when compared to rWS by 13–44% (Table 2), confirming the results reported for other demineralized biomass substrates [34,38]. These four pretreatments rely on high or low pH to aid in pretreatment. After the WS has been demineralized, the decreased buffering capacity of the biomass resulted in harsher pretreatment conditions, resulting in higher sugar yields after enzyme hydrolysis. The lack of buffering could also explain why dDSA wheat straw yielded less total sugar compared to rDSA, reflected by a loss in xylose yield (Table 2) and rise in furfural (Figure 2e) indicating effectively harsher conditions. These substrates were deemed similar enough in sugar yield to be used for a comparative analysis of inhibitors and fermentability.

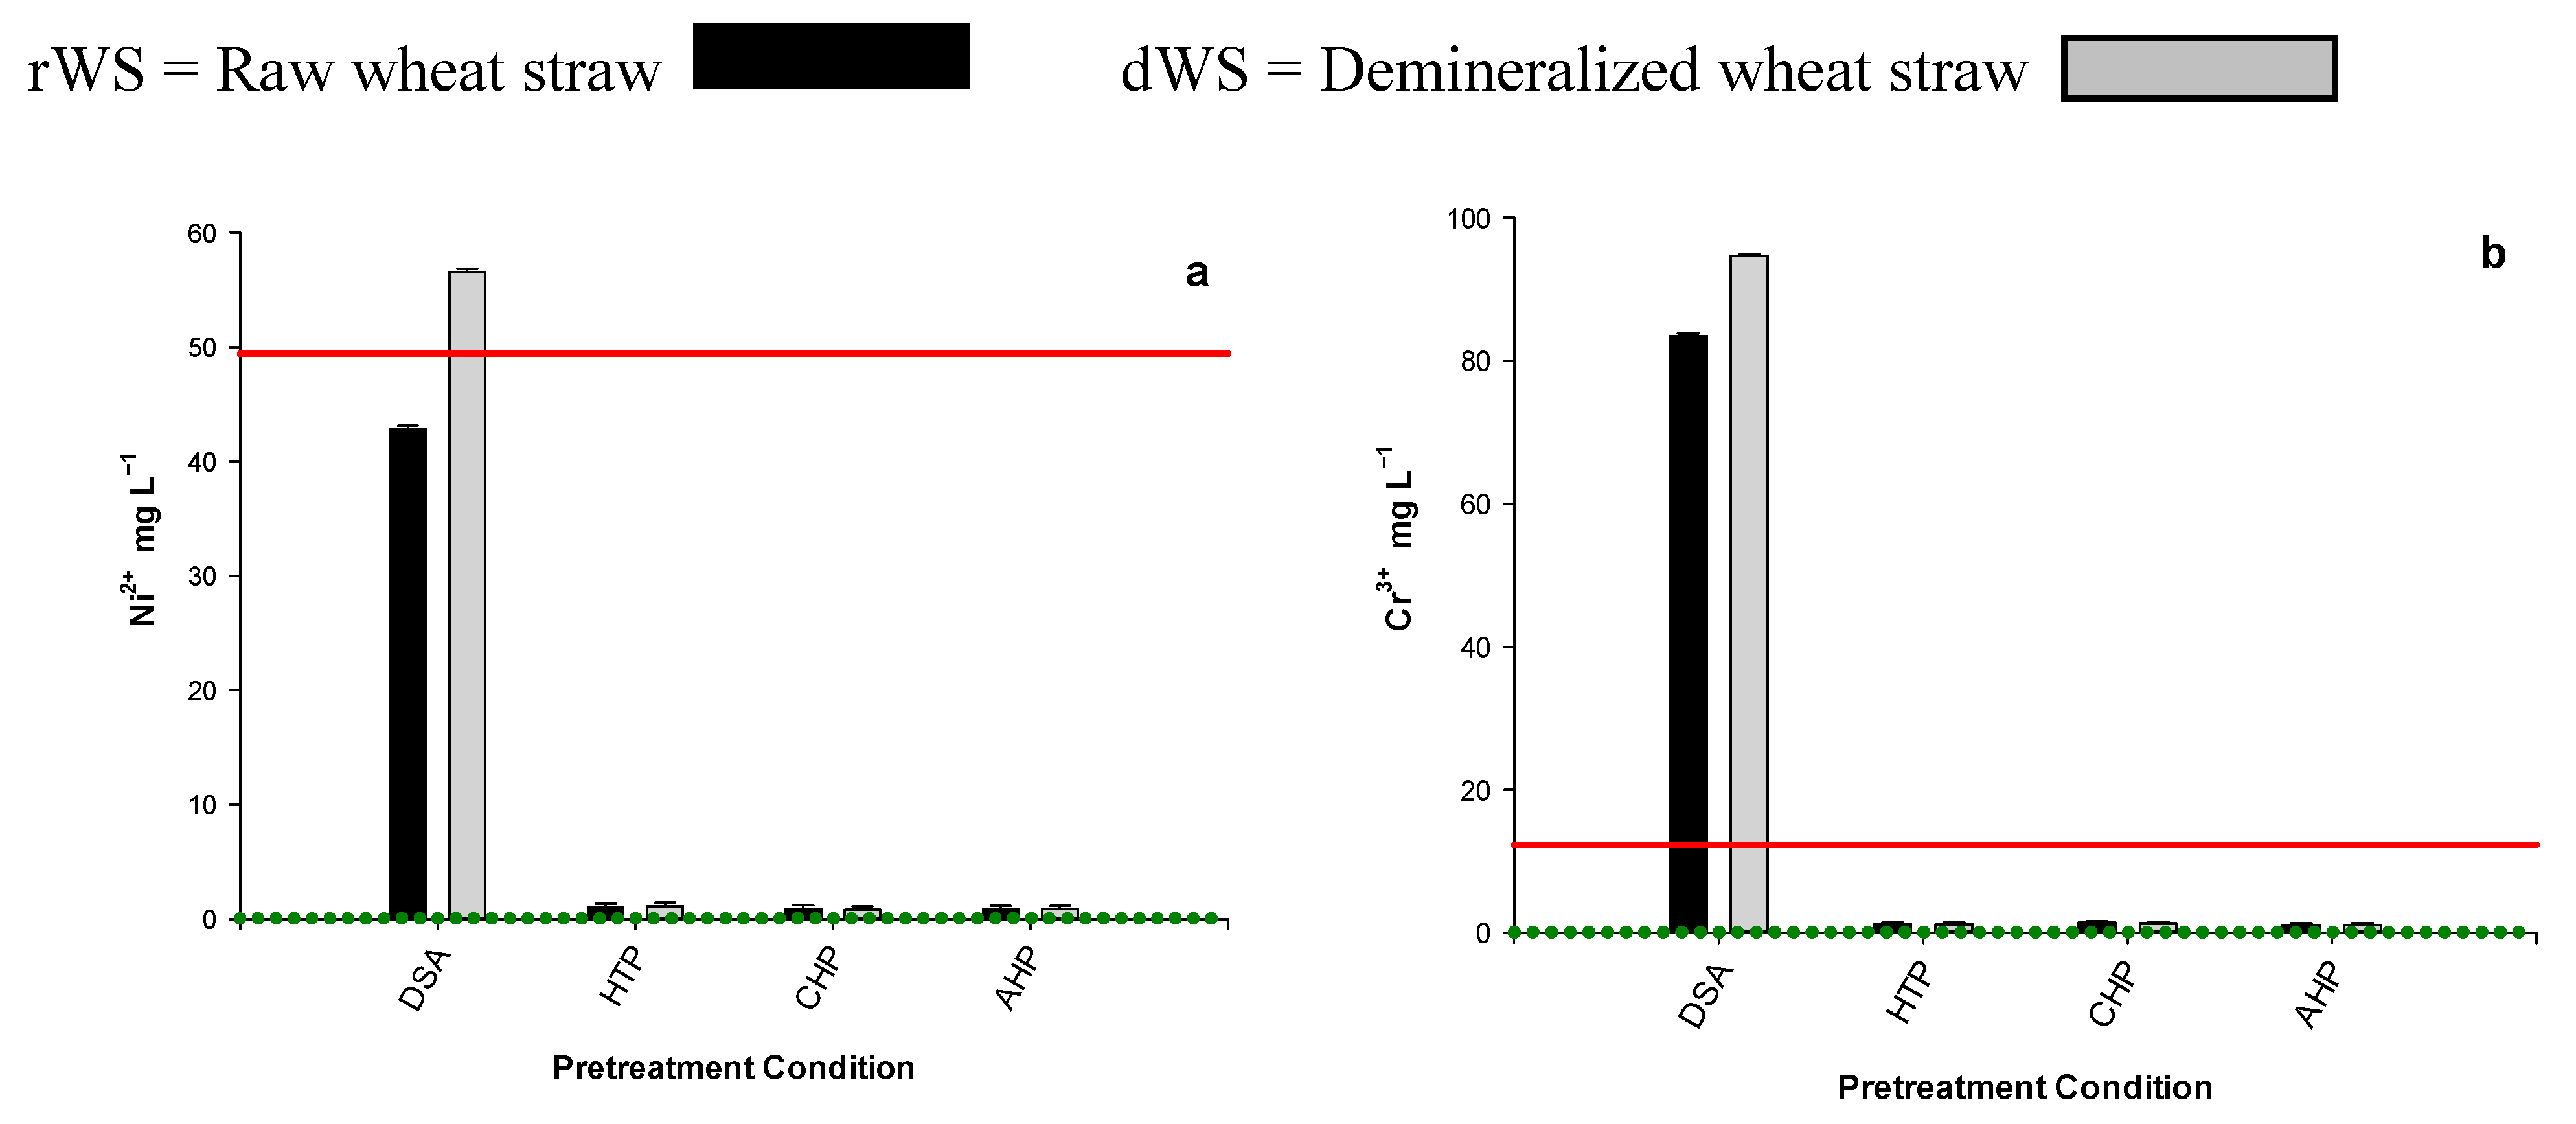
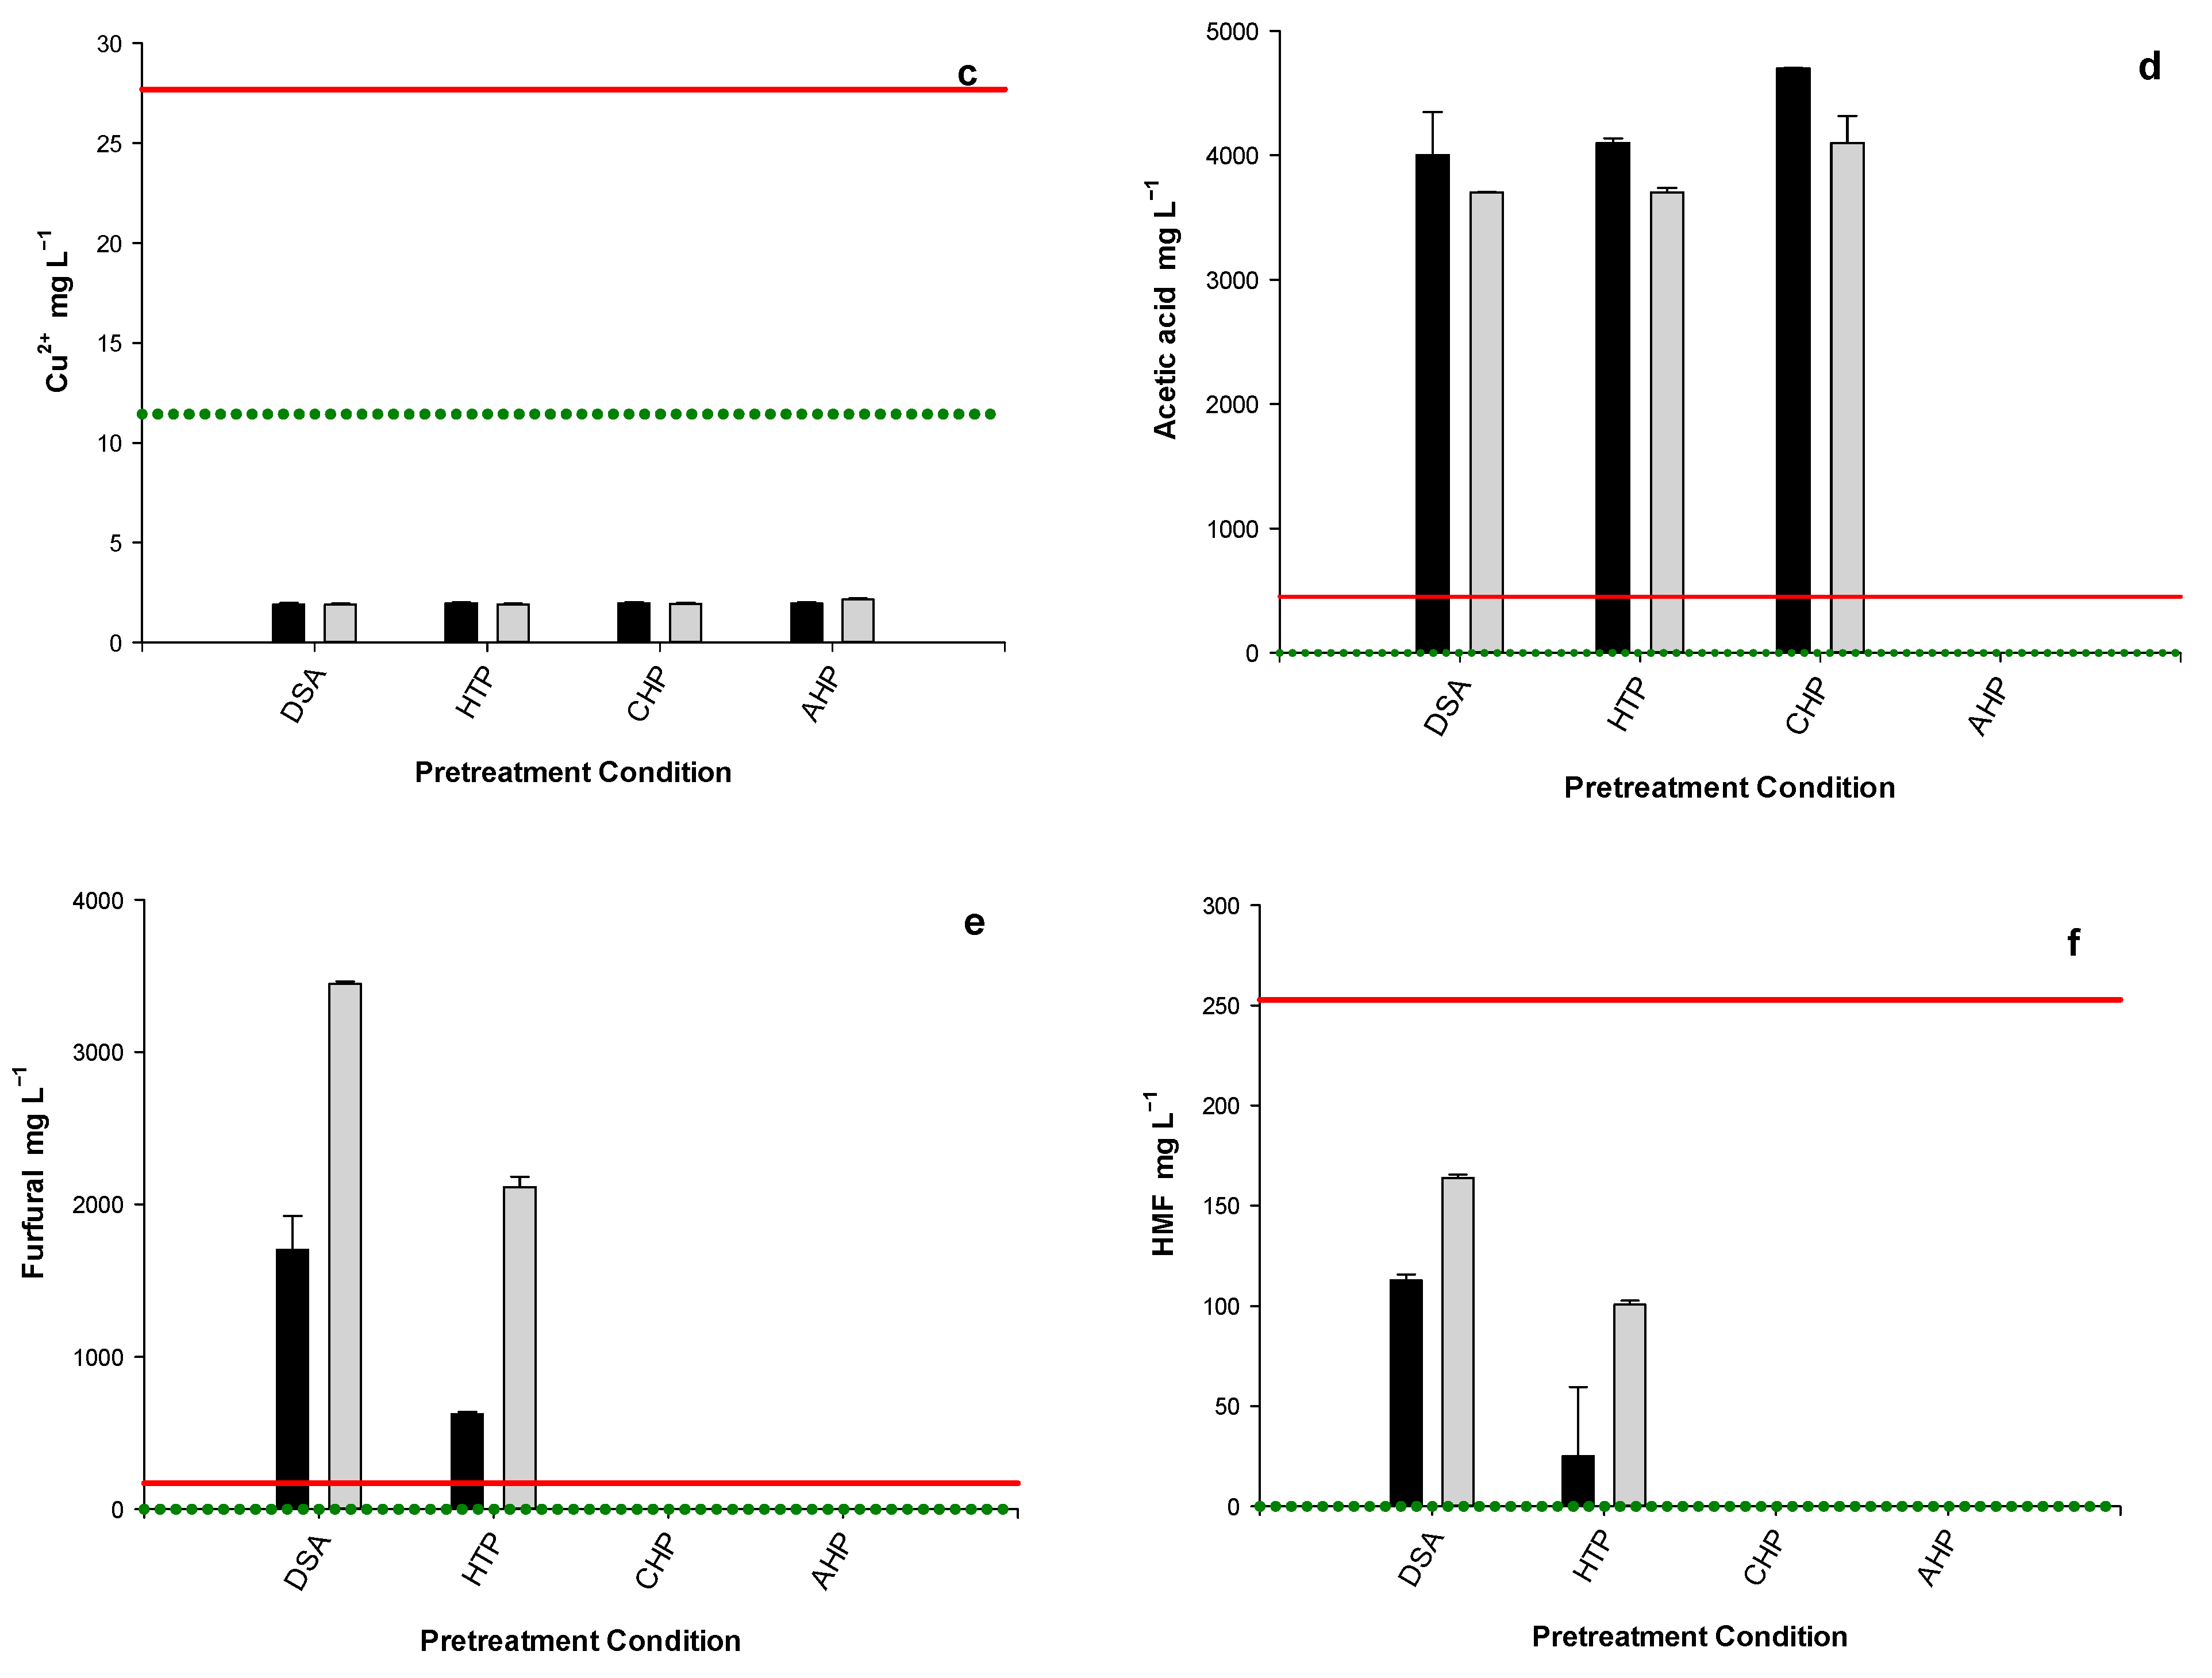
3.4. WSH Inhibitor Content

Previous work studied inhibitory ions and compounds for IA production using A. terreus [9,11,12,13,16]. The intent of this work is to highlight the inhibitors introduced with pretreatment, along with determining the point of introduction during the pretreatment process to establish conditions for prevention or removal of inhibitors to eliminate the need for post-hydrolysis mitigation. Figure 1 and Figure 2 show the concentrations of inhibitors present under different pretreatment conditions. Specific concentrations have horizontal lines indicating the levels of ions and inhibitors that define either an ideal (concentrations found in standard media—green dotted line) or an inhibited fermentation condition (red solid line). The suggested threshold limits of metal ions and inhibitory compounds are based on both published [9,13,30] and unpublished data (Ni2+ and Cr3+). With the exception of PO43−, Mn2+, and Fe3+, the ions and compounds tested for inhibition were tested individually either in flasks or the MTP format. As such, the concentrations considered inhibitory should be viewed as relative values. It has been shown that several ions had large interactive effects on IA production when varied relative to each other [31]. It is likely other compounds and ions would also exhibit variable inhibitory strength when hydrolysate component concentrations vary. For the purposes of this work, the inhibition threshold was defined as a 30% reduction in IA concentration from the maximum value from the same data set at 7 days of fermentation. This threshold was derived from the experiments in which the inhibitor was varied over a concentration range that allowed for a line to be fit using no fewer than three points. Due to previously identified interactions between certain ions [9,13], secondary inhibition levels (Figure 1a–c orange dashed line) for concentrations of PO43−, Mn2+, and Fe3+ are presented that used the following alterations to the media (A) compositions: PO43− inhibitory concentration (Figure 1a) with the addition of 50 μg L−1 Mn2+ (252 μg L−1 MnSO4·7H2O); Mn2+ inhibitory concentration (Figure 1b) with 56 mg L−1 PO43− (80 mg L−1 KH2PO4) which is a 10 fold reduction from media (A); and Fe3+ inhibitory concentration (Figure 1c) with the addition of 10 μg L−1 Mn2+ (46 μg L−1 MnSO4). The ideal level (green dotted line) for Mn2+, Ni2+, Cr3+, acetic acid, furfural, or HMF is effectively 0 mg L−1 as the standard media (both A and B) does not contain these additions.
Demineralization removed PO43, Mn2+, Mg2+, and K+ across all pretreatment conditions by 83.6 ± 6.4%, 88.7 ± 17.7%, 87.6 ± 14.3%, and 99.6 ± 0.1%, respectively (Figure 1a,b,d). Acetic acid, from acetyl groups bound to hemicellulose, was marginally reduced by the demineralizing process, (10.0 ± 2.6%, Figure 2d). Using a base, such as NaOH instead of the HCl used here, for the demineralization process may be an effective way to remove acetic acid but might alter ion removal [39]. This may be one of the reasons for the relative success of Kerssemakers et al. [20] and Krull et al. [16] in making IA, where a base pretreatment followed by thorough washing of remaining solids prior to enzymatic hydrolysis was used. Since PO43−, Mn2+, and Fe3+ impact IA production synergistically, at least two if not all three of those ions must be limited. PO43− inhibitory effects can be eliminated by demineralizing the biomass prior to pretreatment. The same removal was observed with Mn2+; however, when DSA pretreatment is used, Mn2+ is reintroduced from the stainless-steel reaction vessel (Figure 1b). It has been reported that the ideal IA fermentation occurs below 5 µg L−1 Mn2+ for optimal IA production and yield [11]. Achieving this low level will prove challenging when using substrates such as molasses and lignocellulosic hydrolysates due to their inherent Mn2+ content. Additionally, it may also prove difficult to achieve this low Mn2+ level if stainless steel vessels are used in low pH steps in a process. In addition to the introduction of Mn2+, DSA leached a large amount of Fe3+ (108–247 mg L−1 Figure 1c) from the stainless-steel vessels during pretreatment (similar values were observed in the control reactors with no biomass present)).
While Mg2+ was removed by demineralization, it was initially present at non-inhibitory concentrations (Figure 1d). In dDSA and dCHP pretreatments, the dWS showed a slight increase in Mg2+ as compared to the dHTP and dAHP hydrolysates. This is likely due to the Ca(OH)2 used, in pretreatment or pH adjustment, which contains contaminating levels of Mg2+ (~0.005 g/g according to Certificate of Analysis from the manufacturer Millipore Sigma) potentially contributing up to 60 mg L−1 of Mg2+. Potassium (K+), also a component of the biomass source, has not generally been viewed as inhibitory to IA production but high concentrations had not yet been tested. Saha and Kennedy [9] tested a range (0.0–352 mg L−1) of K+ using KCl and NaH2PO4 to decouple the PO43− from the K+ with a 30% inhibition threshold at 276 mg L−1 (standard media (A) contains 22 mg L−1). Figure 1e shows that the rWS hydrolysates exceed 1000 mg L−1 K+ for all pretreatment strategies, while demineralization removes K+ (a highly soluble ion) such that all the pretreatments of dWS are well below the inhibitory level (6–134 mg L−1). The source of biomass will greatly affect the K+ concentration; for example, fir wood can have 30 times lower amounts than wheat straw on a mass basis [40].
Pretreatment processes have well-characterized byproducts from sugar degradation. Furfural and hydroxymethylfurfural (HMF) are produced in high temperature acidic degradations of sugars [10]. Furfural (Figure 2e) exceeded the inhibitory threshold (170.2 mg L−1) in both DSA (1700–3449 mg L−1) and HTP (624–2113 mg L−1) pretreatments. Demineralization doubled or tripled the furfural concentration in these two pretreatments (Figure 2e), likely due to the harsher pretreatment severity resulting from the lack of buffering capacity of the dWS as discussed in Section 3.3. Saha et al. [13] determined that an HMF concentration of less than 200 mg L−1 should pose little inhibition risk (with a calculated 30% reduction in IA yield occurring at 252.8 mg L−1), while Krull et al. [16] showed a lower threshold of 100 mg L−1. HMF was below the higher reported limit of inhibitory concentrations [13] for dDSA and dHTP, at 100.8–163.8 mg L−1 (Figure 2f). By contrast to dilute acid, utilizing a base pretreatment prevented the formation of these two inhibitors.
Calcium (Ca2+), when compared to the standard concentration in media A of 1.37 g L−1, has been shown to be inhibitory at high concentrations, >2.2 g L−1 [13]. Exogenous Ca2+ was introduced in CHP and was also introduced in the DSA where Ca(OH)2 is used for pH adjustment following pretreatment (Figure 1f). While none of the hydrolysate preparations considered in this study rose to the level that would significantly inhibit IA production, high concentrations of Ca2+ could alter media preparations due to precipitation of media salts or pH effects and should, therefore, be considered in any pretreatment process. Inhibition by nickel (Ni2+) and chromium (Cr3+) has not been previously quantified. In this study, Ni2+ and Cr3+ levels inhibiting 30% of IA production were determined, 49.4 mg L−1 and 12.3 mg L−1, respectively. Inhibitory levels of Ni2+ and Cr3+ are the products of acid leaching from the stainless-steel vessel and were only seen in the DSA pretreatment (Figure 2a,b). The data indicate a higher concentration in dDSA, as compared to rDSA, which could, again, be attributed to the lower buffering capability of the demineralized wheat straw. Copper (Cu2+) concentrations were consistent across all the pretreatments and were not at inhibitory levels.
Levels of manganese (Mn2+) and iron (Fe3+), and acetic acid were dependent on both the biomass source (wheat straw) and pretreatment processes. Similar to Ni2+ and Cr3+, DSA treated biomass has a high concentration of Fe3+ and Mn2+ presumably leached from the stainless-steel vessel. However, the biomass-derived Fe3+, while much lower, was at inhibitory concentrations when elevated levels of Mn2+ and PO43− were also present (Figure 1c). While demineralization of wheat straw was ineffective at removing Fe3+, it was necessary to reduce the concentrations of Mn2+ and PO43− to levels at which their combined impact would be minimized for fermentation. In summary, DSA would not be an effective choice of pretreatment as it contributes additional Mn2+ (~10 mg L−1) and Fe3+ (~106–245 mg L−1) (Figure 1b,c) in the final hydrolysate causing inhibition for IA formation.
As stated earlier, acetic acid is released from biomass. The final concentration in a hydrolysate will be highly dependent on the type of biomass and solids loading. Here, acetic acid concentrations were very similar (4.00 ± 0.35 g L−1) from the three pretreatments in which it was present (Figure 2d). A. terreus was inhibited at lower concentrations of acetic acid (>0.6 g L−1) [13] at an initial pH of 3.1 but could tolerate up to 1.5 g L−1 acetic acid if initial pH were raised to 5.5. Due to the requirement of low pH for IA formation, this study only considered the inhibitory level of acetic acid when the fermentation media has an initial pH of 3.1. Acetic acid, having been released from the hemicellulose during AHP pretreatment, was removed when the pretreated WS was air dried in the fume hood and NH4OAc was evaporated (along with residual ammonia and water). This was determined by HPLC analysis of acetic acid; before and after the drying step, pretreated solids were sampled and added to a known volume of water. Following the evaporation step, acetic acid is no longer detectable in the residual material. The lack of residual acetate was thus a benefit of AHP due to drying of pretreated wheat straw in what would be considered an ammonia recycling step in a scaled-up process.
In summary, wheat straw was the primary source of PO43−, Mg2+, and K+, while pretreatment processes were the primary source of Ni2+, Cr3+, Ca2+, furfural, and HMF in hydrolysates. The exceptions to this categorization were Mn2+, Fe3+, and acetic acid in which both biomass (raw vs. demineralized) and pretreatment process (acidic vs. basic) impact final concentrations in the WSH.

3.5. Inhibitor Dilution Bioassay

Two types of inhibition can affect A. terreus fermentations, growth inhibition and IA production inhibition. Failure to accumulate cell mass combined with a lack of sugar consumption indicates growth inhibition, whereas growth and sugar consumption with a lack of IA production is production inhibition. While these are important distinctions, for the inhibitor dilution bioassay screen, IA concentration after 7 days of incubation was the primary metric utilized. The usual binary response of success or failure to produce itaconic acid is unsatisfactory as the degree of failure goes unmeasured. Accordingly, we devised a strategy in which the degree of failure was semi-quantified using high throughput MTP fermentations. Thus, even as the primary drivers of inhibition were quantified and tested individually (Figure 1 and Figure 2), the bioassay captured any synergistic effects of the combined inhibitors (identified or not) present in the various WSH preparations. It can be seen in Figure 3a that rWS under any of the four pretreatment conditions yielded a hydrolysate that was strongly inhibitory. A 50-fold inhibitor dilution ratio, with mock hydrolysate, remained 60–70% inhibitory for all the pretreatments. The pretreatment condition with the least inhibition was AHP, as can be seen by the detectable production of IA at a dilution ratio as low as 1.5. At 5-fold dilution, an IA concentration of 12.1 ± 2.0 g L−1 was achieved, but this is also well below the control IA concentration of 35.7 ± 1.0 g L−1. The relative degree of inhibition (as determined by the minimum dilution factor needed in which IA yield approaches that of the control fermentation) improved for AHP, CHP, and HTP when dWS was the substrate (Figure 3b). However, DSA showed no change in the overall inhibition when comparing rWS to dWS.

3.6. Pretreatment and Fermentation Strategies

Recently published work has shown an improved ability to ferment lignocellulosic biomass hydrolysates to IA using A. terreus. However, these studies utilize steps of inhibitor mitigation. Krull et al. [16] were able to produce 23 g L−1 IA from 88 g L−1 mixed sugars derived from wheat chaff employing a NaOH pretreatment, thorough rinsing, concentration at 105 °C, and the removal of precipitate. Wu et al. [24] converted wheat bran to sugars, followed by treatment with activated charcoal and concentration of sugars to 100 g L−1. The fermentation of this concentrated sugar source with A. terreus produced 50 g L−1 IA. Corn stover pretreated by steam explosion with 1% w/w H2SO4 followed by thorough washing was converted to 0.54 g L−1 IA [21]. Subsequently, a mutant A. terreus strain was able to produce 19 g L−1 of IA from the same substrate. Interestingly, this group limited calcium and phosphate in their media and utilized seed cultures rather than spore inoculum which may have favored IA production over fungal biomass production [21]. Biomass fractionation is another strategy that has found success in producing fermentable sugars. Regestein et al. [41] utilized an OrganoCat process, dilute aqueous oxalic acid mixed with a 2-methyltetrahydrofuran solution at 80–140 °C, for pretreating beech wood hydrolysate to demonstrate its effectiveness at separating cellulose, xylose, and lignin as model substrates for IA production. Fermentation by A. terreus using the OrganoCat-produced hydrolysate for IA production was not undertaken in this study, thus potential growth or production inhibition was not ascertained. Deep eutectic solvents have been used as a greener alternative to ionic solvents for biomass pretreatment [42]. While this particular methodology has not been applied to the production of IA by A. terreus, its ability to separate the components of biomass could prove useful if it simultaneously removes metal ions and acetic acid from the polysaccharide fraction.
Altering the fermentation strategy is another route used to improve the production of IA from hydrolysate. Yang et al. [25] showed that when pretreated (NaOH soaked, steam exploded) bamboo hydrolysate proved too inhibitory for IA production as a batch separate hydrolysis and fermentation (SHF), altering the fermentation to simultaneous saccharification and fermentation (SSF) gave a yield of 22.4 g L−1 IA. In this case, ions and inhibitors were measured, and it could be seen that acetic acid (1.47 g L−1), Mn2+ (6.97 mg L−1), and Fe3+ (15.7 mg L−1) were at potentially inhibitory concentrations. Krull et al. [16] also attempted SSF with wheat chaff hydrolysate but found it much less favorable (2.5 g L−1 after 5 days) than SHF. Yang et al. [25] performed a second fed-batch SHF in which the bamboo hydrolysate was concentrated 12.5-fold to 668 g L−1 sugar. The evaporation of water to achieve this concentration of sugar is likely to remove significant amounts of acetic acid from the hydrolysate [19]. This was then used in a fed-batch fermentation, producing 41.5 g L−1 IA from approximately 150 g L−1 sugars (the final concentration of product and sugars at the conclusion of a fed-batch fermentation).
Aside from the standard mitigation steps (e.g., activated charcoal, over-liming, and ion exchange) these pretreatments and hydrolysate processes include additional processing steps in which inhibitors may have been removed. Rinsing the biomass after pretreatment would remove ions solubilized as well as furan inhibitors and phenolics produced. Rinsing would also cause the losses of sugars, oligosaccharides, and acetic acid that had been solubilized by treatment. Evaporation of water to concentrate the sugars has the added benefit of volatilizing furfural and some fraction of the acetic acid [19]. A disadvantage is that a concentration of non-volatile inhibitory ions would also occur.

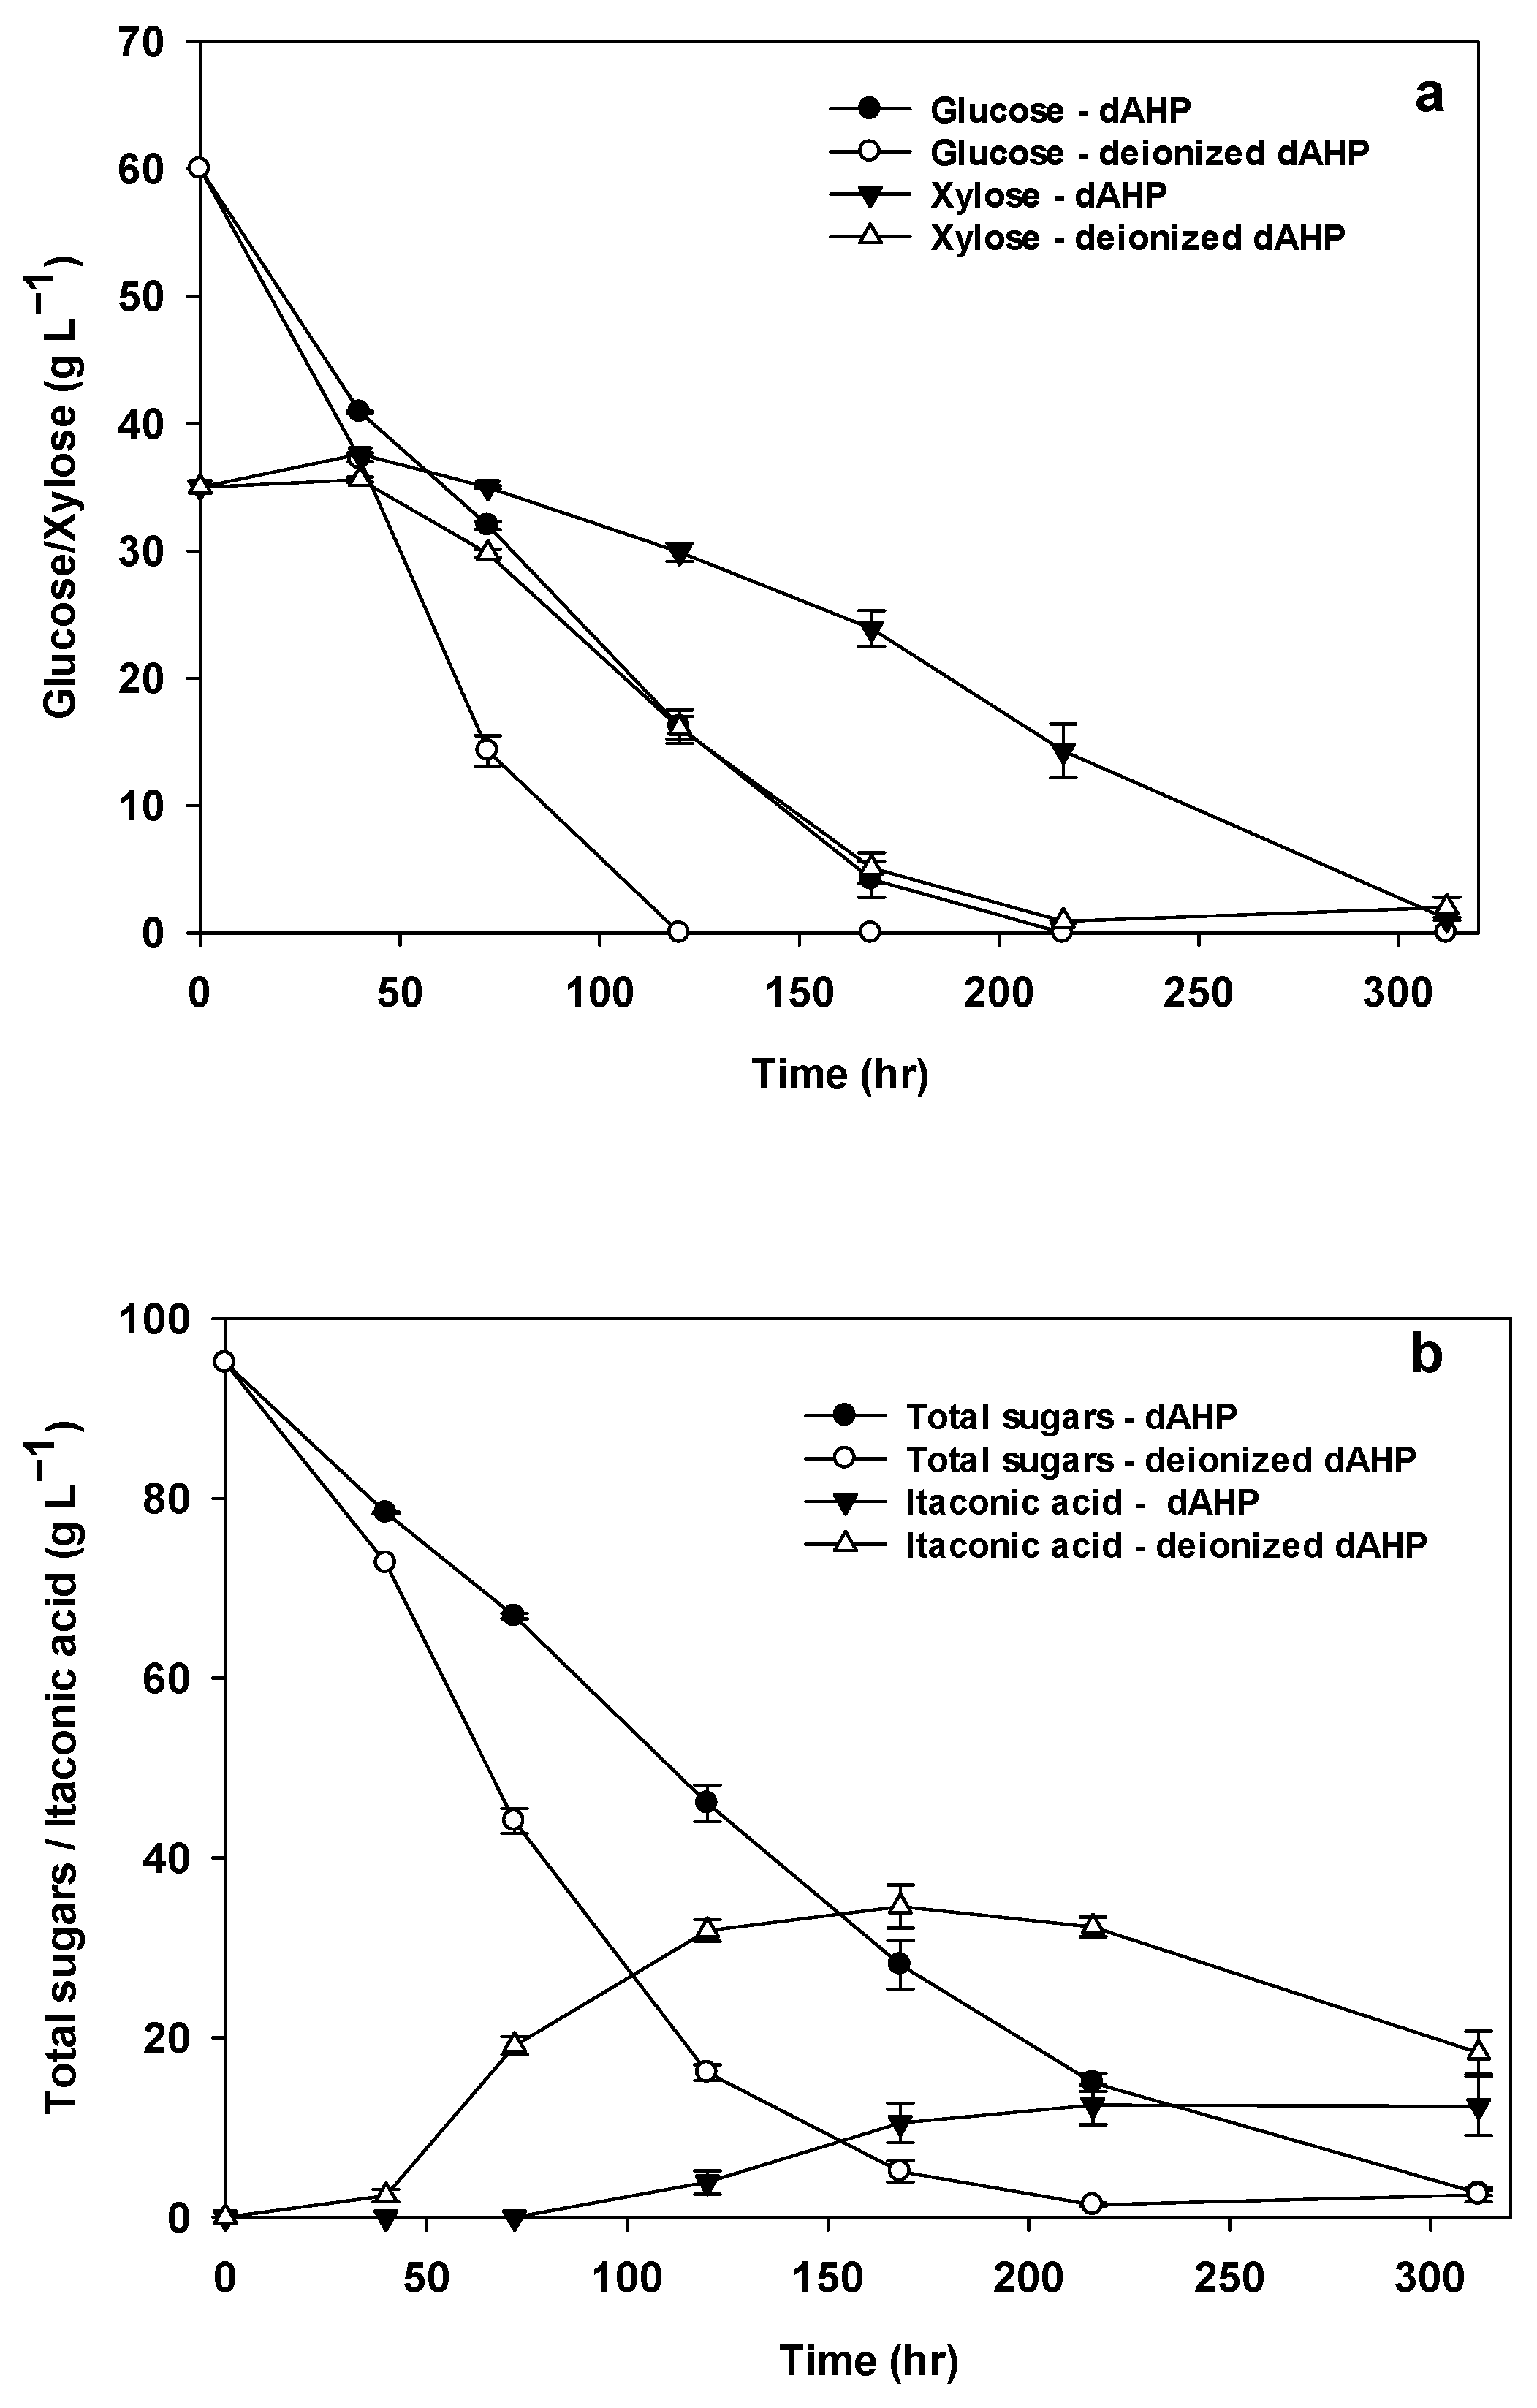
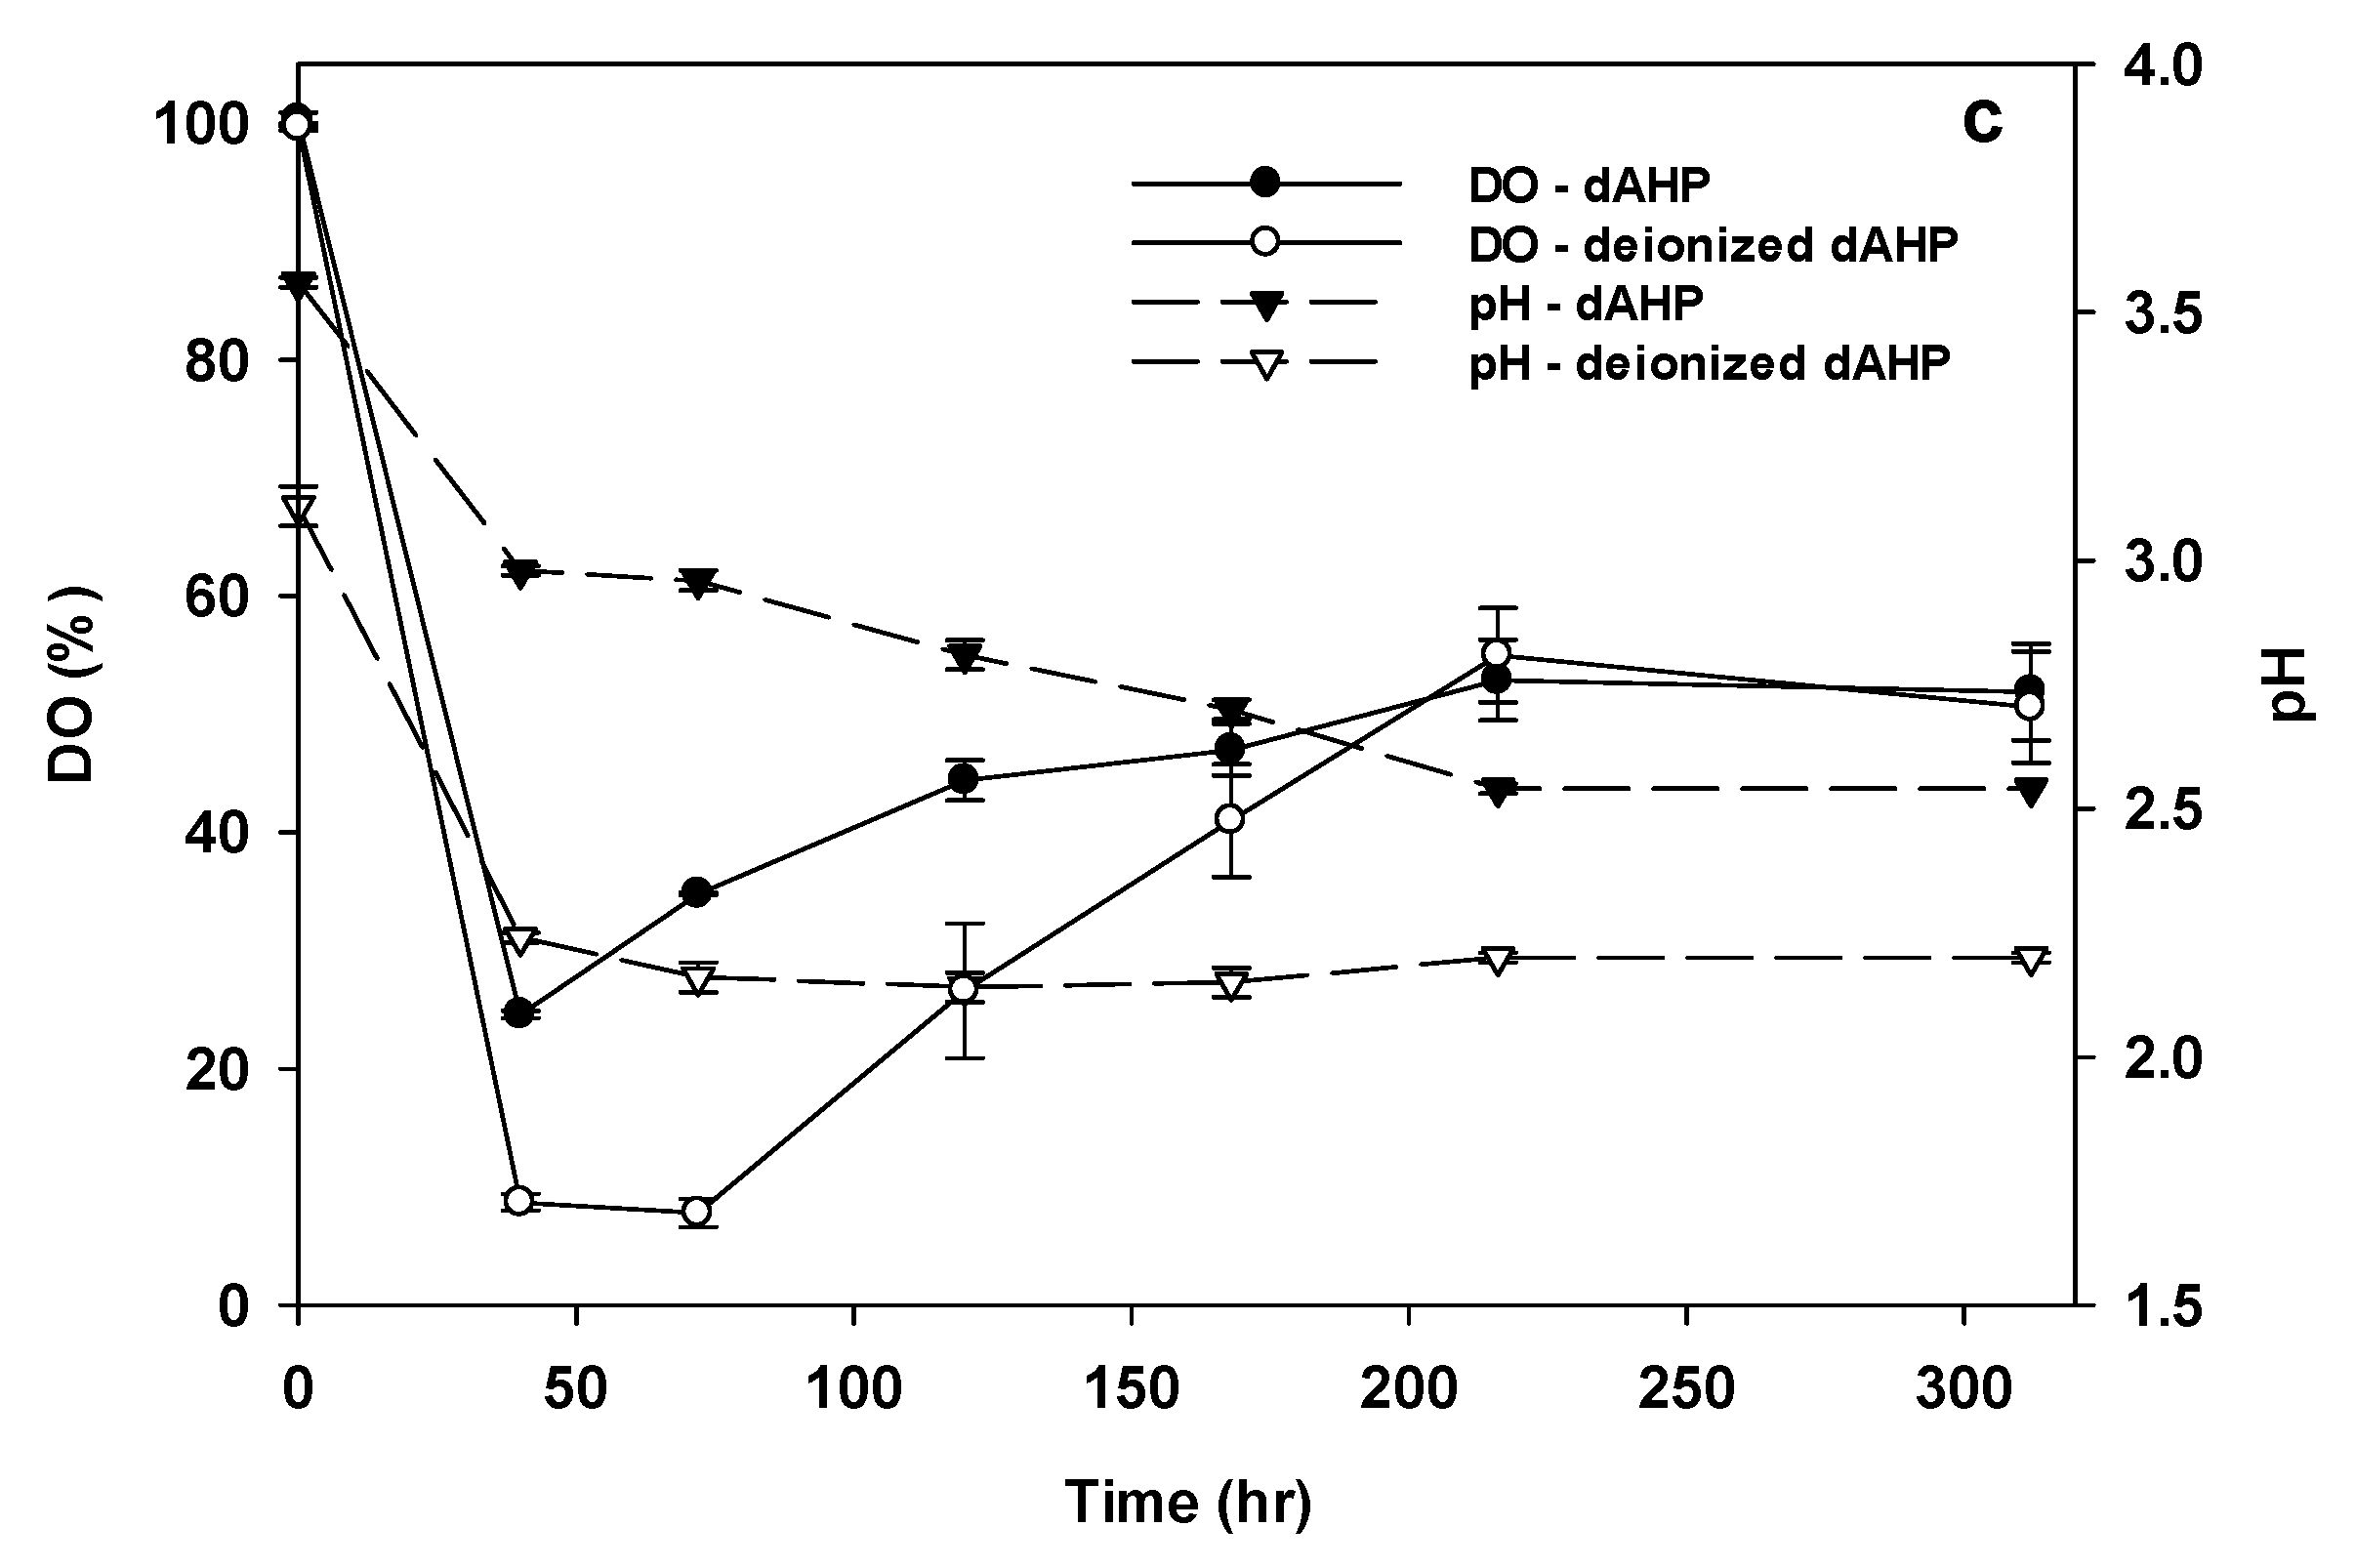
3.7. IA Production from dAHP Wheat Straw Hydrolysate

Based on its low inhibitor content and concomitant fermentability data, dAHP wheat straw hydrolysate was used as a demonstration pretreatment process for IA production. Initially, flask fermentations were conducted utilizing standard procedures (i.e., spore inoculum with media optimized for the presence of Mn2+ at pHi 3.1). For comparison to the fermentation of the unmitigated preparation, a portion of the dAHP wheat straw hydrolysate was deionized with ion exchange resin; the two parallel fermentations were each conducted in triplicate. Ions for both hydrolysate preparations were measured and, when deficient, supplemented back to the desired concentration (see Section 2.4). Maximum IA concentrations were 12.5 ± 2.2 g L−1 and 35.6 ± 2.4 g L−1, for dAHP and post-hydrolysate deionized dAHP, respectively. These represent yields of 156 mg and 384 mg per g consumed sugar for dAHP and post-hydrolysate deionized dAHP, respectively (Figure 4). This demonstrated a clear improvement in fermentability and productivity considering the initial rDSA wheat straw hydrolysate required two-step post-hydrolysis mitigation to allow for any production of IA (see Section 3.1). The inhibitory effect of elevated Fe3+ combined with Mn2+ (1.94 mg L−1 and 220 µg L−1, respectively, (Figure 1c,b)) in dAHP could be the reason IA yields and rates were improved following the deionization of the hydrolysate. However, other not yet identified factors may also contribute to lower yields when using dAHP.
Buffering capacity differs between standard mineral media and dAHP wheat straw hydrolysis. As pH was not controlled, the lack of significant pH drop (Figure 4) may have contributed to a lower IA yield for the dAHP wheat straw hydrolysate as compared to the post-hydrolysate deionized dAHP wheat straw hydrolysate [43]. Cell mass was 11.5 ± 0.4 g d.w. and 8.7 ± 0.1 g d.w. per L for dAHP and deionized dAHP, respectively. This indicates that growth was higher in dAHP substrate at the expense of IA. pH did not decrease as quickly, and growth was initially slower, as indicated by the gradual decrease in DO. Slow initial growth points to slow spore germination or inhibition, while higher final cell mass shows a diversion of carbon to growth. The lack of pH shift and delayed IA production implies production inhibition.
To remedy the potential effect of buffering capacity and pH effect, a set of fermentations with the initial pHi decreased to 2.5 were run using dAHP and a mock WSH substrate. Due to the change in starting pHi, a seed culture was used to inoculate the media as it was observed that a pHi of below 3.1 was problematic for spore germination. Under these modified fermentation conditions, the pH reached 2.05 within 48 h, improving the IA yield from dAHP wheat straw hydrolysate to a maximum of 34.9 ± 1.1 g L−1 (Figure 5b). This is a 181% increase over the spore-inoculated fermentation and compares favorably to published values of IA yields from other lignocellulosic sources employing post-hydrolysis mitigation steps [16,25]; notably, in the work described in the present study, no post-hydrolysis mitigation was necessary to achieve this yield. Seed-inoculated dAHP fermentation had a final cell mass of 12.0 ± 0.1 g, which was essentially the same as the spore-inoculated fermentation. In both of these fermentations, there was considerable back consumption of IA by the final time point. Mock WSH had a lower cell mass (3.4 ± 0.2 g L−1) and showed little back consumption of IA upon reaching its peak concentration of 41.6 ± 1.5 g L−1 in 168 h (Figure 5). This suggests that the buffering capacity of the dAHP wheat straw hydrolysate had an impact on yield when pH was manually dropped prior to inoculum. However, using seed inoculum may also be a contributing factor as optimized spore germination under WSH conditions has not been established. For improved yields, seed culture would be recommended as this is the industrial practice and aids in the speed and reproducibility of fermentations under challenging conditions [1], such as hydrolyzed lignocellulosic biomass.
The need to produce biomass hydrolysate with low ion concentrations, specifically phosphorous and manganese, has multiple implications for process improvements. Biomass source (i.e., ash content, perennial/annual), time of harvest (i.e., pre-/post-senescence) [44], demineralization, pH and chemical composition of pretreatment, purity of inputs (i.e., enzymes, media salts), and reactor vessel composition should all be accounted for in process formulation. After inputs and processes are considered for the potential to contribute to IA production inhibition, the typical fermentation inhibitors (i.e., sugar degradation products, acetic acid, and phenolics) should be considered as well.

4. Conclusions

Producing sugar from biomass while minimizing both microbial growth inhibitors and trace levels of ions presents a challenge. Four common pretreatment strategies were compared to demonstrate various points in which IA production inhibitors are introduced. Demineralization by leaching, as an additional inexpensive preprocess step, takes advantage of the relative insolubility of polysaccharides, lowers ion inhibitor concentrations, and improves sugar yield. Unmitigated dAHP wheat straw hydrolysate is a substrate with the lowest inhibitor content and produced 34.9 ± 1.1 g IA from 95.1 g sugar per L. Alternatives have been presented with the goal of providing insights into various process conditions to produce lignocellulosic hydrolysates that can be used for IA fermentation using A. terreus with little or no mitigation.

Author Contributions

Conceptualization, G.J.K.; methodology, G.J.K., K.L.A. and M.J.B.; software, G.J.K. and M.J.B.; validation, G.J.K., K.L.A. and M.J.B.; formal analysis, G.J.K.; investigation, G.J.K. and M.J.B.; resources, B.C.S.; data curation, G.J.K.; writing—original draft preparation, G.J.K. and M.J.B.; writing—review and editing, G.J.K., M.J.B. and N.N.N.; visualization, G.J.K.; supervision, B.C.S. and M.J.B.; project administration, B.C.S.; funding acquisition, B.C.S. All authors have read and agreed to the published version of the manuscript.

Funding

This work was supported by the U.S. Department of Agriculture, Agricultural Research Service CRIS project 5010-41000-189-000-D.

Data Availability Statement

The original contributions presented in the study are included in the article, further inquiries can be directed to the corresponding author.

Acknowledgments

The authors thank Victoria Nguyen for technical assistance with protein buffer exchange.

Conflicts of Interest

The authors declare no conflict of interest. Mention of trade names or commercial products in this article is solely for the purpose of providing specific information and does not imply recommendation or endorsement by the U.S. Department of Agriculture. USDA is an equal opportunity provider and employer.

References

  1. Nubel, R.C.; Ratajak, E.J. Process for Producing Itaconic Acid. U.S. Patent 3,044,941, 17 July 1962. [Google Scholar]
  2. Kumar, S.; Krishnan, S.; Samal, S.K.; Mohanty, S.; Nayak, S.K. Itaconic acid used as a versatile building block for the synthesis of renewable resource-based resins and polyesters for future prospective: A review. Polym. Int. 2017, 66, 1349–1363. [Google Scholar] [CrossRef]
  3. Devi, N.; Singh, S.; Manickam, S.; Cruz-Martins, N.; Kumar, V.; Verma, R.; Kumar, D. Itaconic Acid and Its Applications for Textile, Pharma and Agro-Industrial Purposes. Sustainability 2022, 14, 13777. [Google Scholar] [CrossRef]
  4. Teleky, B.-E.; Vodnar, D.C. Biomass-derived production of itaconic acid as a building block in specialty polymers. Polymers 2019, 11, 1035. [Google Scholar] [CrossRef] [PubMed]
  5. Werpy, T.; Petersen, G. Top Value Added Chemicals from Biomass: Volume I—Results of Screening for Potential Candidates from Sugars and Synthesis Gas (No. DOE/GO-102004-1992, 15008859); Department of Energy: Washington, DC, USA, 2004. [Google Scholar] [CrossRef]
  6. Balan, V.; Chiaramonti, D.; Kumar, S. Review of US and EU initiatives toward development, demonstration, and commercialization of lignocellulosic biofuels. Biofpr 2013, 7, 732–759. [Google Scholar] [CrossRef]
  7. Sun, Y.; Cheng, J. Hydrolysis of lignocellulosic materials for ethanol production: A review. Bioresour. Technol. 2002, 83, 1–11. [Google Scholar] [CrossRef]
  8. Hendriks, A.T.W.M.; Zeeman, G. Pretreatments to enhance the digestibility of lignocellulosic biomass. Bioresour. Technol. 2009, 100, 10–18. [Google Scholar] [CrossRef]
  9. Saha, B.C.; Kennedy, G.J. Phosphate limitation alleviates the inhibitory effect of manganese on itaconic acid production by Aspergillus terreus. Biocatal. Agric. Biotechnol. 2019, 18, 101016. [Google Scholar] [CrossRef]
  10. Palmqvist, E.; Hahn-Hägerdal, B. Fermentation of lignocellulosic hydrolysates. II: Inhibitors and mechanisms of inhibition. Bioresour. Technol. 2000, 74, 25–33. [Google Scholar] [CrossRef]
  11. Karaffa, L.; Diaz, R.; Papp, B.; Fekete, E.; Sandor, E.; Kubicek, C. A deficiency of manganese ions in the presence of high sugar concentrations is the critical parameter for achieving high yields of itaconic acid by Aspergillus terreus. Appl. Microbiol. Biotechnol. 2015, 99, 7937–7944. [Google Scholar] [CrossRef]
  12. Magnuson, J.K.; Lasure, L.L. Organic acid production by filamentous fungi. In Advances in Fungal Biotechnology for Industry, Agriculture, and Medicine; Tkacz, J.S., Lange, L., Eds.; Springer: Boston, MA, USA, 2004; pp. 307–340. [Google Scholar] [CrossRef]
  13. Saha, B.C.; Kennedy, G.J.; Bowman, M.J.; Qureshi, N.; Dunn, R.O. Factors affecting production of itaconic acid from mixed sugars by Aspergillus terreus. Appl. Biochem. Biotechnol. 2019, 187, 449–460. [Google Scholar] [CrossRef]
  14. Mussatto, S.I.; Roberto, I.C. Hydrolysate detoxification with activated charcoal for xylitol production by Candida guilliermondii. Biotechnol. Let. 2001, 23, 1681–1684. [Google Scholar] [CrossRef]
  15. Saha, B.C.; Iten, L.B.; Cotta, M.A.; Wu, Y.V. Dilute acid pretreatment, enzymatic saccharification, and fermentation of rice hulls to ethanol. Biotechnol. Prog. 2005, 21, 816–822. [Google Scholar] [CrossRef] [PubMed]
  16. Krull, S.; Eidt, L.; Hevekerl, A.; Kuenz, A.; Prüße, U. Itaconic acid production from wheat chaff by Aspergillus terreus. Process Biochem. 2017, 63, 169–176. [Google Scholar] [CrossRef]
  17. Lee, J.W.; Trinh, L.T.P.; Lee, H.-J. Removal of inhibitors from a hydrolysate of lignocellulosic biomass using electrodialysis. Sep. Purif. Technol. 2014, 122, 242–247. [Google Scholar] [CrossRef]
  18. Kim, D. Physico-Chemical Conversion of Lignocellulose: Inhibitor Effects and Detoxification Strategies: A Mini Review. Molecules 2018, 23, 309. [Google Scholar] [CrossRef]
  19. Nieder-Heitmann, M.; Haigh, K.F.; Görgens, J.F. Process design and economic analysis of a biorefinery co-producing itaconic acid and electricity from sugarcane bagasse and trash lignocelluloses. Bioresour. Technol. 2018, 262, 159–168. [Google Scholar] [CrossRef]
  20. Kerssemakers, A.A.J.; Doménech, P.; Cassano, M.; Yamakawa, C.K.; Dragone, G.; Mussatto, S.I. Production of itaconic acid from cellulose pulp: Feedstock feasibility and process strategies for an efficient microbial performance. Energies 2020, 13, 1654. [Google Scholar] [CrossRef]
  21. Li, X.; Zheng, K.; Lai, C.; Ouyang, J.; Yong, Q. Improved itaconic acid production from undetoxified enzymatic hydrolysate of steam-exploded corn stover using an Aspergillus terreus mutant generated by atmospheric and room temperature plasma. Bioresources 2016, 11, 9047–9058. [Google Scholar] [CrossRef]
  22. Pedroso, G.B.; Montipó, S.; Mario, D.A.N.; Alves, S.H.; Martins, A.F. Building block itaconic acid from left-over biomass. Biomass Convers. Biorefin. 2017, 7, 23–35. [Google Scholar] [CrossRef]
  23. Tippkötter, N.; Duwe, A.-M.; Wiesen, S.; Sieker, T.; Ulber, R. Enzymatic hydrolysis of beech wood lignocellulose at high solid contents and its utilization as substrate for the production of biobutanol and dicarboxylic acids. Bioresour. Technol. 2014, 167, 447–455. [Google Scholar] [CrossRef]
  24. Wu, X.; Liu, Q.; Deng, Y.; Li, J.; Chen, X.; Gu, Y.; Lv, X.; Zheng, Z.; Jiang, S.; Li, X. Production of itaconic acid by biotransformation of wheat bran hydrolysate with Aspergillus terreus CICC40205 mutant. Bioresour. Technol. 2017, 241, 25–34. [Google Scholar] [CrossRef] [PubMed]
  25. Yang, J.; Xu, H.; Jiang, J.; Zhang, N.; Xie, J.; Zhao, J.; Bu, Q.; Wei, M. Itaconic acid production from undetoxified enzymatic hydrolysate of bamboo residues using Aspergillus terreus. Bioresour. Technol. 2020, 307, 123208. [Google Scholar] [CrossRef] [PubMed]
  26. Slininger, P.J.; Shea-Andersh, M.A.; Thompson, S.R.; Dien, B.S.; Kurtzman, C.P.; Balan, V.; de Costa Sousa, L.; Uppugundla, N.; Dale, B.E.; Cota, M.A. Evolved strains of Scheffersomyces stipitis achieving high ethanol productivity on acid- and base-pretreated biomass hydrolyzate at high solids loading. Biotechnol. Biofuels 2015, 8, 60. [Google Scholar] [CrossRef] [PubMed]
  27. Dien, B.S.; Anderson, W.F.; Cheng, M.; Knoll, J.E.; Lamb, M.; O’Bryan, P.J.; Singh, V.; Sorensen, R.B.; Strickland, T.C.; Slininger, P.J. Field productivities of Napier Grass for production of sugars and ethanol. ACS Sustain. Chem. Eng. 2020, 8, 2052–2060. [Google Scholar] [CrossRef]
  28. Thyssenkrupp, Stainless Steel 1.4435 Data Sheet. Available online: https://www.thyssenkrupp-materials.co.uk/stainless-steel-14435.html (accessed on 2 March 2023).
  29. Xiao, Z.; Storms, R.; Tsang, A. Microplate-based filter paper assay to measure total cellulase activity. Biotechnol. Bioeng. 2004, 88, 832–837. [Google Scholar] [CrossRef]
  30. Saha, B.C.; Kennedy, G.J. Ninety six well microtiter plate as microbioreactors for production of itaconic acid by six Aspergillus terreus strains. J. Microbiol. Methods 2018, 144, 53–59. [Google Scholar] [CrossRef]
  31. Saha, B.C.; Kennedy, G.J. Efficient itaconic acid production by Aspergillus terreus: Overcoming the strong inhibitory effect of manganese. Biotechnol. Prog. 2020, 36, e2939. [Google Scholar] [CrossRef]
  32. Jenkins, B.M.; Bakker, R.R.; Wei, J.B. On the properties of washed straw. Biomass Bioenergy 1996, 10, 177–200. [Google Scholar] [CrossRef]
  33. Jiang, L.; Hu, S.; Sun, L.; Su, S.; Xu, K.; He, L.; Xiang, J. Influence of different demineralization treatments on physicochemical structure and thermal degradation of biomass. Bioresour. Technol. 2013, 146, 254–260. [Google Scholar] [CrossRef]
  34. Hörhammer, H.; Dou, C.; Gustafson, R.; Suko, A.; Bura, R. Removal of non-structural components from poplar whole-tree chips to enhance hydrolysis and fermentation performance. Biotechnol. Biofuels 2018, 11, 222. [Google Scholar] [CrossRef]
  35. He, Y.; Fang, Z.; Zhang, J.; Li, X.; Bao, J. De-ashing treatment of corn stover improves the efficiencies of enzymatic hydrolysis and consequent ethanol fermentation. Bioresour. Technol. 2014, 169, 552–558. [Google Scholar] [CrossRef] [PubMed]
  36. Tumuluru, J.S.; Hess, J.R.; Boardman, R.D.; Wright, C.T.; Westover, T.L. Formulation, pretreatment, and densification options to improve biomass specifications for co-firing high percentages with coal. Ind. Biotechnol. 2012, 8, 113–132. [Google Scholar] [CrossRef]
  37. Ragsdale, S. Metal-Carbon Bonds in Enzymes and Cofactors. Coord Chem. Rev. 2010, 254, 1948–1949. [Google Scholar] [CrossRef] [PubMed] [PubMed Central]
  38. Huang, C.; Wu, X.; Huang, Y.; Lai, C.; Li, X.; Yong, Q. Prewashing enhances the liquid hot water pretreatment efficiency of waste wheat straw with high free ash content. Bioresour. Technol. 2016, 219, 583–588. [Google Scholar] [CrossRef]
  39. Cheng, M.-H.; Wang, Z.; Dien, B.S.; Slininger, P.J.W.; Singh, V. Economic analysis of cellulosic ethanol production from sugarcane bagasse using a sequential deacetylation, hot water and disk-refining pretreatment. Processes 2019, 7, 642. [Google Scholar] [CrossRef]
  40. Vassilev, S.V.; Baxter, D.; Andersen, L.K.; Vassileva, C.G. An overview of the chemical composition of biomass. Fuel 2010, 89, 913–933. [Google Scholar] [CrossRef]
  41. Regestein, L.; Klement, T.; Grande, P.; Kreyenschulte, D.; Heyman, B.; Maßmann, T.; Eggert, A.; Sengpiel, R.; Wang, Y.; Wierckx, N.; et al. From Beech Wood to Itaconic Acid: Case Study on Biorefinery Process Integration. Biotechnol. Biofuels 2018, 11, 279. [Google Scholar] [CrossRef]
  42. Wang, W.; Lee, D.-J. Lignocellulosic Biomass Pretreatment by Deep Eutectic Solvents on Lignin Extraction and Saccharification Enhancement: A Review. Bioresour. Technol. 2021, 339, 125587. [Google Scholar] [CrossRef]
  43. Hevekerl, A.; Kuenz, A.; Vorlop, K.-D. Influence of the pH on the itaconic acid production with Aspergillus terreus. Appl. Microbiol. Biotechnol. 2014, 98, 10005–10012. [Google Scholar] [CrossRef]
  44. Kering, M.K.; Rahemi, A.; Temu, V.W. Effect of harvest management on biomass yield, forage quality, and nutrient removal by bioenergy grasses in mid-central Virginia. Agronomy 2024, 14, 825. [Google Scholar] [CrossRef]
Figure 1. Ion contents of hydrolysates from four different pretreatments with and without the demineralization of wheat straw. The green dotted line indicates the ideal ion concentration for maximum IA production in mineral media A (Mn2+ would effectively be zero for mineral media A). The red solid line indicates the ion level at which the IA production is estimated to be reduced by 30% for Mg2+ and PO43− this represents the highest value tested with no inhibition determined) as compared to mineral medium A. Secondary inhibition concentrations (shown with an orange dashed line) is presented for PO43−, Mn2+, and Fe3+ due to their negative synergy. The orange dashed line indicates the inhibitory concentration when mineral medium A is modified as follows: (a) inhibitory concentration of PO43− when medium contains 50 μg L−1 Mn2+; (b) inhibitory concentration of Mn2+ when medium contains 56 mg L−1 PO43−; (c) inhibitory concentration of Fe3+ when medium contains 10 mg L−1 Mn2+; (df) provide the above mentioned information for Mg2+, K+ and Ca2+ (respectively).
Biomass 04 00062 g001
Figure 2. Ion and fermentation inhibitor contents of hydrolysates from four different pretreatments with and without the demineralization of wheat straw. The green dotted line indicates the ideal concentration for IA production in mineral media A (Cu2+ is the only one present in the media and the others are effectively zero mg L−1 for mineral media A). The red solid line indicates the inhibitory level at which IA production is reduced by 30% as compared to mineral medium A. (af) provide the above mentioned information for Ni2+, Cr3+, Cu2+, Acetic acid, Furfural and HMF (respectively).
Biomass 04 00062 g002aBiomass 04 00062 g002b
Figure 3. Representation of relative inhibition from the various pretreatment strategies for producing WSH. MTP fermentations in which the respective WSH has been diluted with a mixed sugar and media (mock WSH). The dashed line at 35.7 g L−1 itaconic acid represents the concentration of IA produced from the control fermentation of mixed sugar and media (mock WSH) without WSH. (a) Raw wheat straw. (b) Demineralized wheat straw.
Biomass 04 00062 g003
Figure 4. Time course of the utilization of wheat straw hydrolysate sugars from demineralized wheat straw (dAHP), with or without post-hydrolysis deionization, and the production of itaconic acid by Aspergillus terreus NRRL 1972 in flasks at 33 °C and 200 rpm. Spore inoculum was used with an initial pH of 3.1. The data presented is mean ± standard deviation for triplicate fermentations. Glu, glucose; Xyl, xylose; IA, itaconic acid. (a) Glucose and xylose sugar consumption. (b) Total sugar consumption and IA production. (c) Dissolved Oxygen (DO) and pH.
Biomass 04 00062 g004aBiomass 04 00062 g004b
Figure 5. Time course of utilization of wheat straw hydrolysate sugars from demineralized wheat straw (dAHP) and mock WSH; and the production of itaconic acid by Aspergillus terreus NRRL 1972 in flasks at 33 °C and 200 rpm. A 48 hr seed inoculum was used with an initial pH of 2.5. The data presented is mean ± standard deviation for triplicate experiments. Glu, glucose; Xyl, xylose; IA, itaconic acid. (a) Glucose and xylose sugar consumption. (b) Total sugar consumption and IA production. (c) Dissolved Oxygen (DO) and pH.
Biomass 04 00062 g005
Table 1. Activities and elemental analysis of Cellic Ctec2® preparation compared to buffer-exchanged enzymes.
VariableCtec2® EnzymeDesalted Ctec2® *% Change
Enzyme Activities (U mL−1)
Filter paper activity (FPU)43.32.2 (44.4)2.5
Carboxymethyl cellulase104851 (1020)−2.6
Xylanase16163754 (15071)−6.8
β-Glucosidase142766 (1319)−7.5
β-Xylosidase22.51.04 (20.8)−7.7
α-l-Arabinofuranosidase4.40.20 (4.0)−9.2
Protein (mg L−1)
89.53.8 (75.1)−16.1
Element/Ion (mg L−1)
Cu a44.82.39 (47.9)6.8
Ni a16.90.89 (17.7)4.6
Cr a21.70.99 (19.8)−8.6
Fe a38.61.82 (36.4)−5.6
S a3569184.3 (3686.7)3.3
Mn a4.40.03 (0.5)−88.6
Ca a329.2N.D.−100
K a15923.16 (63.2)−96
Mg a155.2N.D.−100
P a1906.85.84 (116.8)−93.9
NH4+ b684.8N.D.−100
Cl− b109.10.25 (4.9)−95.5
SO42− b1204.11.26 (25.1)−97.9
PO43− b5863.41.63 (32.6)−99.4
NO3− b30.62.32 (46.6)52.4
Zn aN.D.N.D.-
Co aN.D.N.D.-
* Values in parentheses have had the dilution effect (20×) of size exclusion chromatography accounted for to allow for comparison to the original Cellic Ctec2® enzyme solution. a Elements measured with ICP OES. b Ions measured by ion-exchange chromatography-suppressed conductivity detection. N.D. none detected, below the detection limit for ICP OES. All values are the averages of duplicate analysis.
Table 2. Sugar yields following pretreatment and enzyme saccharification.
SubstratePretreatmentGlucose (g L−1)Xylose (g L−1)Arabinose (g L−1)Total Sugars (g L−1) 1Yield (g g−1) 2
rWSDSA41.3 ± 0.725.0 ± 1.05.5 ± 0.173.3 ± 0.40.587 ± 0.004
rWSHTP31.0 ± 0.320.8 ± 0.71.6 ± 0.855.0 ± 0.80.444 ± 0.007
rWSCHP33.5 ± 0.123.1 ± 0.03.4 ± 0.160.0 ± 0.10.469 ± 0.000
rWSAHP26.8 ± 1.122.7 ± 1.13.0 ± 0.252.5 ± 2.40.262 ± 0.012
dWSDSA41.6 ± 0.120.9 ± 0.15.4 ± 0.069.3 ± 0.10.554 ± 0.001
dWSHTP46.4 ± 3.626.1 ± 0.93.3 ± 0.377.5 ± 5.00.620 ± 0.040
dWSCHP38.9 ± 1.125.7 ± 0.33.4 ± 0.068.0 ± 0.80.531 ± 0.006
dWSAHP39.7 ± 1.631.2 ± 1.94.2 ± 0.375.1 ± 3.80.376 ± 0.019
rWS = raw wheat straw; dWS = demineralized wheat straw; DSA—dilute sulfuric acid pretreatment; HTP—hydrothermal pretreatment; CHP—calcium hydroxide pretreatment; AHP—ammonium hydroxide pretreatment. 1 small amounts of galactose were measured for DSA and HTP pretreatments and are included in the total sugars; 2 yield is g of total sugars per g of wheat straw (raw or demineralized).
Disclaimer/Publisher’s Note: The statements, opinions and data contained in all publications are solely those of the individual author(s) and contributor(s) and not of MDPI and/or the editor(s). MDPI and/or the editor(s) disclaim responsibility for any injury to people or property resulting from any ideas, methods, instructions or products referred to in the content.

