Article

Kinetic Study of Pd-Promoting Effect on Cu/ZnO/Al2O3 Catalyst for Glycerol Hydrogenolysis to Produce 1,2-Propanediol at Low Hydrogen Pressure

Department of Chemical Engineering, University of Waterloo, 200 University Ave. W., Waterloo, ON N2L3G1, Canada
*
Author to whom correspondence should be addressed.
Deceased 2 November 2018, this paper is dedicated to the memory of Professor Garry L. Rempel.
Biomass 2022, 2(1), 27-45; https://doi.org/10.3390/biomass2010003
Submission received: 16 December 2021 / Revised: 11 February 2022 / Accepted: 15 February 2022 / Published: 19 February 2022

Abstract

:
The promoting effect of Pd on a Cu/ZnO/Al2O3 catalyst for the aqueous glycerol hydrogenolysis process to produce 1,2-propanediol was studied. At a lower hydrogen pressure (2.07 MPa), using the Cu/ZnO/Al2O3 catalyst with 2 wt% Pd doped, could significantly improve the glycerol conversion (97.2%) and 1,2-propanediol selectivity (93.3%) compared with the unpromoted catalyst (69.4% and 89.7%, respectively). A power-law kinetic model, which took into account all the elementary reactions including glycerol dehydration and its reverse reaction, acetol hydrogenation, side reactions and ethylene glycol formation, was developed to comprehensively investigate the effect of Pd. Though the rate of glycerol dehydration using the Pd-promoted catalyst was found to be slightly lower, mainly due to the reduced number of acidic sites after adding Pd, the glycerol conversion rate was notably higher compared with using the unpromoted catalyst, mainly attributed to the enhanced activity of acetol hydrogenation by Pd. The rapid hydrogenation of acetol can inhibit the reverse reaction of glycerol dehydration, resulting in a higher glycerol conversion rate, so that glycerol dehydration is considered as the rate-determining step. In contrast, when the unpromoted catalyst was used, the rate of reverse glycerol dehydration was drastically increased due to the elevated acetol concentration, especially at a lower hydrogen pressure, resulting in a slower glycerol conversion rate; thus, acetol hydrogenation became the rate determining step. In addition, Pd can improve the reducibility of the catalyst, allowing the CuO to be reduced in situ during the reaction. Therefore, catalyst deactivation due to any potential oxidation of metallic copper during the reaction can be prevented.

Graphical Abstract

1. Introduction

Climate change has become the most serious challenge for humans because of the excessive consumption of fossil fuels, leading to a massive amount of greenhouse gas emissions. Biodiesel, as a biomass-derived renewable energy resource, has been considered as a promising supplement to fossil diesel and is increasingly used all over the world due to its environmentally friendly features, such as low greenhouse gas emissions, high rate of biodegradation and nontoxicity. Glycerol, as the major byproduct from the biodiesel production process, is an important building-block chemical that can be used to produce various chemicals. Due to the increased production of biodiesel, the large amount of glycerol produced has negatively impacted its market value, leading many researchers and engineers to find practical applications to produce value-added chemicals [1]. 1,2-propanediol (1,2-PD) is a valuable chemical that has been widely used in various applications, such as anti-freeze, polymerization and pharmaceutical additives. 1,2-PD is conventionally produced via hydration of propylene oxide, which is a fossil resource–based chemical. Producing 1,2-PD from biomass-derived glycerol has been extensively studied, since it can not only increase the profits of biodiesel manufacturers but also further reduce the fossil resource dependence of 1,2-PD production processes, in the spirit of green chemistry and sustainability.
The process of producing 1,2-PD from glycerol, known as the glycerol hydrogenolysis process, has been mostly reported to be via glycerol dehydration, to form acetol as the intermedium, followed by an acetol hydrogenation [2,3,4,5,6,7,8,9]. Acetol is extremely reactive due to the presence of both hydroxyl and carbonyl functional groups. Therefore, when its concentration is high it can easily undergo a series of side reactions, such as dehydration, oxidation, condensation and polymerization, to name a few, forming numerous types of byproducts [3,5,6]. In order to minimize the yield of the undesired byproducts, a high rate of acetol hydrogenation becomes crucial to obtain a good selectivity of 1,2-propanediol. In addition, the rapid removal of acetol can shift the equilibrium of glycerol dehydration forward, resulting in a higher glycerol conversion. It has been widely reported that the reaction is conventionally carried out under an elevated hydrogen pressure, normally above 3 MPa [9,10,11]. However, the high hydrogen pressure can give rise to safety concerns, since it can easily leak and result in explosion on contact with air. Therefore, it is industrially preferrable to improve the hydrogenation activity of the catalyst so that a satisfactory rate of acetol hydrogenation can be obtained under a relatively lower hydrogen pressure. Palladium has been well known as an effective promoter for Cu-based catalysts in various hydrogenation applications. It has been extensively studied and generally accepted that doping a small amount of Pd onto a Cu-based catalyst can significantly improve the hydrogenation activity of the catalyst, primarily due to the spillover effect [12,13,14,15,16,17]. The Pd atom is much more active toward the dissociation of hydrogen molecules into surface hydrogen atoms as compared with Cu. The addition of a trace amount of Pd onto the surface of a Cu-based catalyst can assist the hydrogen molecules to be dissociatively adsorbed on the Pd surface and spillover to the otherwise nearly inert Cu surface, providing more hydrogenation active sites [12,13,18,19,20]. Therefore, in the glycerol hydrogenolysis process using the Pd-promoted catalyst, the molecular hydrogen can be more rapidly dissociated and spillover on the catalyst surface, providing more hydrogenation active sites for acetol hydrogenation. The applications of Pd-Cu based catalysts in glycerol hydrogenolysis processes have been reported in a number of studies. Kim et al. studied the promoting effect of Pd on the catalytic activity of a Cu/CrO2 catalyst [7]; it was reported that under a hydrogen pressure of 4 MPa, using the unpromoted Cu/CrO2 catalyst, the glycerol conversion and 1,2-PD selectivity were 62.9% and 77.3%, respectively, while using the Cu/CrO2 catalyst with 1 wt% Pd doped the 1,2-PD, selectivity was improved to 93.6% and the glycerol conversion was over 70%. Xia et al. reported that by adding 1.3 wt% Pd to a Cu/MgO/Al2O3 catalyst, the glycerol conversion can be increased from 56.7% using an unpromoted catalyst to 79.6% at 2 MPa hydrogen pressure [21]. Ardila et al. investigated the synergetic effect of a Cu-Pd catalyst (5 wt% each) supported on Na-treated TiO2; the experimental results suggested that under a low hydrogen pressure (0.7 MPa) the glycerol conversion and 1,2-PD selectivity were all significantly higher when using the supported bimetallic catalyst than when using any supported monometallic (Pd or Cu) catalyst [22,23]. Nevertheless, most of the works focused on the improvement of glycerol conversion and 1,2-PD selectivity by addition of Pd; the kinetics of the promoting effect of Pd have not been clearly identified on the elementary reactions of the process, so that the promoting effect of Pd cannot be mechanistically understood.
Among the research works of glycerol hydrogenolysis in recent years, the number of comprehensive kinetic studies about this reaction process is limited. The recently reported kinetic analyses mainly include two types of kinetic model: the single-step power-law type model and the Langmuir-Hinshelwood model. The works reporting power-law models assumed the 1,2-PD is formed directly by the hydrogenation of glycerol, forming water as the byproducts. Torres et al. developed a single-step power-law model for the glycerol hydrogenolysis process using a Ru-Re/C catalyst; it was assumed that the reaction followed the first order with respect to both glycerol and hydrogen [24]. Vasiliadou and Lemonidou proposed a power-law-type kinetic model for using a Cu/SiO2 catalyst; the overall reaction rate expression showed a nearly zero-order dependence on glycerol and first-order dependence on hydrogen, suggesting that the rate of 1,2-PD formation is almost completely dependent on hydrogen pressure [25]. Gabrysch et al. used a Cu/ZrO2 catalyst, and the same kinetic results were obtained such that the reaction orders with respect to glycerol and hydrogen were zero and one, respectively [26]. Although most of the reports claimed very good agreements between the experimental data and the modeled data, the disadvantage of the single-step power-law kinetic model is that the elementary reactions are not taken into consideration. The Langmuir-Hinshelwood model is used to kinetically analyze the glycerol hydrogenolysis process following the glycerol dehydration–acetol hydrogenation pathway. The reactant adsorption, surface reaction and product desorption can be analyzed and understood. Zhou et al. developed the Langmuir-Hinshelwood model for a continuous liquid-phase glycerol hydrogenolysis process over a Cu/ZnO/Al2O3 catalyst in a fixed bed reactor; the simulated results suggest that the rate of acetol hydrogenation was much higher than the rate of glycerol dehydration, and the higher adsorption affinity of glycerol compared with 1,2-PD leads to high glycerol conversion and 1,2-PD selectivity [27]. Rajkhowa et al. proposed a Langmuir-Hinshelwood model for a liquid-phase glycerol hydrogenolysis in a batch reactor using a commercial Cu-based catalyst; it was also found that the adsorption affinity of glycerol was significantly higher than 1,2-PD, which is similar to what Zhou et al. reported [28]. Most of the reported kinetic studies use a single catalyst with various experimental conditions, such as temperature, hydrogen pressure and catalyst loading. The effect of a promoter on the reaction system has not been kinetically studied and publicly reported, to the authors’ best knowledge.
The present report investigated the promoting effect of Pd on a Cu/ZnO/Al2O3 catalyst in a glycerol hydrogenolysis process at various hydrogen pressures. The aim of this research work is to obtain satisfactory glycerol conversion and 1,2-PD selectivity under a lower hydrogen pressure by using the Pd-promoted catalyst instead of carrying out the reaction under an elevated hydrogen pressure. The experimental results using the Cu/ZnO/Al2O3 catalyst with and without Pd promotion were compared. An effective kinetic model was developed to study this promoting effect. The model is a power-law model, taking into account all the elementary reactions so that it can help readers understand the effect of Pd on each elementary reaction. The results showed that the spillover effect induced by Pd on the Cu/ZnO/Al2O3 catalyst can significantly enhance the acetol hydrogenation activity, resulting in a higher glycerol conversion and 1,2-PD selectivity at relatively lower hydrogen pressures, compared with using an unpromoted catalyst.

2. Materials and Methods

2.1. Catalyst Preparation

The Cu/ZnO/Al2O3 catalyst was prepared via oxalate gel-coprecipitation, and Pd was doped onto the calcined Cu/ZnO/Al2O3 catalyst support via an impregnation method using palladium (II) acetate (≥98%) as the Pd precursor and acetone (ACS reagent grade) as the solvent. The detailed preparation methods for the Cu/ZnO/Al2O3 catalyst [3,10] and loading Pd [4] were described in our previous works. The metal composition was previously investigated, and the optimum Cu/Zn/Al molar ratio was 35/35/30 [3] and the optimum Pd loading was 2 wt% [4]. The Cu/ZnO/Al2O3 catalyst and the 2 wt% Pd-promoted Cu/ZnO/Al2O3 catalyst are referred to as CZA and 2Pd/CZA, respectively. The 10 wt% Pd, supported on a commercial ZnO support, was prepared by the same impregnation method and is referred to as 10Pd/ZnO. All the catalysts were ground and screened by a 250 μm opening sieve.

2.2. Catalyst Characterizations

Temperature programmed reduction (TPR) and NH3 temperature programmed desorption (TPD) measurements were carried out by an Altamira AMI-200 instrument connected to a thermal conductivity detector (TCD). For the TPR process, approximately 100 mg of catalyst powder was placed into a U-shape quartz tube. The catalyst sample was flushed by argon stream at a flow rate of 30 mL/min at 200 °C for 60 min to remove the moisture and other species physically adsorbed on the catalyst surface. Then the catalyst was cooled down to 25 °C by a stream of argon at a flow rate of 30 mL/min. The pre-treated catalyst was reduced by a stream of 5 v% H2 balanced with argon with the flow rate of 60 mL/min and heated from 25 °C to 400 °C at a heating rate of 5 °C/min. To conduct an NH3 TPD experiment, approximately 100 mg of catalyst powder was placed into a U-shape quartz tube. After the pre-treatment step, which is the same as that in the aforementioned TPR process, the catalyst was reduced by a stream of 5 v% H2 balanced with argon, with the flow rate of 60 mL/min at 300 °C for 2 h. The reduced catalyst was then cooled to 25 °C and subjected to a saturation process by injecting 20 pulses of 5 v% NH3 balanced with argon stream. The catalyst was then heated to 1000 °C at a heating rate of 10 °C/min for the desorption of NH3. Brunauer-Emmett-Teller (BET) surface areas of the catalysts were determined by a Gemini 2375 instrument (Norcross, GA, USA); the method was reported in our previous work [4].

2.3. Catalytic Activity Test

All the experiments were carried out in a 300 mL Parr Instrument 4660 Series mini bench-top Hastelloy reactor. Unless investigating the activity of an unreduced catalyst, the catalyst was reduced by a continuous stream of an ultra-high purity hydrogen at 300 °C for 2 h in a tubular quartz reactor equipped with a temperature controller. The reaction mixture was placed into the bench top reactor, and the reduced catalyst was rapidly transferred into the reaction mixture. The reactor was then flushed by an ultra-high purity hydrogen stream three times to remove the air in the reactor and then heated to the designated reaction temperature. During the reaction, the reactor was pressurized by ultra-high purity hydrogen to a designated pressure, and the hydrogen pressure was kept constant by continuously feeding hydrogen via a hydrogen gas cylinder regulator. Liquid samples were taken from an equipped sampling valve during the reaction time. It was proven both mathematically and experimentally in our previous work that the reactions were carried out in the absence of external liquid-to-solid mass transfer limitation under the current reaction conditions [3,29]. In addition, the reactions were also mathematically verified to be absent from intraparticle diffusion limitation [29,30]. Therefore, all the reactions were in the kinetic control regime. The liquid samples were analyzed by an Agilent 6890 gas chromatograph (GC) equipped with a DB-WAX megabore capillary column (length: 30 m, film thickness: 10 μm, inner diameter: 0.53 mm) and a flame ionization detector (FID). The GC sample was prepared by diluting a 120 mg product sample into 1 mL of 1,4-butanediol, which was the internal standard, and n-butanol solution; the concentration of 1,4 butanediol was set to 5 g/L. The glycerol conversion and selectivities of all the products were calculated based on the mole balance of glycerol.

3. Results and Discussion

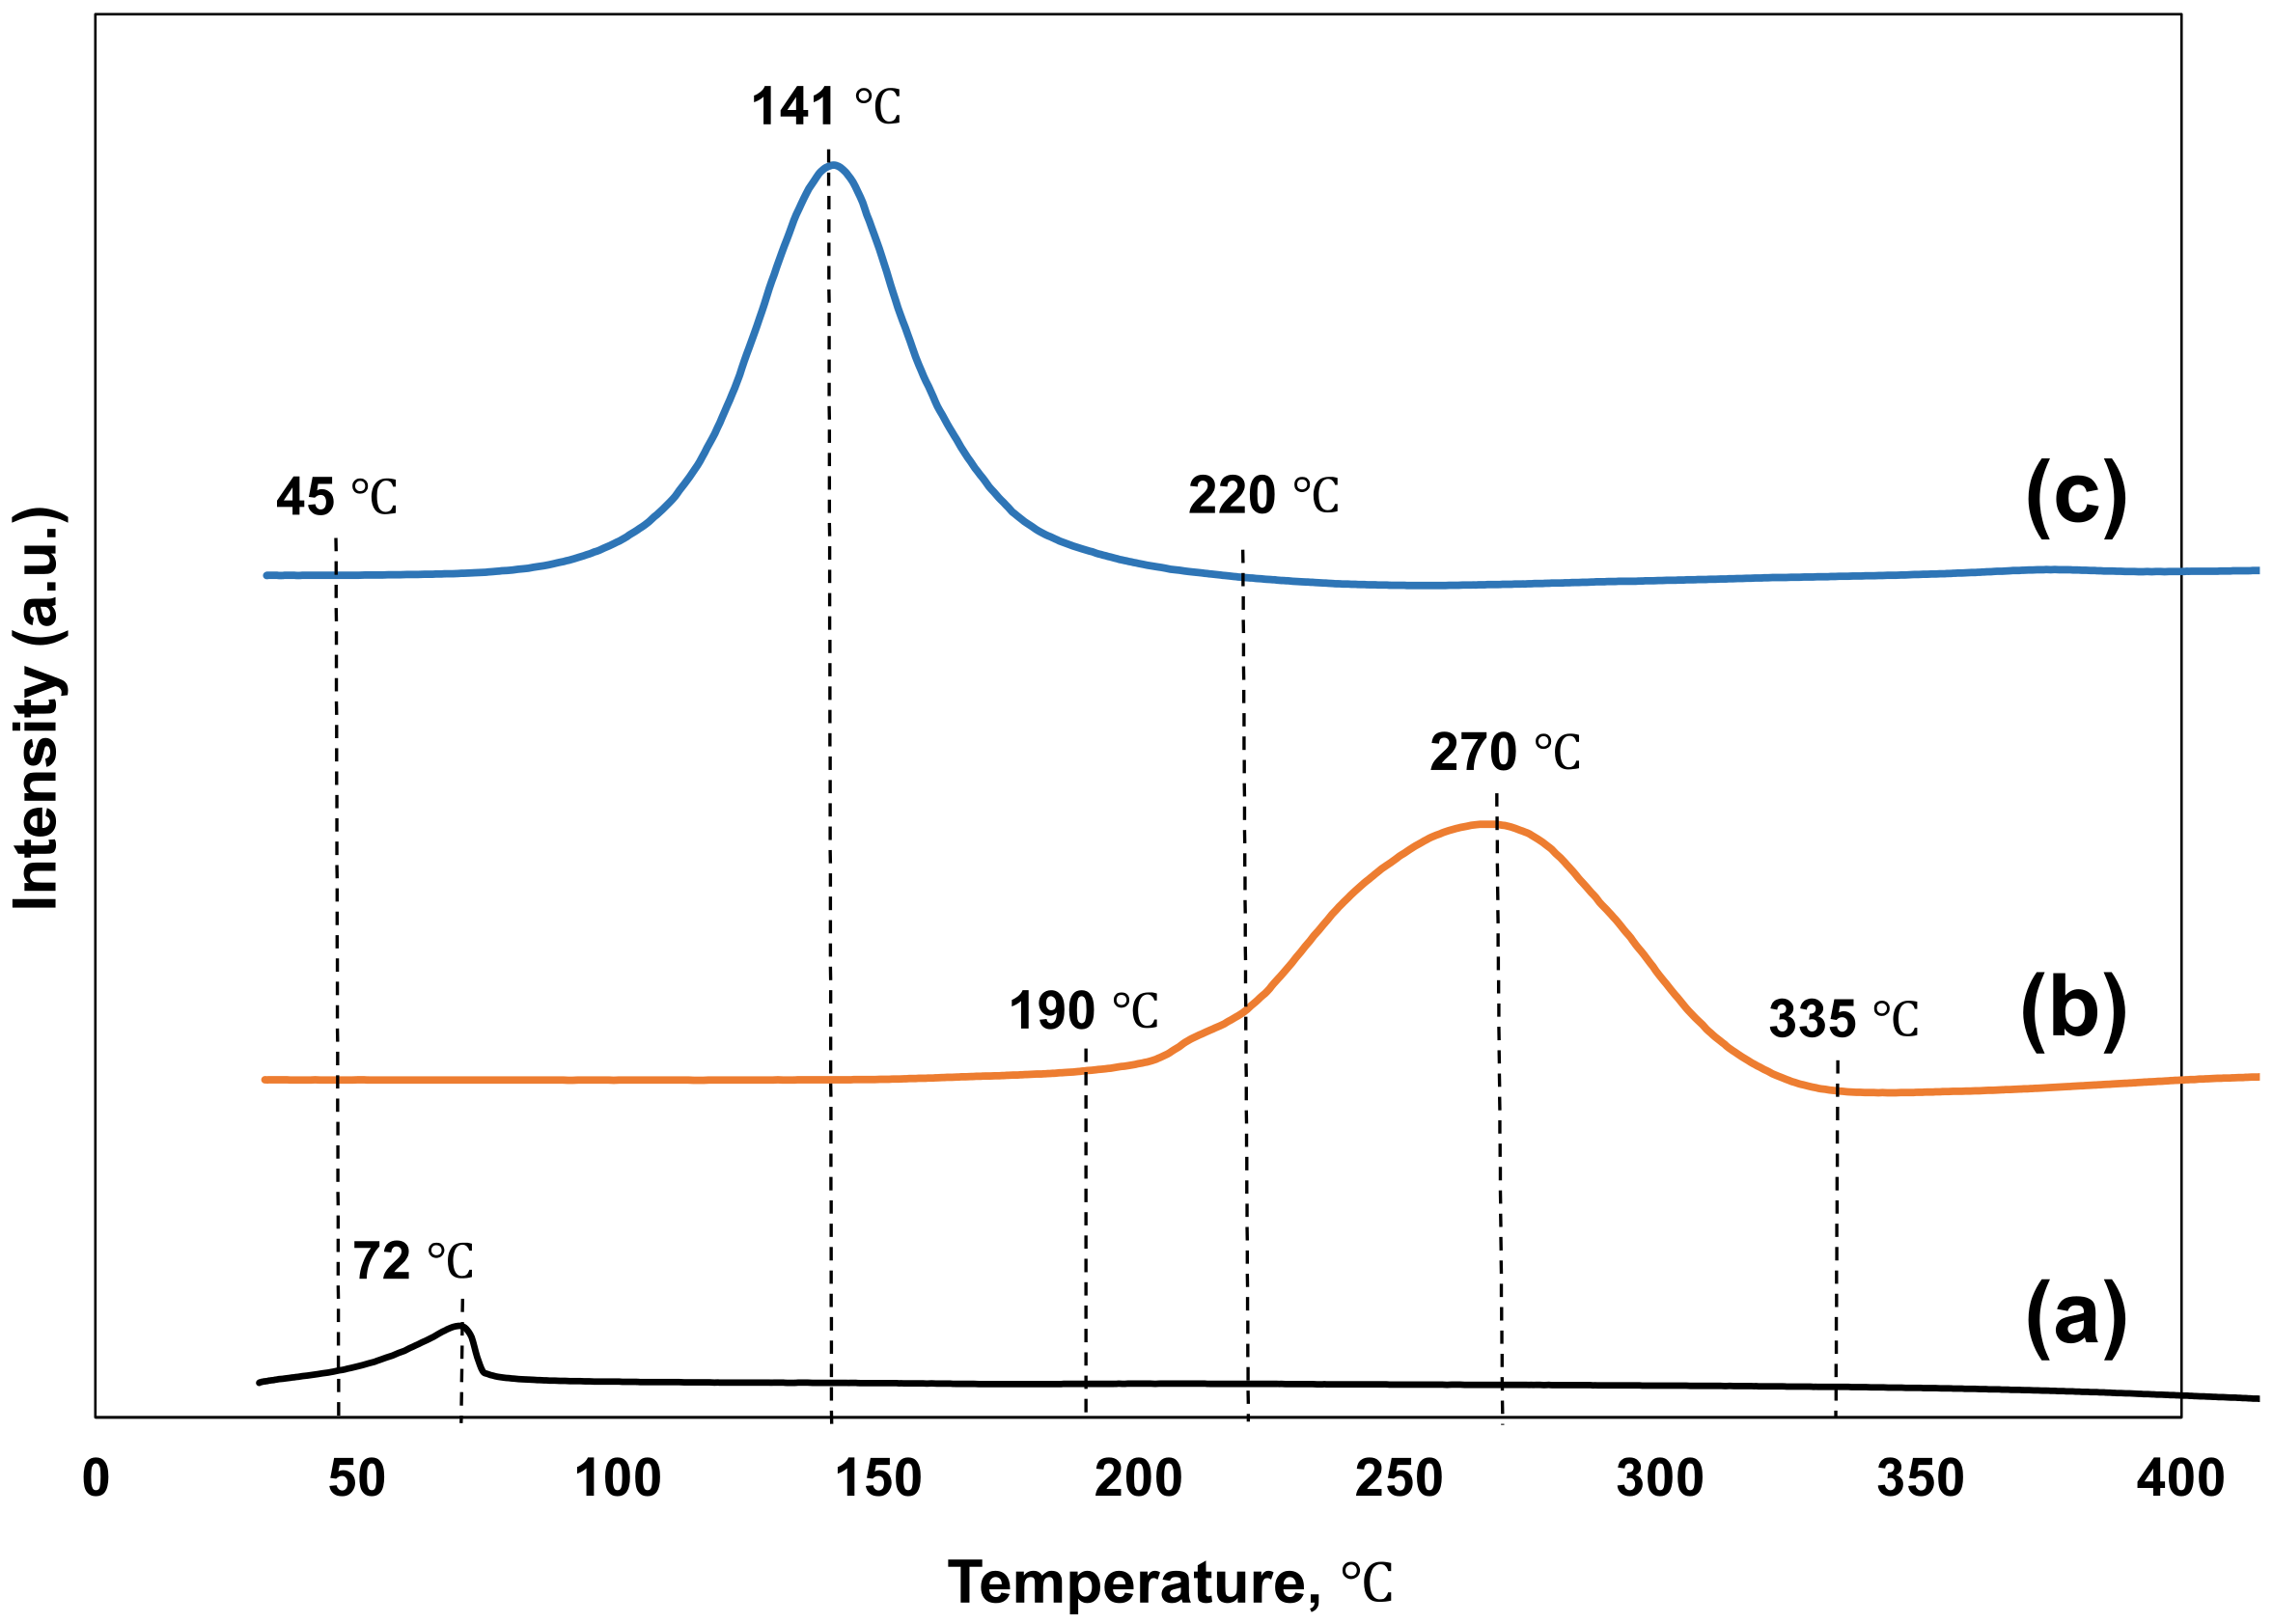
3.1. Temperature Programmed Reduction

The effect of Pd on the reducibility of the CZA catalyst was investigated by a temperature programmed reduction (TPR) technique as interpreted in Figure 1. It has been well reported that the reduction of PdO by hydrogen can start from room temperature and complete below 100 °C [31,32,33]. The TPR result of a Pd (10 wt%) supported on ZnO, as illustrated in Figure 1a, is in a good agreement with the reported data that the reduction peak can be observed to start from room temperature and reach its maxima at 72 °C. The reduction of PdO completes at about 75 °C. For the CZA catalyst (Figure 1b), a distinct reduction peak was observed starting from 190 °C and completing at 335 °C, with the reduction peak maxima at 270 °C. From the TPR results it can be found that the reduction of CuO by hydrogen requires a much higher temperature than the reduction of PdO. When 2 wt% Pd was added onto the CZA catalyst as illustrated in Figure 1c, the reduction peak was shifted to a lower temperature range, which started at 45 °C and completed at 220 °C, with the reduction peak maxima at 141 °C. No distinct reduction peak of Pd was clearly observed, possibly because PdO particles dispersed homogeneously over the catalyst and closely contacted CuO; this finding was in good agreement with the X-ray diffraction (XRD) results reported in our previous work [4]. Thus, due to the spillover effect, the reduction of PdO could occur simultaneously with the reduction of CuO. It was also observed that the reduction peak for the Pd-promoted CZA catalyst is narrower. This suggests that with Pd added the CuO can be reduced in a lower temperature range and the reduction process is quicker. The improvement of the reducibility of the CZA catalyst with the introduction of Pd is strong evidence in verifying the occurrence of the spillover effect. During the reduction process, hydrogen molecules can be more easily dissociated into hydrogen atoms on the PdO surface, thus reducing the PdO into Pd at a much lower temperature range. The surface hydrogen atoms thus can rapidly spill over from the Pd surface to adjacent CuO molecules and subsequently reduce the CuO at a faster rate and within a lower reduction temperature range [4,7,14,21].

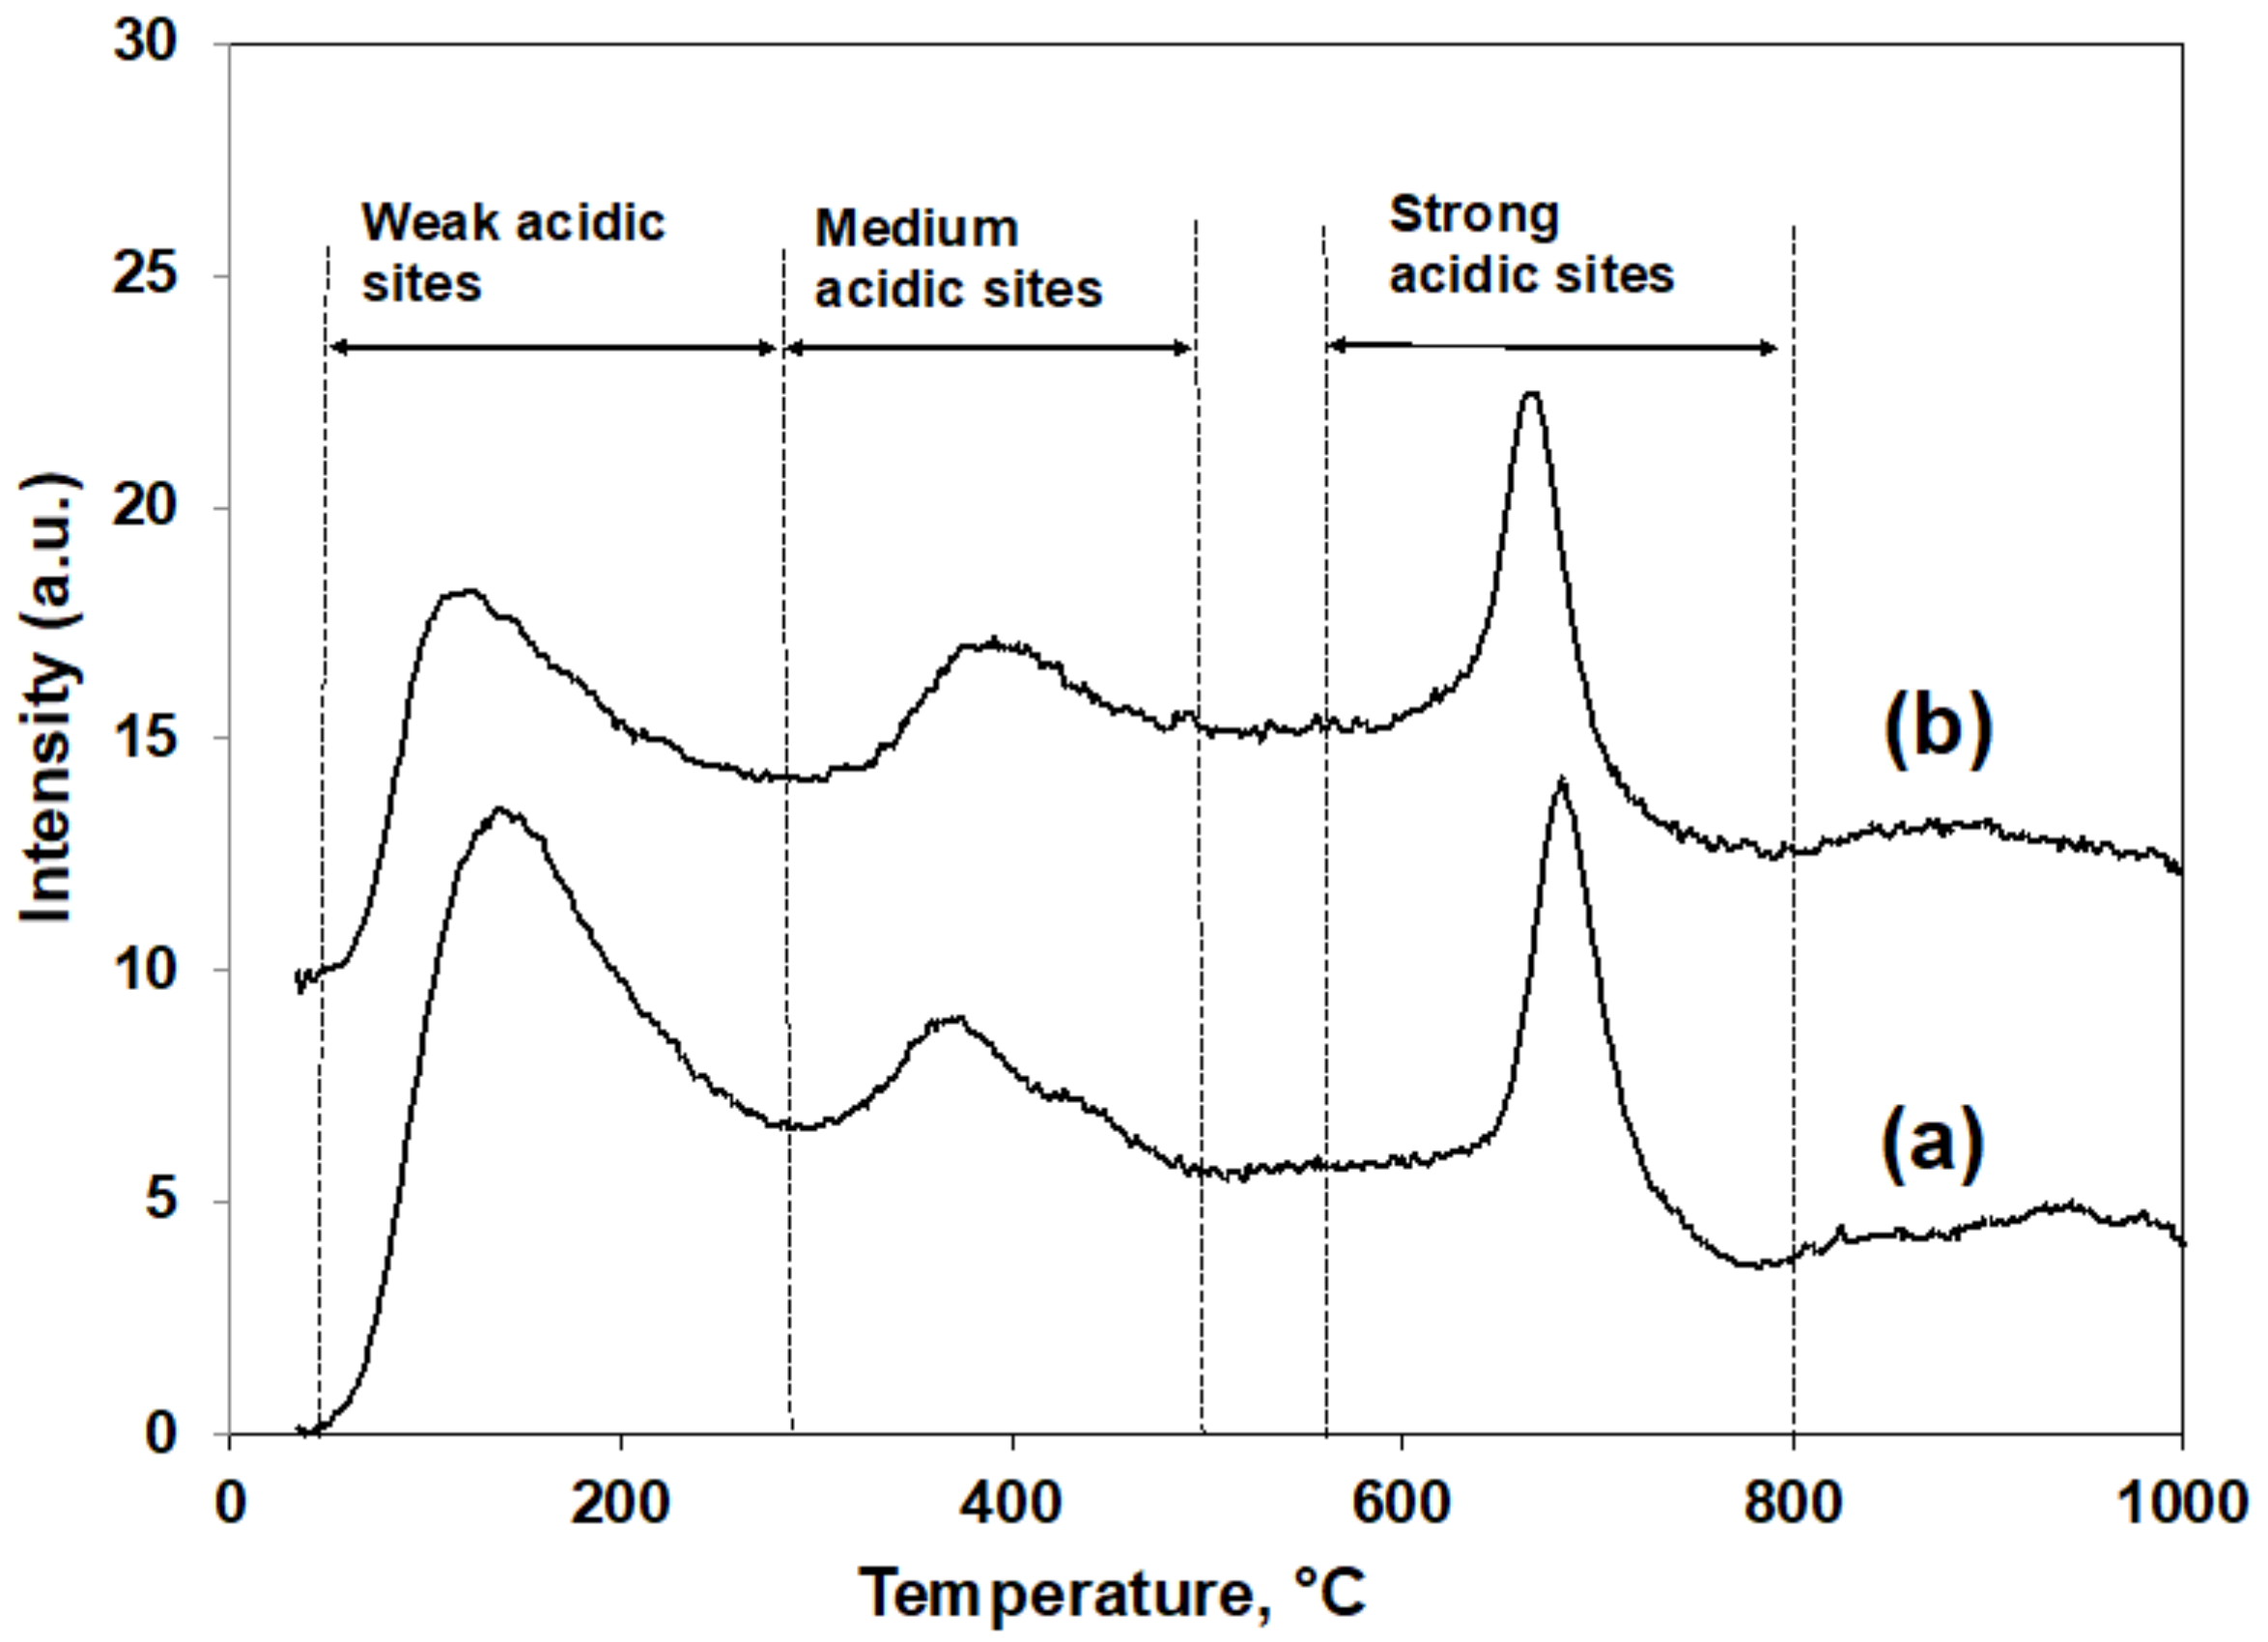
3.2. Surface Physicochemical Properties of CZA Catalyst and Its Supported Pd Catalyst

The acidity of the catalyst can play an important role in the activity of the catalyst, since the glycerol dehydration reaction has been widely reported to be strongly dependent on the acidity of the catalyst [3,8,34]. The effect of Pd on the acidity of the CZA catalyst was examined by a NH3 temperature programmed desorption (TPD) technique. As illustrated in Figure 2a for the CZA catalyst, three distinct peaks can be observed, representing weak, medium and strong acidic sites. When 2 wt% Pd was loaded onto the CZA catalyst as depicted in Figure 2b, three peaks were found to be in the same temperature ranges, and no new acidic site due to the introduction of Pd was found. The amounts of acidic sites with different strengths provided by these two catalysts are listed in Table 1. It was found that by loading 2 wt% Pd on the CZA catalyst, the total amount of acidic sites was reduced from 0.320 mmolNH3/g-cat to 0.222 mmolNH3/g-cat, while the amount of the strong acidic site was reduced from 0.075 mmolNH3/g-cat to 0.055 mmolNH3/g-cat. The reduction of acidic sites due to the introduction of Pd onto the Cu-based catalysts has been widely reported; it is mainly because Pd can block some acidic sites, making the CZA catalyst less acidic [7,21,35]. Table 1 compares some physicochemical properties of the CZA and 2Pd-CZA catalysts. It was noted that with 2 wt% Pd doped onto the CZA catalyst, the surface area and the CuO particle size were not significantly changed compared with the CZA catalyst without Pd doping, which was reported in our previous work [4].

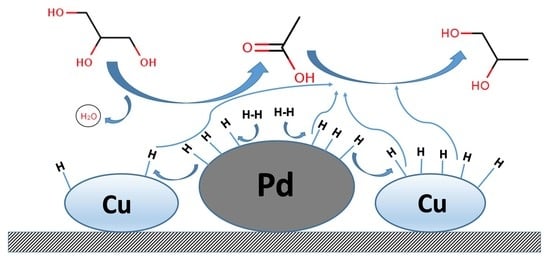
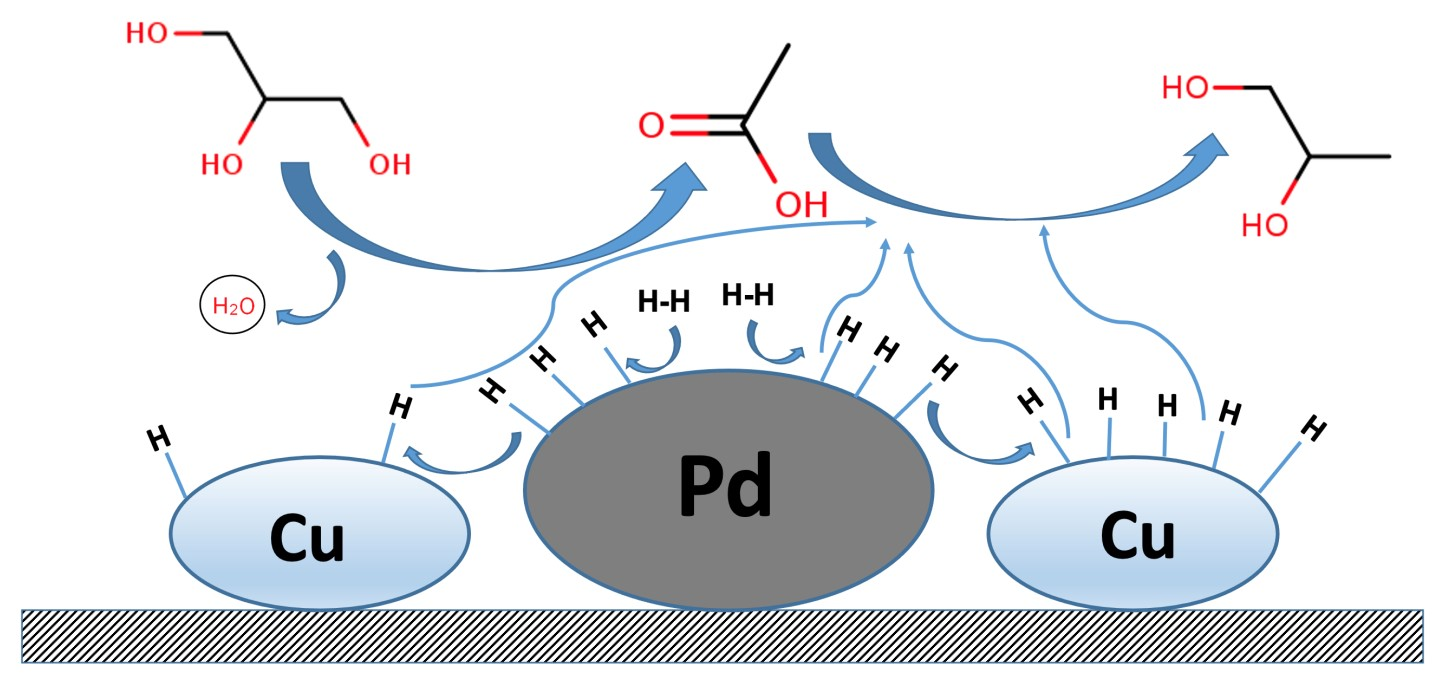
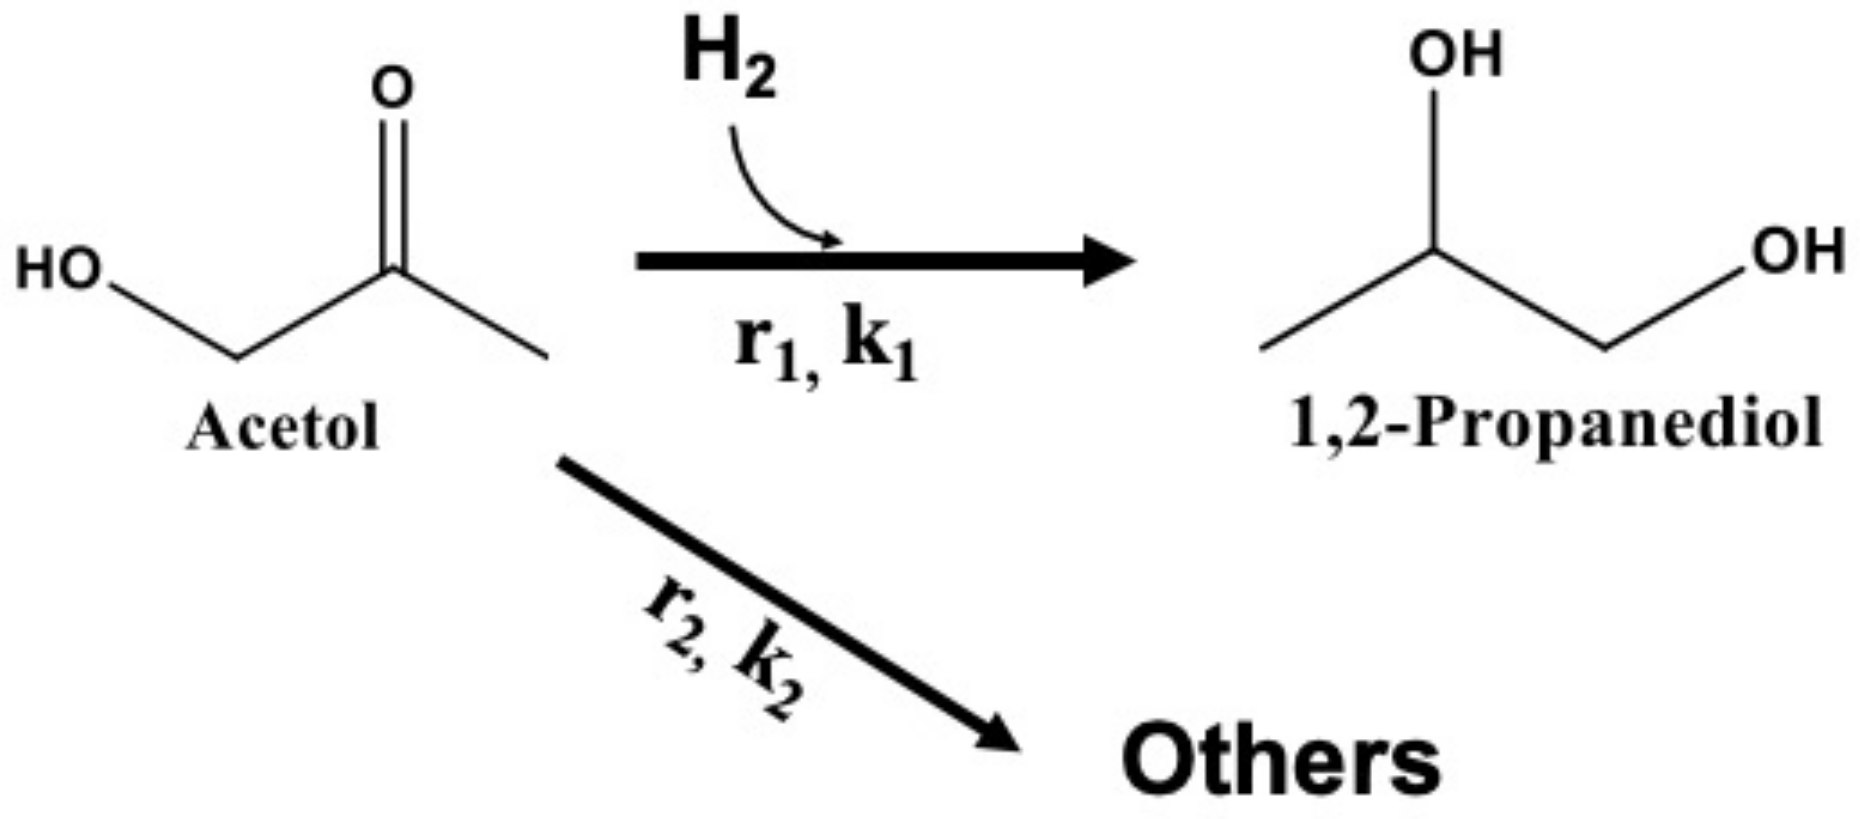
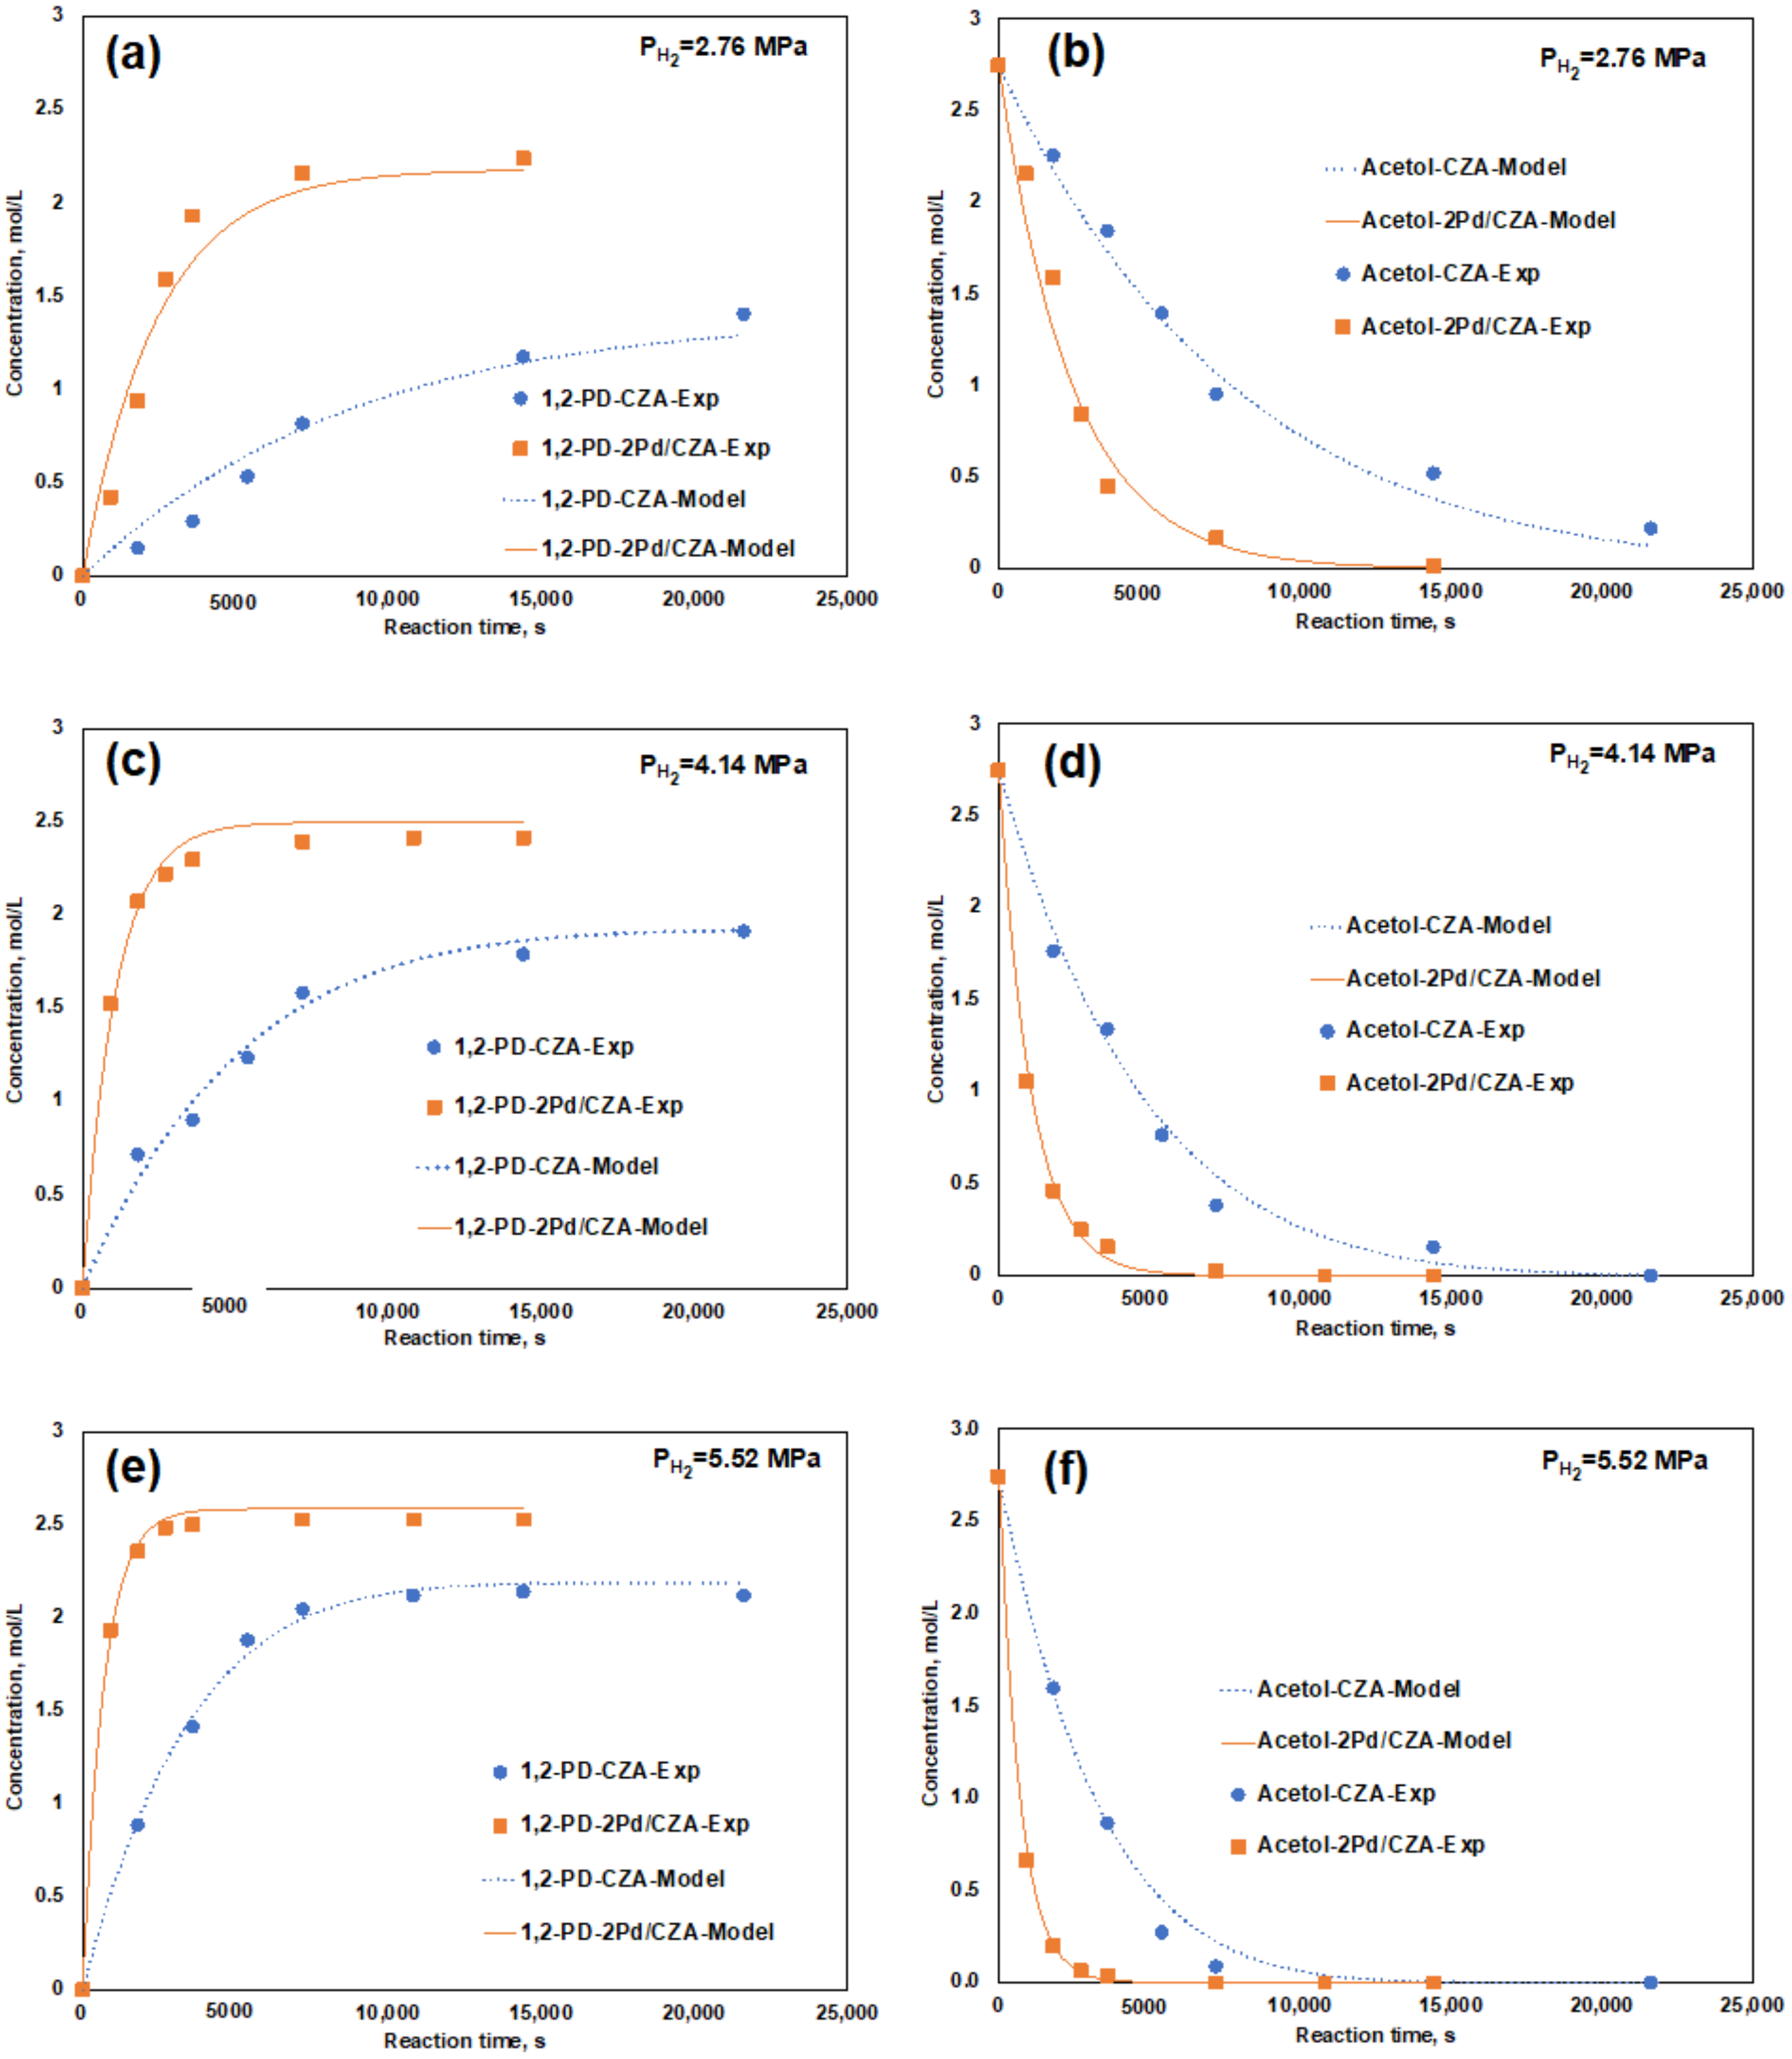
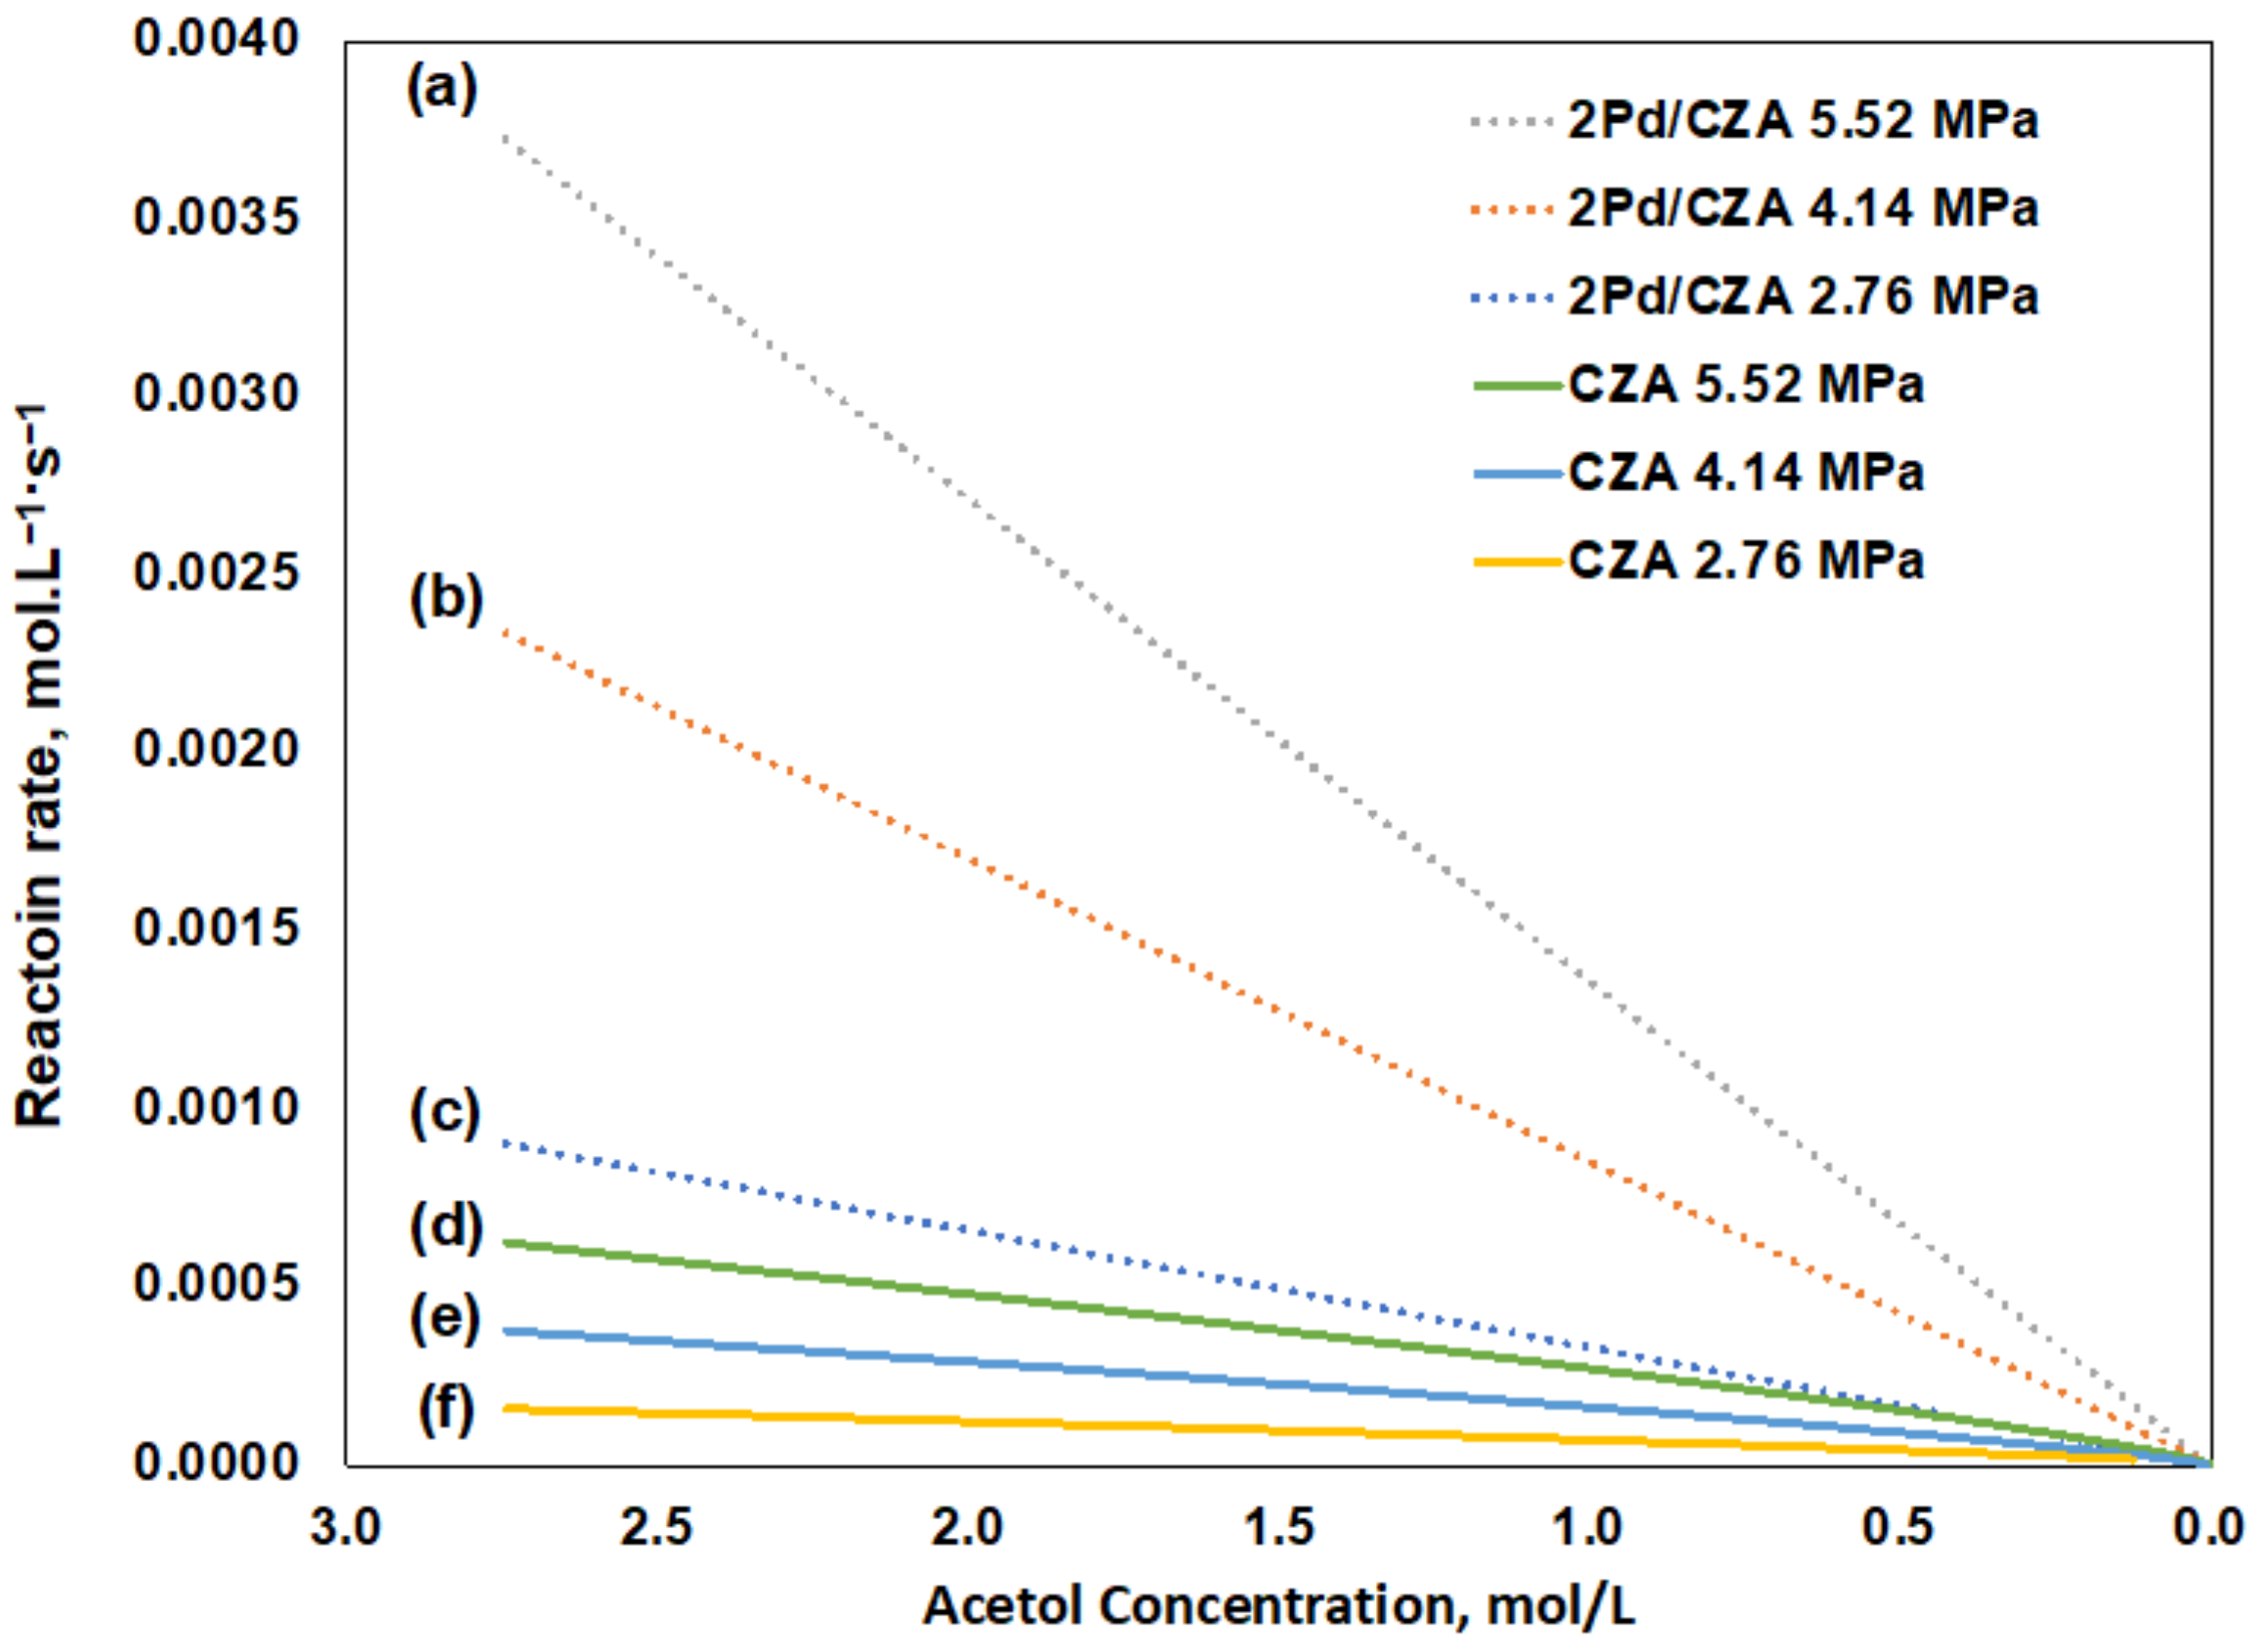
3.3. The Promoting Effect of Pd on the Acetol Hydrogenation Activity of the Cu/ZnO/Al2O3 Catalyst

It has been extensively studied and generally accepted that the step of acetol hydrogenation plays a critical role in obtaining a high 1,2-PD selectivity and high glycerol conversion in a glycerol hydrogenolysis reaction system [2,3,4,36,37]. In order to improve the acetol hydrogenation activity of the CZA catalyst, Pd was selected as the promoter, since Pd has been widely reported as a promising promoter of Cu-based catalysts in various catalytic hydrogenation applications due to the spillover effect [12,13,14]. The promoting effect of Pd on the acetol hydrogenation activity of a CZA catalyst was investigated in acetol hydrogenation experiments, and the results were compared with those using an unpromoted CZA catalyst. The effect of hydrogen pressure was investigated by carrying out the experiments at three different hydrogen pressures (2.76 MPa, 4.14 MPa and 5.52 MPa). The kinetic analyses for the results using the two catalysts were carried out by a power-law model based on the reaction pathway, as illustrated in Figure 3. The rate expression of acetol (denoted as “A”) hydrogenation is presented by Equation (1); as listed in Table 2, the order of the reaction with respect to acetol concentration is assumed to be α. Since the reactions were carried out at a constant hydrogen pressure and temperature over the reaction time, the hydrogen pressure is used in the expressions of the reaction rates, assuming the amount of hydrogen dissolved in the reaction mixture is linearly proportional to the partial pressure of hydrogen in the gas phase [9,24,38,39]. The rate constant and the reaction order with respect to hydrogen pressure (β) can be evaluated graphically by plotting ln k 1 versus ln P H 2 , as expressed in Equation (2); β can be estimated as the slope of the linear trend line, and ln(k1) can be estimated as the intercept of the trend line. Equation (3) is used to present the rate expression of side reactions, which parallelly compete with the formation of 1,2-PD. The side reactions caused by acetol may include a series of plausible reactions, such as dehydration, oxidation, condensation, polymerization and so on, and dozens of byproducts could be possibly formed [3,5,6]. The reaction system of the byproducts formations caused by the side reactions with acetol is extremely complex and has not been exactly identified to date. Nevertheless, because it has been generally accepted that all the side reactions are caused by acetol, Equation (3) is essentially used only for the purpose of material balance, and the pseudo-reaction order with respect to acetol is assumed to be τ. The material balance is expressed by Equations (4)–(6) for acetol, 1,2-PD and other byproducts, respectively. The ordinary differential equations were solved by RStudio software combined with the nonlinear regression via the Levenberg-Marquardt algorithm to estimate the rate constants and reaction orders for each reaction. The normal probability plot of residual was generated by RStudio to check the validity of the model.
Figure 4 compares the experimental values and the predicted values by the kinetic model at different hydrogen pressures. It can be clearly observed that the experimental results (marker points) can be adequately fitted by the kinetic model (lines), suggesting the kinetic model is valid. The validity of the model is further verified by the normal probability plot of residuals, where most of the normalized residuals satisfactorily fall along the straight line within the 95% confidence interval, as illustrated in Figure S1 in the Supplementary Materials. The estimated value of the kinetic parameters is listed in Table 3. As observed in Figure 4, it is obvious that Pd can significantly enhance the acetol hydrogenation activity of the CZA catalyst. As depicted in Figure 4a,c,e, the 1,2-PD concentrations increase more rapidly using the Pd-promoted catalyst compared with those using the unpromoted CZA catalyst for all three hydrogen pressures, suggesting higher rates of acetol hydrogenation. The experimental results in Table 3 also suggest the promoting effect of Pd on the acetol hydrogenation activity of the CZA catalyst is significant, since at the same hydrogen pressure the selectivities of 1,2-Pd are apparently higher when a Pd-promoted catalyst is used. This promoting effect is attributed to the hydrogen spillover effect by the addition of Pd and its interaction with Cu, as has been extensively studied in the past years [12,13,18,19]. The Pd atom is much more active toward the dissociation of hydrogen molecules into hydrogen adatoms compared with Cu. Therefore, the addition of a trace amount of Pd onto a Cu surface can greatly facilitate the hydrogen molecules to dissociate into surface hydrogen atoms; the hydrogen atoms, due to the higher diffusivity, can be easily spilled over from the Pd surface to the Cu surface, providing more active hydrogenation sites. When an unpromoted CZA catalyst is used, due to the high energy barrier of Cu for hydrogen dissociation, the rate of dissociative adsorption of molecular hydrogen is significantly slower compared with the Pd-promoted catalyst, resulting in a lower rate of acetol hydrogenation. The TPR results in the previous section (Section 3.1) provide strong evidence in support of the spillover effect by the addition of Pd. More rapid hydrogenation of acetol into 1,2-PD by the addition of Pd can in turn suppress the side reactions due to lower acetol concentration in the reaction mixture, as depicted in Figure 4b,d,f, resulting in lower selectivites of other undesired by-products, as listed in Table 3. The reaction rate of acetol hydrogenation as the function of the acetol concentration ais evaluated via Equation (1) and illustrated in Figure 5. The results numerically verify that the acetol hydrogenation rates can be significantly enhanced using a Pd-promoted catalyst (dotted lines) as compared to using an unpromoted catalyst (solid lines) under the same acetol concentrations and hydrogen pressures. In addition, it is also observed in Figure 5 that, using the same catalyst, the rate of acetol hydrogenation is higher at a higher hydrogen pressure, suggesting the reaction is highly dependent on the amount of hydrogen supplied. Therefore, it can be clearly observed in Figure 4 that using the same catalyst, the hydrogen pressure was increased from 2.76 MPa to 5.52 MPa, and the increment of 1,2-PD concentration and decrement of acetol concentration were faster, revealing a higher rate of acetol hydrogenation at a higher hydrogen pressure. Therefore, the glycerol hydrogenolysis is conventionally carried out under an elevated hydrogen pressure in order to obtain a satisfactory rate of acetol hydrogenation. The high dependence of acetol hydrogenation rate on the hydrogen pressure is mainly because the concentration of hydrogen dissolved in the reaction mixture is dependent on the hydrogen pressure, as described in Equation (1). A higher hydrogen pressure can result in a higher hydrogen concentration in the reaction mixture, so that more hydrogen molecules can be absorbed on the catalyst surface, competing with other compounds such as 1,2-PD and acetol. Therefore, more hydrogenation active sites can be provided, leading to a higher acetol hydrogenation rate. The evaluations of β and k1 by Equation (2) are shown in Figure 6. It is very clear that the two lines are almost perfectly parallel to each other, suggesting the addition of Pd does not significantly change the reaction order with respect to hydrogen pressure (β). The values of β for the CZA and 2Pd/CZA catalysts are estimated to be 2.00 and 2.07, respectively. The reactions catalyzed by both catalysts are approximately second order with respect to hydrogen pressure. However, the rate constant of acetol hydrogenation using the Pd-promoted catalyst is almost one order of significance higher than that using the unpromoted CZA catalyst, revealing the substantial promoting effect of Pd on the acetol hydrogenation activity. In summary, Equation (1) can be re-written with the numerical values of the kinetic parameters applied for the two different catalysts, as presented in Equation (7) for the CZA catalyst and Equation (8) for the 2Pd/CZA catalyst. The kinetic parameters of the acetol hydrogenation will be further applied for the kinetic analyses of glycerol hydrogenolysis in the following section.
r 1 a = 4.410 × 10 10 A c e t o l 0.83 P H 2 2.00
r 1 b = 1.435 × 10 9 A c e t o l 1.00 P H 2 2.07

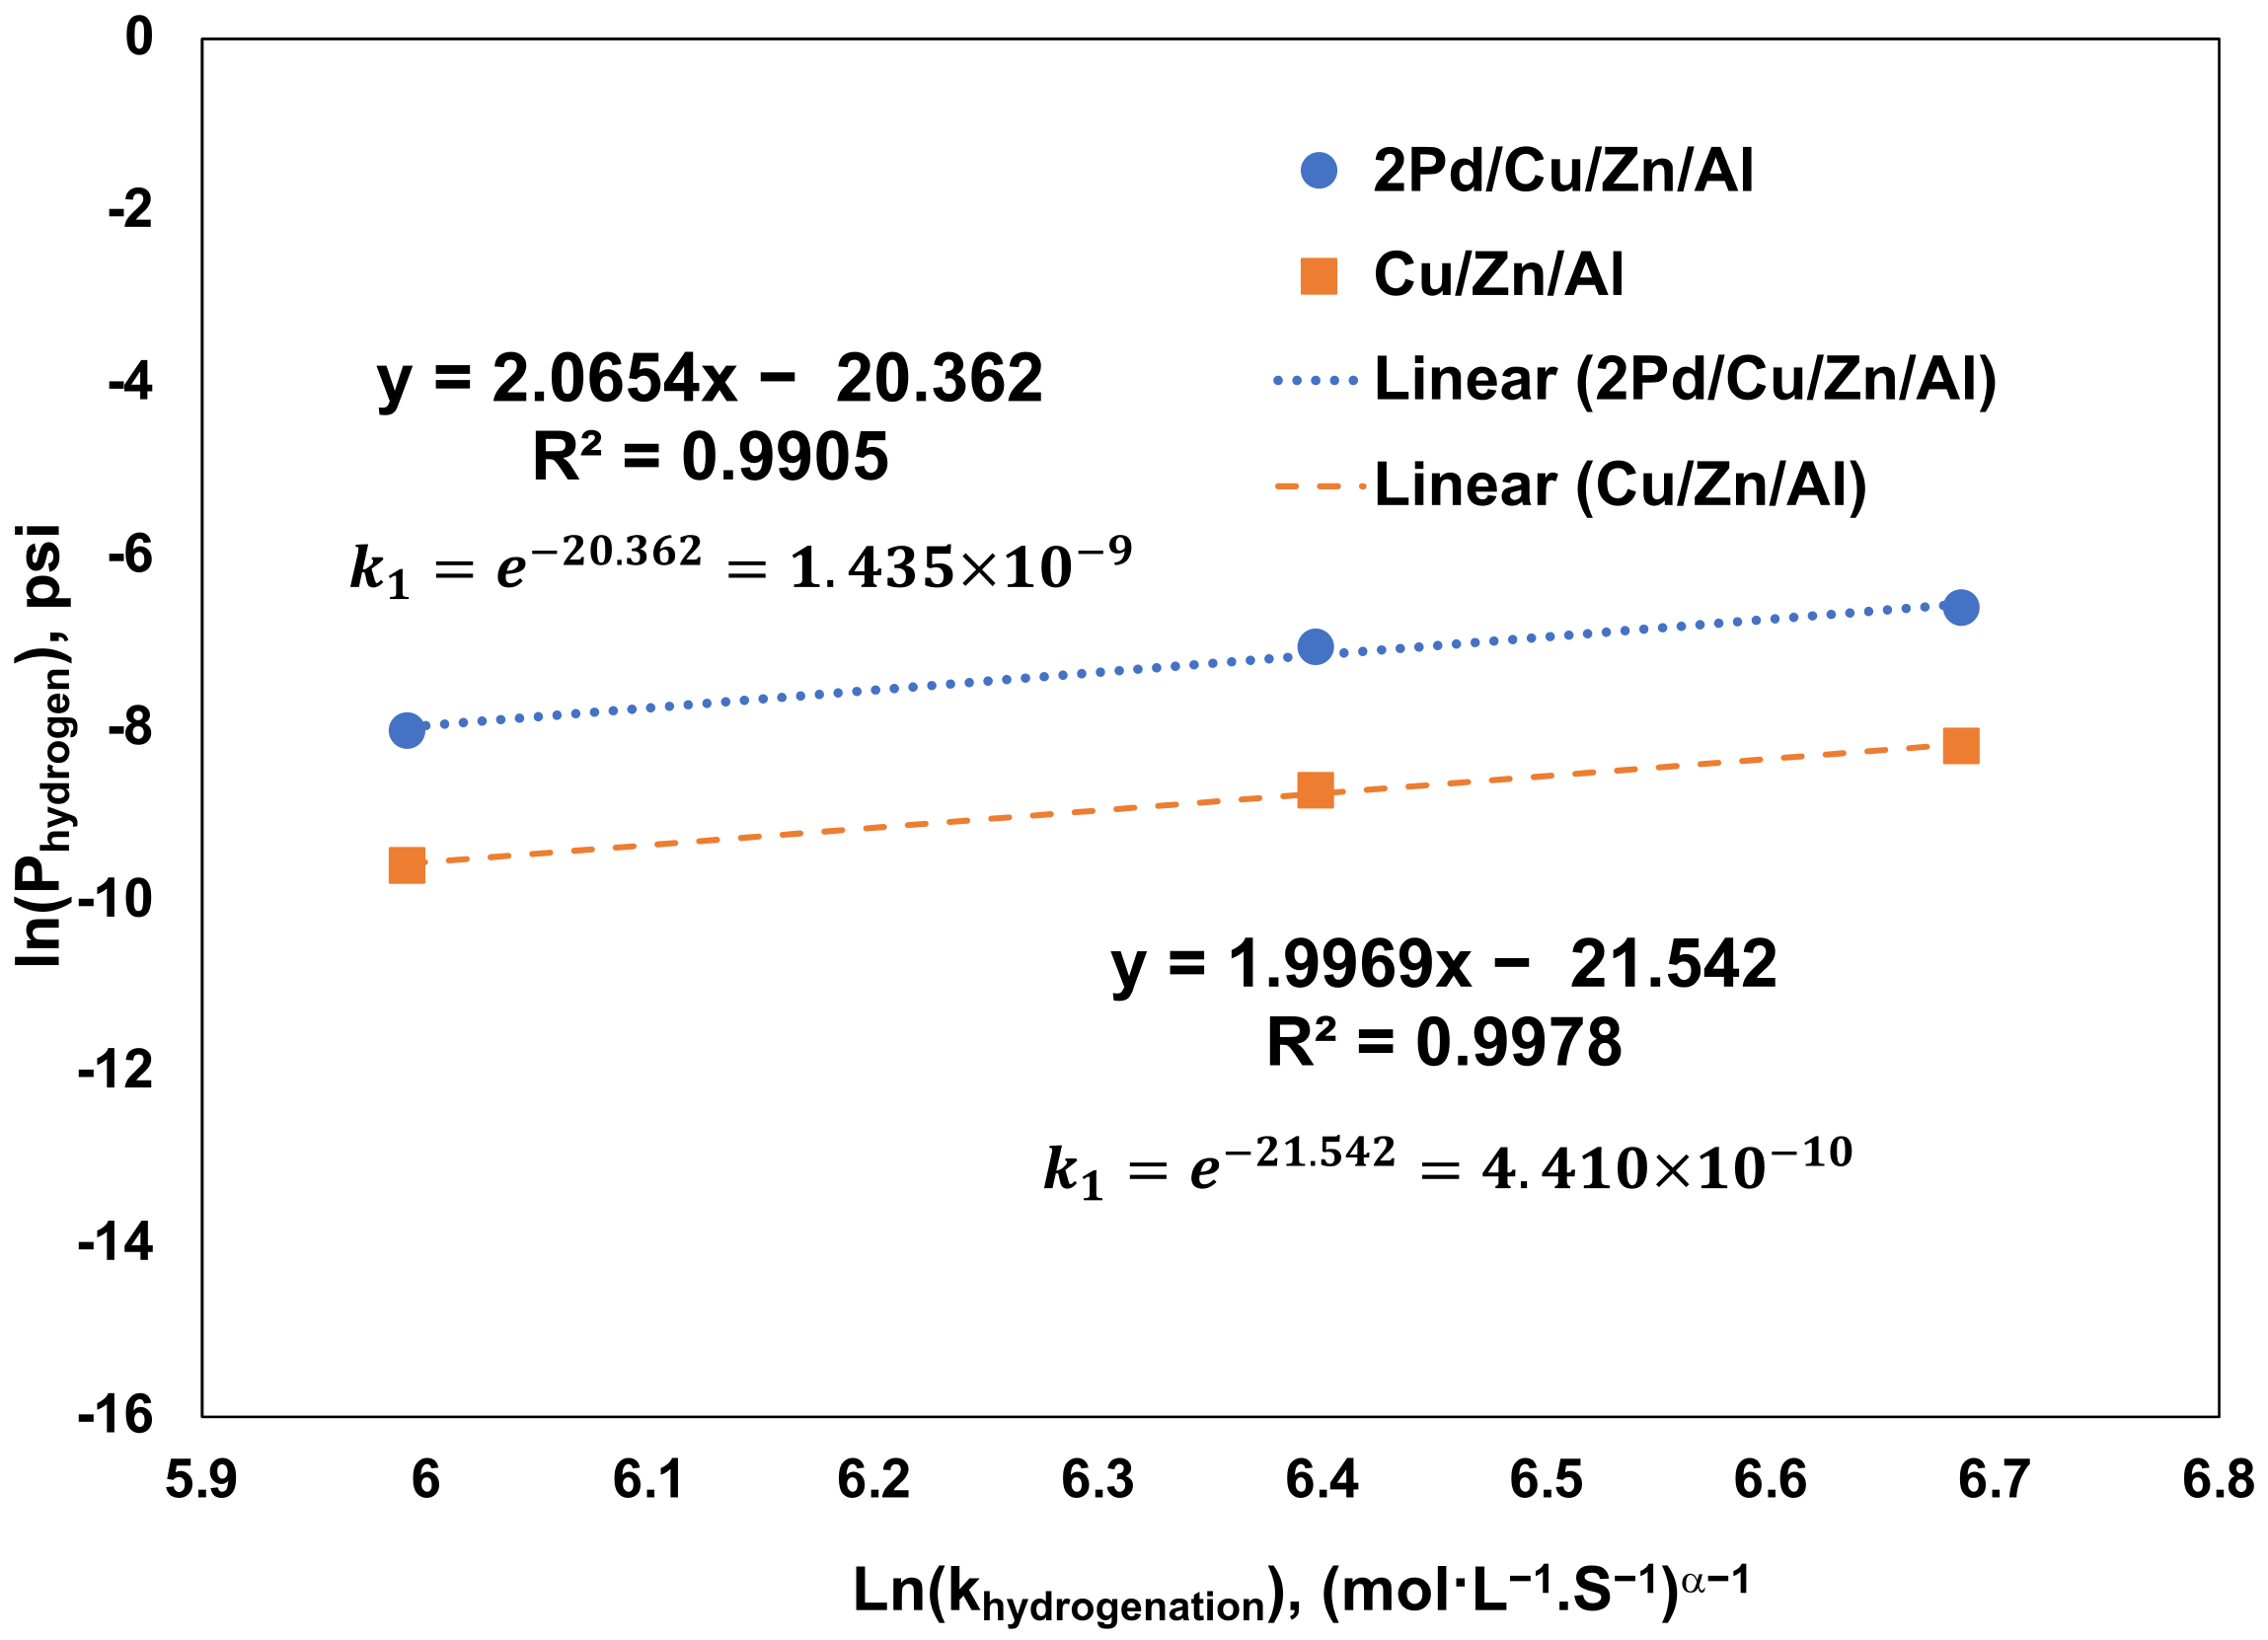
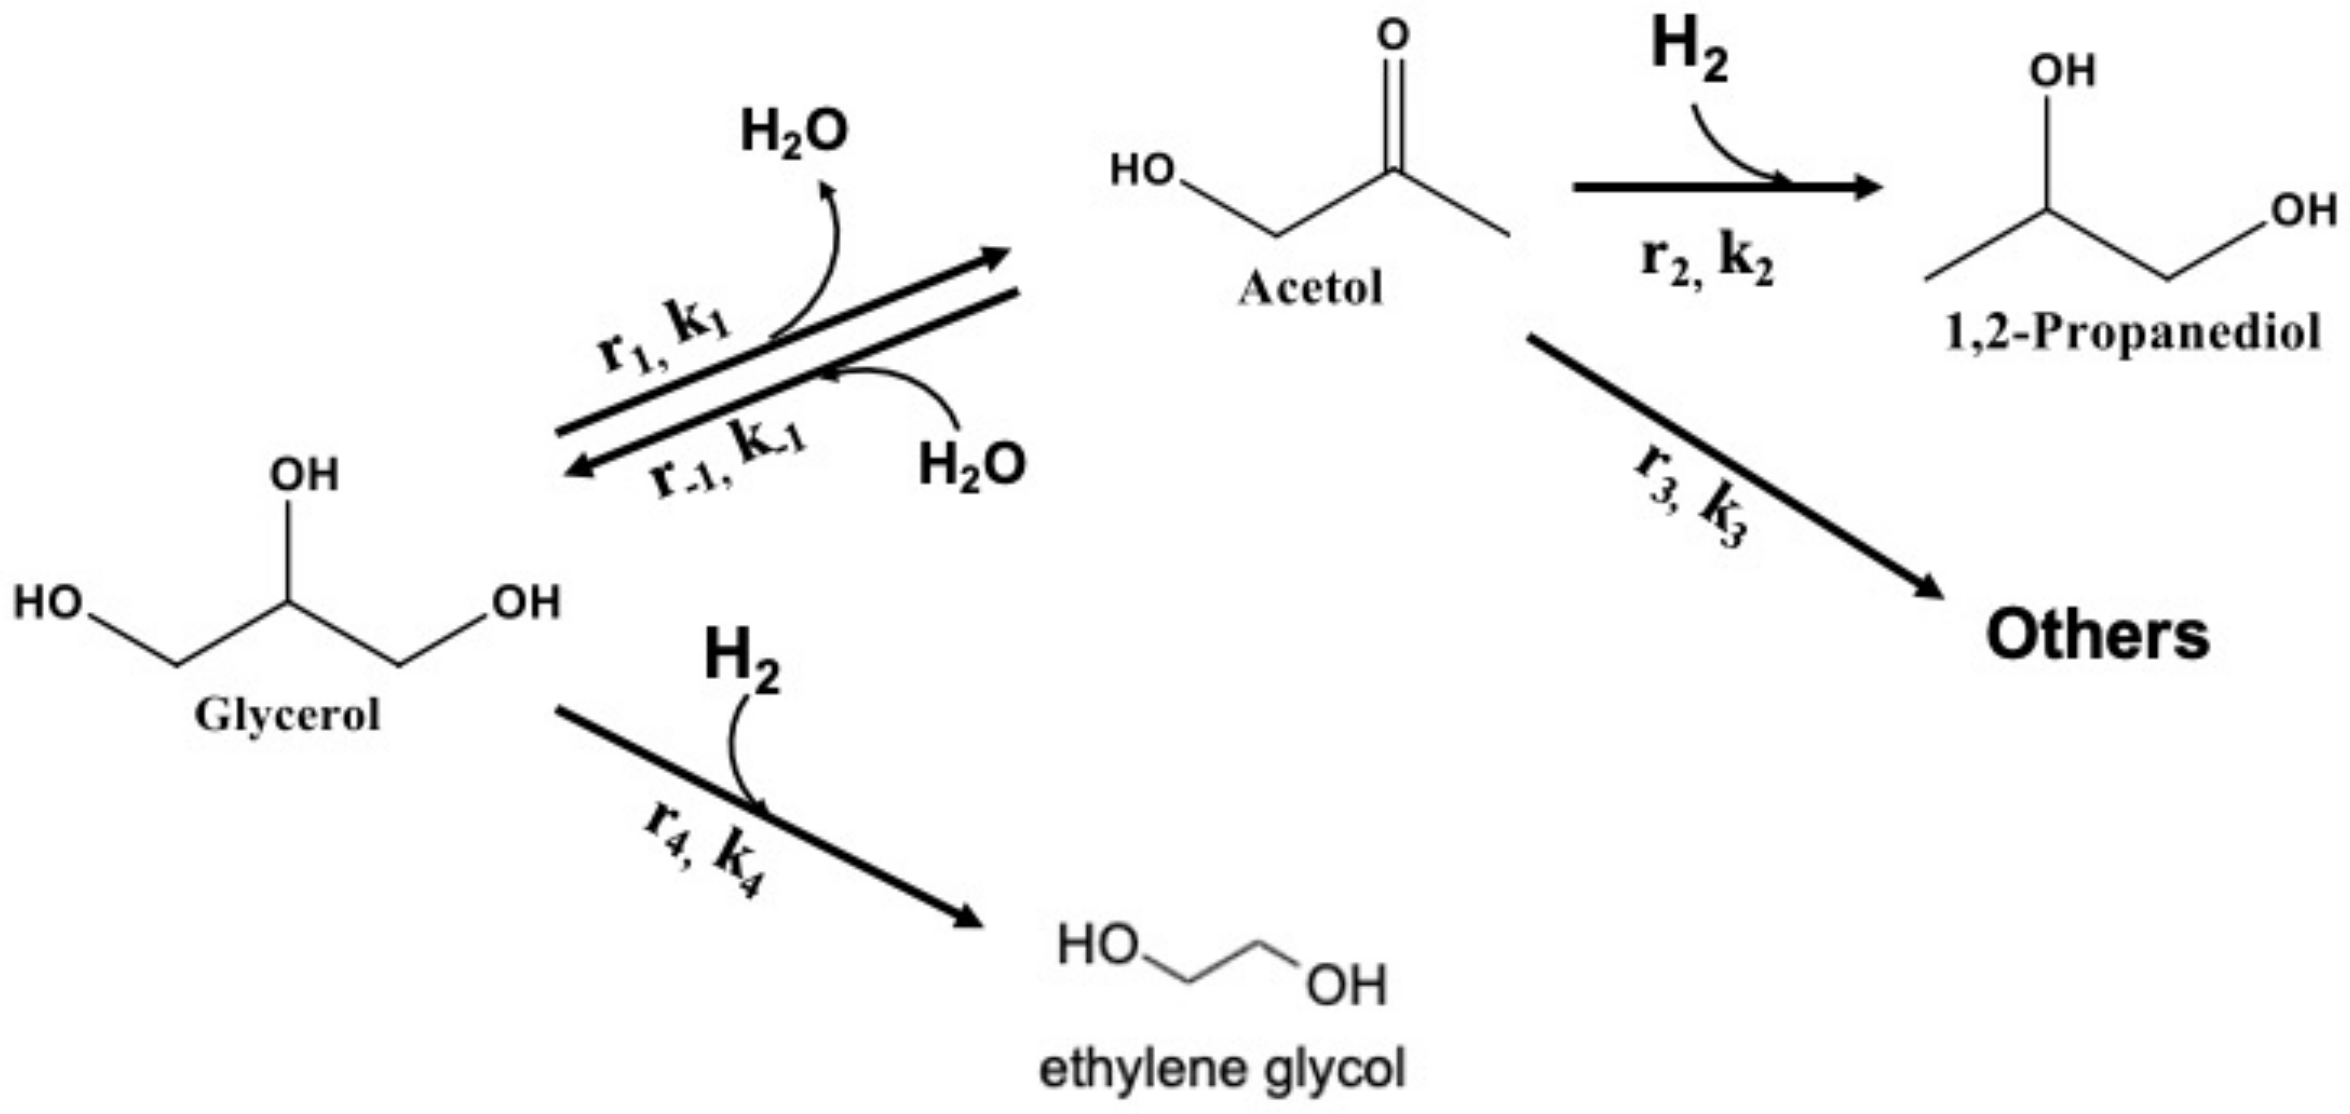
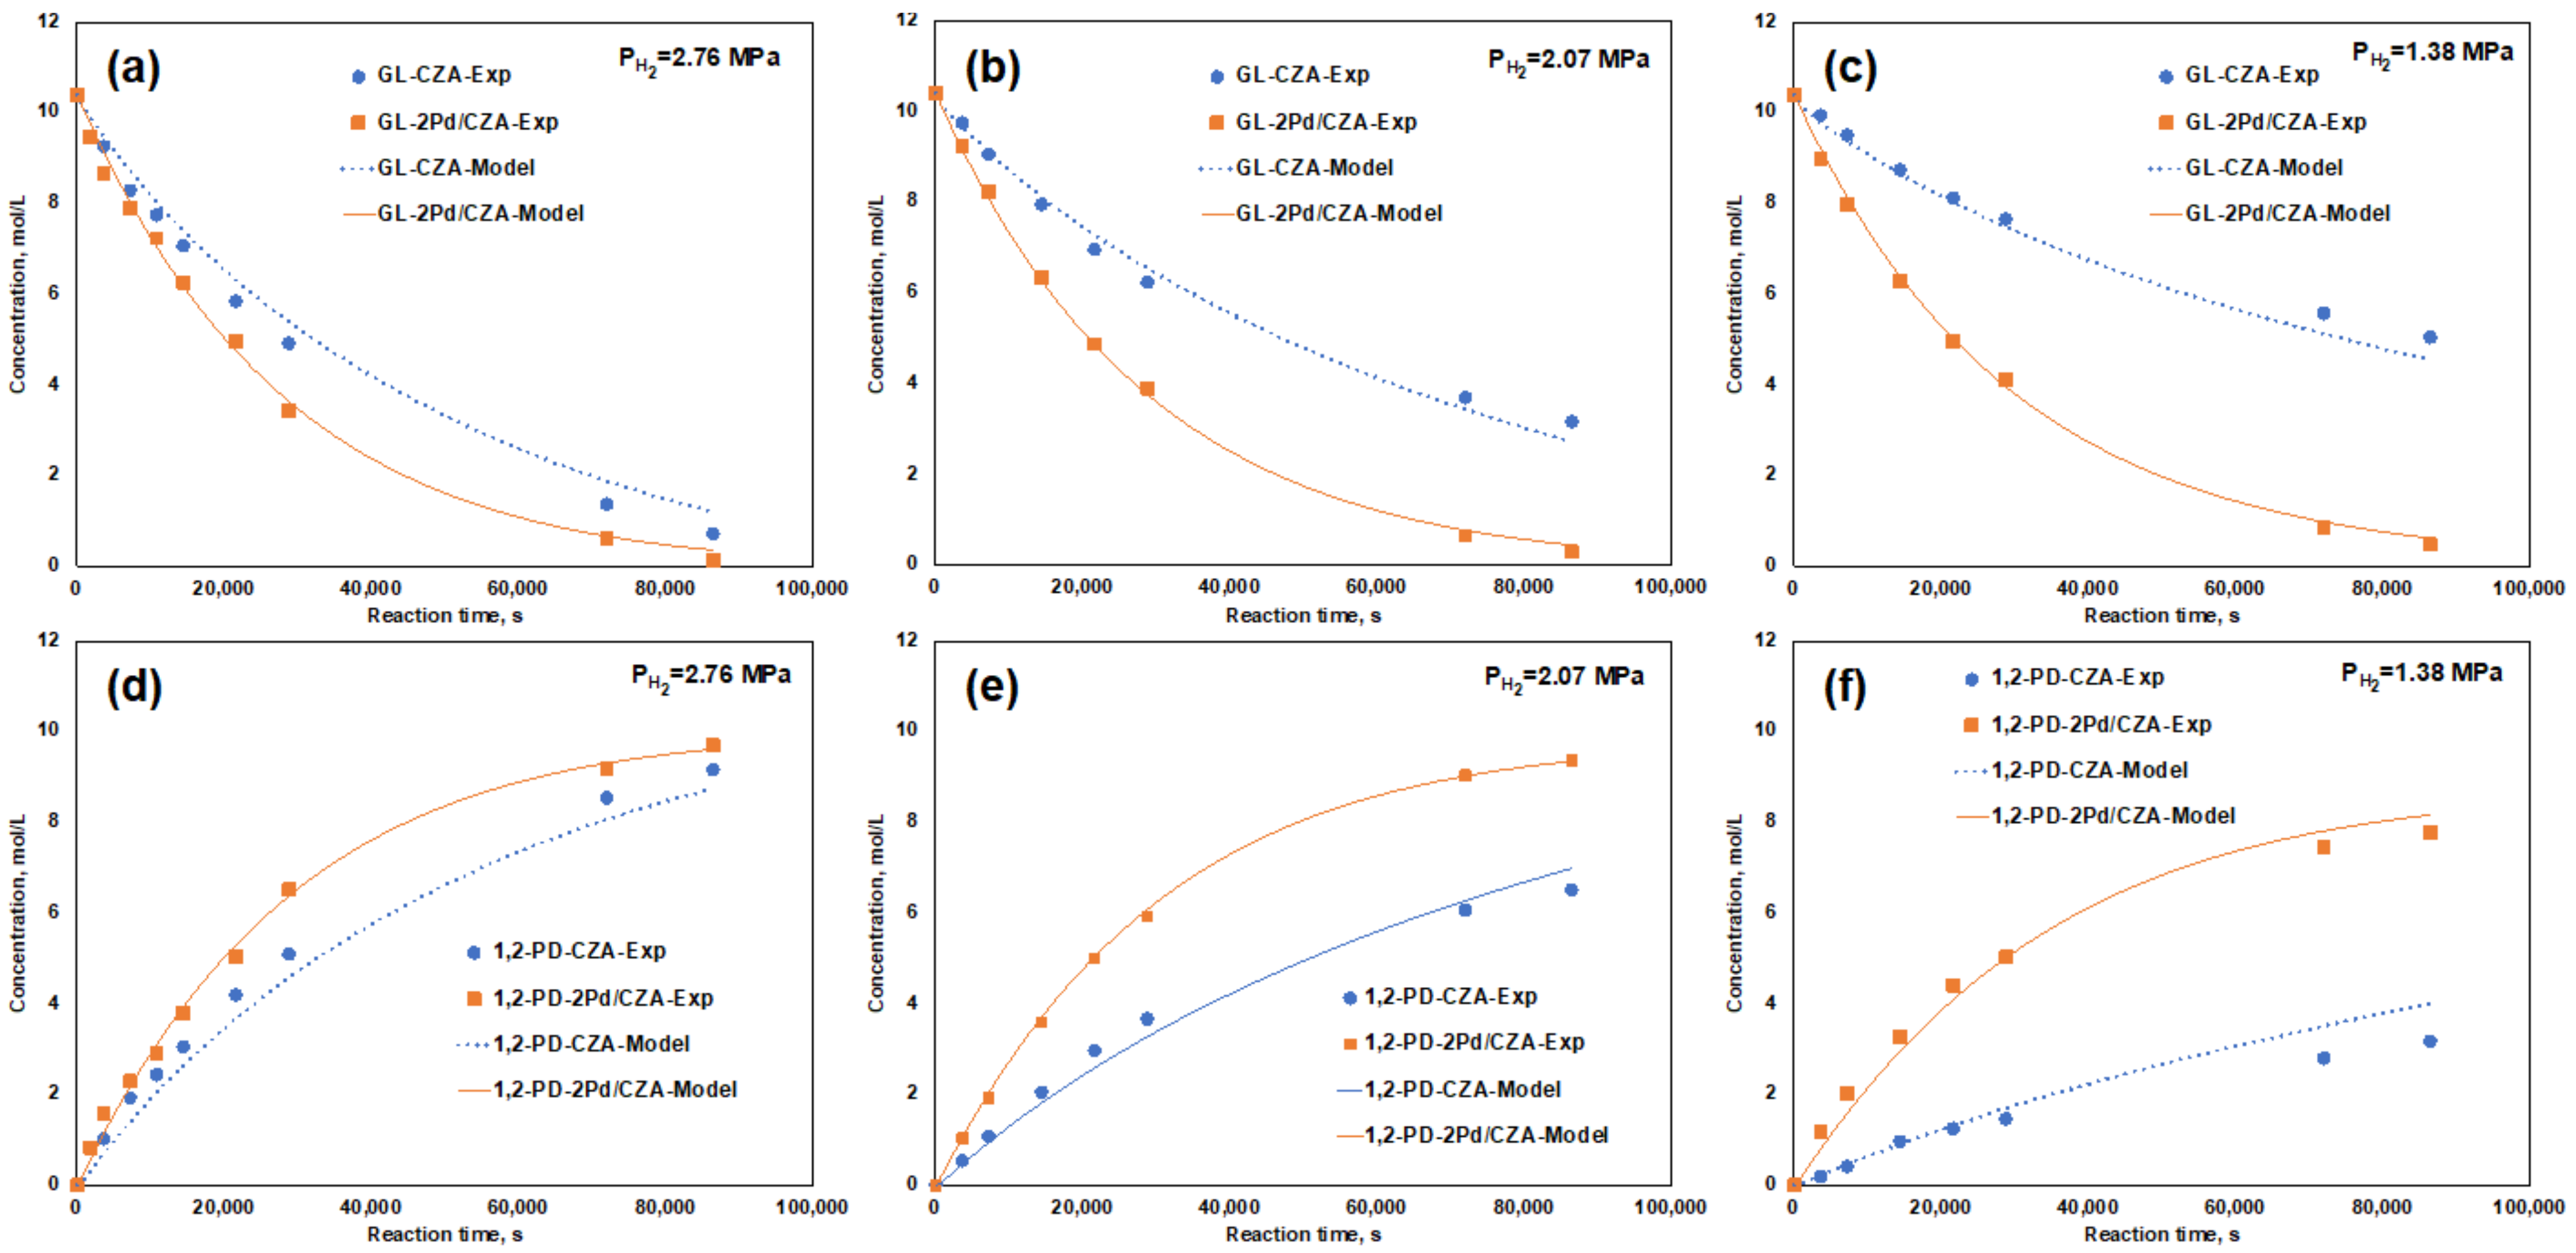
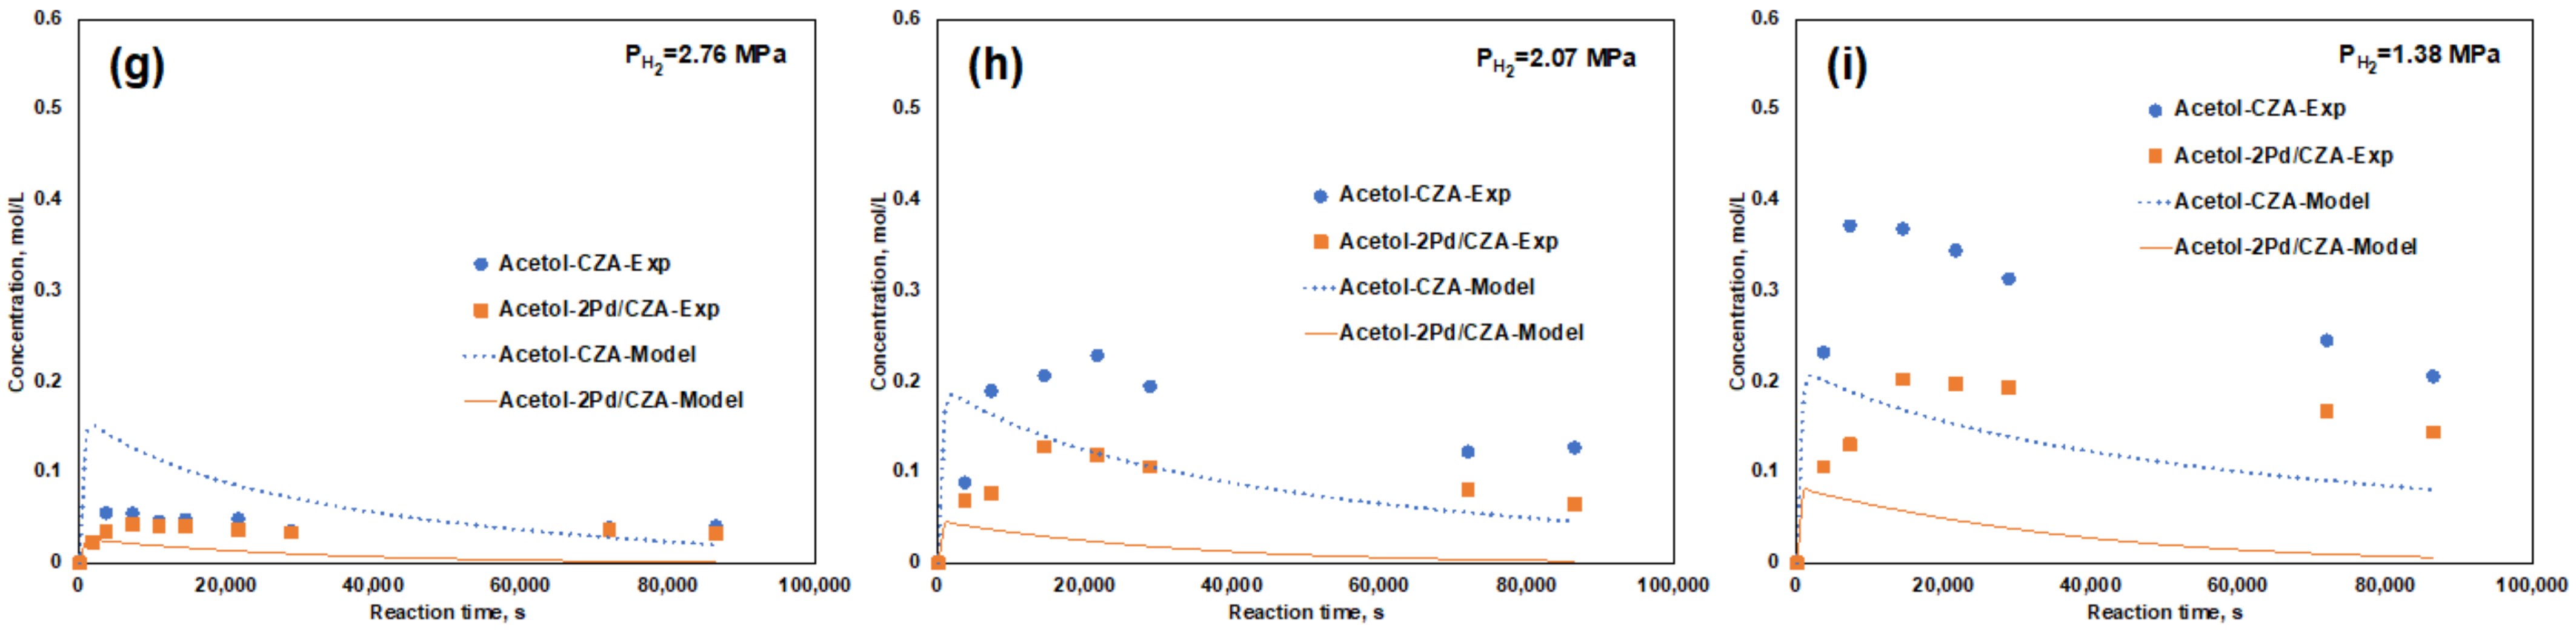
3.4. Promoting Effect of Pd on the Glycerol Hydrogenolysis Activity of the Cu/ZnO/Al2O3 Catalyst

As discussed in the previous section, the addition of Pd (2 wt%) has been found to be capable of significantly enhancing the acetol hydrogenation activity of the CZA catalyst. The promoting effect of Pd (2 wt%) on the catalytic activity of the CZA catalyst for the glycerol hydrogenolysis process was also investigated. The reactions were carried out at three different hydrogen pressures (1.38 Mpa, 2.07 Mpa and 2.76 Mpa). The kinetic analyses were carried out using a power-law model based on the reaction pathway, as illustrated in Figure 7. Glycerol is dehydrated to form acetol, consecutively followed by two parallel reactions, which are acetol hydrogenation and side reactions. The rate expression of glycerol (denoted as “GL”) dehydration, acetol hydrogenation and side reactions are presented by Equation (9), Equation (10) and Equation (11), respectively, as listed in Table 4. The reaction orders with respect to acetol (α) and hydrogen (β) in Equation (10) were previously determined in Equation (7) and Equation (8) for the CZA catalyst and the 2Pd/CZA catalyst, respectively. The liquid phase glycerol dehydration was considered as a highly equilibrium limited reaction [27,28,30,40]; the rate of reverse reaction, which is acetol hydration, is taken into consideration in the kinetic model, as presented by Equation (12). The rate expression of the formation of ethylene glycol (EG) due to the glycerol C-C cleavage is presented by Equation (13). The material balances of each component are presented in Equations (14)–(18) for glycerol, acetol, 1,2-PD, other byproducts and EG, respectively.
Table 5 lists the glycerol conversion and selectivities of different products using two different catalysts at different hydrogen pressures. When the hydrogen pressure is 2.76 Mpa, the glycerol conversion using the Pd-promoted CZA catalyst is 98.9%, which is 5.9% higher than that using an unpromoted CZA catalyst. The selectivity of 1,2-PD using the Pd-promoted catalyst (94.0%) was slightly lower than that using the unpromoted catalyst (94.8%), mainly due to the slightly higher EG selectivity. No other byproduct was found in both of the final samples, revealing that the side reactions did not occur to a detectable extent. When the hydrogen pressure was reduced to 2.07 Mpa, the glycerol conversion and 1,2-PD selectivity using the Pd-promoted catalyst were only slightly decreased from 98.9% to 97.2% and from 94.0% to 93.3%, respectively. In contrast, when the unpromoted catalyst was used under 2.07 Mpa hydrogen pressure, both glycerol conversion and 1,2-PD selectivity were considerably decreased, as the glycerol conversion dropped from 93.0% to 69.4% and the 1,2-PD selectivity dropped from 94.8% to 89.7%. When the hydrogen pressure was further decreased to 1.38 Mpa, the glycerol conversion and 1,2-PD selectivity using the CZA catalyst dropped significantly, to only 51.3% and 58.1%, respectively; the low selectivity of 1,2-PD was mainly due to the high selectivity of the other undesired byproducts. When using the Pd-promoted catalyst at 1.38 Mpa hydrogen pressure, the glycerol conversion was still over 90%, and the 1,2-PD selectivity was still reasonably high (78.0%). However, a considerably high selectivity of the undesired by-products was observed (17.1%), suggesting that 1.38 Mpa hydrogen pressure was not sufficient for acetol hydrogenation, even with Pd loaded. It is interesting to notice that at a higher hydrogen pressure, i.e., 2.76 Mpa, the catalyst activity seems not to be significantly affected by the introduction of Pd. When the hydrogen pressure is reduced, the promoting effect of Pd becomes more obvious. Furthermore, the selectivity of EG using the 2Pd/CZA catalyst is higher than that using the CZA catalyst, suggesting a promoting effect of the catalytic activity for the C-C cleavage of glycerol caused by the introduction of Pd, which has been reported in a number of works [4,21,29,41]. In general, it is found that when the glycerol hydrogenolysis reaction is carried out under a high hydrogen pressure (i.e., 2.76 Mpa), the addition of Pd is not necessary, as Pd is an expensive metal compared with copper, and the promoting effect of Pd is not significant. However, since a lower hydrogen pressure is always industrially desired, as it not only reduces the risk caused by high hydrogen pressure operation due to potential leaks and explosion when coming into contact with air but also reduces equipment costs, as it precludes the high-level leak-proof requirements for high pressure hydrogen. If the glycerol hydrogenolysis reaction needs to be carried out under a low hydrogen pressure (i.e., 2.07 Mpa), the addition of Pd becomes essential.
Table 6 lists the estimated values of the parameters in the kinetic model and Figure 8, comparing the simulated values of the concentrations of each component over the reaction time with the corresponding experimental values. It can be observed that the experimental values and the model-simulated values exhibit a good agreement, suggesting the model is valid. The validity of the model is further verified by the normal probability plot of the residual, as shown in Figure S2 in the Supplementary Materials. It can be clearly observed in Figure 8a–c that the glycerol concentrations decrease faster over the reaction time at all three hydrogen pressures using a Pd-promoted CZA catalyst compared with using the unpromoted CZA catalyst, suggesting that the addition of Pd can enhance the glycerol conversion rate. Figure 8d–f demonstrates that the addition of Pd can increase the 1,2-PD formation rates for all three hydrogen pressures. When the hydrogen pressure is high, i.e., 2.76 MPa in Figure 8a,d, the differences of the glycerol concentrations and 1,2-PD concentrations over the reaction time between using the 2Pd/CZA catalyst and CZA catalyst are insignificant, suggesting comparable glycerol conversion and 1,2-PD formation rates. When the hydrogen pressure was decreased (i.e., 2.07 MPa and 1.38 MPa), the glycerol conversion and 1,2-PD formation rates using the unpromoted CZA catalyst are reduced more drastically, since the decrement of glycerol concentration and increment of 1,2-PD concentration are obviously slower compared with using the 2Pd/CZA catalyst, as illustrated in Figure 8b,c,e,f. Figure S3 in the Supplementary Materials displays the glycerol conversion rates calculated by Equation (14) as the function of the glycerol concentrations during the reaction time. It can be clearly observed that as hydrogen pressure decreases, the difference in glycerol conversion rates using the Pd-promoted CZA catalyst and the unpromoted catalyst becomes larger, indicating that the enhancement of the glycerol conversion rate by Pd is more critical at a lower hydrogen pressure.
It is generally accepted that glycerol dehydration is an acid catalyzed reaction [3,8,34]. From the acidity study in the previous discussion of NH3 TPD results (Section 3.2), the addition of Pd reduced the amount of acidic sites, which can inhibit the glycerol dehydration step. The rates of glycerol dehydration were calculated by Equation (9) using the estimated kinetic parameters listed in Table 6. Figure 9 compares the glycerol dehydration rates as the function of glycerol concentrations using two different catalysts. The glycerol dehydration rates using a Pd-promoted CZA catalyst are slightly lower than those using an unpromoted CZA catalyst when the glycerol concentrations are the same. The small reduction of glycerol dehydration rate caused by the addition of 2 wt% Pd is in good agreement with the aforementioned results of NH3 TPD (Section 3.2).
Though lower glycerol dehydration rates were observed using the Pd-promoted CZA catalyst under the same glycerol concentrations, it was found in the previous discussion that Pd can significantly enhance the glycerol conversion rate. Such enhancement of the glycerol conversion rate by Pd is primarily due to the promotion of the acetol hydrogenation activity of the catalyst by Pd. When 2 wt% Pd was doped onto the CZA catalyst, acetol could be more rapidly hydrogenated into 1,2-PD due to the spillover effect, resulting in a lower acetol concentration in the reaction mixture. Therefore, the reverse reaction of glycerol dehydration, which is acetol hydration, can be inhibited, resulting in a higher rate of glycerol conversion. Figure 10 illustrates the reaction rates of glycerol dehydration (r1), reverse glycerol dehydration (r−1), acetol hydrogenation (r2) and glycerol conversion (rGL) over the reaction time. As observed in Figure 10a,b, using the Pd/CZA catalyst, the reaction rates of glycerol dehydration over the reaction time are nearly identical to the rate of acetol hydrogenation, and the reverse reaction of glycerol dehydration rates are extremely low. The results show strong evidence that the glycerol dehydration is the rate-determining step. The vast majority of acetol is hydrogenated into 1,2-PD as soon as it is formed via glycerol dehydration, resulting in very low concentrations of acetol in the reaction mixture, as illustrated in Figure 10g,h. Thus, the rates of the reverse glycerol dehydration reaction can be negligible, and the overall glycerol conversion rates are dominantly determined by the rate of glycerol dehydration. It should be noted that when the hydrogen pressure was 1.38 MPa, as depicted in Figure 10c, due to the low hydrogen pressure, the rates of acetol hydrogenation became notably lower than the rates of glycerol dehydration, resulting in an increased concentration of acetol in the reaction mixture. Thus, the selectivity of the undesired byproducts formed via side reactions caused by acetol in the reaction mixture became higher, as listed in Table 5.
In contrast, when the CZA catalyst was used, as shown in Figure 10d–f, although higher glycerol dehydration rates could be obtained, the rates of reverse glycerol dehydration, which is acetol hydration, were more noticeable compared with those using the 2Pd/CZA catalyst. This is because the insufficient acetol hydrogenation rates could result in elevated concentrations of acetol in the reaction mixture, facilitating the acetol hydration. Thus, the glycerol conversion rates became lower. It can be further noticed that at a high hydrogen pressure, i.e., 2.76 MPa in Figure 10d, the rates of acetol hydrogenation were higher than the rates of reverse glycerol dehydration reaction. As the hydrogen pressure decreased, as shown in Figure 10e,f, the rates of acetol hydrogenation were decreased, and the rates of reverse glycerol dehydration became noticeably higher than the acetol hydrogenation rates over the reaction time. In this situation, the acetol hydrogenation step can be considered as the rate determining step of the whole reaction system. This assumption can be observed in Figure 10e,f; the rates of glycerol conversion are very close to the rates of acetol hydrogenation rates. By applying the stepwise power-law kinetic model, the reaction rates of all the elementary reactions and overall reactions are clearly observable. Thus, the promoting effect of Pd can be mechanistically understood.

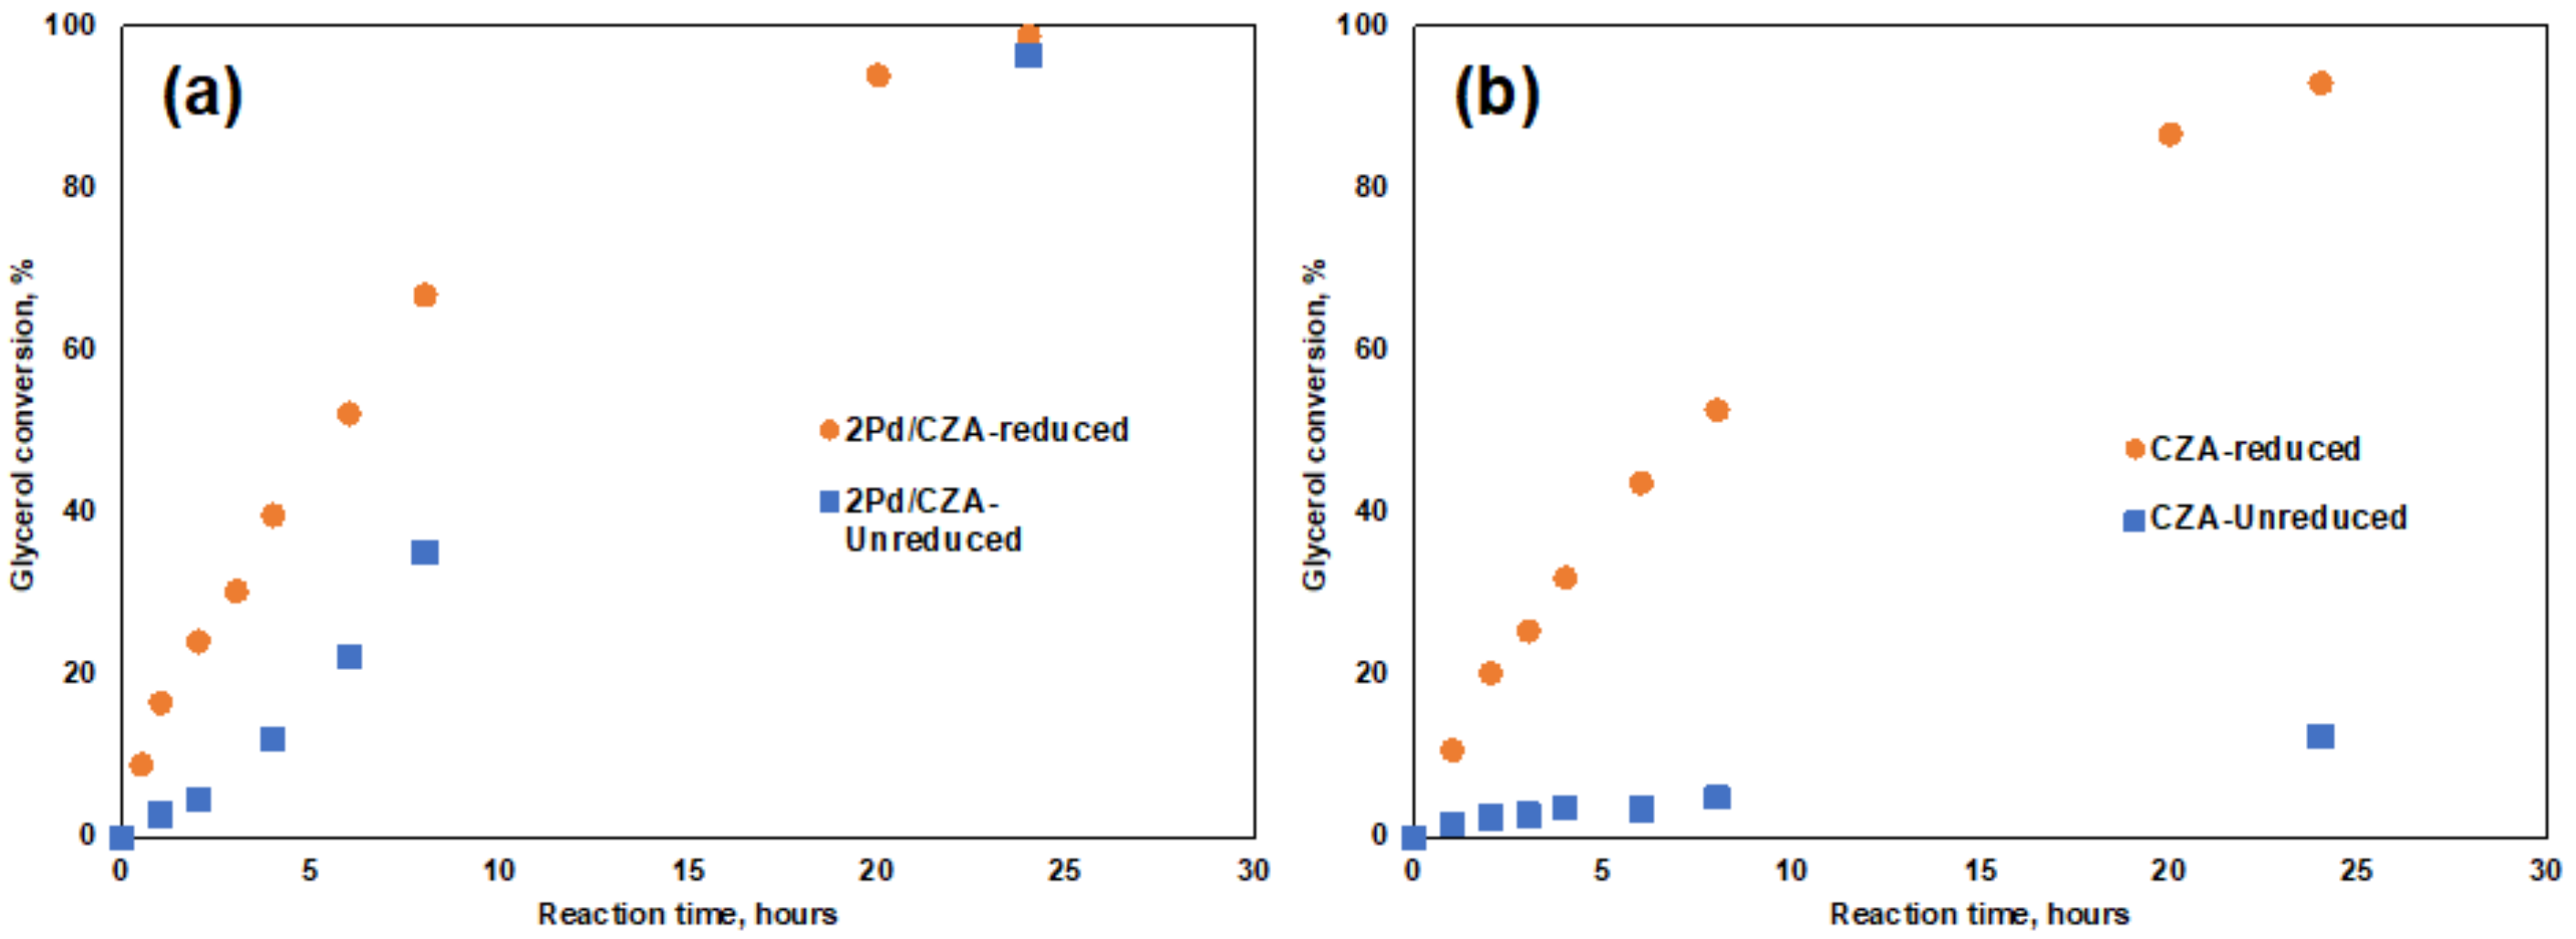
3.5. Activities of the Unreduced Catalysts with Pd and without Pd Promoted for Glycerol Hydrogenolysis

It was discussed in the previous TPR analysis (Section 3.1) that the addition of Pd can improve the reducibility of the CZA catalyst so that, with Pd doped, the catalyst can be effectively reduced below 200 °C, which is the reaction temperature used for glycerol hydrogenolysis reactions. In order to investigate the spillover effect of Pd on the reducibility of the catalyst, the glycerol hydrogenolysis reactions using unreduced CZA and 2Pd/CZA were carried out. Table 7 lists the conversion of the glycerol and selectivities of different products in the final product mixture; the results are compared with those using the reduced catalysts. It is interesting to notice that when using the unreduced 2Pd/CZA catalyst, the glycerol conversion and selectivities of all products are very close compared with using the reduced catalyst. In contrast, the unpromoted CZA catalyst is nearly inactive, as the glycerol conversion was significantly decreased, from 90.1% using a reduced catalyst to only 12.6%. Figure 11 compares the glycerol conversions over the reaction time using the reduced catalyst and unreduced catalyst. It can be observed in Figure 11a that, using the 2Pd/CZA catalyst, the increment of glycerol conversions using an unreduced catalyst is slower at the early stage of the reaction. As the reaction proceeded to the end, the glycerol conversion of the final product (96.3%) became similar to that using a reduced catalyst (98.9%). If the unreduced CZA catalyst was used, as illustrated in Figure 11b, the glycerol conversions over the reaction time are very low, suggesting the unreduced CZA catalyst is largely inert to the reaction. The catalytic activity differences between the two unreduced catalysts can be explained by the enhanced reducibility by the addition of Pd. From the previously illustrated TPR analysis results (Section 3.1), the reduction of the 2Pd/CZA catalyst starts at 45 °C and reaches its maximum rate at 133 °C. At the reaction temperature of 200 °C, it is believed that the reduction of the catalyst by the dissolved hydrogen in the liquid phase occurs over the reaction time. The molecular hydrogen was spontaneously dissociated into the atomic surface hydrogen on the Pd surface and spilled over to the adjacent CuO, reducing the metal oxide molecules. It is generally accepted that Cu is the primary active phase for glycerol dehydration reaction [3,4,42]. As the degree of reduction increased over the reaction time, more surface CuO could be reduced to metallic Cu, providing more active sites for the reaction. For the CZA catalyst, according to the TPR results (Figure 1), the reduction started at 190 °C and reached its maximum reduction rate at 290 °C, and the reduction process was found to be slower than the 2Pd/CZA catalyst. Therefore, at the reaction temperature of 200 °C, the catalyst cannot be effectively reduced compared with the 2Pd/CZA catalyst, resulting in less active sites for the reaction. The enhanced reducibility of the catalyst by Pd is in good agreement with the results of the TPR experiments, further proving the spillover effect of Pd on the CZA catalyst. In addition, the enhancement of the reducibility can also possibly contribute to the higher catalytic activity of the Pd-promoted CZA catalyst. The small amount of oxygen dissolved in the reaction mixture could possibly deactivate the catalyst by oxidizing the surface Cu [43]. With Pd doped onto the CZA catalyst, the oxidized Cu can be in situ reduced at the reaction temperature during the process, preventing the potential loss of the catalyst activity.

4. Conclusions

The promoting effect of Pd on the CZA catalyst for the aqueous glycerol hydrogenolysis to produce 1,2-propanediol was investigated. The experiments of glycerol hydrogenolysis and acetol hydrogenation were carried out in a batch reactor, applying different hydrogen pressures. The experimental results showed that adding Pd onto the CZA catalyst was essential in order to obtain a high glycerol conversion and 1,2-PD selectivity when the glycerol hydrogenolysis reactions were carried out at a hydrogen pressure lower than 2.76 MPa. A power-law kinetic model, which takes into account all the elementary reactions including glycerol dehydration and its reverse reaction, acetol hydrogenation, side reactions and EG formation, was developed to study the promoting effect of Pd on the CZA catalyst. For the acetol hydrogenation process, the reaction rate can be increased by nearly one order of magnitude using the 2Pd/CZA catalyst. The enhancement of the acetol hydrogenation activity of the CZA catalyst by Pd is mainly due to the hydrogen spillover effect. For the glycerol hydrogenolysis process, using the 2Pd/CZA catalyst, the reaction rate of glycerol dehydration was slightly decreased compared with using the unpromoted CZA catalyst, mainly due to the reduced number of acidic sites. However, the rate of glycerol conversion was significantly increased, especially at a reduced hydrogen pressure, which mainly contributed to the enhanced catalytic activity of acetol hydrogenation. The kinetic results demonstrated that, using a Pd-promoted CZA catalyst, the vast majority of the acetol formed via glycerol dehydration can be effectively hydrogenated into 1,2-PD, inhibiting the reverse reaction of glycerol dehydration; the glycerol dehydration can be considered as the rate determining step. In contrast, when an unpromoted CZA catalyst was used, the rate of the reverse reaction of glycerol dehydration was increased due to the insufficient activity of acetol hydrogenation, especially at a reduced hydrogen pressure. The acetol hydrogenation in this situation plays a dominant role as the rate determining step. In addition, the elevated acetol concentration can facilitate the side reactions caused by acetol, resulting in lower selectivity of 1,2-PD. Furthermore, Pd can assist in in situ reduction of CuO into metallic Cu over the reaction time, so that the unreduced Pd-promoted CZA catalyst exhibits a significantly higher activity than the unreduced CZA catalyst. The improved reducibility of the Pd-promoted catalyst can possibly prevent catalyst deactivation due to the potential oxidation of the catalyst during the reaction.

Supplementary Materials

The following supporting information can be downloaded at: https://www.mdpi.com/article/10.3390/biomass2010003/s1, Figure S1: Normal probability plots of residuals for acetol hydrogenation reactions using two catalysts: (a) CZA catalyst; (b) 2Pd/CZA catalyst. Dotted curve: 95% confidence interval, Figure S2: Normal probability plots of residuals for glycerol hydrogenolysis reactions using two catalysts: (a) CZA catalyst; (b) 2Pd/CZA catalyst. Dotted curve: 95% confidence interval, Figure S3: Effect of Pd on the glycerol conversion rates over the reaction time at different hydrogen pressures. Other reaction conditions: 200 °C, 500 RPM, 80 wt% aqueous glycerol, 5 wt% catalyst with respect to the weight of glycerol.

Author Contributions

Conceptualization, Y.L. and F.T.T.N.; methodology, Y.L.; validation, G.L.R. and F.T.T.N.; formal analysis, Y.L.; writing—original draft preparation, Y.L.; writing—review and editing, F.T.T.N.; supervision, G.L.R. and F.T.T.N.; project administration, G.L.R. and F.T.T.N.; funding acquisition, G.L.R. and F.T.T.N. All authors have read and agreed to the published version of the manuscript.

Funding

This research was funded by Natural Science and Engineer Research Council of Canada (NSERC) Discovery Grant Program.

Data Availability Statement

Data available in a publicly accessible repository.

Acknowledgments

The financial support from Natural Science and Engineer Research Council of Canada (NSERC) Discovery Grant Program is gratefully acknowledged.

Conflicts of Interest

The authors declare no conflict of interest.

References

  1. Kaur, J.; Sarma, A.K.; Jha, M.K.; Gera, P. Valorisation of crude glycerol to value-added products: Perspectives of process technology, economics and environmental issues. Biotechnol. Rep. 2020, 27, e00487. [Google Scholar] [CrossRef] [PubMed]
  2. Liu, Y.; Pasupulety, N.; Gunda, K.; Rempel, G.L.; Ng, F.T.T. Glycerol Hydrogenolysis to 1,2-Propanediol by Cu/ZnO/Al2O3 Catalysts. Top. Catal. 2014, 57, 1454–1462. [Google Scholar] [CrossRef]
  3. Liu, Y.; Guo, X.; Rempel, L.G.; Ng, T.T.F. The Promoting Effect of Ni on Glycerol Hydrogenolysis to 1,2-Propanediol with In Situ Hydrogen from Methanol Steam Reforming Using a Cu/ZnO/Al2O3 Catalyst. Catalysts 2019, 9, 412. [Google Scholar] [CrossRef] [Green Version]
  4. Liu, Y.; Mai, C.T.Q.; Ng, F.T.T. Glycerol Hydrogenolysis with In Situ Hydrogen Produced via Methanol Steam Reforming: The Promoting Effect of Pd on a Cu/ZnO/Al2O3 Catalyst. Catalysts 2021, 11, 110. [Google Scholar] [CrossRef]
  5. van Ryneveld, E.; Mahomed, A.S.; van Heerden, P.S.; Friedrich, H.B. Direct Hydrogenolysis of Highly Concentrated Glycerol Solutions over Supported Ru, Pd and Pt Catalyst Systems. Catal. Lett. 2011, 141, 958–967. [Google Scholar] [CrossRef]
  6. Chiu, C.; Tekeei, A.; Ronco, J.M.; Banks, M.; Suppes, G.J. Reducing Byproduct Formation during Conversion of Glycerol to Propylene Glycol. Ind. Eng. Chem. Res. 2008, 47, 6878–6884. [Google Scholar] [CrossRef]
  7. Kim, N.D.; Park, J.R.; Park, D.S.; Kwak, B.K.; Yi, J. Promoter effect of Pd in CuCr2O4 catalysts on the hydrogenolysis of glycerol to 1,2-propanediol. Green Chem. 2012, 14, 2638–2646. [Google Scholar] [CrossRef]
  8. Shan, J.; Liu, H.; Lu, K.; Zhu, S.; Li, J.; Wang, J.; Fan, W. Identification of the dehydration active sites in glycerol hydrogenolysis to 1,2-propanediol over Cu/SiO2 catalysts. J. Catal. 2020, 383, 13–23. [Google Scholar] [CrossRef]
  9. Sharma, R.V.; Kumar, P.; Dalai, A.K. Selective hydrogenolysis of glycerol to propylene glycol by using Cu:Zn:Cr:Zr mixed metal oxides catalyst. Appl. Catal. A 2014, 477, 147–156. [Google Scholar] [CrossRef]
  10. Liu, Y. Catalytic Glycerol Hydrogenolysis to Produce 1,2-Propanediol with Molecular Hydrogen and In Situ Hydrogen Produced from Steam Reforming. Ph.D. Thesis, University of Waterloo, Waterloo, ON, Canada, 2014. [Google Scholar]
  11. Kumar, P.; Shah, A.K.; Lee, J.; Park, Y.H.; Štangar, U.L. Selective Hydrogenolysis of Glycerol over Bifunctional Copper–Magnesium-Supported Catalysts for Propanediol Synthesis. Ind. Eng. Chem. Res. 2020, 59, 6506–6516. [Google Scholar] [CrossRef]
  12. Cao, X.; Mirjalili, A.; Wheeler, J.; Xie, W.; Jang, B.W. Investigation of the preparation methodologies of Pd-Cu single atom alloy catalysts for selective hydrogenation of acetylene. Front. Chem. Sci. Eng. 2015, 9, 442–449. [Google Scholar] [CrossRef]
  13. Boucher, M.B.; Zugic, B.; Cladaras, G.; Kammert, J.; Marcinkowski, M.D.; Lawton, T.J.; Sykes, E.C.; Flytzani-Stephanopoulos, M. Single atom alloy surface analogs in Pd0.18Cu15 nanoparticles for selective hydrogenation reactions. Phys. Chem. Chem. Phys. 2013, 15, 12187–12196. [Google Scholar] [CrossRef]
  14. Hu, B.; Yin, Y.; Liu, G.; Chen, S.; Hong, X.; Tsang, S.C.E. Hydrogen spillover enabled active Cu sites for methanol synthesis from CO2 hydrogenation over Pd doped CuZn catalysts. J. Catal. 2018, 359, 17–26. [Google Scholar] [CrossRef]
  15. Ma, L.; Lv, C.; Wang, G. A DFT study and micro-kinetic analysis of acetylene selective hydrogenation on Pd-doped Cu(111) surfaces. Appl. Surf. Sci. 2017, 410, 154–165. [Google Scholar] [CrossRef]
  16. Abdel-Rahman, M.; Trenary, M. Propyne Hydrogenation over a Pd/Cu(111) Single-Atom Alloy Studied Using Ambient Pressure Infrared Spectroscopy. ACS Catal. 2020, 10, 9716–9724. [Google Scholar] [CrossRef]
  17. Liu, Y.; He, Y.; Zhou, D.; Feng, J.; Li, D. Catalytic performance of Pd-promoted Cu hydrotalcite-derived catalysts in partial hydrogenation of acetylene: Effect of Pd-Cu alloy formation. Catal. Sci. Technol. 2016, 6, 3027–3037. [Google Scholar] [CrossRef]
  18. Kyriakou, G.; Boucher, M.B.; Jewell, A.D.; Lewis, E.A.; Lawton, T.J.; Baber, A.E.; Tierney, H.L.; Flytzani-Stephanopoulos, M.; Sykes, E.C. Isolated Metal Atom Geometries as a Strategy for Selective Heterogeneous Hydrogenations. Science 2012, 335, 1209–1212. [Google Scholar] [CrossRef]
  19. Tierney, H.L.; Baber, A.E.; Kitchin, J.R.; Sykes, E.C. Hydrogen Dissociation and Spillover on Individual Isolated Palladium Atoms. Phys. Rev. Lett. 2009, 103, 246102. [Google Scholar] [CrossRef]
  20. Fu, Q.; Luo, Y. Active Sites of Pd-Doped Flat and Stepped Cu(111) Surfaces for H2 Dissociation in Heterogeneous Catalytic Hydrogenation. ACS Catal. 2013, 3, 1245–1252. [Google Scholar] [CrossRef]
  21. Xia, S.; Yuan, Z.; Wang, L.; Chen, P.; Hou, Z. Hydrogenolysis of glycerol on bimetallic Pd-Cu/solid-base catalysts prepared via layered double hydroxides precursors. Appl. Catal. A 2011, 403, 173–182. [Google Scholar] [CrossRef]
  22. Ardila, A.N.; Sánchez-Castillo, M.A.; Zepeda, T.A.; Villa, A.L.; Fuentes, G.A. Glycerol hydrodeoxygenation to 1,2-propanediol catalyzed by CuPd/TiO2-Na. Appl. Catal. B 2017, 219, 658–671. [Google Scholar] [CrossRef]
  23. Ardila A, A.N.; Arriola-Villaseñor, E.; Fuentes, G.A. Nature and Distribution of Cu and Pd Species in CuPd/TiO2–Na Bimetallic Catalysts for Glycerol Hydrodeoxygenation. ACS Omega 2020, 5, 19497–19505. [Google Scholar] [CrossRef] [PubMed]
  24. Torres, A.; Roy, D.; Subramaniam, B.; Chaudhari, R.V. Kinetic Modeling of Aqueous-Phase Glycerol Hydrogenolysis in a Batch Slurry Reactor. Ind. Eng. Chem. Res. 2010, 49, 10826–10835. [Google Scholar] [CrossRef]
  25. Vasiliadou, E.S.; Eggenhuisen, T.M.; Munnik, P.; de Jongh, P.E.; de Jong, K.P.; Lemonidou, A.A. Synthesis and performance of highly dispersed Cu/SiO2 catalysts for the hydrogenolysis of glycerol. Appl. Catal. B 2014, 145, 108–119. [Google Scholar] [CrossRef]
  26. Gabrysch, T.; Muhler, M.; Peng, B. The kinetics of glycerol hydrodeoxygenation to 1,2-propanediol over Cu/ZrO2 in the aqueous phase. Appl. Catal. A 2019, 576, 47–53. [Google Scholar] [CrossRef]
  27. Zhou, Z.; Li, X.; Zeng, T.; Hong, W.; Cheng, Z.; Yuan, W. Kinetics of Hydrogenolysis of Glycerol to Propylene Glycol over Cu-ZnO-Al2O3 Catalysts. Chin. J. Chem. Eng. 2010, 18, 384–390. [Google Scholar] [CrossRef]
  28. Rajkhowa, T.; Marin, G.B.; Thybaut, J.W. A comprehensive kinetic model for Cu catalyzed liquid phase glycerol hydrogenolysis. Appl. Catal. B 2017, 205, 469–480. [Google Scholar] [CrossRef]
  29. Liu, Y.; Wu, M.; Rempel, G.L.; Ng, F.T.T. Glycerol Hydrogenolysis to Produce 1,2-Propanediol in Absence of Molecular Hydrogen Using a Pd Promoted Cu/MgO/Al2O3 catalyst. Catalysts 2021, 11, 1299. [Google Scholar] [CrossRef]
  30. Yfanti, V.L.; Ipsakis, D.; Lemonidou, A.A. Kinetic study of liquid phase glycerol hydrodeoxygenation under inert conditions over a Cu-based catalyst. React. Chem. Eng. 2018, 3, 559–571. [Google Scholar] [CrossRef]
  31. Iwasa, N.; Mayanagi, T.; Nomura, W.; Arai, M.; Takezawa, N. Effect of Zn addition to supported Pd catalysts in the steam reforming of methanol. Appl. Catal. A 2003, 248, 153–160. [Google Scholar] [CrossRef]
  32. Cai, F.; Jin, F.; Hao, J.; Xiao, G. Selective hydrogenolysis of glycerol to 1,2-propanediol on Nb-modified Pd-Zr-Al catalysts. Catal. Commun. 2019, 131, 105801. [Google Scholar] [CrossRef]
  33. Li, Y.; Liu, H.; Ma, L.; He, D. Glycerol hydrogenolysis to propanediols over supported Pd-Re catalysts. RSC Adv. 2014, 4, 5503–5512. [Google Scholar] [CrossRef]
  34. Ma, T.; Yun, Z.; Xu, W.; Chen, L.; Li, L.; Ding, J.; Shao, R. Pd-H3PW12O40/Zr-MCM-41: An efficient catalyst for the sustainable dehydration of glycerol to acrolein. Chem. Eng. J. 2016, 294, 343–352. [Google Scholar] [CrossRef]
  35. Patankar, S.C.; Yadav, G.D. Cascade Engineered Synthesis of γ-Valerolactone, 1,4-Pentanediol, and 2-Methyltetrahydrofuran from Levulinic Acid Using Pd–Cu/ZrO2 Catalyst in Water as Solvent. ACS Sustain. Chem. Eng. 2015, 3, 2619–2630. [Google Scholar] [CrossRef]
  36. Yfanti, V.L.; Vasiliadou, E.S.; Lemonidou, A.A. Glycerol hydro-deoxygenation aided by in situ H2 generation via methanol aqueous phase reforming over a Cu-ZnO-Al2O3 catalyst. Catal. Sci. Technol. 2016, 6, 5415–5426. [Google Scholar] [CrossRef]
  37. Yfanti, V.L.; Lemonidou, A.A. Mechanistic study of liquid phase glycerol hydrodeoxygenation with in-situ generated hydrogen. J. Catal. 2018, 368, 98–111. [Google Scholar] [CrossRef]
  38. Pandhare, N.N.; Pudi, S.M.; Mondal, S.; Pareta, K.; Kumar, M.; Biswas, P. Development of Kinetic Model for Hydrogenolysis of Glycerol over Cu/MgO Catalyst in a Slurry Reactor. Ind. Eng. Chem. Res. 2018, 57, 101–110. [Google Scholar] [CrossRef]
  39. Mondal, S.; Malviya, H.; Biswas, P. Kinetic modelling for the hydrogenolysis of bio-glycerol in the presence of a highly selective Cu–Ni–Al2O3 catalyst in a slurry reactor. React. Chem. Eng. 2019, 4, 595–609. [Google Scholar] [CrossRef]
  40. Chiu, C.; Dasari, M.A.; Suppes, G.J.; Sutterlin, W.R. Dehydration of glycerol to acetol via catalytic reactive distillation. AIChE J. 2006, 52, 3543–3548. [Google Scholar] [CrossRef]
  41. Jiang, T.; Huai, Q.; Geng, T.; Ying, W.; Xiao, T.; Cao, F. Catalytic performance of Pd-Ni bimetallic catalyst for glycerol hydrogenolysis. Biomass Bioenergy 2015, 78, 71–79. [Google Scholar] [CrossRef]
  42. Sato, S.; Akiyama, M.; Takahashi, R.; Hara, T.; Inui, K.; Yokota, M. Vapor-phase reaction of polyols over copper catalysts. Appl. Catal. A 2008, 347, 186–191. [Google Scholar] [CrossRef]
  43. Hou, M.; Jiang, H.; Liu, Y.; Chen, R. Role of initial water content in glycerol hydrogenolysis to 1,2-propanediol over Cu-ZnO catalyst. React. Kinet. Mech. Catal. 2017, 122, 1129–1143. [Google Scholar] [CrossRef]
Figure 1. TPR profiles for (a) 10Pd/ZnO, (b) CZA and (c) 2Pd/CZA.
Biomass 02 00003 g001
Figure 2. NH3 TPD profiles for (a) CZA and (b) 2Pd/CZA.
Biomass 02 00003 g002
Figure 3. Schematic illustration of the pathways for acetol hydrogenation and plausible side reactions.
Biomass 02 00003 g003
Figure 4. The experimental (marker points) and the modeled (lines) values of the concentrations of each component over the reaction time at three different hydrogen pressures for acetol hydrogenation. Other reaction conditions: 200 °C, 500 RPM, 20 wt% aqueous acetol, 5 wt% catalyst with respect to the weight of acetol. (a) Concentrations of 1,2-PD at the hydrogen pressure of 2.76 MPa. (b) Concentrations of acetol at the hydrogen pressure of 2.76 MPa. (c) Concentrations of 1,2-PD at the hydrogen pressure of 4.14 MPa. (d) Concentrations of acetol at the hydrogen pressure of 4.14 MPa. (e) Concentrations of 1,2-PD at the hydrogen pressure of 5.52 MPa. (f) Concentrations of acetol at the hydrogen pressure of 5.52 MPa.
Biomass 02 00003 g004
Figure 5. Simulated reaction rates of acetol hydrogenation (mol·L−1·s−1) as the function of acetol concentration (mol/L). Catalysts: 2Pd/Cu/Zn/Al (dotted lines); Cu/Zn/Al (solid lines). Hydrogen pressure: (a) and (d) 2.76 Mpa, (b) and (e) 4.14 Mpa, (c) and (f) 5.52 Mpa. Other reaction conditions: 200 °C, 500 RPM, 20 wt% aqueous acetol, 5 wt% catalyst with respect to the weight of acetol.
Biomass 02 00003 g005
Figure 6. Graphical evaluation of β and k1 for acetol hydrogenation.
Biomass 02 00003 g006
Figure 7. Schematic illustration of the pathways for glycerol hydrogenolysis.
Biomass 02 00003 g007
Figure 8. The experimental (marker points) and the modeled (lines) values of the concentrations of each component over the reaction time at three different hydrogen pressures in glycerol hydrogenolysis reactions. Other reaction conditions: 200 °C, 500 RPM, 80 wt% aqueous glycerol, 5 wt% catalyst with respect to the weight of glycerol. (a) Concentrations of glycerol at the hydrogen pressure of 2.76 MPa. (b) Concentrations of glycerol at the hydrogen pressure of 2.07 MPa. (c) Concentrations of glycerol at the hydrogen pressure of 1.38 MPa. (d) Concentrations of 1,2-PD at the hydrogen pressure of 2.76 MPa. (e) Concentrations of 1,2-PD at the hydrogen pressure of 2.07 MPa. (f) Concentrations of 1,2-PD at the hydrogen pressure of 1.38 MPa. (g) Concentrations of acetol at the hydrogen pressure of 2.76 MPa. (h) Concentrations of acetol at the hydrogen pressure of 2.07 MPa. (i) Concentrations of acetol at the hydrogen pressure of 1.38 MPa.
Biomass 02 00003 g008aBiomass 02 00003 g008b
Figure 9. Effect of Pd on the rate of glycerol dehydration using the evaluated kinetic parameters.
Biomass 02 00003 g009
Figure 10. Effect of Pd on the reaction rates of glycerol dehydration (r1), acetol hydration (r−1), acetol hydrogenation (r2) and glycerol conversion (rGL) over the reaction time at different hydrogen pressures. Other reaction conditions: 200 °C, 500 RPM, 80 wt% aqueous glycerol, 5 wt% catalyst with respect to the weight of glycerol. (a) Rates of the reactions using the 2Pd/CZA catalyst at the hydrogen pressure of 2.76 MPa. (b) Rates of the reactions using the 2Pd/CZA catalyst at the hydrogen pressure of 2.07 MPa. (c) Rates of the reactions using the 2Pd/CZA catalyst at the hydrogen pressure of 1.38 MPa. (d) Rates of the reactions using the CZA catalyst at the hydrogen pressure of 2.76 MPa. (e) Rates of the reactions using the CZA catalyst at the hydrogen pressure of 2.07 MPa. (f) Rates of the reactions using the CZA catalyst at the hydrogen pressure of 1.38 MPa.
Biomass 02 00003 g010aBiomass 02 00003 g010b
Figure 11. Comparison of the catalytic activity of the reduced and unreduced catalyst: (a) 2Pd/CZA; (b) CZA. Reaction conditions: 200 °C, 80 wt% aqueous glycerol, 5 wt% catalyst with respect to glycerol, 500 RPM, 24 h.
Biomass 02 00003 g011
Table 1. Physicochemical properties of the CZA catalyst and its supported Pd catalyst.
CatalystsNumber of Acidic Sites
(mmolNH3/g-cat)
Total Acidic Sites
(mmolNH3/g-cat)
BET Surface Area 1
(m2/g-cat)
CuO Particle Size 2
(nm)
CZA0.225 (50 °C~290 °C)0.32086.67.4
0.020 (290 °C~500 °C)
0.075 (590 °C~800 °C)
2Pd/CZA0.141 (50 °C~290 °C)0.22284.67.6
0.026 (290 °C~590 °C)
0.065 (590 °C~800 °C)
1 Data from reference [4]. 2 Calculated via Scherrer equation based on the X-ray diffraction profiles from reference [4].
Table 2. Equations of reaction rates and material balances in an acetol hydrogenation process.
Equations of Reaction Rates
r 1 = k 1 A α P H 2 β = k 1 A α (1)
ln k 1 = ln k 1 + β ln P H 2 (2)
r 2 = k 2 A τ (3)
Equations of Material Balances
d A d t = r 1 r 2 (4)
d 1 , 2 P D d t = r 1 (5)
d O t h e r s d t = r 2 (6)
[i]: molar concentration of each compound (mol·L−1)
ri: rate of the reaction (mol·L−1·s−1)
Table 3. Promoting effect of Pd on the Cu/Zn/Al catalyst for acetol hydrogenation 1.
CatalystsHydrogen PressureAcetol ConversionSelectivity, %Kinetic Parameters
MPa%1,2-PDOthersk1α
CZA2.7681.052.947.16.818 × 10−50.83
4.1494.369.230.81.616 × 10−4
5.52100.077.922.12.704 × 10−4
2Pd/CZA2.7699.482.018.03.287 × 10−41.00
4.14100.087.812.28.516 × 10−4
5.52100.092.08.01.357 × 10−3
1 Conditions: 200 °C, 500 RPM, 20 wt% aqueous acetol, 5 wt% catalyst with respect to the weight of acetol, reaction time: 4 h.
Table 4. Equations of reaction rates and material balances in a glycerol hydrogenolysis process.
Equations of Reaction Rates
r 1 = k 1 G L γ (9)
r 2 = k 2 A α P H 2 β (10)
r 3 = k 3 A τ (11)
r 1 = k 1 A ε W a t e r δ (12)
r 4 = k 4 G L μ P H 2 ω (13)
Equations of Material Balances
d G L d t = r 1 + r 1 r 4 (14)
d A d t = r 1 r 1 r 2 r 3 (15)
d 1 , 2 P D d t = r 2 (16)
d O t h e r s d t = r 3 (17)
d E G d t = r 4 (18)
[i]: molar concentration of each compound(mol·L−1)
ri: rate of the reaction (mol·L−1·s−1)
Table 5. Promoting effect of Pd on the CZA catalyst for glycerol hydrogenolysis at different hydrogen pressures 1.
CatalystsHydrogen
Pressure
MPa
Glycerol
Conversion
%
Selectivity, %
1,2-PDAcetolEGPropanolOthers
CZA2.7693.094.80.44.50.30.0
2.0769.489.71.83.01.14.5
1.3851.358.13.91.91.534.7
2Pd/CZA2.7698.994.00.35.10.50.0
2.0797.293.30.64.00.02.1
1.3895.378.01.52.50.917.1
1 Conditions: 200 °C, 500 RPM, 80 wt% aqueous glycerol, 5 wt% catalyst with respect to the weight of glycerol, reaction time: 24 h.
Table 6. Estimated values of kinetic parameters for glycerol hydrogenolysis process.
Catalystsγαβεδμωk1k−1k2k4
CZA0.800.832.001.683.522.872.175.661 × 10−53.273 × 10−76.464 × 10−97.781 × 10⁻¹⁴
2Pd/CZA0.851.002.070.622.341.920.704.815 × 10−51.918 × 10−75.232 × 10−85.085 × 10⁻⁹
Table 7. The effect of Pd on the catalytic activity of the unreduced CZA catalyst 1.
CatalystsGlycerol
Conversion
%
Selectivity, %
1,2-PDAcetolEGPropanolOthers
CZA reduced93.094.80.44.50.30.0
CZA unreduced12.693.42.30.04.30.0
2Pd/CZA reduced98.994.00.35.10.50.0
2Pd/CZA unreduced96.493.50.44.50.90.6
1 Conditions: 200 °C, 500 RPM, 80 wt% aqueous glycerol, 5 wt% catalyst with respect to the weight of glycerol, 2.76 MPa H2 pressure, reaction time: 24 h.
Publisher’s Note: MDPI stays neutral with regard to jurisdictional claims in published maps and institutional affiliations.

