Article

Evaluation of Attack and Recovery in USFC: A Dependability View

School of Cyber Science and Engineering, University of International Relations, Beijing 100091, China
*
Author to whom correspondence should be addressed.
Network 2026, 6(2), 24; https://doi.org/10.3390/network6020024
Submission received: 16 February 2026 / Revised: 1 April 2026 / Accepted: 7 April 2026 / Published: 14 April 2026
(This article belongs to the Special Issue Advancements in Space-Air-Ground Integrated Networks)

Abstract

The integration of service function chains (SFCs) and unmanned aerial vehicles (UAVs) lays a crucial technological foundation for achieving efficient, reliable, and adaptive future airborne service networks. Service functions (SFs) in the SFC will be deployed on UAVs; this type of SFC is called unmanned aerial vehicle-based service function chains (USFCs). However, due to the combined effects of open hardware and software architectures, exposed communication links, and complex mission environments, UAVs have become ideal targets for attackers. Once a vulnerability is successfully injected into a UAV, data from the SFs running on it will be stolen, seriously threatening the dependability of the USFC. Therefore, it is necessary to conduct a quantitative evaluation of the USFC dependability to provide insights for further improving its dependability. This paper develops a USFC dependability evaluation model based on a semi-Markov process (SMP) to capture the dynamic interaction between attacker behavior and USFC system recovery behavior. The dependability of the USFC is comprehensively evaluated from two perspectives: availability and security. Extensive numerical analysis experiments are conducted, and the results not only demonstrate the changing trends of various dependability metrics under different parameters but also show parameter combinations for synergistic optimization among metrics.

1. Introduction

The integration of service function chains (SFCs) and unmanned aerial vehicles (UAVs) provides flexible service deployment and management capabilities for dynamic, resource-constrained aerial network environments [1,2,3]. By virtualizing network functions and orchestrating them into dynamically deployable SFCs, UAVs can serve as mobile edge computing (MEC) nodes, enabling on-demand allocation and intelligent scheduling of network service in space–air–ground-integrated networks [4,5,6]. This convergence not only supports low-latency and high-dependability service recovery and migration mechanisms, but also significantly enhances task completion rates, energy efficiency, and Quality of Experience (QoE) through trajectory optimization, resource collaboration, and intelligent decision-making [7,8,9,10]. It is particularly applicable to scenarios with stringent real-time and dependability requirements, such as emergency communications, disaster response, and smart cities. Therefore, the synergy between SFCs and UAVs lays a crucial technological foundation for realizing efficient, reliable, and self-adaptive future aerial service networks.
When receiving a USFC request, the service functions in the SFC will be deployed to UAV under the condition that constraints are satisfied. In this paper, we refer to this type of SFC as an unmanned aerial vehicle-based service function chain (USFC). Different deployment strategies may deploy different SFs from the same USFC to different UAVs. However, due to the combined effects of open hardware and software architecture, exposed communication links, and complex mission environments, UAVs have become ideal targets for attackers. Once a vulnerability is successfully injected into UAV, the data of the SFs running on it will be stolen, severely threatening the dependability of the USFC. Therefore, it is necessary to conduct a quantitative evaluation of USFC to provide a theoretical basis for further improving USFC dependability. Existing studies mainly focus on SFC deployment strategies in UAV and the dependability of UAV networks, but the following questions remain in evaluating USFC dependability:
  • How can the dynamic interaction between attack and recovery behaviors be characterized to improve the accuracy of USFC dependability assessment?
  • How can the trigger time of recovery behaviors corresponding to different attack phases be determined to further improve USFC dependability?
  • How can the correlation between system parameters and USFC dependability assessment metrics be established to identify key factors affecting USFC dependability improvement?
To address the aforementioned questions, this paper develops a semi-Markov process (SMP)-based USFC dependability assessment model to capture attacker behaviors and USFC system recovery behaviors, thereby analyzing USFC dependability from the perspectives of availability and security. The specific contributions of this paper are as follows:
  • This paper constructs a dependability analysis model for USFC, which captures the system behavior from the perspectives of attacker attacks and system defenses. Specifically, it finely characterizes different stages of an attack and the recovery behaviors triggered at each stage. This model can analyze the dependability of USFC composed of any number of SFs, effectively overcoming the problem of model insolvability caused by increasing system size.
  • This paper derives calculation formulas for availability and security metrics, which can characterize the complex relationships between the trigger times of different recovery behaviors and various metrics. These formulas help to comprehensively analyze the dependability of USFC, providing a theoretical basis for subsequently identifying the parameter settings corresponding to optimal dependability.
  • This paper performs extensive numerical analysis experiments to verify the effectiveness of the proposed model and formulas. The experimental results not only demonstrate the changing trends of various dependability metrics under different parameters but also show the parameter combinations corresponding to the synergistic optimization among metrics.
The remainder of this paper is organized as follows: Section 2 analyzes the existing related work. Section 3 describes the model constructed in this paper and the derived formulas. Section 4 introduces the experimental results. Section 5 summarizes the entire paper and discusses future work.

2. Related Work

This section analyzes the existing studies focused on SFC deployment strategies in UAV and the dependability of UAV networks. He et al. [11] utilized an improved online deep reinforcement learning (DRL) technique to investigate the online joint optimization of SF deployment and trajectory planning in multi-UAV-enabled MEC. The algorithm supports both single-agent and multi-agent scenarios, effectively maximizing the number of accepted requests while minimizing costs. Wu et al. [12] studied the adaptive QoE-aware SFC orchestration problem in UAV networks by leveraging DRL and the fuzzy analytic hierarchy process. The research incorporated the Markov decision process to capture dynamic network state transitions, and the proposed algorithm optimized user QoE, energy consumption, and task completion rate while enhancing training stability. Wang et al. [13] utilized particle swarm optimization technology to investigate the embedding and migration problems of SFCs in UAV networks, and constructed a revenue model integrating service quality, resource utilization, and migration cost. Simulations showed that the algorithm outperforms baseline strategies in terms of resource efficiency and long-term revenue, providing a new method for flexible network management of UAV networks. Liang et al. [14] utilized hierarchical hybrid DRL technology to jointly optimize SF deployment and UAV trajectory planning in multi-UAV-enabled MEC. Simulations verified the effectiveness of the algorithm in reducing energy consumption and requesting acceptance costs, providing a solution for efficient service provision in multi-UAV-enabled MEC. Yang et al. [15] proposed an efficient and low-delay SFC recovery method for the space–air–ground-integrated aviation information network by leveraging SF migration and virtual link redirection technologies. Experiments verified that it performs excellently under different resource redundancy levels and attack types and has more advantages in SFC recovery rate and delay compared with existing methods. Note that our work can analyze the USFC availability and security, which complements these studies to help service providers deliver better USFCs.
Kharchenko et al. [16] utilized the queuing theory and Markov chain techniques to model and evaluate the dependable service of UAV fleets in smart cities. The study formulated modeling principles and developed assessment models, which were verified through delivery cases to achieve a high probability of successful service delivery, providing theoretical support and practical guidance for the reliable deployment and parameter optimization of UAV fleets in smart cities. Kliushnikov et al. [17] utilized the multi-state system theory and probability analysis methods to establish reliability models for multi-state UAV-based monitoring systems considering mission efficiency degradation. The model expands the range of effective operating states and takes mission success probability (SPF) and efficiency as core indicators, providing an evaluation basis for critical infrastructure monitoring. Silva et al. [18] utilized continuous-time Markov chain techniques to quantify the dependability of enhancing mobile cloud computing with unmanned aerial vehicles (UAVs) as data bridges. The proposed base model and extended models identified key factors through sensitivity analysis, significantly reducing downtime and improving availability, thus providing an effective quantification method for enhancing the availability and reliability of aerial computing systems. Wang et al. [19] utilized constraint-based model repair technology and the Markov decision process to address the assurance of multiple mission objectives in UMEC systems. This method encodes mission objectives as constraints and generates compliant strategies, providing reliability guarantees for high-risk scenarios such as disaster response. Xu et al. [20] utilized multi-state Markov processes, matrix analysis, and Monte Carlo methods to propose a reliability model for master–supporter UAV networks considering failure dependencies and designed an adaptive redundancy allocation scheme. Experiments verified that the master–supporter architecture is superior in most scenarios, providing a reliability-guaranteed solution for UAV swarm applications. Note that our study can evaluate the USFC dependability, which complements these studies to provide a more comprehensive dependability analysis for UAV networks.
Analytical models have been used to evaluate system dependability. Mauro et al. [21] conducted an availability model for SFC. Zhao et al. [22] analyzed the impact of software aging on SFC dependability. Kharchenko et al. [23] evaluated the availability and cybersecurity of systems by combining Markov models and semi-Markov models. Li et al. [24] focused on assessing the effectiveness of software rejuvenation techniques from availability and reliability perspectives. Parmender et al. [25] focused on the repairable system with a cold standby unit and proposed an SMP-based reliability evaluation model. The authors in [26] assessed the reliability of systems with performance sharing mechanisms under the condition that the time interval between events follow a non-exponential distribution. These studies ignored the resource consumption, failure, and recovery behaviors of the system and did not conduct a comprehensive dependability analysis in terms of availability and security. These studies require further improvement in system behavior capture and indicator design. Specifically, they neglected the dynamic interaction between attack and defense behaviors and offered a relatively singular perspective on dependability analysis. Our work effectively addresses these shortcomings, evaluating USFC dependability from multiple dimensions including security and availability. Table 1 summarizes the comparison of the existing works.

3. System Description and Modeling

This section first describes the process of a USFC system being attacked and the corresponding recovery behavior, then constructs the dependability assessment model based on system behavior and finally performs the dependability analysis.

3.1. System Description

In the USFC system considered in this paper, SFs from USFCs are deployed on UAVs in the MEC. During the operation of USFC, whether the UAV or the SF is attacked, the dependability of the USFC will be affected. This paper simplifies the multi-stage attack (cyber kill chain) [27] into the following three stages:
(1)
The attacker uses the vulnerability of the target node to gain access to the node.
(2)
The attacker successfully implants malware into the target node.
(3)
The attacker steals data through the malware on the target node.
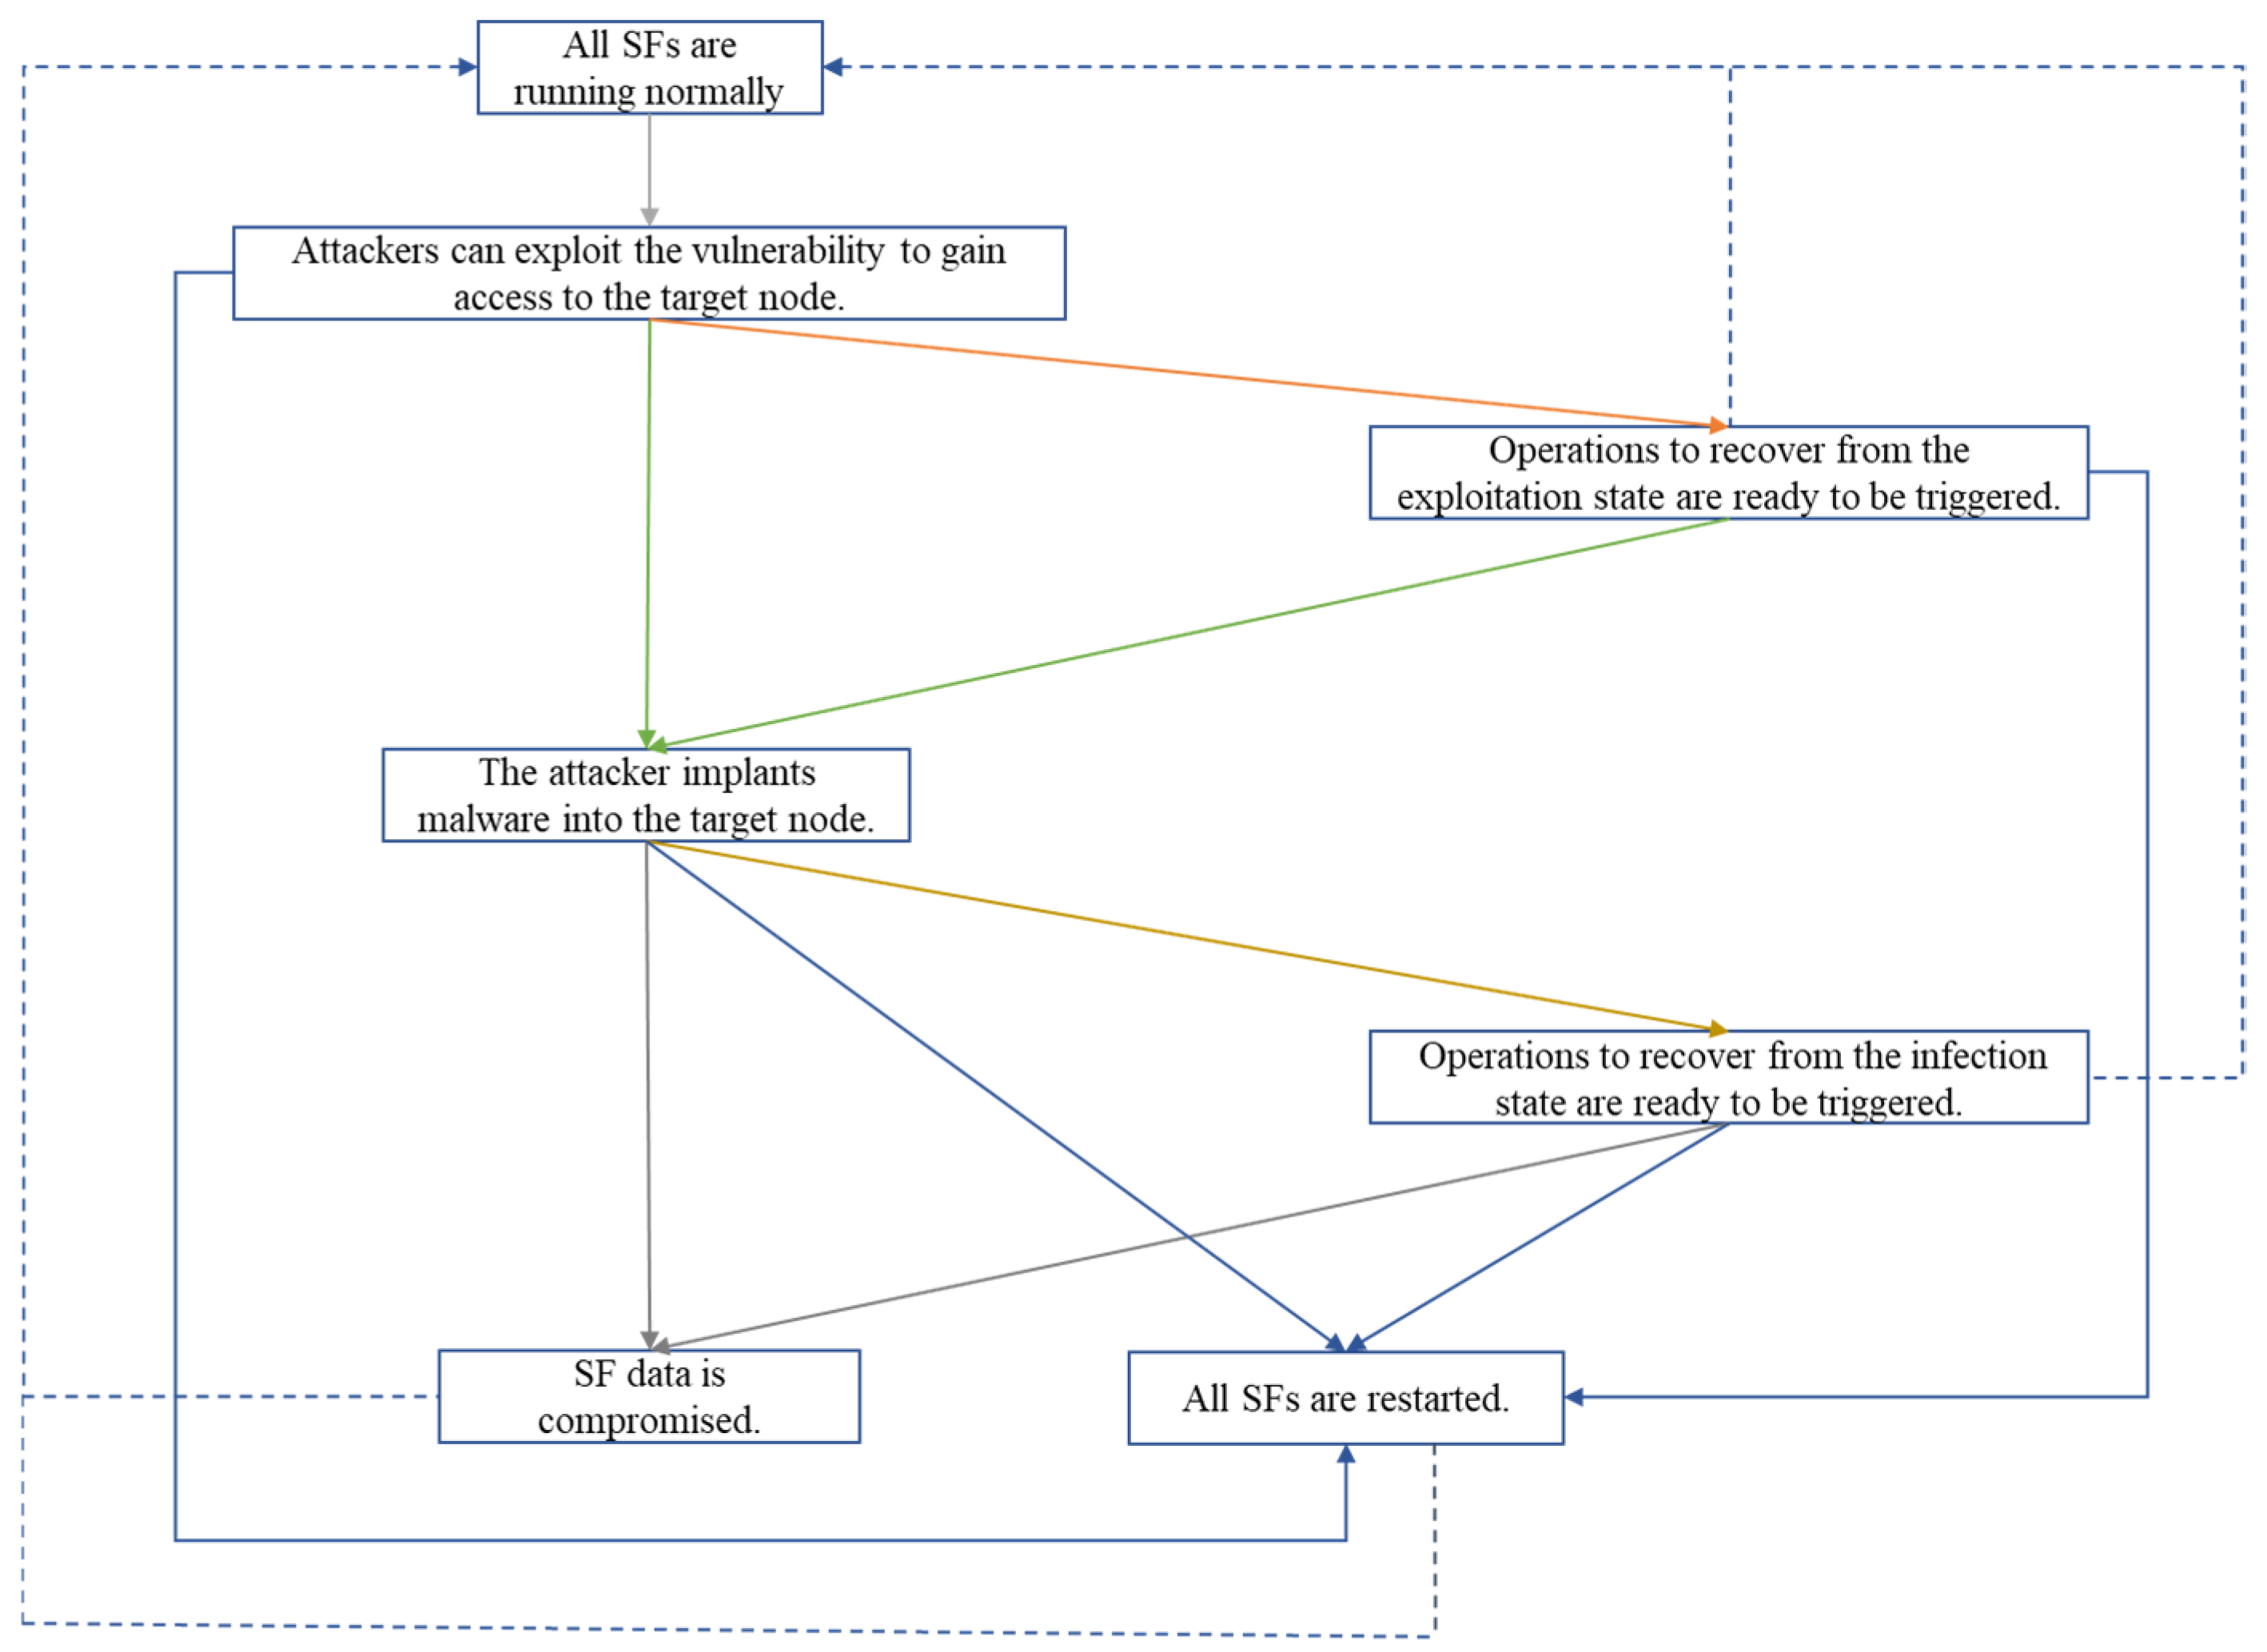
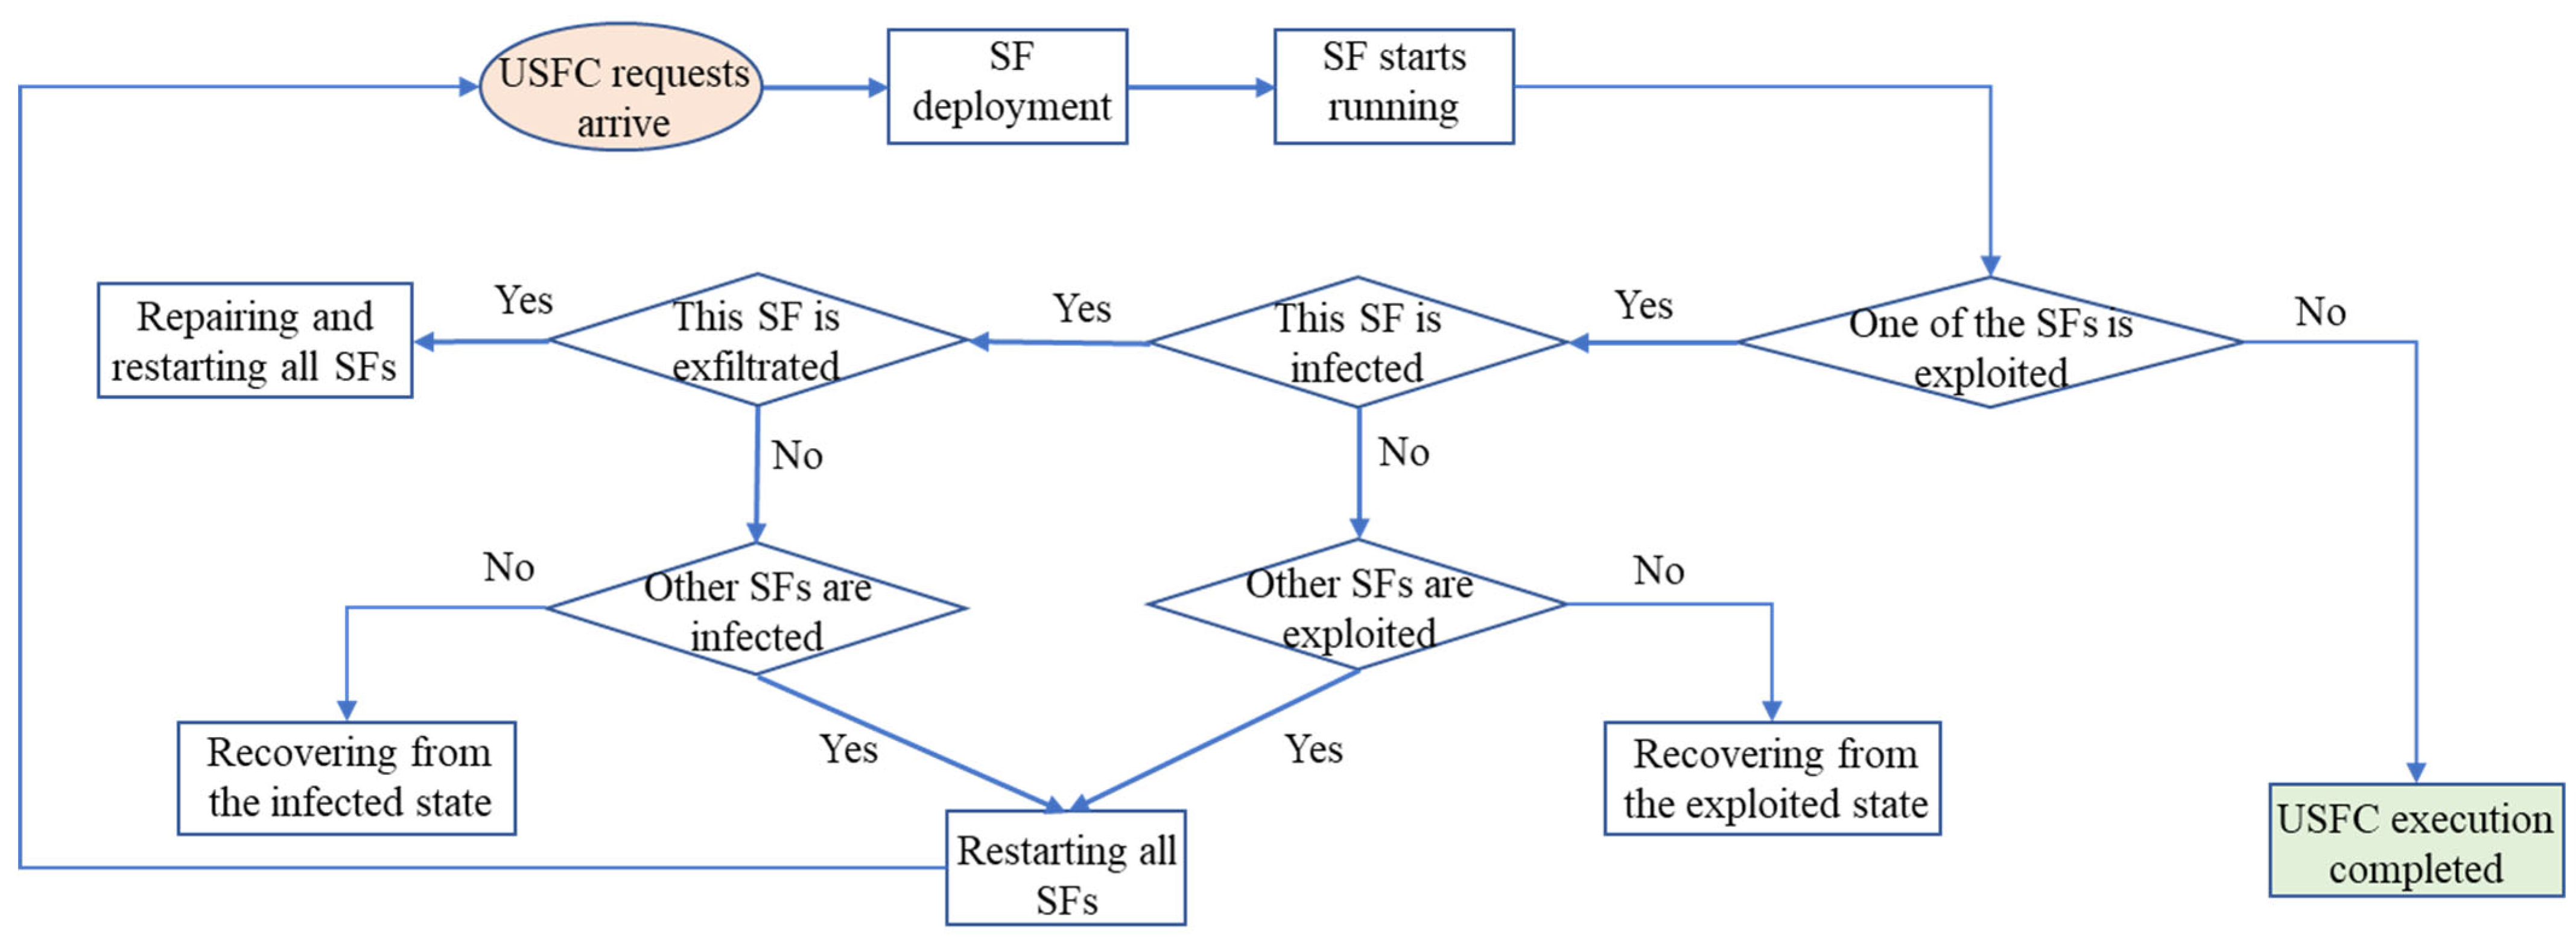
The cyber kill chain has seven stages (reconnaissance, weaponization, delivery, exploitation, installation, command and control, actions on objectives), but we abstract it into three stages to amplify the interaction details between the attacker’s attack behavior and the system’s defense behavior. However, this does not mean that other stages are ignored. Rather, we incorporate other stages into these three stages. Specifically, stage 1 includes reconnaissance, weaponization, and delivery. Stage 2 includes exploitation, installation, and command and control. Stage 3 represents actions on objectives. Next, this paper describes the impact of multi-stage attacks on USFC dependability by depicting the SF behavior shown in Figure 1. Initially, after the USFC request arrives, all SFs are deployed to the UAVs in the USFC system. During SF operation, the following situations may occur:
(1)
If one SF in the USFC is exploited, the recovery operation will be triggered after a period of time.
(i)
During the recovery from the exploited state, this SF may be infected. If this SF is detected to be infected, the recovery operation will be triggered after a period of time.
(a)
During the recovery from the infected state, the data in this SF may be exfiltrated. If the data is exfiltrated, the repairing and restarting operation will be triggered immediately.
(b)
During the recovery from the infected state, if other SFs are exploited by the attacker, all SFs will be restarted immediately.
(ii)
During the recovery from the exploited state, if other SFs are also exploited by the attacker, all SFs will be restarted immediately.
(2)
If the SFs in the USFC are not exploited by the attacker, the USFC execution is complete.

3.2. Dependability Assessment Model

Based on the analysis of SF behavior, we use an n-tuple index ( q 1 , q 2 , q 3 , , q n ) to represent the state of the USFC system composed of n SFs. Here, q n denotes the state of the ith SF. The behavior of each SF is abstracted into the following seven states:
  • Perfect (State P): In this state, SF can run normally and efficiently.
  • Exploitation (State E): In this state, attackers can exploit the vulnerability to gain access to the target node, facilitating subsequent attacks. The SF running on this node is exposed to the risk of being attacked.
  • Infection (State I): In this state, attackers implant malware into the target node. Data on the SF running on this node is at risk of being stolen at any time.
  • Exfiltration (State F): In this state, attackers use implanted malware to steal SF data; that is, SF data is compromised.
  • Recovery (State R): In this state, SF is restarted.
  • Recovery from the exploitation state (State RE): In this state, operations to recover from the exploitation state are ready to be triggered.
  • Recovery from the Infection state (State RI): In this state, operations to recover from the infection state are ready to be triggered.
Therefore, there are a total of 7 n system states, of which (4n + 3) are meaningful. The system state space is S = { S 0 , S 1 , S 2 , S 3 , , S 4 n + 2 } . Table 2 lists the meaningful system states and their corresponding security risk and availability. The cumulative distribution functions (CDFs) of the transition times between system states are listed in Table 3.
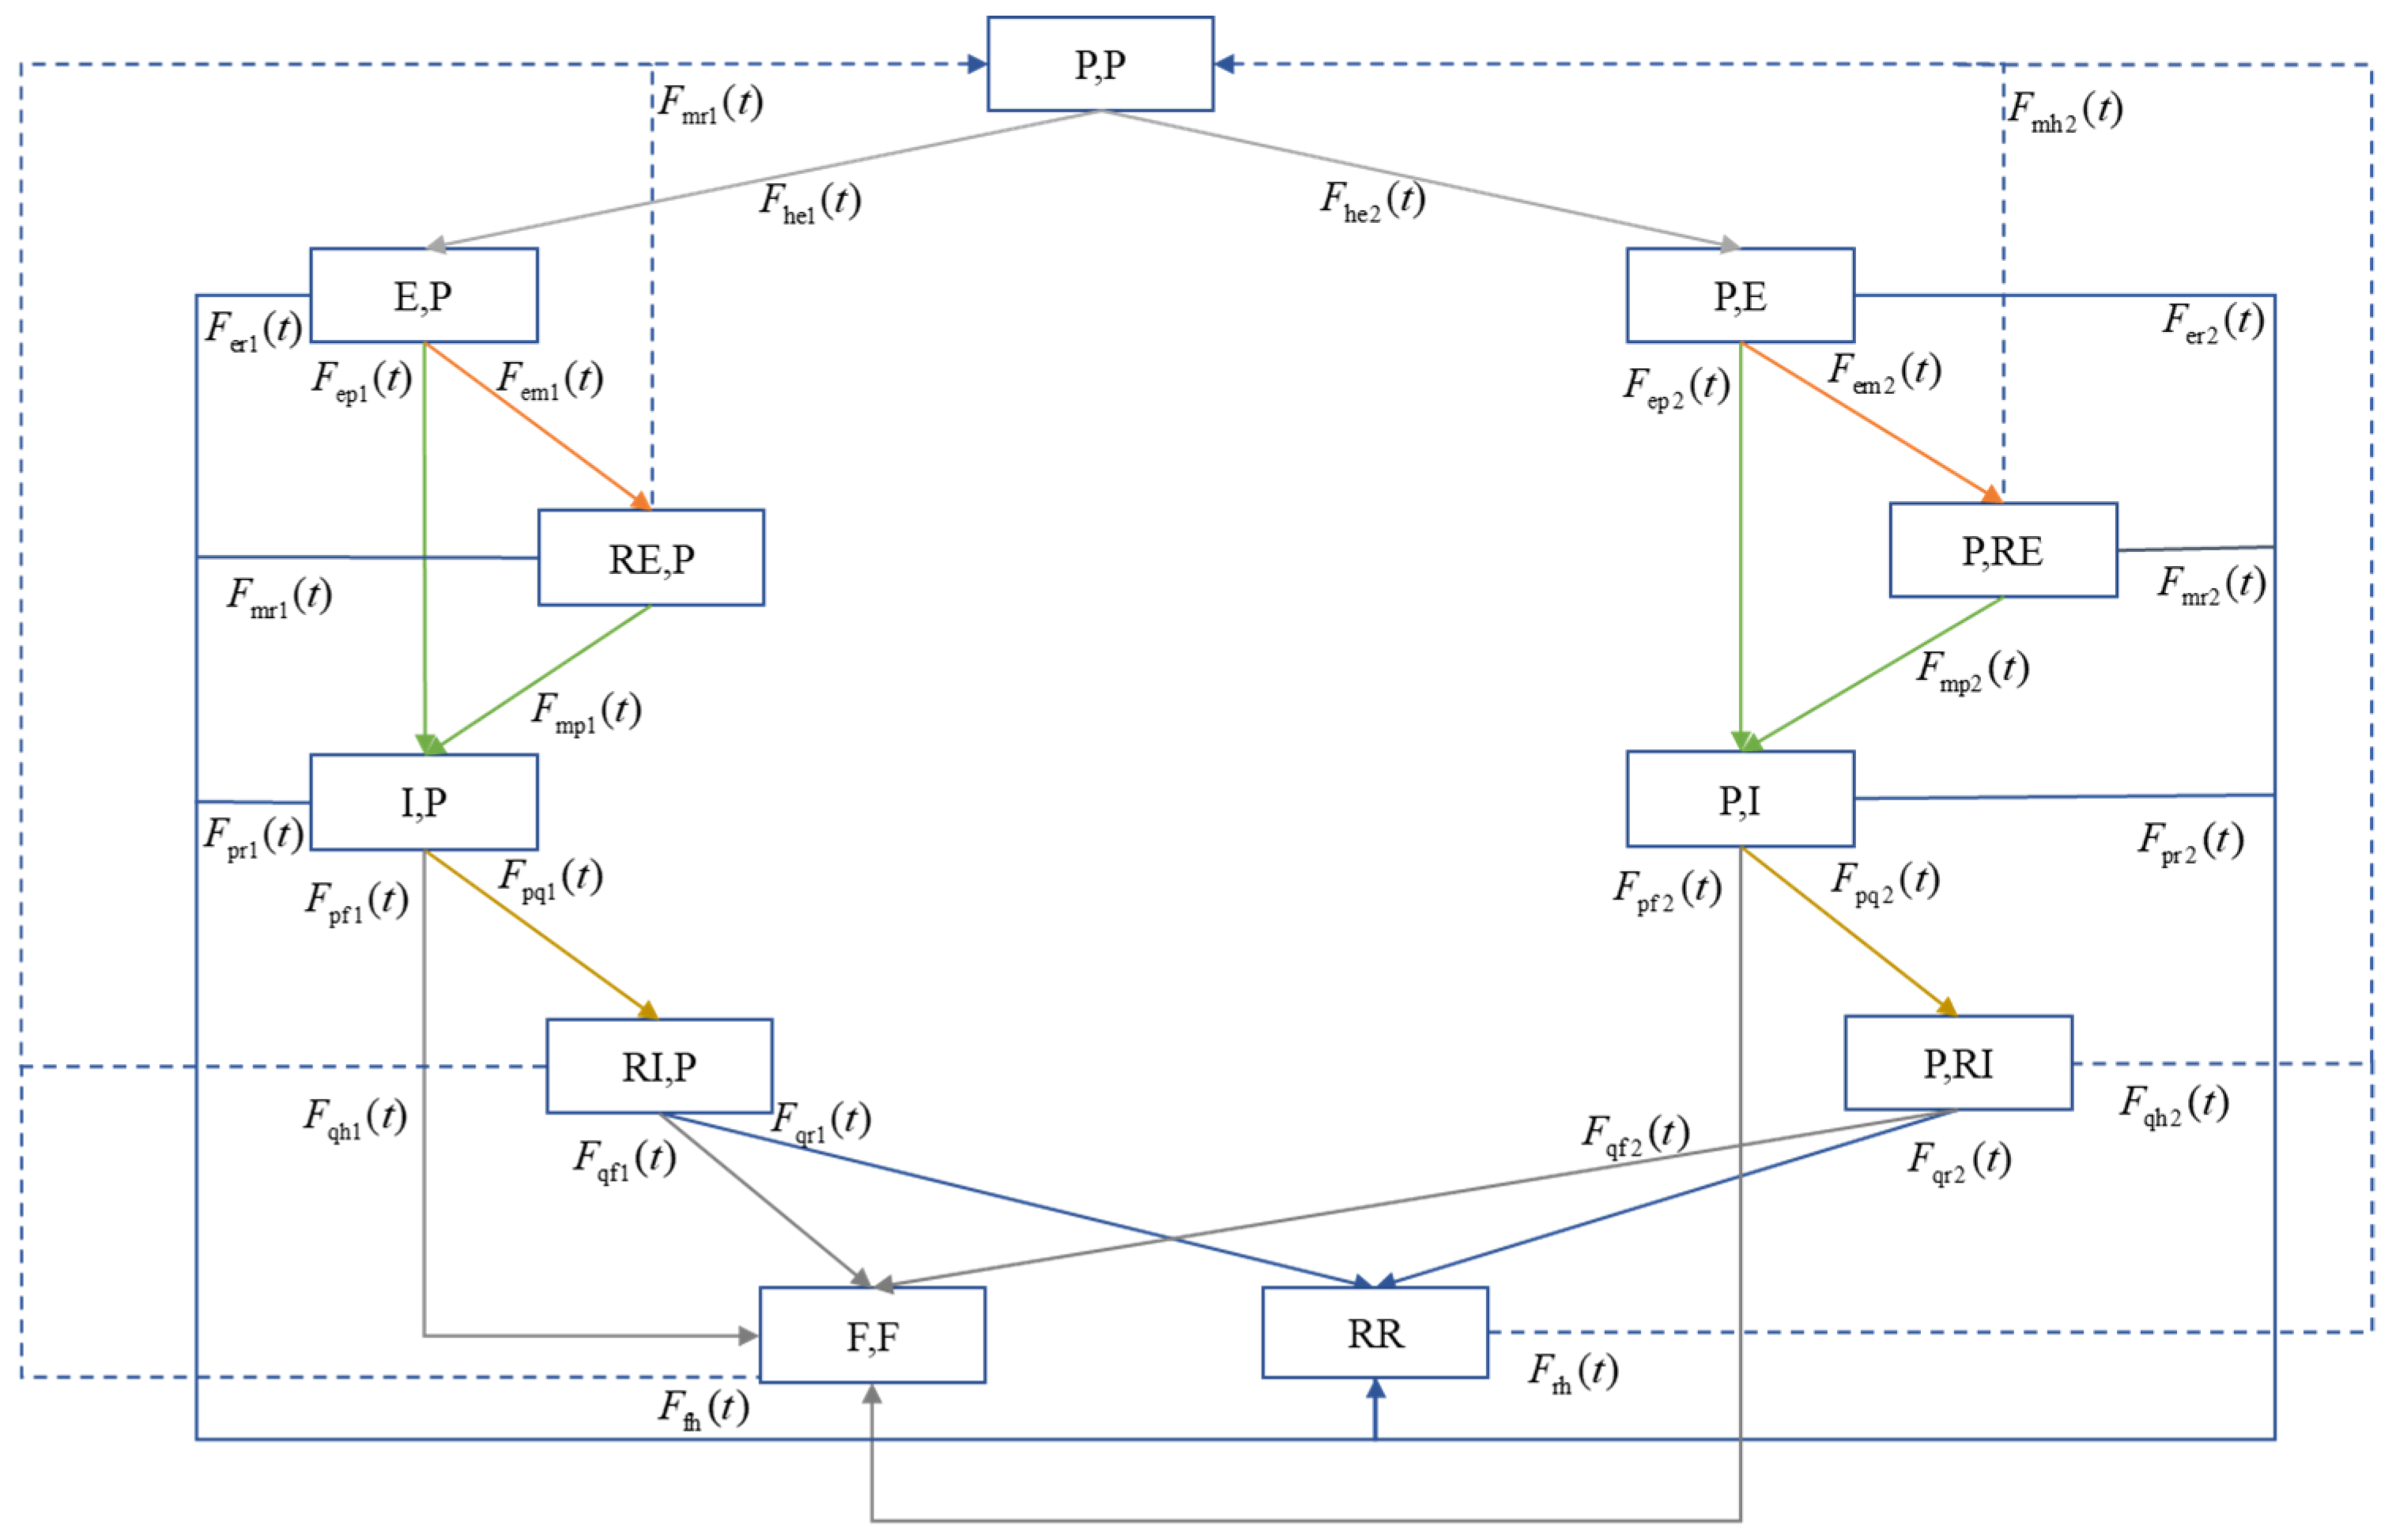
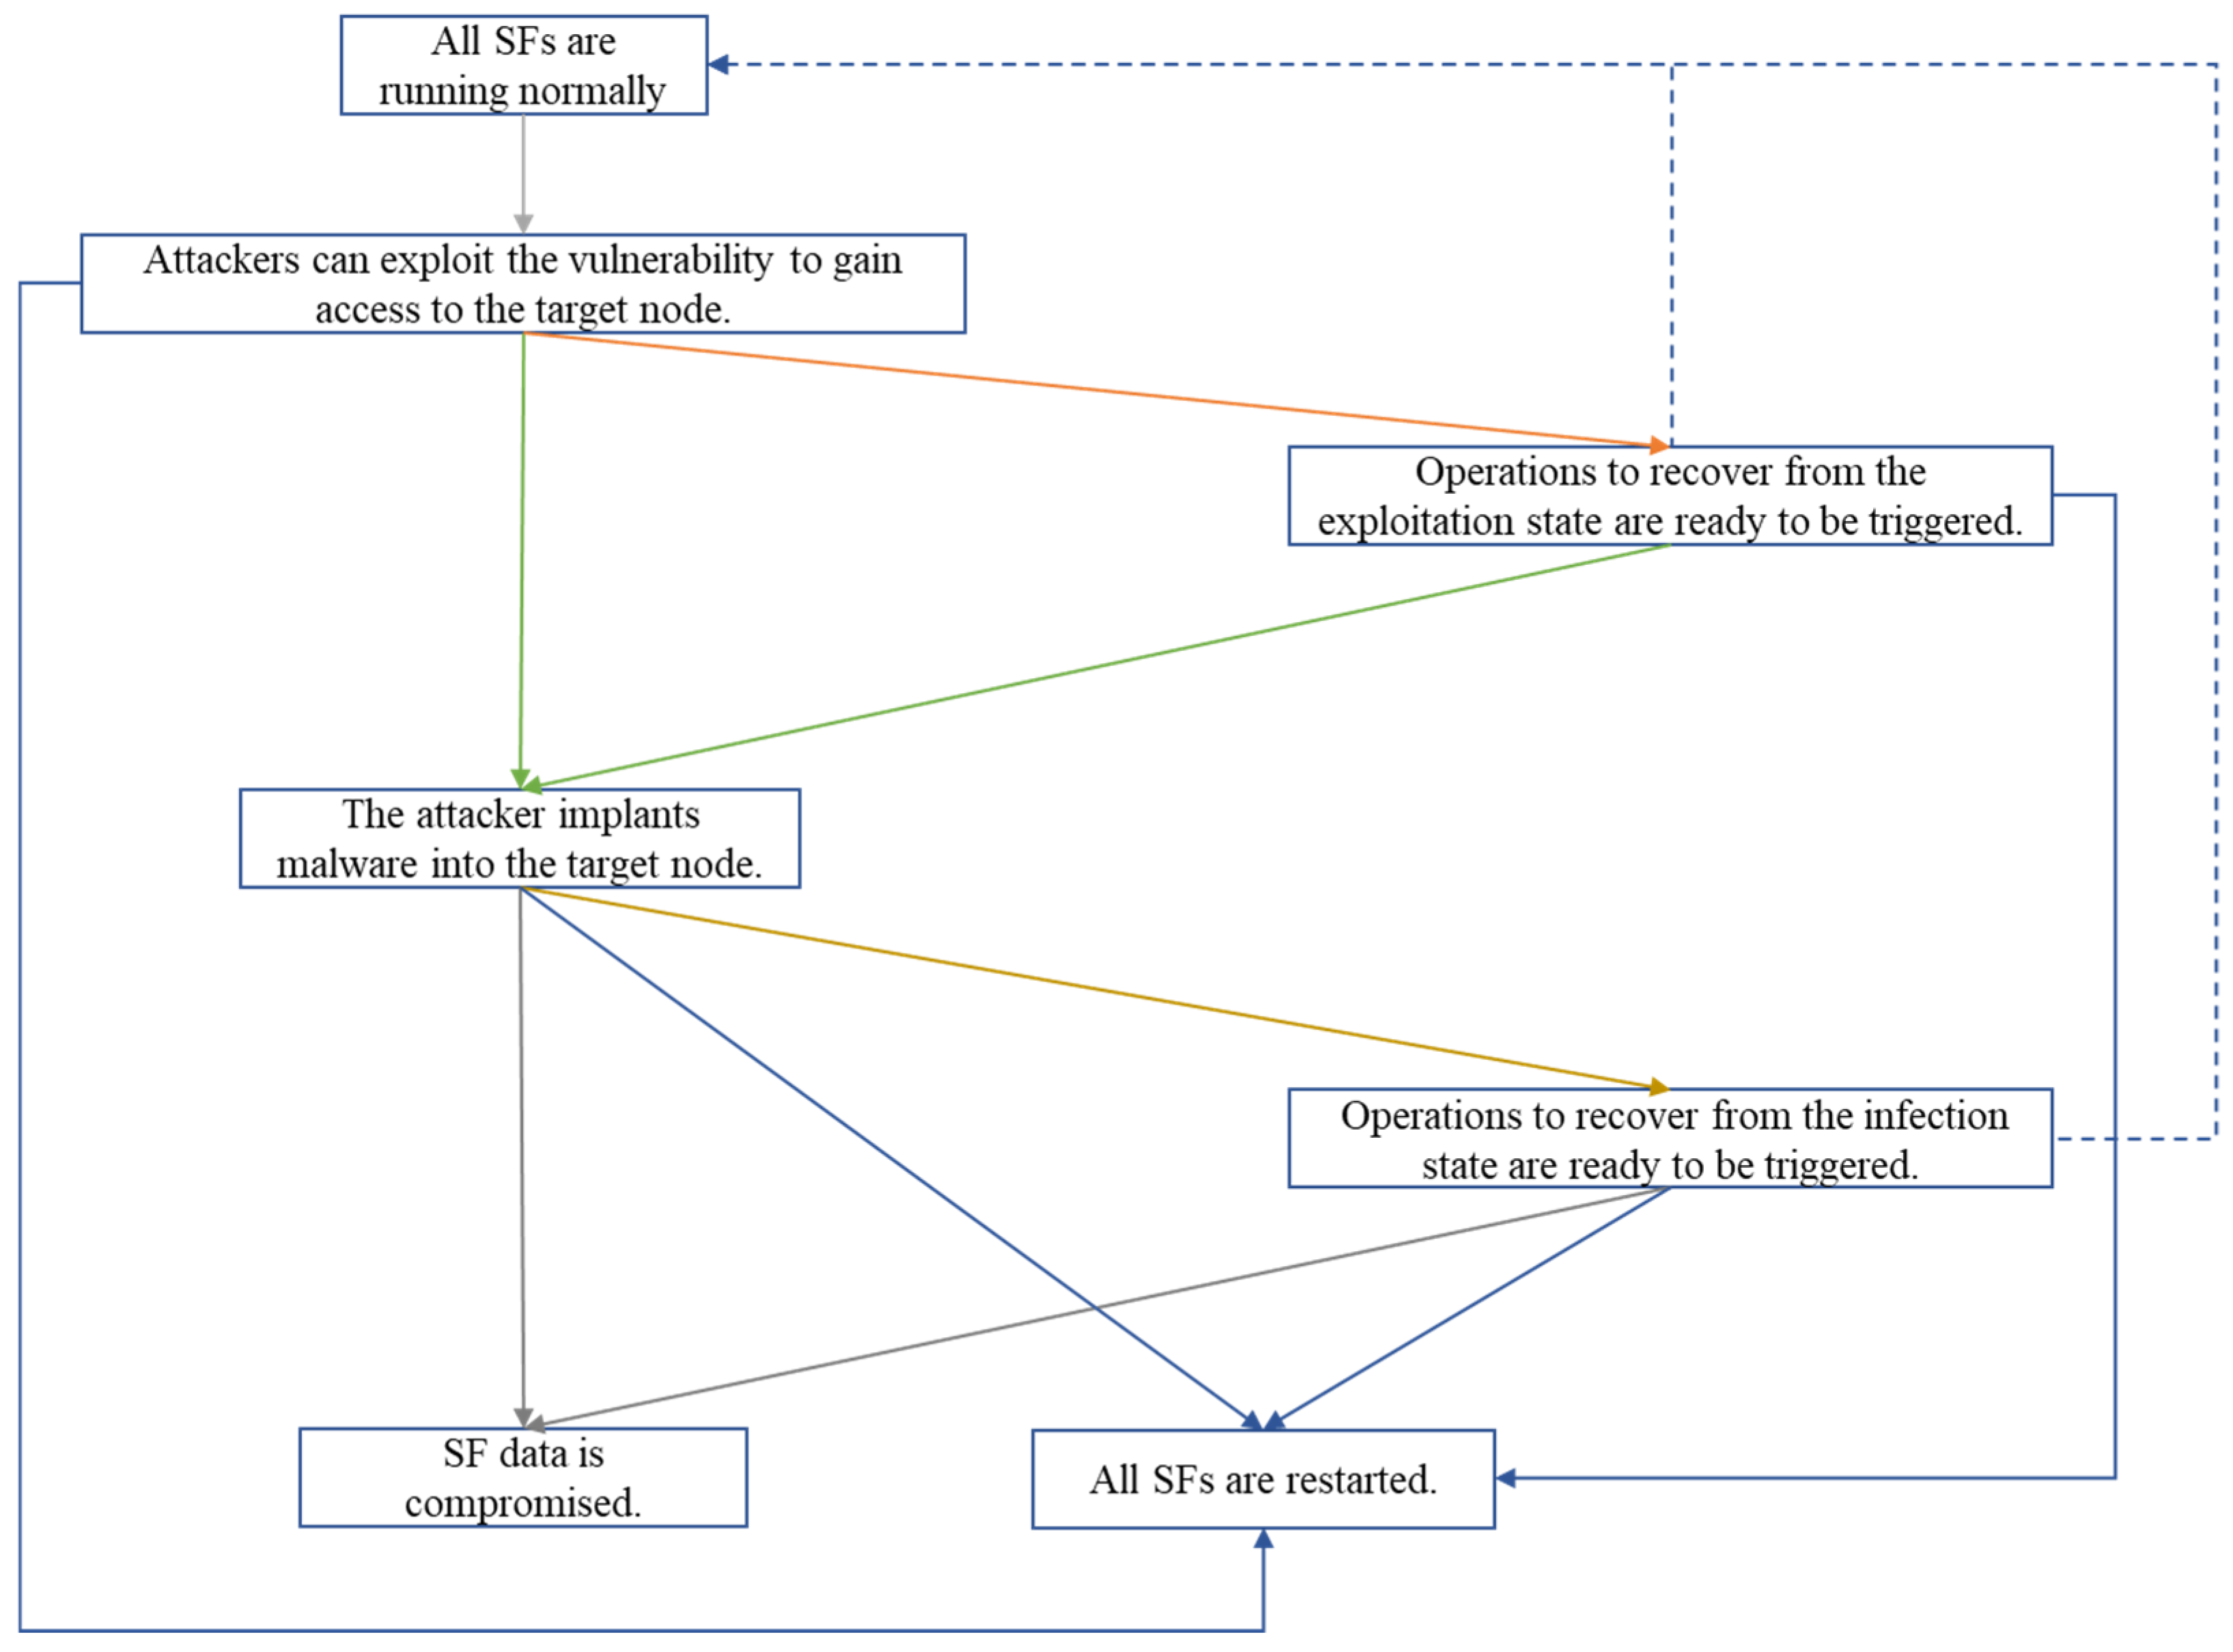
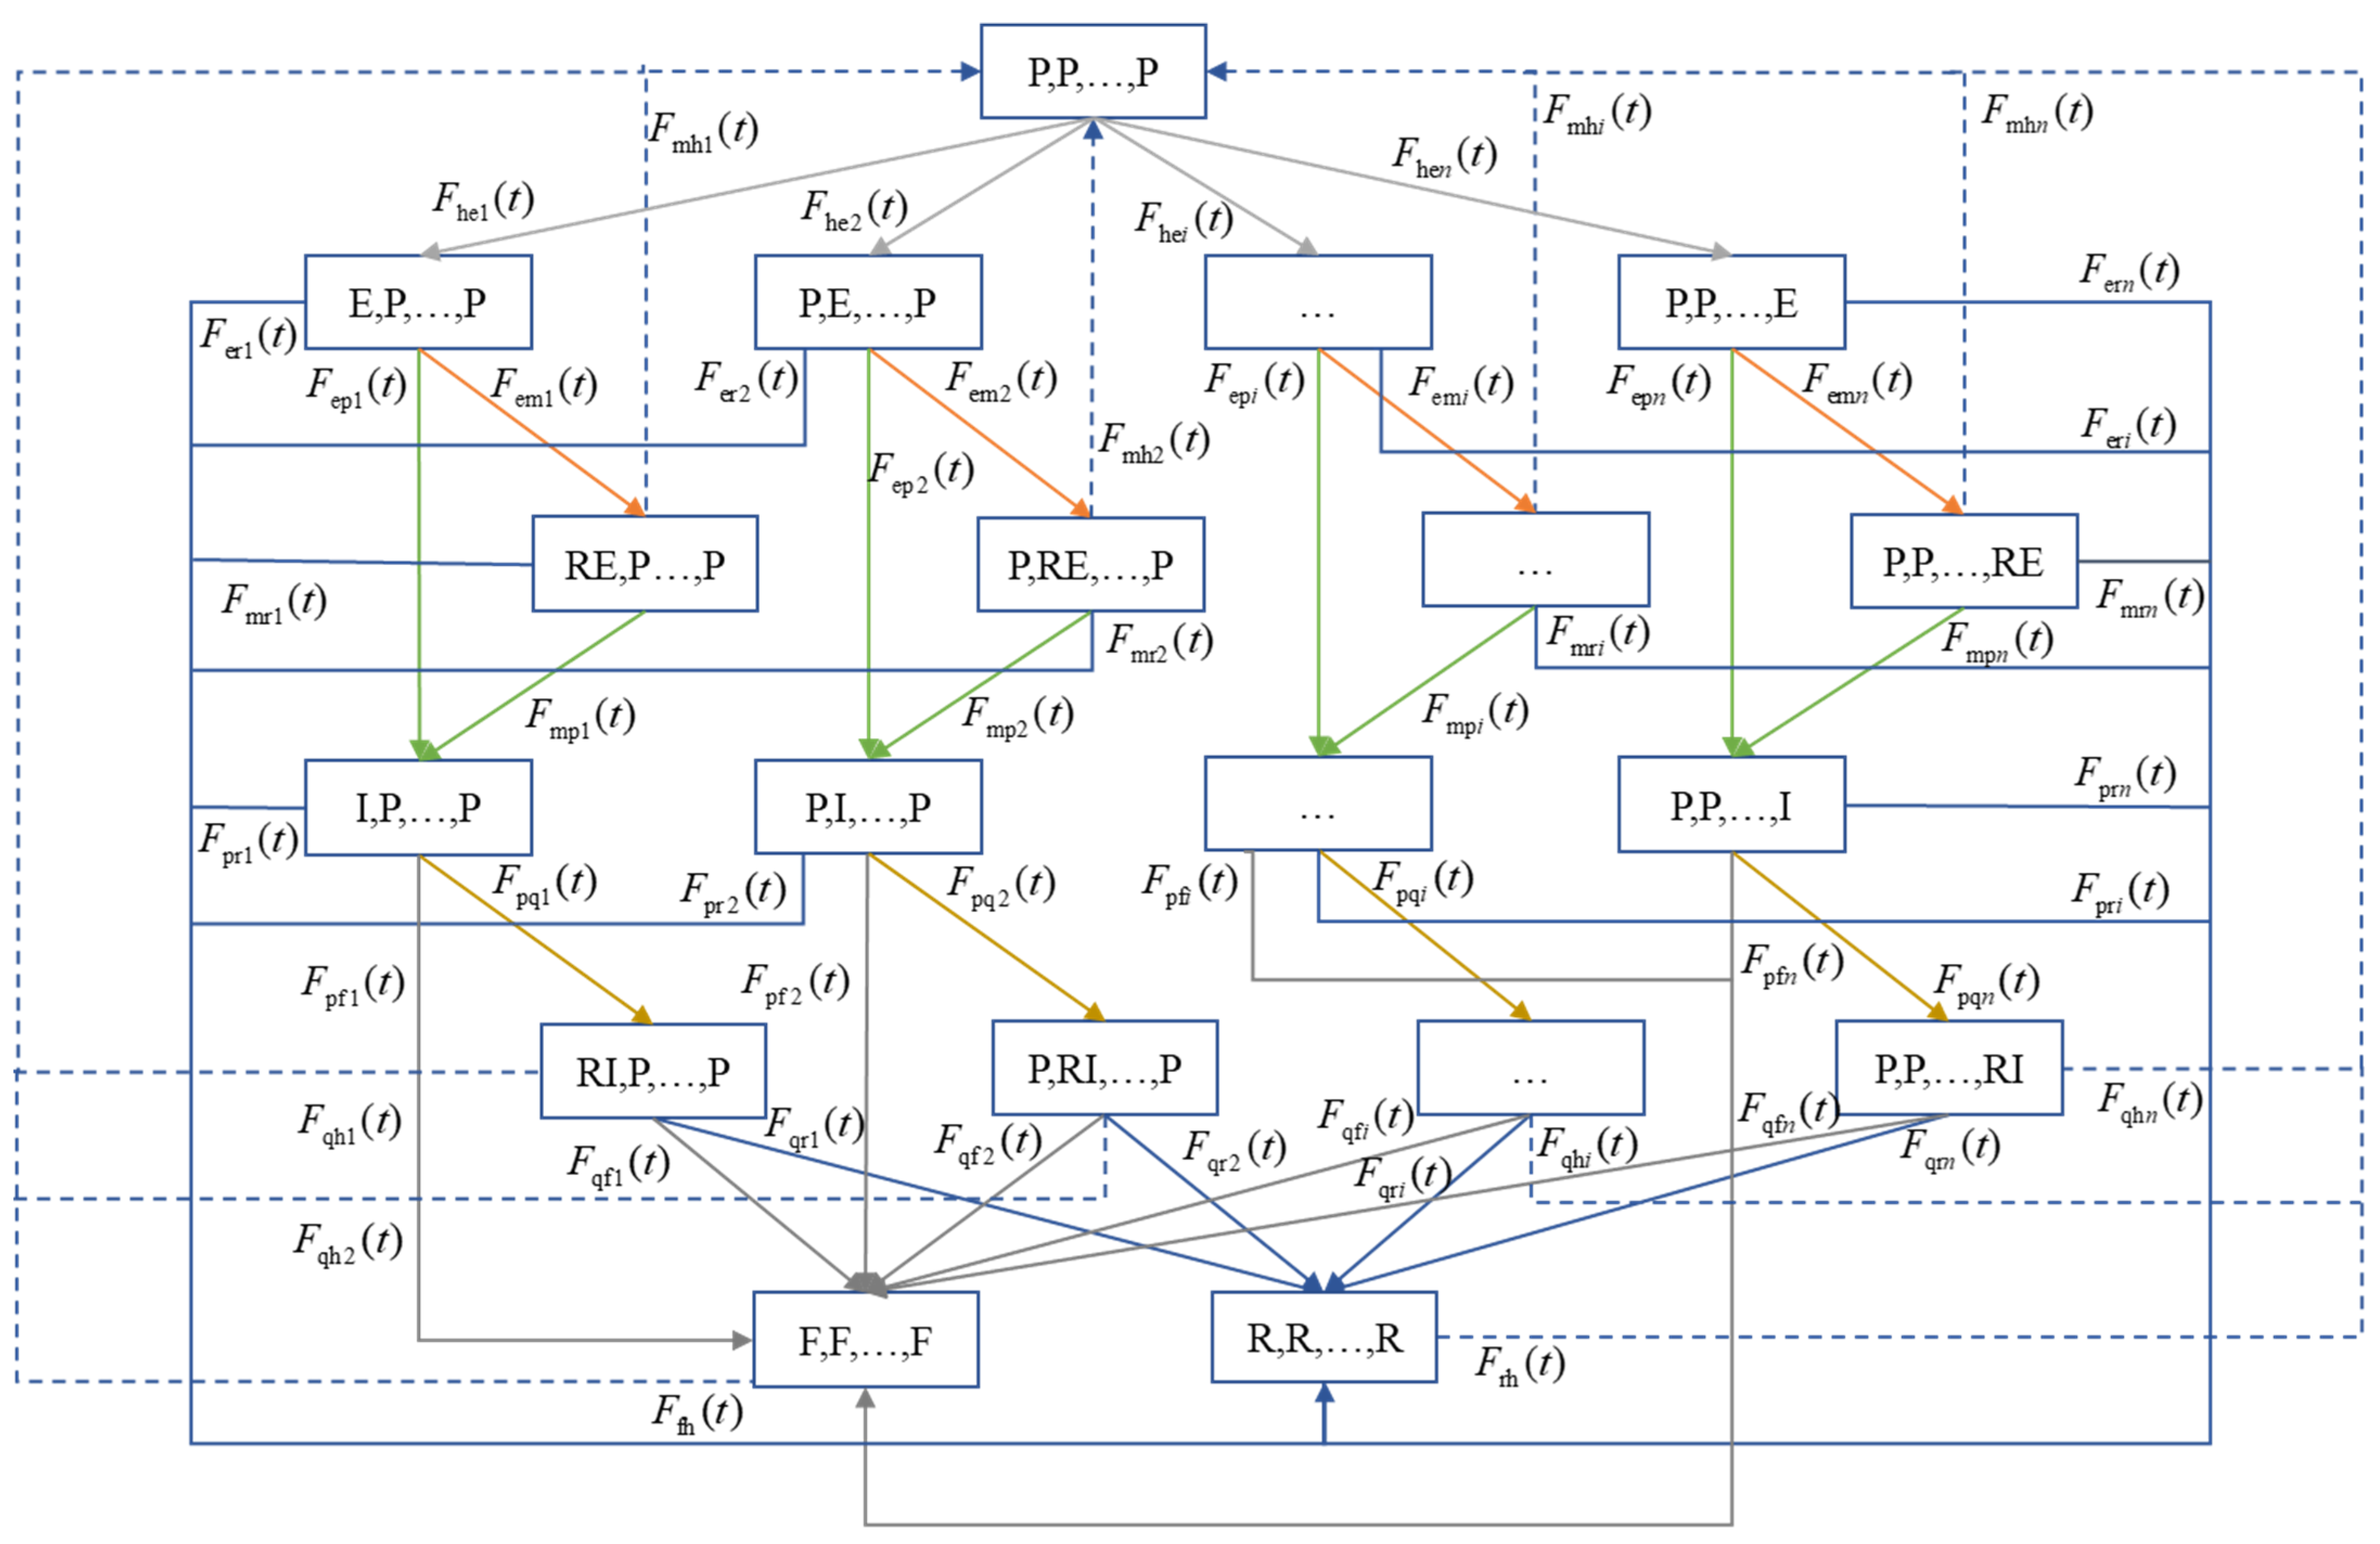
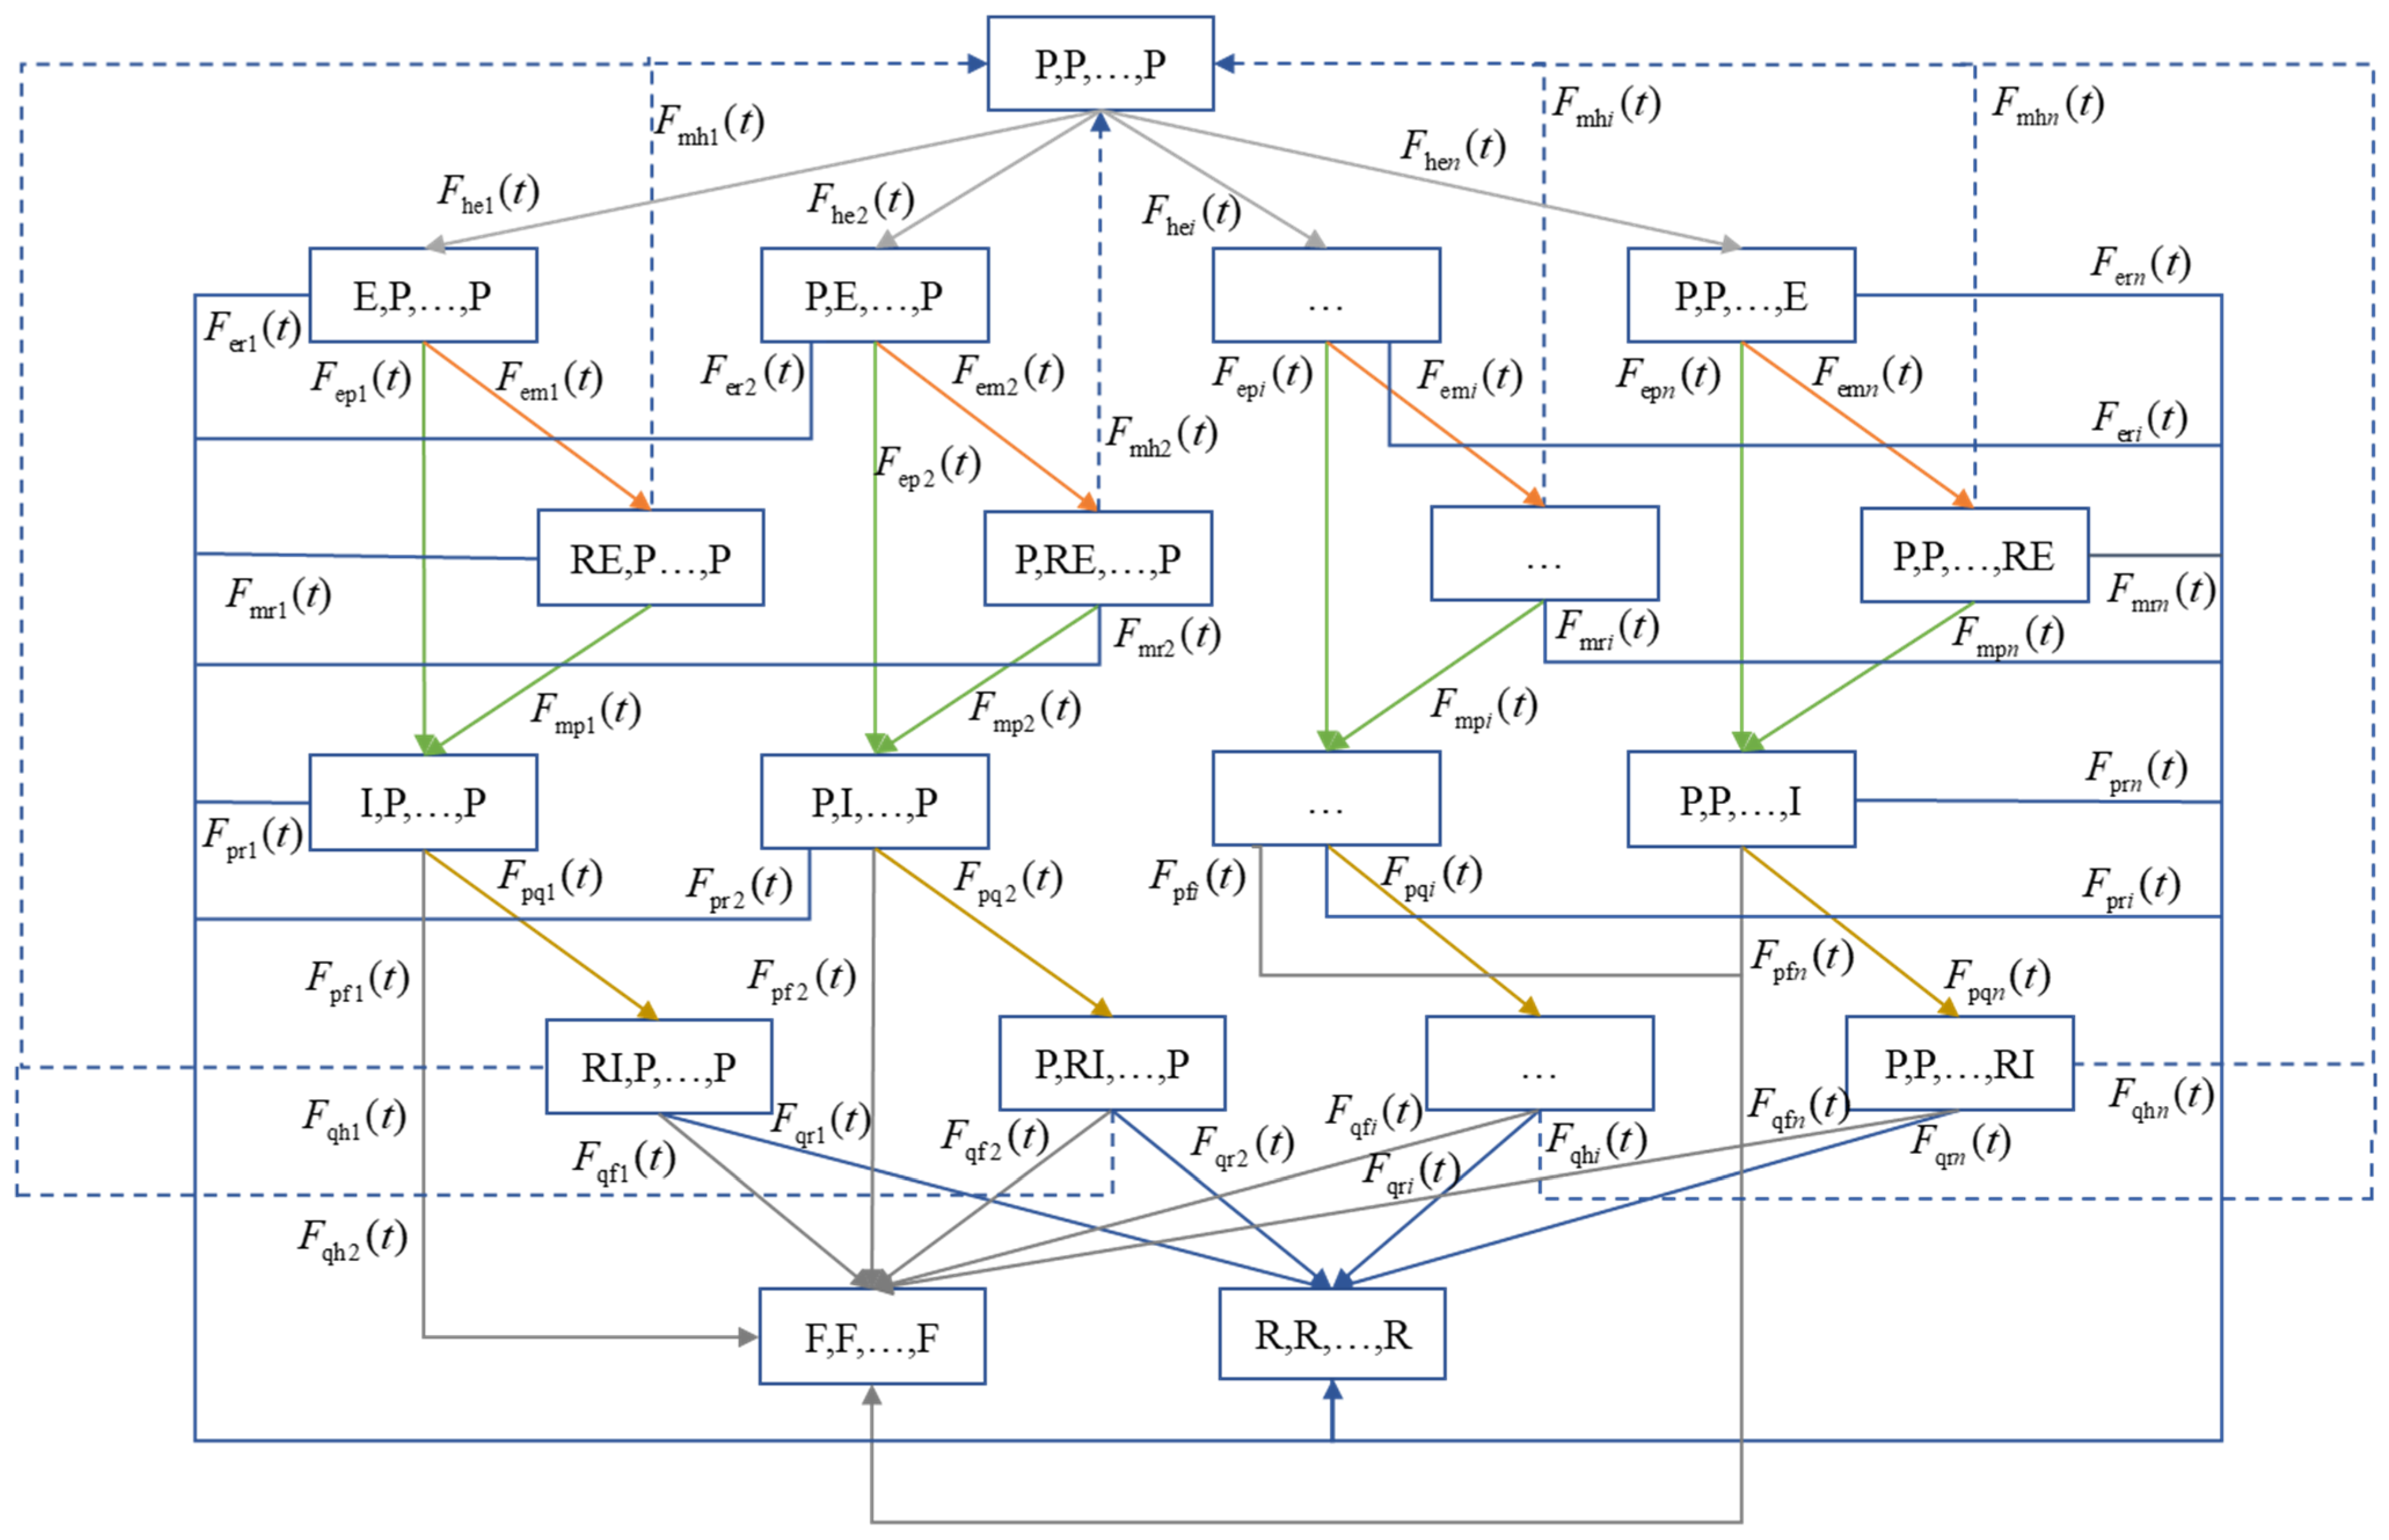
Based on the system states and transition times between system states, we establish the dependability analysis model, as shown in Figure 2. To aid understanding, Figure 2 focuses on illustrating the relationships between the various parts of the model. The complete dependability analysis model is shown in Figure A1 of Appendix A. In this figure, the gray lines represent the process of an attacker gaining access to the target node. The green lines represent the process of an attacker infecting the target node. The dark gray lines represent the process of an attacker stealing SF data. The blue solid lines represent the process in which one node in the system has been exploited by the attacker and other nodes are also exploited. The orange lines represent the process of preparing to trigger recovery operation from the exploitation state. The yellow lines represent the process of preparing to trigger recovery operation from the infection state. The blue dashed lines represent the recovery operation. This model can be used to analyze the availability, the probability of the security state and security risk of a USFC composed of any number of SFs. To better understand this model, we use a dependability analysis model for a USFC composed of two SFs as an example, as shown in Figure 3. The system starts in state ( P 1 , P 2 ) . After running for a period of time, an attacker may launch an attack on SFs in the USFC. At this time, the system will enter state ( E , P ) , or ( P , E ) . Here, the state the system enters is determined by comparing the shortest time required for an attacker to gain access to each SF, which does not mean that an attacker can only attack one SF at a time. Subsequently, after a fixed time interval, the SF will trigger the recovery operation, and the system will enter state R E , P , o r ( P , R E ) . If the SF completes recovery, the system will enter state ( P , P ) . If the SF is injected with malware during the recovery process, the system will enter state ( I , P ) , or ( P , I ) . If the attacker exploits a vulnerability to gain access to other SFs during the recovery process from the exploitation state, the system will enter ( R , R ) . When the system is in state ( I , P ) , or ( P , I ) , after a fixed time interval, the SF will trigger a recovery operation and the system will enter state ( R I , P ) , or ( P , R I ) . If the SF completes recovery, the system will enter state ( P , P ) . If SF data is compromised during the recovery process, the system will enter state ( F , F ) . If an attacker exploits a vulnerability to gain access to other SFs during the recovery process from the infection state, the system will enter state ( R , R ) . When the system is in state R , R , all SFs in the system are restarted and the system then enters state ( P , P ) . Alternatively, when the system is in state ( F , F ) , all SFs in the system are repaired and restarted, and the system then enters state ( P , P ) . Based on this model, we further develop a dependability analysis model with absorption states, as shown in Figure 4. The complete dependability analysis model with absorption states is shown in Figure A2 of Appendix A. This model considers that no recovery operation is performed when the system is unavailable.
In our model, each UAV is treated as a static network node. This simplification is reasonable for the dependability metrics we are interested in and provides a conservative benchmark for USFC dependability limits. The reasons are as follows:
  • First, the execution time of a USFC is typically much shorter than the time intervals between adjacent waypoints in a typical UAV operation. For example, a USFC instance might complete in a few seconds, while UAV’s position change can take tens of seconds to minutes. Therefore, the relative displacement during USFC execution is negligible.
  • Second, the dependability metrics we analyze are steady state and not instantaneous. While mobility introduces transient fluctuations in link quality, the long-term average of node-level dependability is still primarily determined by the attack behavior and recovery process.
Third, our static assumption provides a conservative estimate of the metrics we are concerned with when mobility does indeed impact dependability. By assuming static conditions, we implicitly consider the best-case scenario regarding link stability. Any dependability degradation caused by mobility only reinforces our conclusion that a robust USFC design is necessary.

3.3. Dependability Analysis

This paper aims to evaluate the dependability of the USFC from two aspects: availability and security. Specifically, availability metrics include steady-state availability and the probability of the unavailable state. The security metrics include the mean time to exfiltration (MTTE), the probability of security state, low security risk, and high security risk. Unlike classical reliability theories that focus on general system failures, this paper explores security failures caused by adversarial behavior. Therefore, we use MTTE as a security metric to quantify a system’s ability to withstand data breaches. MTTE is similar to the mean time to compromise, commonly used in the cybersecurity literature [28]. To solve for these metrics, we first construct the transition probability matrix given in Equation (1).
0 p S 0 S n + 1 p S 0 S 2 n 0 0 p S 1 S 0 0 0 p S 1 S 3 n + 1 0 p S 1 S 4 n + 1 0 p S n S 0 0 0 p S n + 1 S 4 n p S n S 4 n + 1 0 0 p S n + 1 S 1 0 0 p S n + 1 S 3 n + 1 0 p S n + 1 S 4 n + 1 0 0 0 p S 2 n S n 0 0 p S 2 n S 4 n p S 2 n S 4 n + 1 0 p S 2 n + 1 S 0 0 0 p S 2 n + 1 S 4 n + 1 p S 2 n + 1 S 4 n + 2 p S 3 n S 0 0 0 p S 3 n S 4 n + 1 p S 3 n S 4 n + 2 0 0 p S 3 n + 1 S 2 n + 1 0 0 p S 3 n + 1 S 4 n + 1 p S 3 n + 1 S 4 n + 2 0 0 p S 4 n S 3 n 0 0 p S 4 n S 4 n + 1 p S 4 n S 4 n + 2 p S 4 n + 1 S 0 0 0 p S 4 n + 2 S 0 0 0
where the elements in the matrix are given in Equations (2)–(14). In these formulas, S represents the system state number, and its relationship with the system state is listed in Table 2. i and j are the indices of system state, corresponding to states S i and S j , where 1 i n and j B = { j | j i , 1 j n } . To better understand this matrix, we present the transition probability matrix in Equation (15) for analyzing the dependability of USFC consisting of two SFs.
p S 0 S i + n = 0 Π j B ( 1 F he j ( t ) ) d F he i ( t )
p S i S 0 = 0 ( 1 F mp i ( t ) ) ( 1 F mr j ( t ) ) d F mh i ( t )
p S i S i + 3 n ( t ) = 0 ( 1 F mh i ( t ) ) ( 1 F mr j ( t ) ) d F mp i ( t )
p S i S 4 n + 1 = 0 ( 1 F mh i ( t ) ) ( 1 F mp i ( t ) ) d F mr j ( t )
p S i + n S i = 0 ( 1 F ep i ( t ) ) ( 1 F er j ( t ) ) d F em i ( t )
p S i + n S i + 3 n ( t ) = 0 ( 1 F em i ( t ) ) ( 1 F er j ( t ) ) d F ep i ( t )
p S i + n S 4 n + 1 = 0 ( 1 F em i ( t ) ) ( 1 F ep i ( t ) ) d F er j ( t )
p S i + 2 n S 0 = 0 ( 1 F qf i ( t ) ) ( 1 F qr j ( t ) d F qh i ( t )
p S i + 2 n S 4 n + 1 = 0 ( 1 F qh i ( t ) ) ( 1 F qf i ( t ) d F qr j ( t )
p S i + 2 n S 4 n + 2 ( t ) = 0 ( 1 F qh i ( t ) ) ( 1 F qr j ( t ) d F qf i ( t )
p S i + 3 n S i + 2 n = 0 ( 1 F pf i ( t ) ) ( 1 F pr j ( t ) d F pq i ( t )
p S i + 3 n S 4 n + 1 = 0 ( 1 F pf i ( t ) ) ( 1 F pq i ( t ) ) d F pr j ( t )
p S i + 3 n S 4 n + 2 = 0 ( 1 F pq i ( t ) ) ( 1 F pr j ( t ) d F pf i ( t )
0 0 0 p S 0 S 3 p S 0 S 4 0 0 0 0 0 0 p S 1 S 0 0 0 0 0 0 0 p S 1 S 7 0 p S 1 S 9 0 p S 2 S 0 0 0 0 0 0 0 0 p S 2 S 8 p S 2 S 9 0 0 p S 3 S 1 0 0 0 0 0 p S 3 S 7 0 p S 3 S 9 0 0 0 p S 4 S 2 0 0 0 0 0 p S 4 S 8 p S 4 S 9 0 p S 5 S 0 0 0 0 0 0 0 0 0 p S 5 S 9 p S 5 S 10 p S 6 S 0 0 0 0 0 0 0 0 0 p S 6 S 9 p S 6 S 10 0 0 0 0 0 p S 7 S 5 0 0 0 p S 7 S 9 p S 7 S 10 0 0 0 0 0 0 p S 8 S 6 0 0 p S 8 S 9 p S 8 S 10 p S 9 S 0 0 0 0 0 0 0 0 0 0 0 p S 10 S 0 0 0 0 0 0 0 0 0 0 0
By solving V = VP , we can obtain V S i . Then, we calculate the sojourn time in each state, which is given in Equations (16)–(22).
h S 0 = 0 j = 1 m ( 1 F he j ( t ) ) d t
h S i = 0 ( 1 F mp i ( t ) ) ( 1 F mr j ( t ) ) ( 1 F mh i ( t ) ) d t
h S i + n = 0 ( 1 F em i ( t ) ) ( 1 F er j ( t ) ) ( 1 F ep i ( t ) ) d t
h S i + 2 n = 0 ( 1 F qf i ( t ) ) ( 1 F qr j ( t ) ) ( 1 F qh i ( t ) ) d t
h S i + 3 n = 0 ( 1 F pf i ( t ) ) ( 1 F pr j ( t ) ) ( 1 F pq i ( t ) ) d t
h S 4 n + 1 = 0 ( 1 F rh ( t ) ) d t
h S 4 n + 2 = 0 ( 1 F fh ( t ) ) d t
To better understand the formulas derived in this paper, we provide Equations (23)–(59) for analyzing the dependability of USFC consisting of two SFs. Table 4 lists the meanings of the notations used in the formulas.
p S 0 S 3 = 0 ( 1 F h e 2 ( t ) ) d   F h e 1 ( t )
p S 0 S 4 = 0 ( 1 F he 1 ( t ) ) d   F he 2 ( t )
p S 1 S 0 = 0 ( 1 F mp 1 ( t ) ) ( 1 F mr 2 ( t ) ) d F mh 1 ( t )
p S 1 S 7 ( t ) = 0 ( 1 F mh 1 ( t ) ) ( 1 F mr 2 ( t ) ) d F mp 1 ( t )
p S 1 S 9 = 0 ( 1 F mh 1 ( t ) ) ( 1 F mp 1 ( t ) ) d F mr 2 ( t )
p S 2 S 0 = 0 ( 1 F mp 2 ( t ) ) ( 1 F mr 1 ( t ) ) d F mh 2 ( t )
p S 2 S 8 ( t ) = 0 ( 1 F mh 2 ( t ) ) ( 1 F mr 1 ( t ) ) d F mp 2 ( t )
p S 2 S 9 = 0 ( 1 F mh 2 ( t ) ) ( 1 F mp 2 ( t ) ) d F mr 1 ( t )
p S 3 S 1 = 0 ( 1 F ep 1 ( t ) ) ( 1 F er 2 ( t ) ) d F em 1 ( t )
p S 3 S 7 ( t ) = 0 ( 1 F em 1 ( t ) ) ( 1 F er 2 ( t ) ) d F ep 1 ( t )
p S 3 S 9 = 0 ( 1 F em 1 ( t ) ) ( 1 F ep 1 ( t ) ) d F er 2 ( t )
p S 4 S 2 = 0 ( 1 F ep 2 ( t ) ) ( 1 F er 1 ( t ) ) d F em 2 ( t )
p S 4 S 8 ( t ) = 0 ( 1 F em 2 ( t ) ) ( 1 F er 1 ( t ) ) d F ep 2 ( t )
p S 4 S 9 = 0 ( 1 F em 2 ( t ) ) ( 1 F ep 2 ( t ) ) d F er 1 ( t )
p S 5 S 0 = 0 ( 1 F qf 1 ( t ) ) ( 1 F qr 2 ( t ) d F qh 1 ( t )
p S 5 S 9 = 0 ( 1 F qh 1 ( t ) ) ( 1 F qf 1 ( t ) d F qr 2 ( t )
p S 5 S 10 ( t ) = 0 ( 1 F qh 1 ( t ) ) ( 1 F qr 2 ( t ) d F qf 1 ( t )
p S 6 S 0 = 0 ( 1 F qf 2 ( t ) ) ( 1 F qr 1 ( t ) d F qh 2 ( t )
p S 6 S 9 = 0 ( 1 F qh 2 ( t ) ) ( 1 F qf 2 ( t ) d F qr 1 ( t )
p S 6 S 10 ( t ) = 0 ( 1 F qh 2 ( t ) ) ( 1 F qr 1 ( t ) d F qf 2 ( t )
p S 7 S 5 = 0 ( 1 F pf 1 ( t ) ) ( 1 F pr 2 ( t ) d F pq 1 ( t )
p S 7 S 9 = 0 ( 1 F pf 1 ( t ) ) ( 1 F pq 1 ( t ) ) d F pr 2 ( t )
p S 7 S 10 = 0 ( 1 F pq 1 ( t ) ) ( 1 F pr 2 ( t ) d F pf 1 ( t )
p S 8 S 6 = 0 ( 1 F pf 2 ( t ) ) ( 1 F pr 1 ( t ) d F pq 2 ( t )
p S 8 S 9 = 0 ( 1 F pf 2 ( t ) ) ( 1 F pq 2 ( t ) ) d F pr 1 ( t )
p S 8 S 10 = 0 ( 1 F pq 2 ( t ) ) ( 1 F pr 1 ( t ) d F pf 2 ( t )
h S 0 = 0 ( 1 F he 1 ( t ) ) ( 1 F he 2 ( t ) ) d t
h S 1 = 0 ( 1 F mp 1 ( t ) ) ( 1 F mr 2 ( t ) ) ( 1 F mh 1 ( t ) ) d t
h S 2 = 0 ( 1 F mp 2 ( t ) ) ( 1 F mr 1 ( t ) ) ( 1 F mh 2 ( t ) ) d t
h S 3 = 0 ( 1 F em 1 ( t ) ) ( 1 F er 2 ( t ) ) ( 1 F ep 1 ( t ) ) d t
h S 4 = 0 ( 1 F em 2 ( t ) ) ( 1 F er 1 ( t ) ) ( 1 F ep 2 ( t ) ) d t
h S 5 = 0 ( 1 F qf 1 ( t ) ) ( 1 F qr 2 ( t ) ) ( 1 F qh 1 ( t ) ) d t
h S 6 = 0 ( 1 F qf 2 ( t ) ) ( 1 F qr 1 ( t ) ) ( 1 F qh 2 ( t ) ) d t
h S 7 = 0 ( 1 F pf 1 ( t ) ) ( 1 F pr 2 ( t ) ) ( 1 F pq 1 ( t ) ) d t
h S 8 = 0 ( 1 F pf 2 ( t ) ) ( 1 F pr 1 ( t ) ) ( 1 F pq 2 ( t ) ) d t
h S 9 = 0 ( 1 F rh ( t ) ) d t
h S 10 = 0 ( 1 F fh ( t ) ) d t
p can be obtained by solving lim t k ( t ) . For example, p S 0 S 3 = lim t k S 0 S 3 t = P r { s = S 3 , T t | s = S 0 } , where k S 0 S 3 t is the probability that an attacker can gain access to the first SF. p S 3 S 7 = lim t k S 3 S 7 t = P r { s = S 7 , T t | s = S 3 } , where k S 3 S 7 t is the probability that an attacker implants malware into the first SF. p S 7 S 10 = lim t k S 7 S 10 t = P r { s = S 10 , T t | s = S 7 } , where k S 7 S 10 t is the probability that an attacker uses implanted malware to steal data from the first SF.
Based on the derived formulas, we first prove the aperiodicity of the embedded discrete-time Markov chain.
Proof. 
Consider state ( P , P , R I ) in the model for analyzing the dependability of a USFC consisting of three SFs. It can return to itself in five steps via the path ( P , P , R I ) ( R , R , R ) ( P , P , P ) ( P , P , E ) ( P , P , I ) ( P , P , R I ) ( p ( P , P , R I ) ( R , R , R ) p R , R , R P , P , P p P , P , P P , P , E p P , P , E P , P , I p P , P , I P , P , R I = 0.000743 > 0 ) or in six steps via the path ( P , P , R I ) ( F , F , F ) ( P , P , P ) ( P , P , E ) ( P , P , R I ) ( P , P , I ) ( P , P , R I ) ( p ( P , P , R I ) ( F , F , F ) p F , F , F P , P , P p P , P , P P , P , E p P , P , E P , P , R I p P , P , R I P , P , I p P , P , I P , P , R I = 0.000106 > 0 ). Since gcd(5,6) = 1, this state is aperiodic. □
In addition, the proposed model has a finite number of system states, all states are interconnected, and lim t F t = 1 . Therefore, the proposed model is effective.
Finally, we can derive the formulas for calculating the dependability metrics. By accurately modeling small-scale USFC and discovering patterns, we derive the formulas that reveal the correlation between the number of SFs in the USFC and the various metrics. These formulas can be extrapolated to USFC systems of other sizes, and thus, avoiding the computational bottleneck of state space explosion. In addition, the computational complexity of evaluating the proposed metrics is O ( n C ) , where C is the computational complexity of integrals. It can be seen that the computational complexity is linearly related to n. Therefore, the approach proposed in this paper can be used to evaluate the dependability of large-scale USFC.
(1)
The steady-state availability: A = 1 ( V S ( 4 n + 1 ) h S ( 4 n + 1 ) + V S ( 4 n + 2 ) h S ( 4 n + 2 ) ) i = 0 4 n + 2 V S i h S i .
(2)
The probability of the unavailable state: U = ( V S ( 4 n + 1 ) h S ( 4 n + 1 ) + V S ( 4 n + 2 ) h S ( 4 n + 2 ) ) i = 0 4 n + 2 V S i h S i .
(3)
The mean time to exfiltration: M T T E = i = 0 4 n V S i h S i .
(4)
The probability of the security state: S = V S 0 h S 0 i = 0 4 n + 2 V S i h S i .
(5)
Loss security risk: S l o w = j = 1 2 n V S j h S j i = 0 4 n + 2 V S i h S i .
(6)
High security risk: S h i g h = j = 2 n + 1 4 n V S j h S j i = 0 4 n + 2 V S i h S i

4. Experimental Results

In this section, we analyze USFC system dependability from the perspectives of availability and security. Through multiple sets of experiments, we will thoroughly validate the effectiveness and practicality of the proposed method under varying system parameters and node configurations.

4.1. Experimental Configuration

Numerical analysis experiments based on models and formulas are conducted in a Maple environment in order to investigate the effects of system parameters on metrics. Table 5 lists the default parameter settings used in the experiment. It is worth noting that the parameters used in experiments are only examples to verify the effectiveness of the proposed model and formulas. Other parameters are also applicable to our model. In addition, each malicious data packet sent by the attacker is independent, and the conditions for triggering a vulnerability each time are random and do not accumulate any useful information. Therefore, we set the time to obtain node access, following exponential distribution. The remaining distributions are set according to [29,30,31], which is also only an example to verify our approach, and other distributions are equally applicable to our approach.
During the experiment, we used the Dirac delta function in Maple to implement the Heaviside distribution. We first calculate its derivative to obtain the density function (Dirac delta function). Maple automatically applies the sifting property of Dirac delta function. This method is exact and analytic, which does not involve any numerical approximations, thus obtaining closed-form results consistent with the theoretical properties of SMP. The Heaviside distribution is used to simulate fixed TTIRES and TTIRIS. In a typical USFC, such latency is typically in the range of seconds. Setting the mean in such a large range (0–2 h) will show how dependability metrics change with TTIRES and TTIRIS and help determine the optimal TTIRES and TTIRIS corresponding to the optimal dependability metrics.

4.2. Dependability Assessment Results

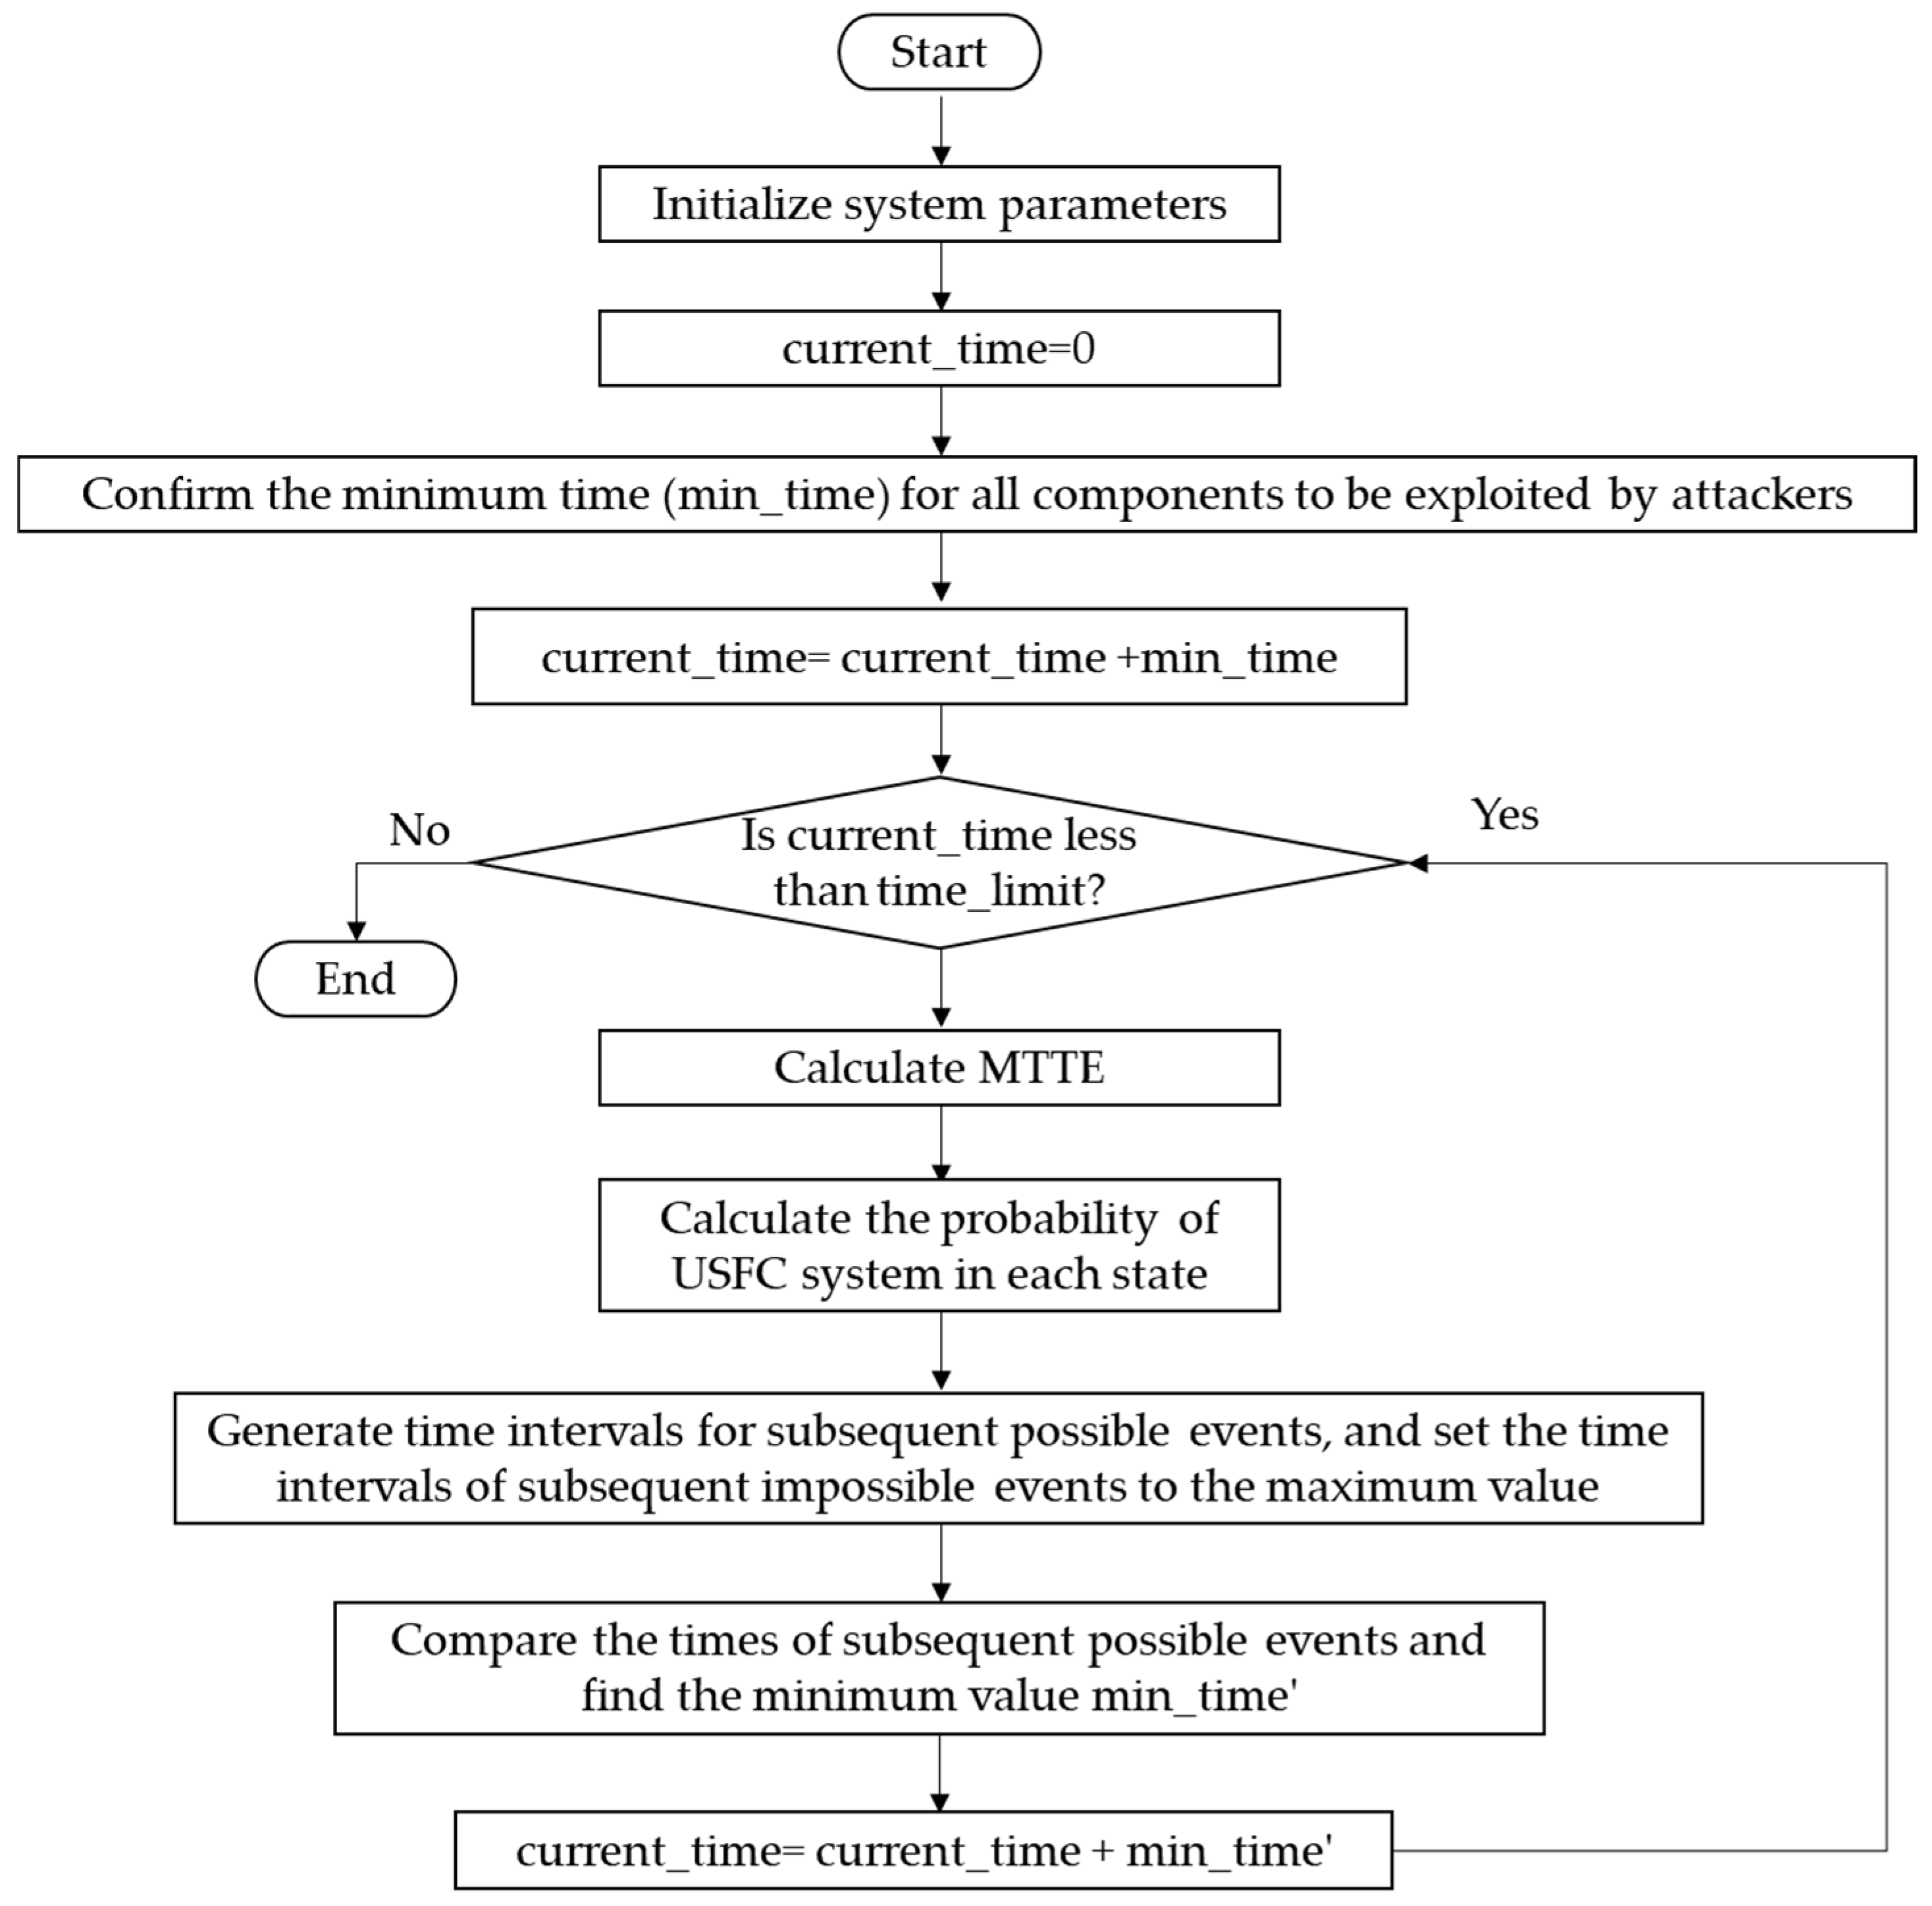
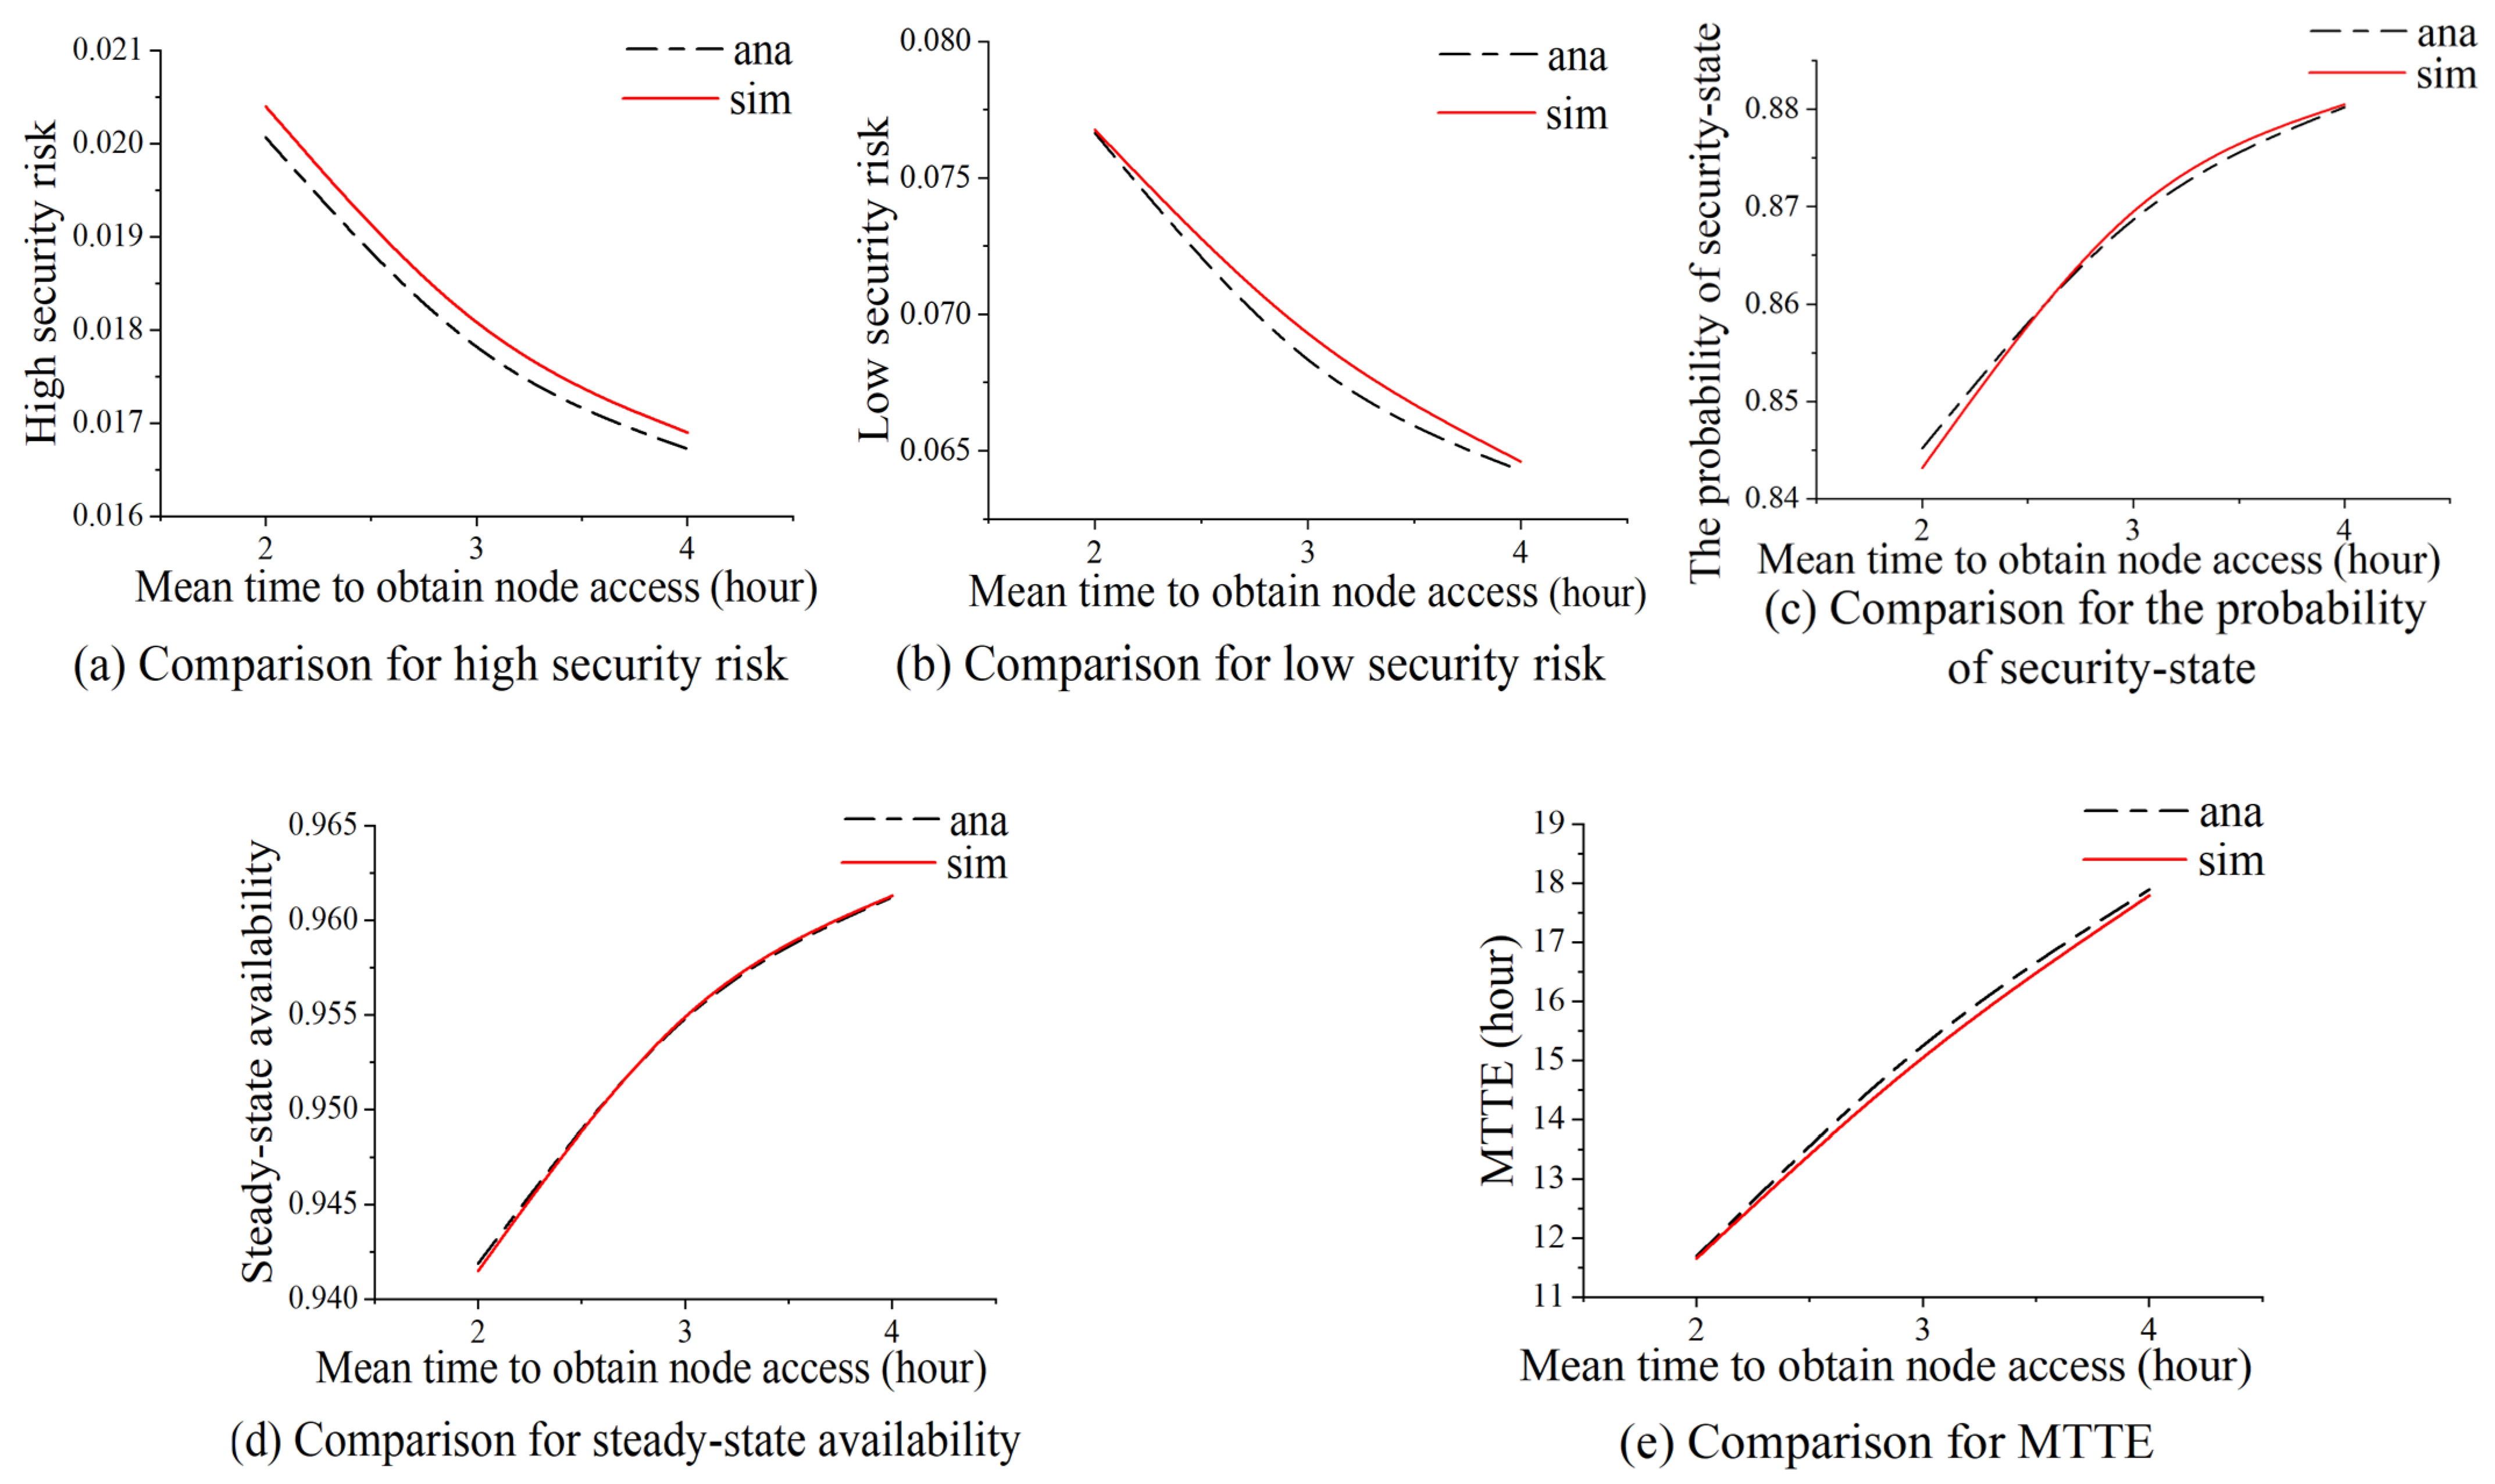
We conduct simulation and numerical analysis experiments for each USFC dependability metric. Figure 5 illustrates the simulation experiment process. First, initialize the system parameters. Next, confirm the minimum time (min_time) for all components to be exploited by attackers, and add this min_time to the current_time. Subsequently, check whether the current_time is less than the time_limit of the simulation experiment. If the current_time is less than the time_limit, calculate the MTTE (Algorithm 1) and the probability of the USFC system in each state (Algorithm 2). After that, generate time intervals for subsequent possible events and set the time intervals of subsequent impossible events to the maximum value. Then, compare the times of subsequent possible events to find the minimum value (min_time’) and update the current time. Repeat the above steps until the current time exceeds the time limit, at which point the experiment ends. The results are shown in Figure 6. The comparison shows that the results of the numerical analysis experiments are close to the simulation results, demonstrating the approximate accuracy of our model and formulas.
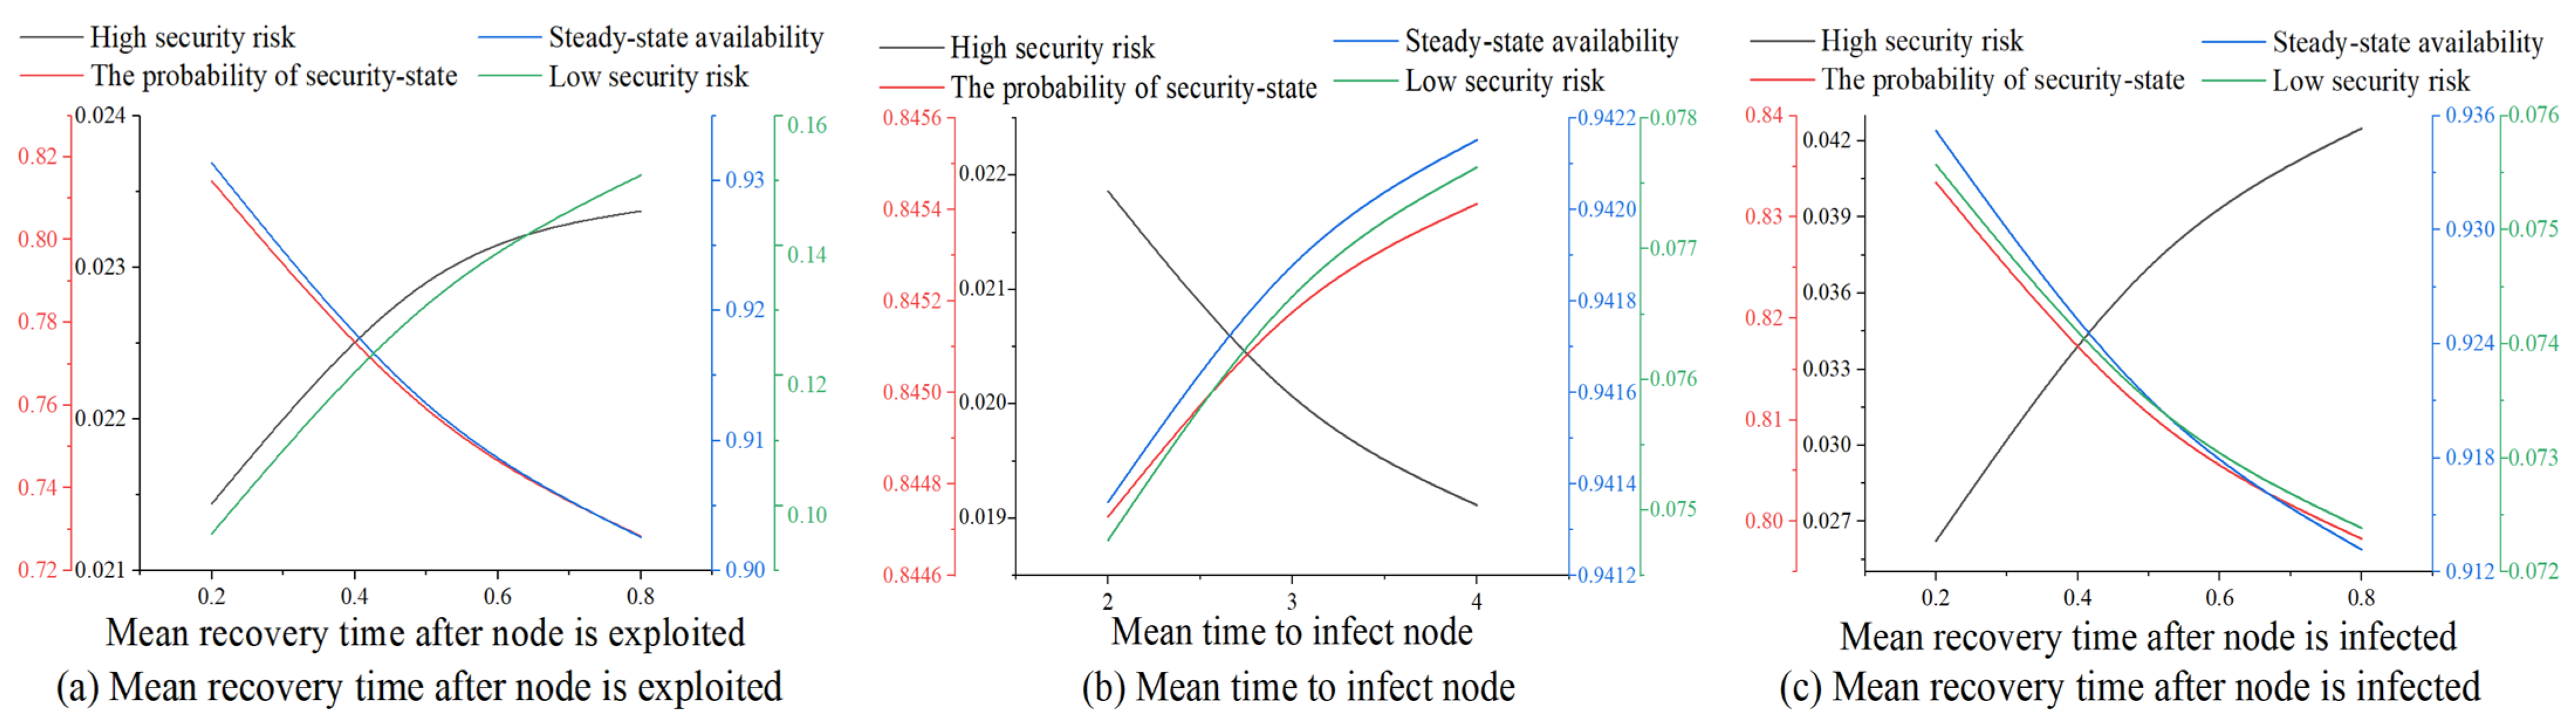
We then evaluate the USFC dependability metrics by varying the parameters. Figure 7a shows that as mean recovery time after node is exploited increases, both high security risk and low security risk increase, while steady-state availability and the probability of the security state decrease. In Figure 7b, it can be observed that as the mean time to infect node increases, high security risk decreases, while the other three indicators all increase. Conversely, when the mean recovery time after node is infected increases, the opposite trends are observed in Figure 7c. From Figure 7, we can also obtain the optimal parameter values when these four metrics achieve synergistic optimization.
Algorithm 1: Calculate MTTE
Input: max_value, time_limit, current_time
Output: avg_mtte
1.
  begin
2.
    while (current_time < time_limit) do
3.
       if the next event is that the system enters state E/I/RE/RI then:
4.
        mtte = mtte + time_E/time_RE/time_I/time_RI
5.
        Generate time intervals for subsequent possible events
6.
        Set the time intervals of subsequent impossible events to the maximum value
7.
       else if the next event is that the system enters state R/F then:
8.
        mtte = mtte + time_R/time_F
9.
        count = count + 1
10.
        total_mtte = total_mtte + mtte
11.
        mtte = 0
12.
        Generate time intervals for subsequent possible events
13.
  Set the time intervals of subsequent impossible events to the maximum value
14.
       else if the next event is the recovery from state RE/RI to state P then:
15.
        mtte = mtte + time_REP/time_RIP
16.
        Generate time intervals for subsequent possible events
17.
        Set the time intervals of subsequent impossible events to the maximum value
18.
       else if the next event is the recovery from state R/F to state P then:
19.
        Generate time intervals for subsequent possible events
20.
        Set the time intervals of subsequent impossible events to the maximum value
21.
       end if
22.
    end while
23.
    if count == 0 then
24.
      avg_mtte = max_value
25.
    else
26.
      avg_mtte = total_mtte/count
27.
    end if
28.
  end
Algorithm 2: Calculate the probability of USFC system in each state
Input: time_limit, current_time
Output: The probability of USFC system in each state
1.
   begin
2.
     while current_time < time_limit do
3.
       if the next event is that the system enters state P/E/I/RE/RI/R/F then:
4.
         count_P/E/I/RE/RI/R/F= count_P/E/I/RE/RI/R/F+1
5.
         Generate time intervals for subsequent possible events
6.
         Set the time intervals of subsequent impossible events to the maximum value
7.
         total_events = total_events+1
8.
       end if
9.
     end while
10.
     The probability of USFC system in each state = count_P/E/I/RE/RI/R/F/total_events
11.
   end
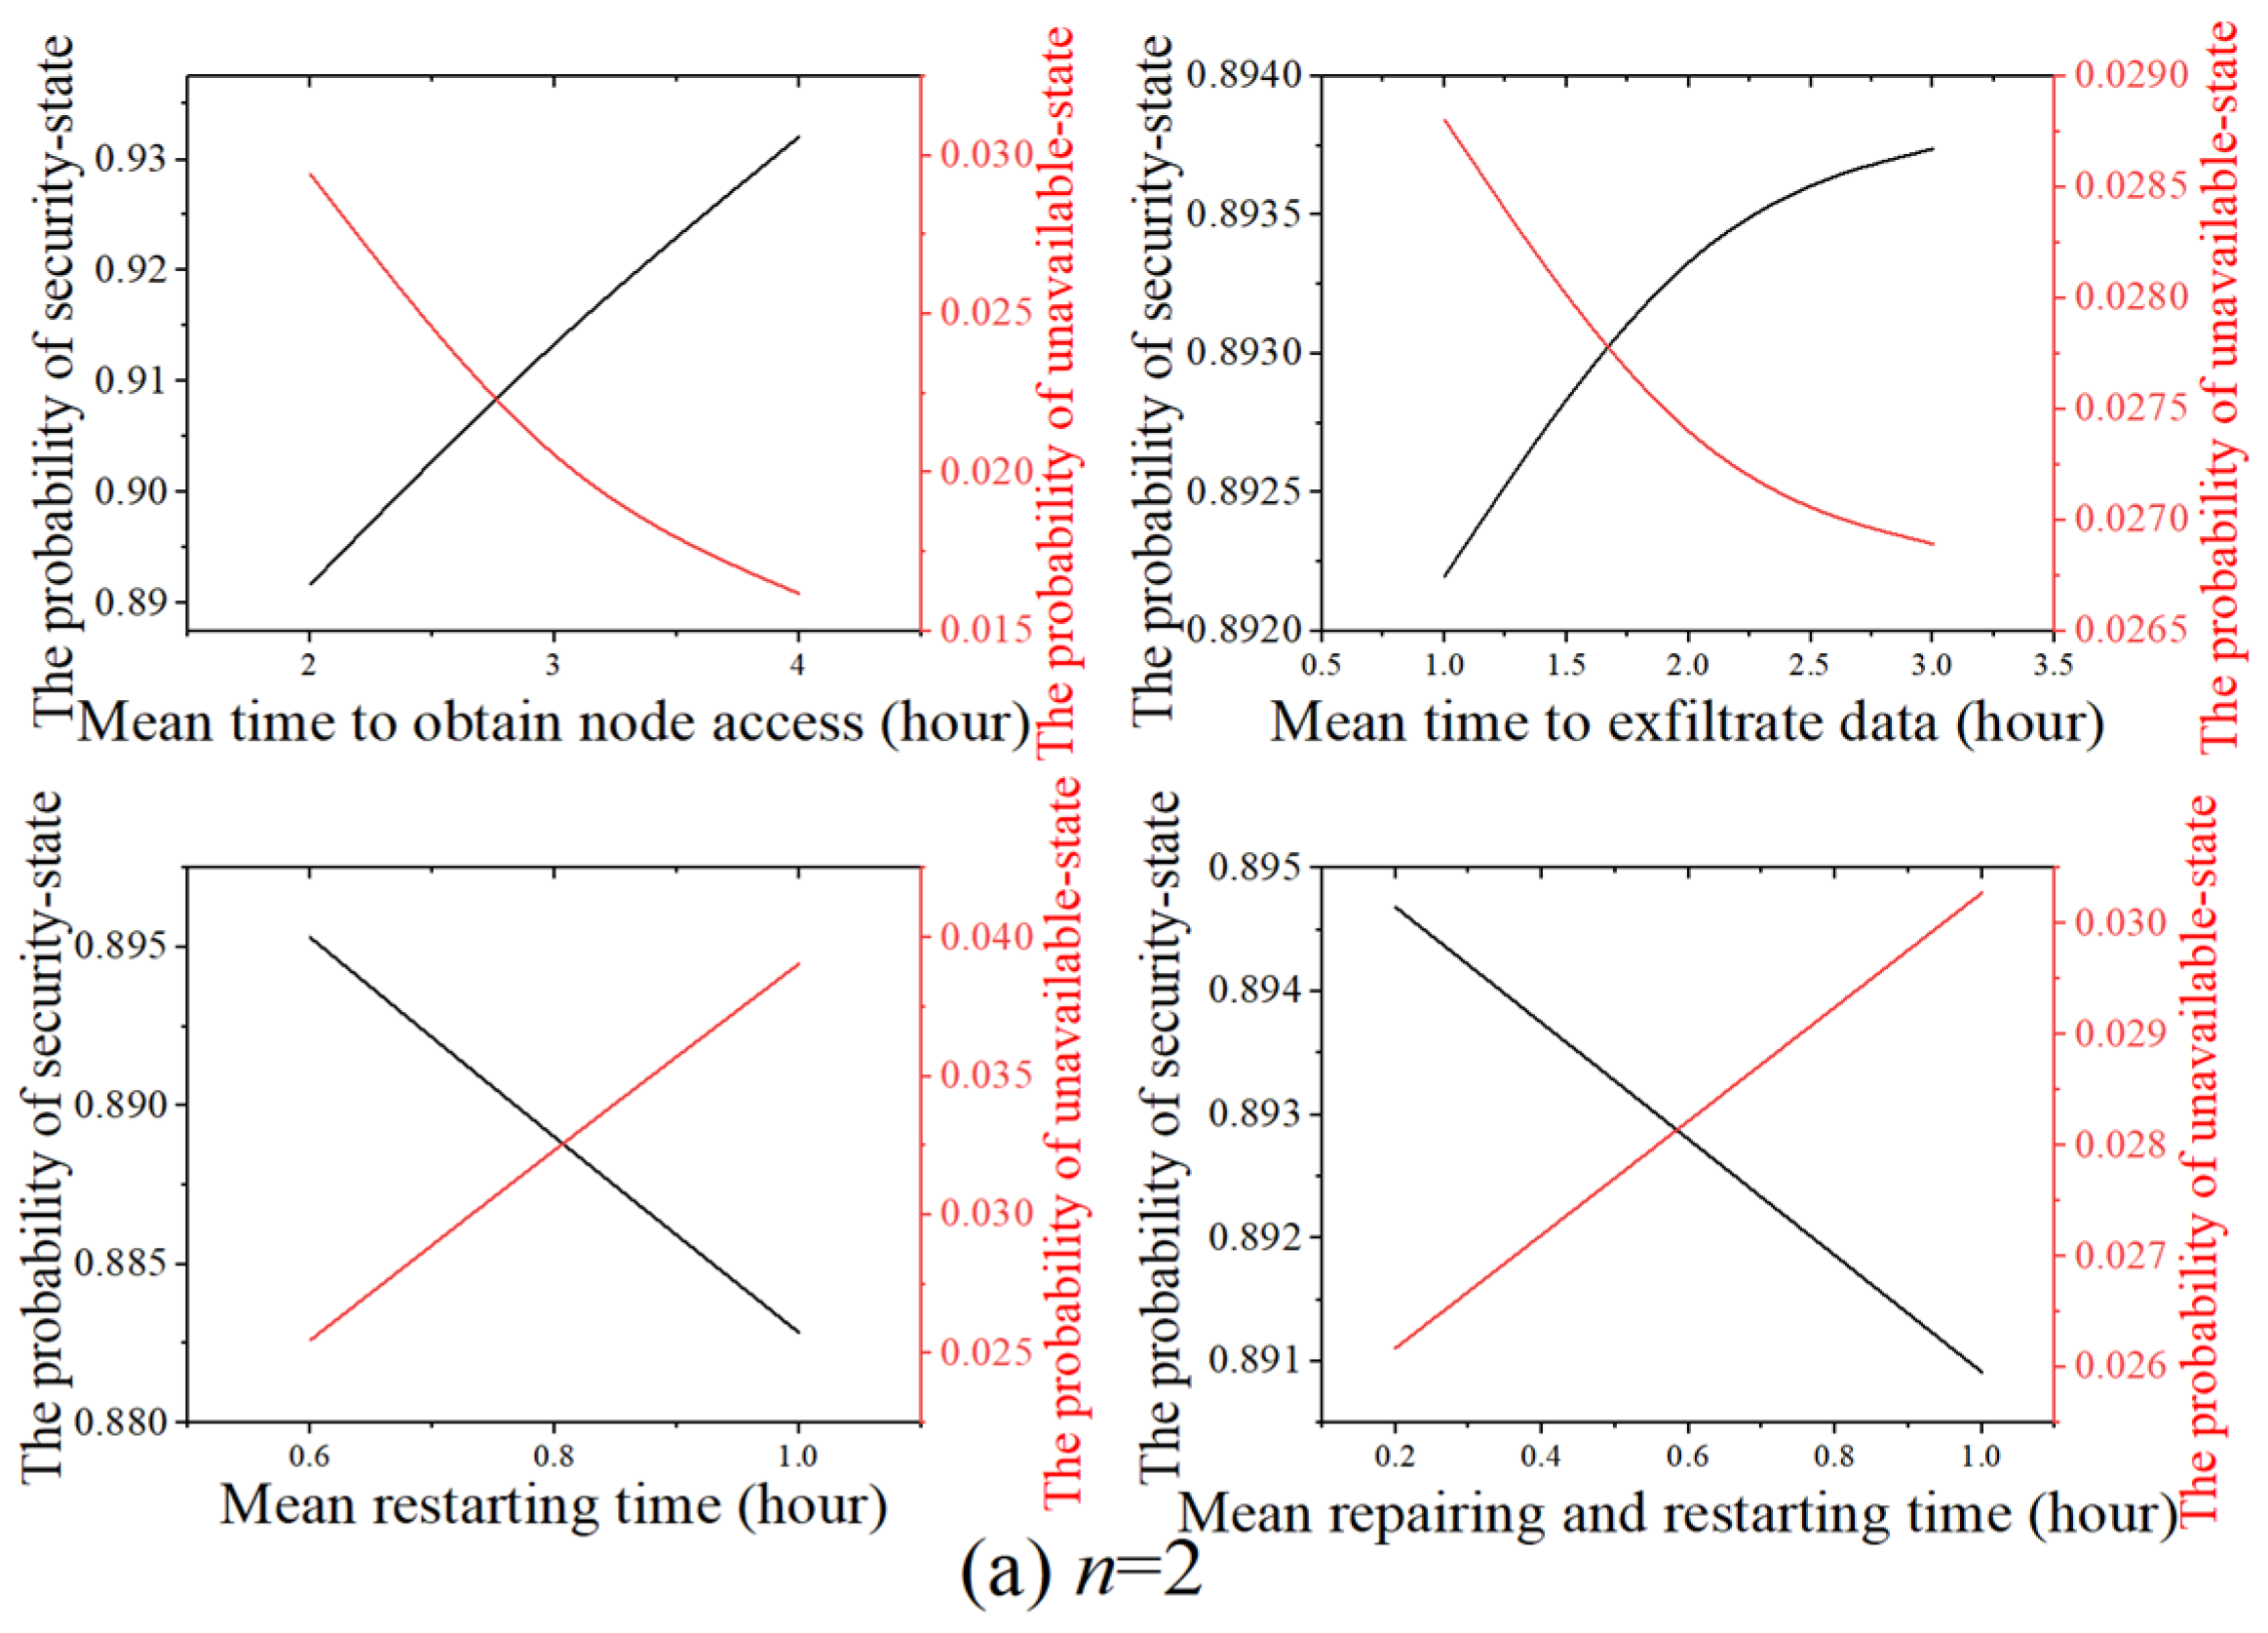
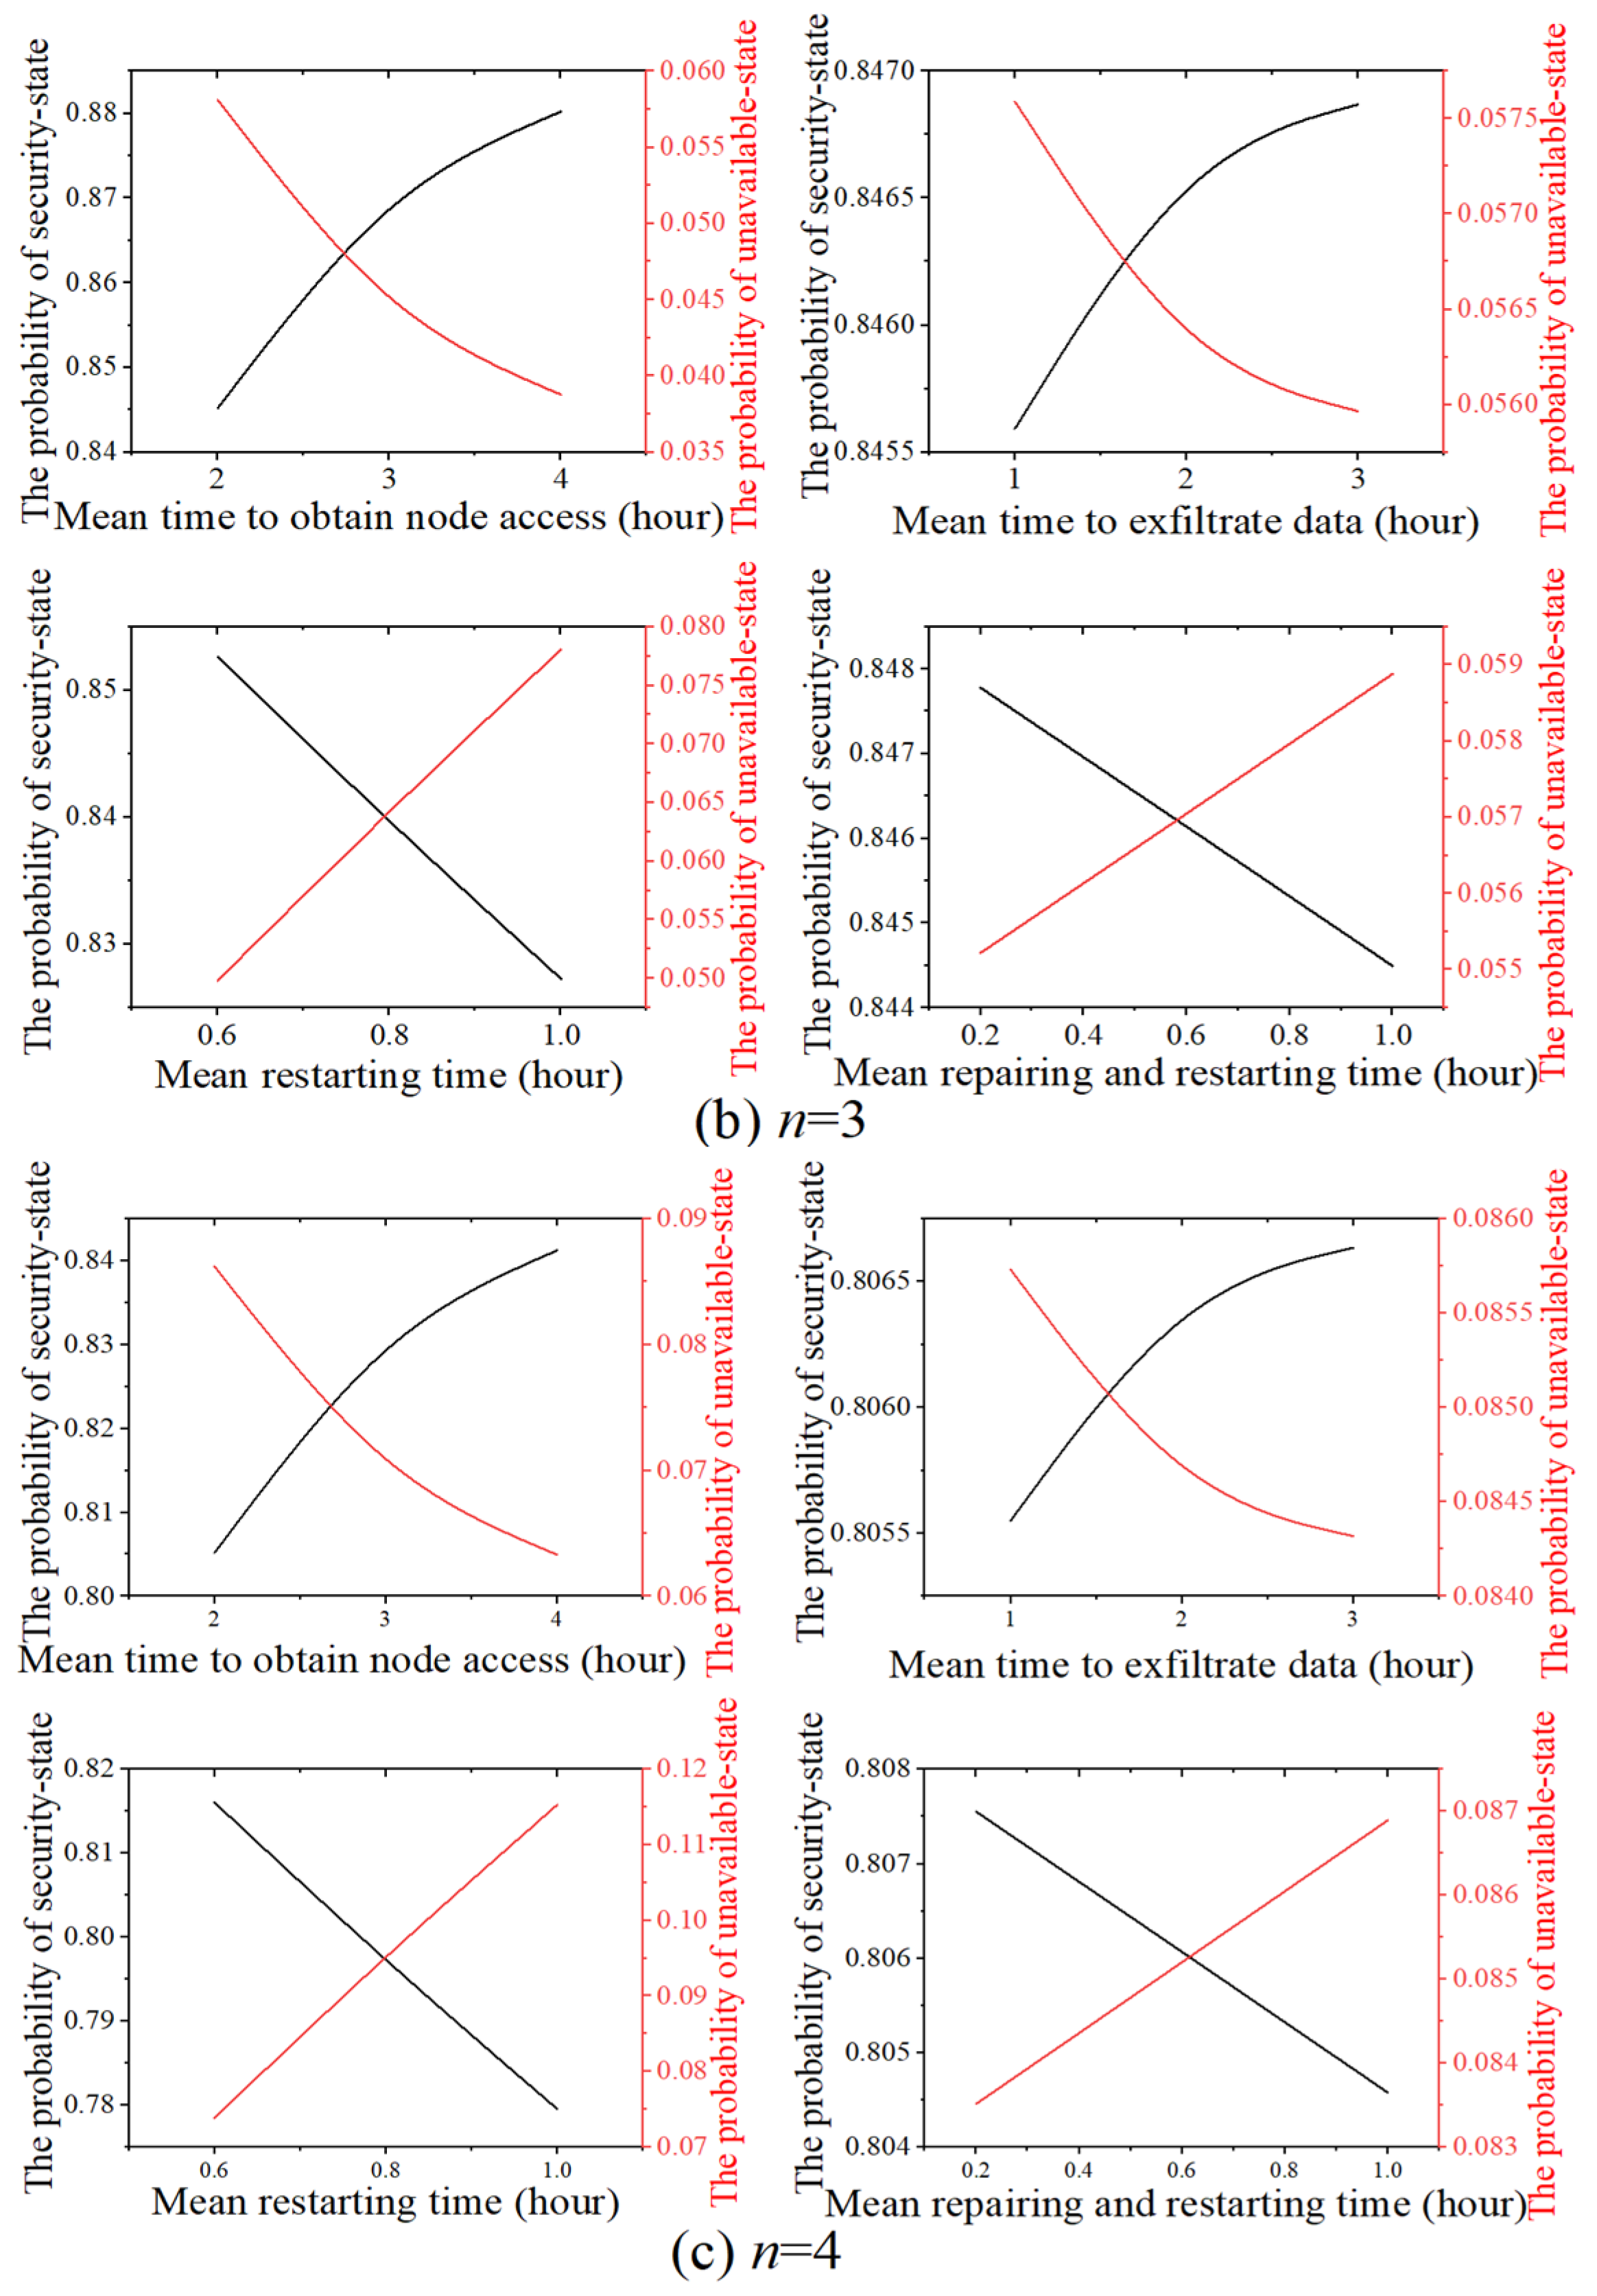
Figure 8 shows the probability of the security state and unavailable state under different parameters for USFC composed of two, three, and four SFs. It can be seen that with the increase in mean time to obtain node access and mean time to exfiltrate data, the probability of the security state increases while the probability of the unavailable state decreases. As the mean restarting time and mean repairing and restarting time increase, the probability of the unavailable state increases while the probability of the security state decreases. This trend holds true regardless of the number of SFs. Furthermore, we observe that under the same time parameters, the probability of the security state decreases as the number of SFs increases, whereas USFCs with more SFs exhibit a higher probability of the unavailable state.
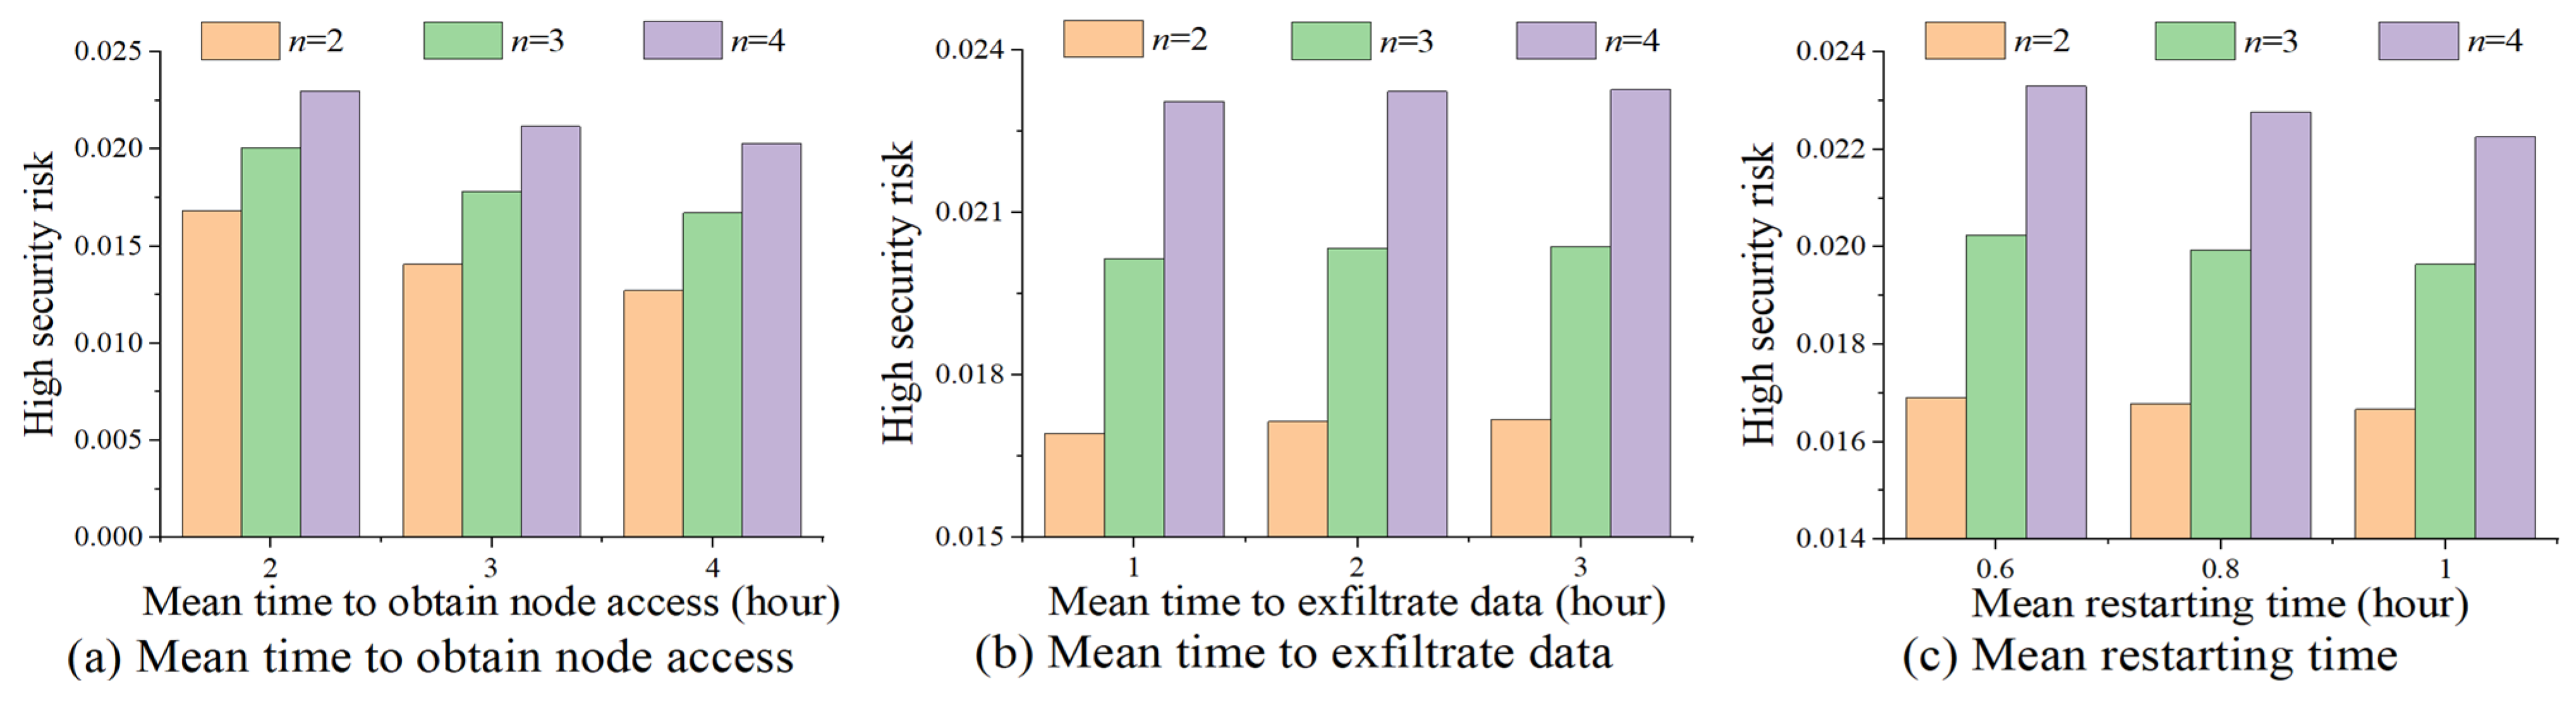
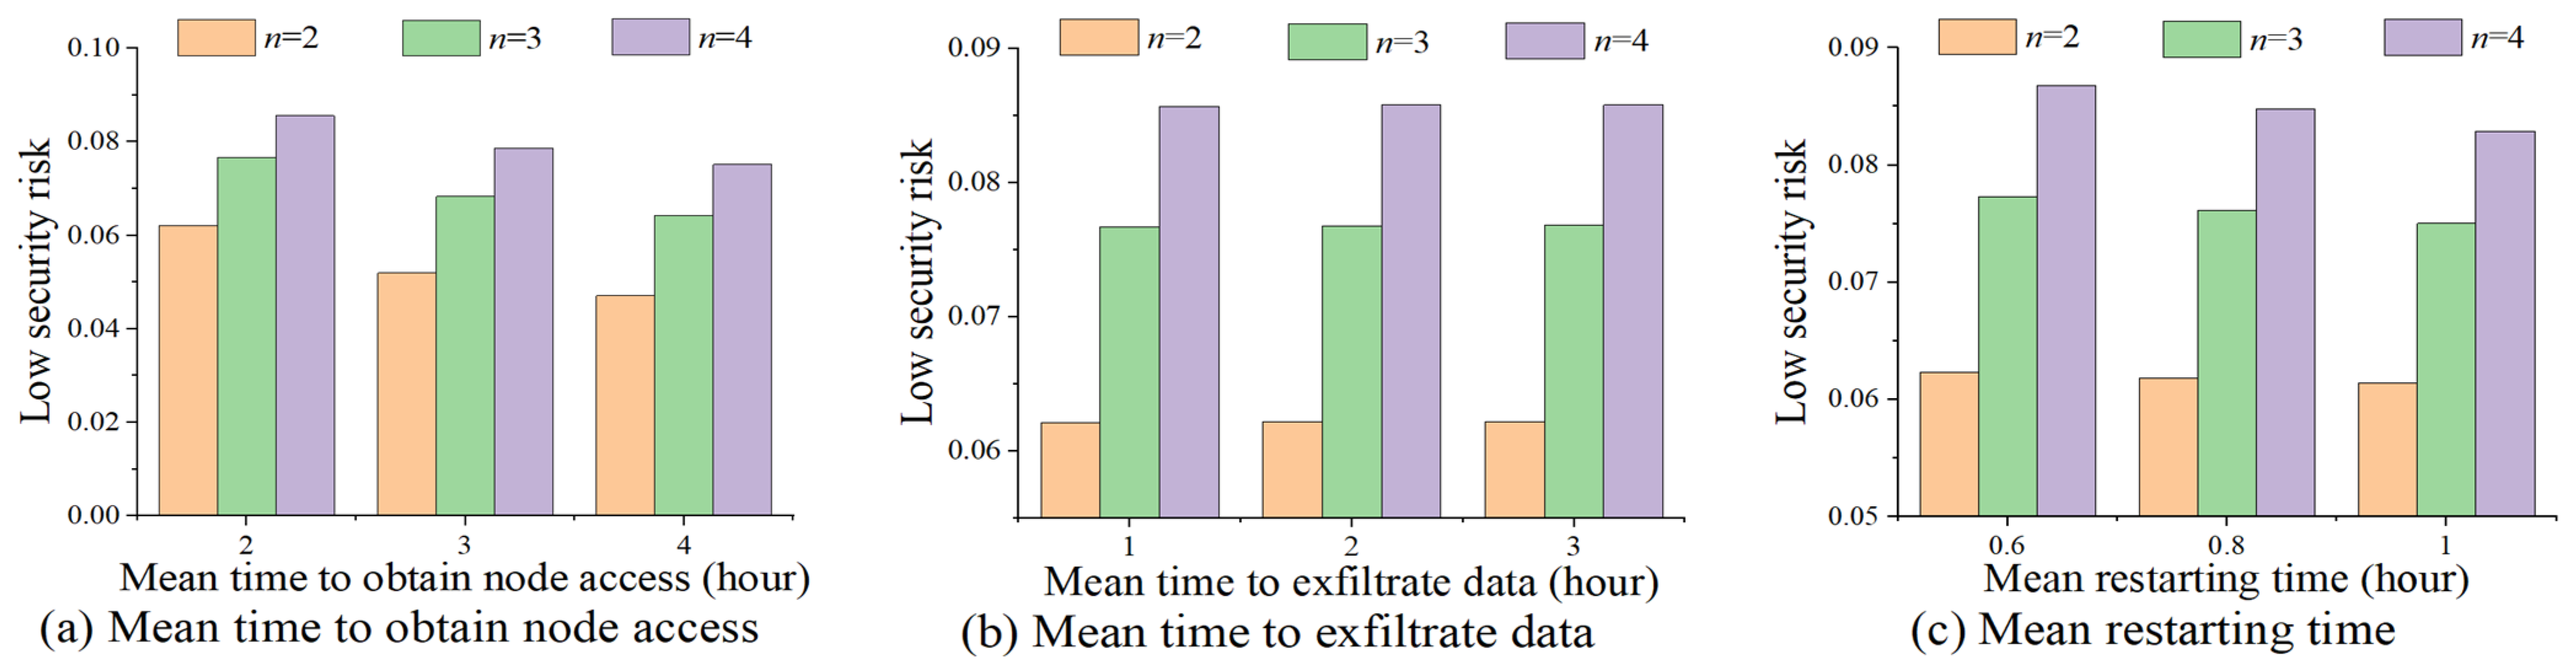
Figure 9 and Figure 10 analyze high security risk and low security risk of the USFC by varying the mean time to obtain node access, mean time to exfiltrate data, and mean restarting time. Under all experimental configurations, both high security risk and low security risk exhibit a monotonic increasing trend as the number of SFs increases from 2 to 4. As the mean time to obtain node access and mean restarting time increase, the USFC security risk shows a decreasing trend. When the mean time to exfiltrate data varies from 1 h to 3 h, both high security risk and low security risk increase under different SF configurations, but the magnitude of this increase is small. A comparison between Figure 9 and Figure 10 reveals that under the same parameter configurations, high security risk is approximately 2.5 to 2.8 times that of low security risk. Compared to time-related parameters, the number of SFs has a more significant impact on both high and low security risks.
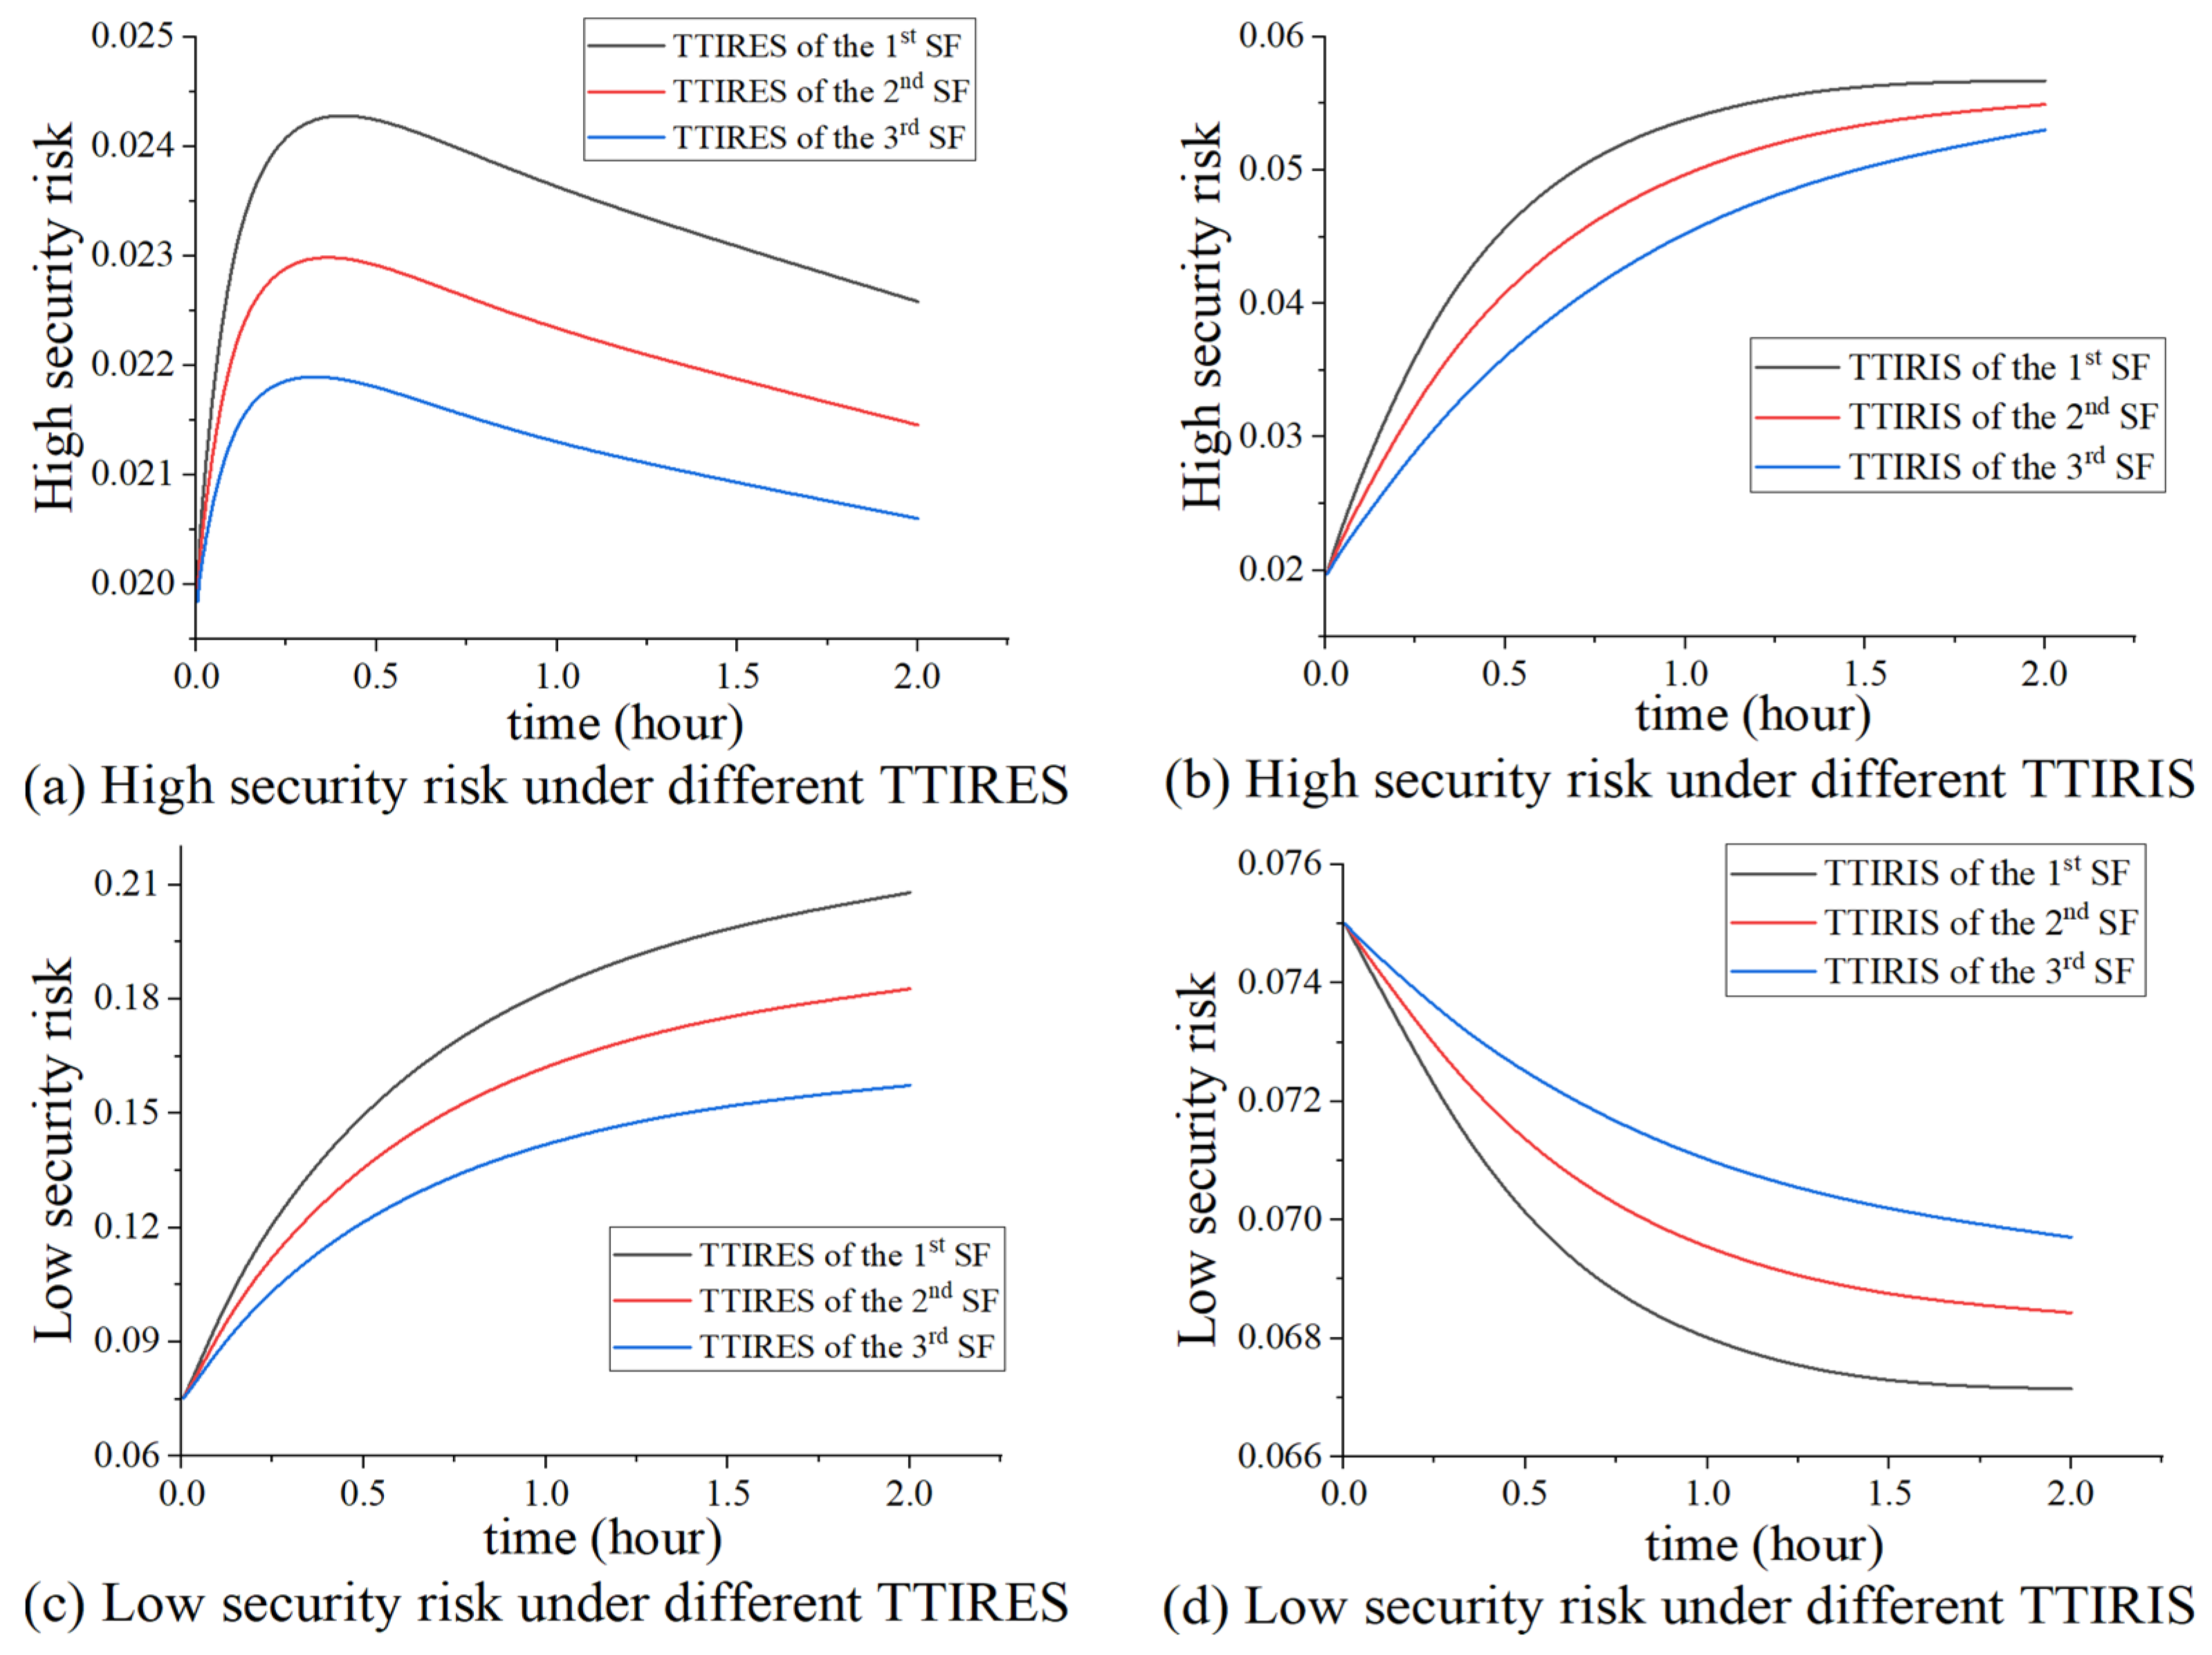
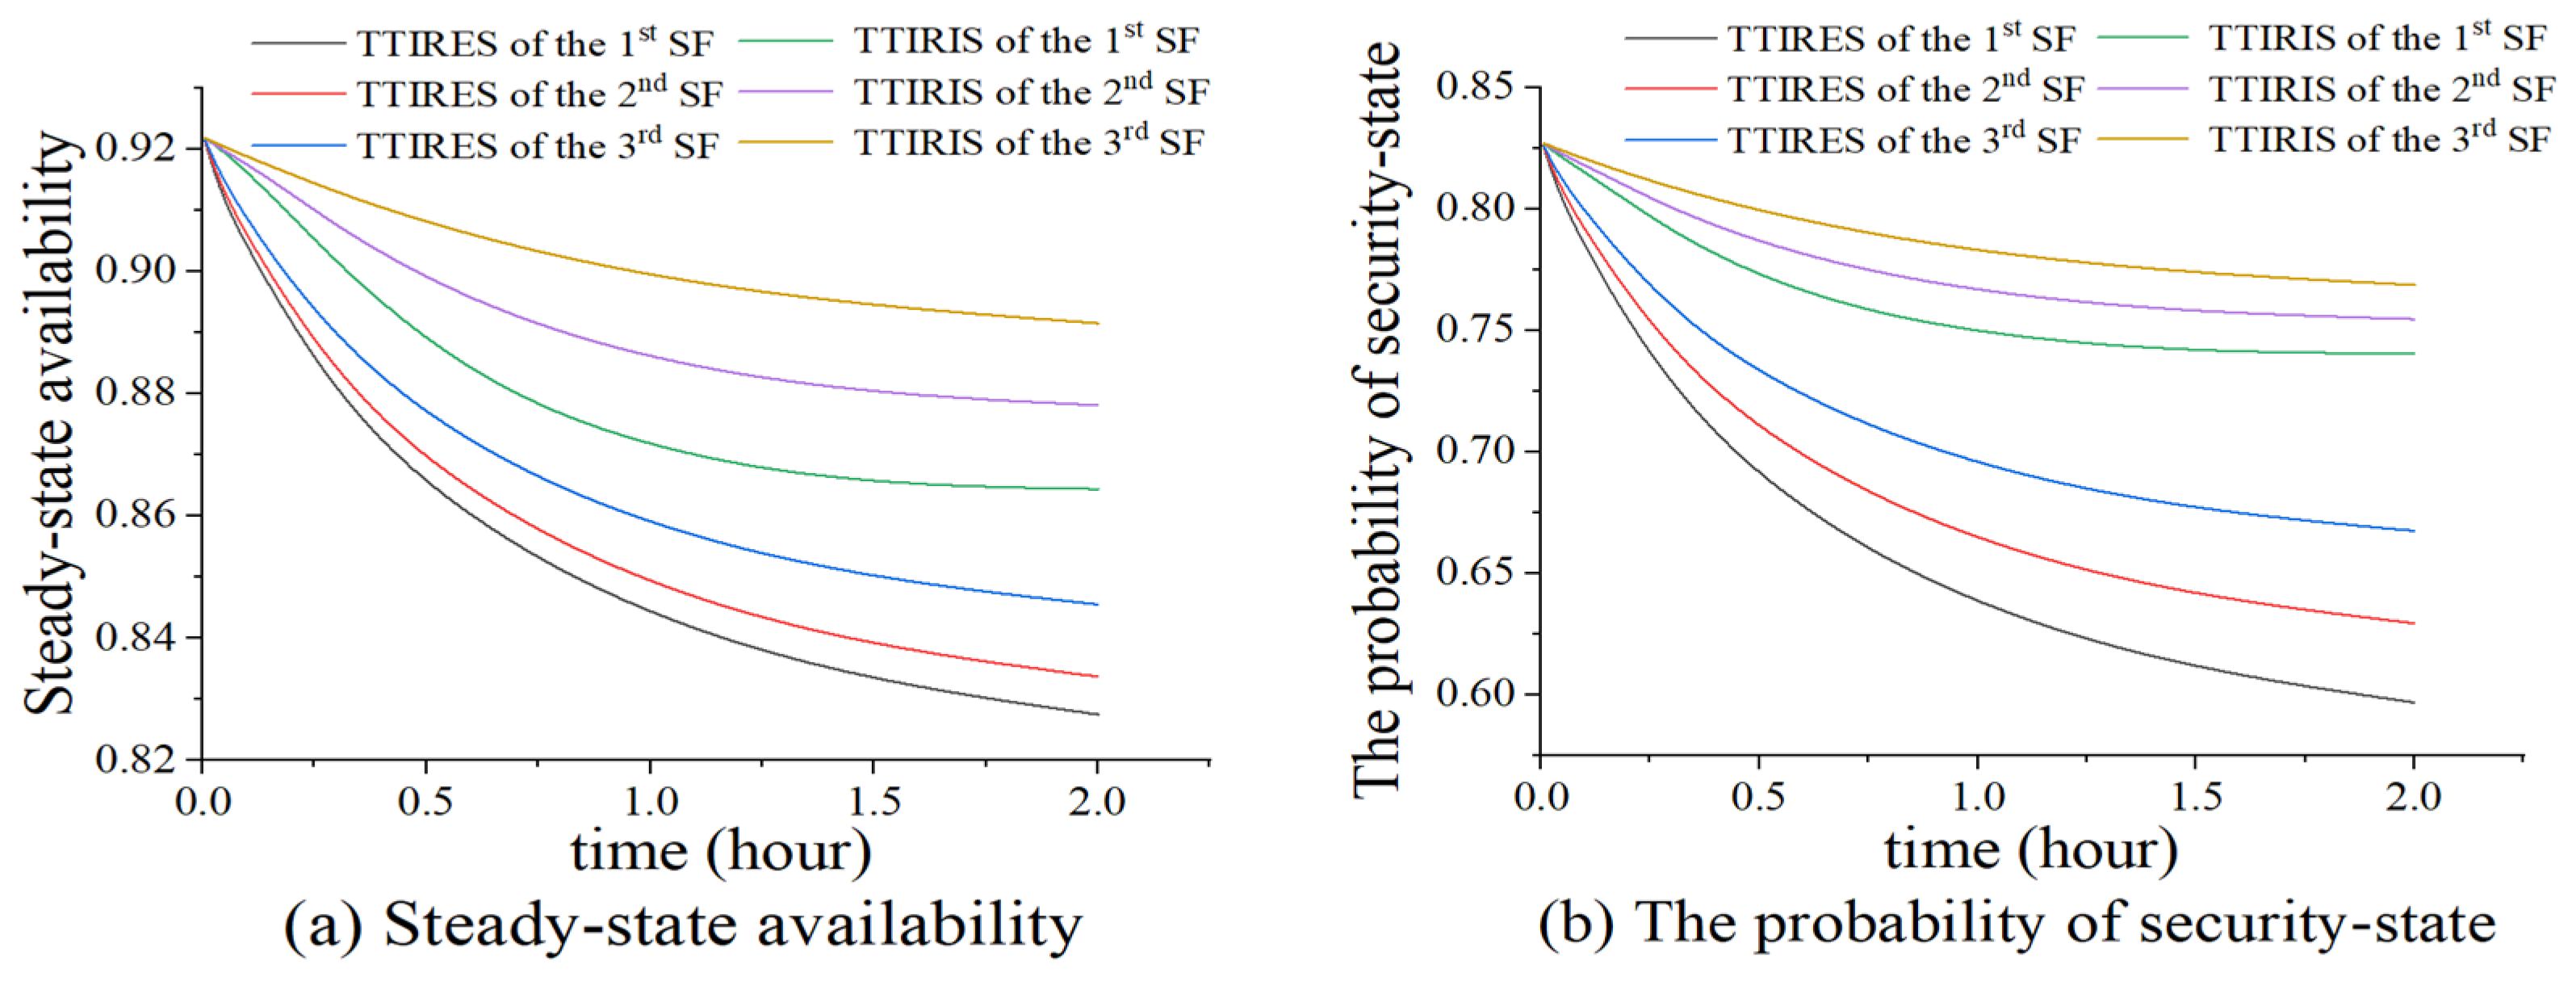
Figure 11 and Figure 12 show the high security risk, low security risk, steady-state availability, and the probability of the security state under different recovery trigger time intervals from the exploitation state (TTIRES) and recovery trigger time intervals from the infection state (TTIRIS) when the number of SFs is 3. As TTIRES increases, high security risk first rises and then declines, exhibiting a distinct peak characteristic. The peak corresponding to the first SF is the highest, while the peak corresponding to the third SF is the lowest. Meanwhile, low security risk shows a monotonically increasing trend. Unlike TTIRES, TTIRIS presents a monotonic impact on security risk. As TTIRIS increases, high security risk increases continuously, whereas low security risk decreases continuously. Moreover, for high security risk, the first SF is most affected, while for low security risk, the third SF is most affected. A comparison between Figure 12a,b reveals that the steady-state availability remains consistently higher than the probability of the security state under the same configurations, and the gap between them gradually widens over time. Meanwhile, we can observe that both the steady-state availability and the probability of the security state exhibit a monotonic decreasing trend over trigger time intervals, though the rates of decline vary significantly. When comparing the impacts of TTIRES and TTIRIS, TTIRES has a more significant effect on the steady-state availability. Both TTIRES and TTIRIS have a greater influence on the probability of the security state than on steady-state availability.
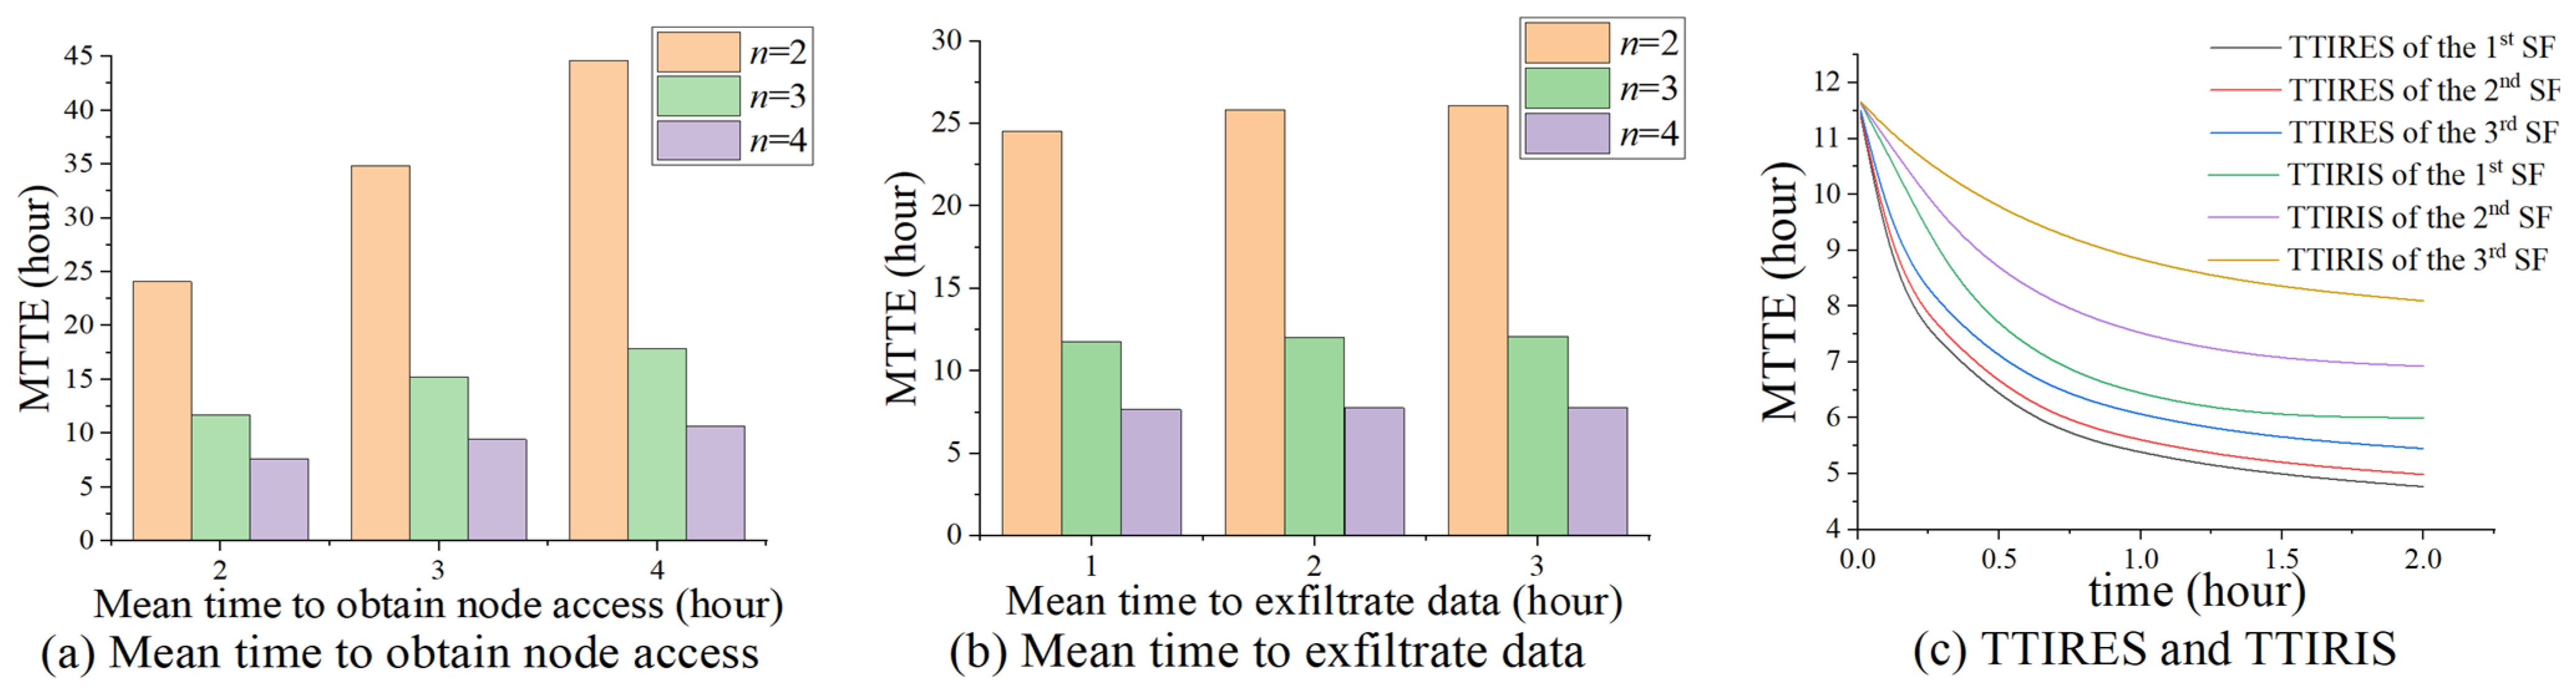
Figure 13 shows the results of MTTE. We first evaluated the MTTE by varying the mean time to obtain node access from 2 h to 4 h and the mean time to exfiltrate data from 1 h to 3 h under different number of SFs. Results are shown in Figure 13a,b. We can observe that with increasing mean time to obtain node access and exfiltrate data, MTTE increases. Under the same parameters, as the number of SFs increases, the MTTE decreases accordingly. Figure 13c shows MTTE under TTIRES and TTIRIS of different SFs. MTTE decreases as the trigger time interval increases. TTIRES and TTIRIS of the first SF result in higher MTTE compared to the second SF and third SF. In real-world scenarios, the decreasing trend of MTTE as the number of SFs increases can be mitigated by deploying security modules such as data encryption and fine-grained permission management and by using automated tools for anomaly detection.

5. Discussion

This work takes the first step toward assessing USFC dependability from availability and security perspectives. By constructing a multidimensional SMP-based model, we quantitatively analyzed the impact of the dynamic interaction between attacker behaviors and USFC system recovery behaviors on USFC dependability. However, there are still some limitations that require further in-depth research, as detailed below.
  • This paper focuses on developing an evaluation model that can be used to capture USFC system behaviors from both attacker attack and system defense perspectives. Based on the developed model, we derive formulas for calculating the availability and security metrics of a USFC system composed of any number of SFs. In practical applications, parameters measured through actual measurements can be substituted into the derived formulas to improve the evaluation results. Furthermore, the quantitative correlations between the parameters reflected in these formulas can directly empower the USFC deployment based on deep reinforcement learning algorithms, achieving synergistic optimization of various metrics while satisfying constraints.
  • In order to ensure that the Markov property is satisfied at each time instance, this paper designs system state representations such as (E,P,P…,P). This design means that the accumulated information of the remaining nodes cannot be saved. In fact, the time it takes for the attacker to gain access to the remaining components is influenced by the time it takes for the attacker to gain access to the first node. Therefore, the assumptions in this paper will introduce errors in the accuracy of the experimental results but will not affect the qualitative results obtained from the dependability metric assessment. In the future, we can capture the system behavior discussed in this paper by establishing a model in which the Markov property only needs to be satisfied at certain points in time.
  • This paper focuses on the theoretical analysis of USFC dependability. However, there is a gap between theoretical analysis and actual measurements. Given the difficulty of deploying a practical platform and the significant time required for conducting experiments, we will evaluate the gap between theoretical analysis and actual measurements in the future. It is worth noting that the theoretical analysis conducted in this paper can supplement the actual measurement results, which help in analyzing the reasons behind the actual measurement results.
  • The USFC dependability analysis model developed in this paper mainly consists of system states and distribution functions of the state transition times, focusing on characterizing the behaviors of the USFC system after an attack and its corresponding defensive actions. In real-world scenarios, high mobility, unstable communication links, and strict energy constraints of actual UAV platforms can cause dynamic changes in state transition times. Therefore, we can incorporate these factors as time-varying parameters into the distribution functions to characterize their dynamic impact on state transition times in the future. Furthermore, the fact that our model supports general distributions allows it to be extended to help analyze the impact of these time-varying parameters on USFC dependability.

6. Conclusions

This paper first constructs a dependability analysis model for USFC composed of any number of SFs, which meticulously characterizes the different stages of an attack and the recovery behavior triggered at each stage. Then, we derive the calculation formulas for availability and security metrics to analyze the dependability of the USFC, providing a theoretical foundation for determining the parameter settings corresponding to optimal dependability. Finally, this paper executes numerous numerical analysis experiments, demonstrating not only the changing trends of various dependability metrics under different parameters but also the parameter combinations for synergistic optimization among metrics. For a single event (such as node infection), regardless of the distribution used to describe its occurrence interval, as long as the expectation is the same, the average number of occurrences per unit time will be the same in the long run. Therefore, the qualitative conclusions obtained from the steady-state dependability metric assessment in this paper are robust to the distribution. In the future, we will first develop a practical platform to validate the proposed approach. Then, we will transform dynamic conditions into time-varying parameters and incorporate them into the distribution functions of state transition times to make the evaluation results more accurate. Finally, we will leverage the proposed dependability assessment model and metric calculation formulas to empower the optimization algorithm, providing support for SFC deployment decisions in UAVs.

Author Contributions

The authors confirm the contribution to the paper as follows: study conception and design: J.B.; data collection: J.B. and X.G.; analysis and interpretation of results: J.B. and X.G.; draft manuscript preparation: J.B., X.G. and C.W.; review: J.B., L.Y. and Z.Y. All authors have read and agreed to the published version of the manuscript.

Funding

This research was funded by the National Natural Science Foundation of China (62402133).

Data Availability Statement

The original contributions presented in this study are included in the article.

Conflicts of Interest

The authors declare no conflicts of interest.

Abbreviations

The following abbreviations are used in this manuscript:
DRLDeep reinforcement learning
MECMobile edge computing
MTTEMean time to exfiltration
QoEQuality of Experience
SFService function
SMPSemi-Markov process
TTIRESRecovery trigger time intervals from the exploitation state
TTIRISRecovery trigger time intervals from the infection state
UAVUnmanned aerial vehicle
USFCService function chain deployed in UAVs

Appendix A

Figure A1. Dependability analysis model for USFC composed of n SFs.
Network 06 00024 g0a1
Figure A2. Dependability analysis model with absorption states for USFC composed of n SFs.
Network 06 00024 g0a2

References

  1. Akbari, M.; Syed, A.; Kennedy, W.S.; Erol-Kantarci, M. Constrained federated learning for AoI-limited SFC in UAV-aided MEC for smart agriculture. IEEE Trans. Mach. Learn. Commun. Netw. 2023, 1, 277–295. [Google Scholar] [CrossRef]
  2. Lu, Y.; Jiang, C.; Tan, L.; Zhang, J.; Zhang, P.; Rong, C. UAV dynamic service function chains deployment based on security considerations: A reinforcement learning method. IEEE Internet Things J. 2024, 11, 39731–39743. [Google Scholar] [CrossRef]
  3. Chai, Y.; Chen, Q.; Cheng, L.; Zeng, X.J. Graph-deep-reinforcement-learning-based joint computation offloading and SFC deployment in UAV-assisted edge computing. IEEE Trans. Cogn. Commun. Netw. 2025, 12, 3763–3776. [Google Scholar] [CrossRef]
  4. Zhang, X.; Zhang, Q.; Chen, J.; Gao, D.; Ye, S.; Zhang, H. Joint optimization of task planning and service function chain scheduling in the UAVs networks. IEEE Trans. Netw. Serv. Manag. 2025, 22, 5887–5899. [Google Scholar] [CrossRef]
  5. Xu, F.; Yao, H.; Ren, J.; Yu, J.; Wang, Z.; Mai, T.; Xu, J.; Jin, C. Cooperative and adaptive service function chain deployment in UAV swarm networks. In Proceedings of the 2025 IEEE 102nd Vehicular Technology Conference (VTC2025-Fall), Chengdu, China, 19–22 October 2025; IEEE: New York, NY, USA, 2026; pp. 1–6. [Google Scholar]
  6. Dimolitsas, I.; Diamanti, M.; Voikos, S.; Papavassiliou, S. Resilient RAN selection and SFC deployment in dependable wireless edge cloud networks. IEEE Trans. Netw. Serv. Manag. 2025, 23, 1312–1328. [Google Scholar] [CrossRef]
  7. Wang, G.; Zhou, S.; Zhang, S.; Niu, Z.; Shen, X. SFC-based service provisioning for reconfigurable space-air-ground integrated networks. IEEE J. Sel. Areas Commun. 2020, 38, 1478–1489. [Google Scholar] [CrossRef]
  8. Jia, Z.; Cao, Y.; He, L.; Wu, Q.; Zhu, Q.; Niyato, D.; Han, Z. Service function chain dynamic scheduling in space-air-ground integrated networks. IEEE Trans. Veh. Technol. 2025, 74, 11235–11248. [Google Scholar] [CrossRef]
  9. Li, J.; Shi, W.; Wu, H.; Zhang, S.; Shen, X. Cost-aware dynamic SFC mapping and scheduling in SDN/NFV-enabled space–air–ground-integrated networks for Internet of Vehicles. IEEE Internet Things J. 2021, 9, 5824–5838. [Google Scholar] [CrossRef]
  10. Wang, Z.; Yao, H.; Mai, T.; Wu, D. Distributed generative reinforcement learning for stable service function chain orchestration in highly dynamic UAV swarm networks. IEEE Trans. Veh. Technol. 2025, 74, 18499–18513. [Google Scholar] [CrossRef]
  11. He, Q.; Liang, J. Online joint optimization of virtual network function deployment and trajectory planning for virtualized service provision in multiple-unmanned-aerial-vehicle mobile-edge networks. Electronics 2024, 13, 938. [Google Scholar] [CrossRef]
  12. Wu, Y.; Jia, Z.; Wu, Q.; Lu, Z. Adaptive QoE-aware SFC orchestration in UAV networks: A deep reinforcement learning approach. IEEE Trans. Netw. Sci. Eng. 2024, 11, 6052–6065. [Google Scholar] [CrossRef]
  13. Wang, X.; Shi, S.; Wu, C. Research on service function chain embedding and migration algorithm for UAV IoT. Drones 2024, 8, 117. [Google Scholar] [CrossRef]
  14. Liang, J.; He, Q. Joint optimization of VNF deployment and UAV trajectory planning in Multi-UAV-enabled mobile edge networks. Comput. Netw. 2025, 262, 111163. [Google Scholar] [CrossRef]
  15. Yang, Y.; Wang, B.; Tian, J.; Lyu, X.; Li, S. An efficient and low-delay SFC recovery method in the space–air–ground integrated aviation information network with integrated UAVs. Drones 2025, 9, 440. [Google Scholar] [CrossRef]
  16. Kharchenko, V.; Kliushnikov, I.; Rucinski, A.; Fesenko, H.; Illiashenko, O. UAV fleet as a dependable service for smart cities: Model-based assessment and application. Smart Cities 2022, 5, 1151–1178. [Google Scholar] [CrossRef]
  17. Kliushnikov, I.; Kharchenko, V.; Fesenko, H.; Zaitseva, E.; Levashenko, V. Reliability models of multi-state UAV-based monitoring systems: Mission efficiency degradation issues. In Proceedings of the 2023 International Conference on Information and Digital Technologies (IDT), Žilina, Slovakia, 20–22 June 2023; IEEE: New York, NY, USA, 2023; pp. 500–509. [Google Scholar]
  18. Silva, F.A.; Fe, I.; Brito, C.; Araujo, G.; Feitosa, L.; Nguyen, T.A.; Jeon, K.; Lee, J.-W.; Min, D.; Choi, E. Aerial computing: Enhancing mobile cloud computing with unmanned aerial vehicles as data bridges-A Markov chain based dependability quantification. ICT Express 2024, 10, 406–411. [Google Scholar] [CrossRef]
  19. Wang, Y.; Chen, J. Towards constraint-based model repair to ensure multiple mission objectives in UAV-enabled MEC systems for disaster response and rescue. In Proceedings of the 2024 IEEE International Conference on Mobility, Operations, Services and Technologies (MOST), Denton, TX, USA, 1–3 May 2024; IEEE: New York, NY, USA, 2024; pp. 275–277. [Google Scholar]
  20. Xu, F.; Wang, J.; Zhang, L.; Xie, Y. Reliability modeling and optimization based on master-supporter unmanned aerial vehicle networks. In Proceedings of the 2025 11th International Symposium on System Security, Safety, and Reliability (ISSSR), Anshun, China, 12–13 April 2025; IEEE: New York, NY, USA, 2025; pp. 123–132. [Google Scholar]
  21. Di Mauro, M.; Longo, M.; Postiglione, F.; Carullo, G.; Tambasco, M. Service function chaining deployed in an NFV environment: An availability modeling. In Proceedings of the 2017 IEEE Conference on Standards for Communications and Networking (CSCN), Helsinki, Finland, 18–20 September 2017; IEEE: New York, NY, USA, 2017; pp. 42–47. [Google Scholar]
  22. Zhao, Y.; Li, Y.; Chao, H.C. Understanding Stochastic Modeling Approach for Container-Based SFC Service Analysis. Hum. Centric Comput. Inf. Sci. 2022, 12, 45. [Google Scholar]
  23. Kharchenko, V.; Ponochovnyi, Y.; Ivanchenko, O.; Fesenko, H.; Illiashenko, O. Combining Markov and semi-Markov modelling for assessing availability and cybersecurity of cloud and IoT systems. Cryptography 2022, 6, 44. [Google Scholar] [CrossRef]
  24. Li, Y.; Li, L.; Bai, J.; Chang, X.; Yao, Y.; Liu, P. Availability and reliability of service function chain: A quantitative evaluation view. Int. J. Comput. Intell. Syst. 2023, 16, 52. [Google Scholar] [CrossRef]
  25. Parmender, V.; Garg, V.; Kumar, A. Stochastic evaluation of a duplicate standby system via semi-Markov processes. J. Reliab. Stantistical Stud. 2025, 18, 473–490. [Google Scholar] [CrossRef]
  26. Bai, L.; Teng, W.; Song, D.; Duan, Q.; Wang, X. Reliability evaluation of systems with performance sharing mechanism under semiMarkov process. Qual. Reliab. Enhineering Int. 2025, 42, 894–910. [Google Scholar] [CrossRef]
  27. Lockheed Martin. Cyber Kill Chain. Available online: https://www.lockheedmartin.com/en-us/capabilities/cyber/cyber-kill-chain.html (accessed on 1 January 2026).
  28. Leversage, D.J.; Byres, E.J. Estimating a system’s mean time-to-compromise. IEEE Secur. Priv. 2008, 6, 52–60. [Google Scholar] [CrossRef]
  29. Machida, F.; Xiang, J.; Tadano, K.; Maeno, Y. Lifetime extension of software execution subject to aging. IEEE Trans. Reliab. 2016, 66, 123–134. [Google Scholar] [CrossRef]
  30. Moraru, V.; Sclifos, A.; Cuzmin, S.; Guţuleac, E. Analysis of cloud biomedical healthcare systems security based on matrix rewriting SRNs with fuzzy parameters. J. Eng. Sci. 2025, 32, 64–74. [Google Scholar] [CrossRef]
  31. Meshkat, L.; Miller, R.L. A systems approach for cybersecurity risk assessment. In Proceedings of the 2022 Annual Reliability and Maintainability Symposium (RAMS), Tucson, AZ, USA, 24–27 January 2022; IEEE: New York, NY, USA, 2022; pp. 1–9. [Google Scholar]
Figure 1. SF behavior in USFC system.
Network 06 00024 g001
Figure 2. Dependability analysis model.
Network 06 00024 g002
Figure 3. Dependability analysis model for USFC composed of two SFs.
Network 06 00024 g003
Figure 4. Dependability analysis model with absorption states for USFC.
Network 06 00024 g004
Figure 5. Flowchart of simulation experiment.
Network 06 00024 g005
Figure 6. Comparison of simulation and numerical analysis experiments.
Network 06 00024 g006
Figure 7. The dependability metrics under different parameters.
Network 06 00024 g007
Figure 8. The probability of security state and unavailable state under different parameters and number of SFs.
Network 06 00024 g008aNetwork 06 00024 g008b
Figure 9. High security risk under different parameters and number of SFs.
Network 06 00024 g009
Figure 10. Low security risk under different parameters and number of SFs.
Network 06 00024 g010
Figure 11. High security risk and low security risk under different trigger time intervals.
Network 06 00024 g011
Figure 12. Steady-state availability and the probability of security state under different trigger time intervals.
Network 06 00024 g012
Figure 13. MTTE under different parameters and number of SFs.
Network 06 00024 g013
Table 1. Comparison of the existing works discussed in Section 2.
Ref.System CharacteristicAttacker BehaviorDefense BehaviorSolution TechniqueMetric
Component
Heterogeneity
Recovery
Trigger Interval
Analytical ModelSimulationAvailabilitySecurity RiskMean time to Compromise
[11,12,13,14]××××××××
[15]×××××
[16]×××××
[17,19]××××××××
[18,25]×××××××
[20]××××××
[21]××××××
[22,24]××××
[23]××××
[26]×××××××
Ours
Table 2. Meaningful system states and their corresponding security risk and availability.
No.System StateDescriptionSecurity RiskAvailability
S 0 ( P 1 , P 2 , P 3 , , P n ) All SFs can run normally.SafeAvailable
S 4 n + 1 ( R 1 , R 2 , R 3 , , R n ) All SFs are restarted.UnsafeUnavailable
S 4 n + 2 ( F 1 , F 2 , F 3 , , F n ) USFC data is compromised.UnsafeUnavailable
S n + i ( E 1 , P 2 , P 3 , , P n ) ( P 1 , P 2 , P 3 , , E n ) One of the SFs in the USFC is in an exploitation state.Loss security riskAvailable
S i RE 1 , P 2 , P 3 , , P n ( P 1 , P 2 , P 3 , , RE n ) One of the SFs in the USFC is preparing to perform recovery from the exploitation state.Loss security riskAvailable
S 3 n + i I 1 , P 2 , P 3 , , P n ( P 1 , P 2 , P 3 , , I n ) One of the SFs in the USFC is in an infection state.High security riskAvailable
S 2 n + i RI 1 , P 2 , P 3 , , P n P 1 , P 2 , P 3 , , RI n One of the SFs in the USFC is preparing to perform recovery from the infection state.High security riskAvailable
Table 3. CDFs of transition times between system states.
VariableDefinitionDistribution
F r h ( t ) The CDF of the time to restart all SFs.General
F f h (t)The CDF of the time to repair and restart all SFs.General
F e p i t , F m p i ( t ) The CDF of the time to infect the ith SF.General
F e r i t , F m r i t , F p r i ( t ) , F q r i ( t ) The CDF of the shortest time to exploit other SFs.Exponential
F e m i ( t ) The CDF of the trigger time interval for the ith SF to recover from the exploitation state.General
F m h i ( t ) The CDF of the recovery time from the exploitation state of the ith SF.General
F p f i ( t ) , F q f i (t)The CDF of the time to exfiltrate the ith SF data.General
F q h i (t)The CDF of the recovery time from the infection state of the ith SF.General
F p q i (t)The CDF of the trigger time interval for the ith SF to recover from the infection state.General
F h e i (t)The CDF of the time to exploit the ith SF.Exponential
Table 4. Definitions of notations used in Equations (23)–(59).
NotationDefinition
F r h ( t ) The CDF of the time to restart the first and second SFs.
F f h (t)The CDF of the time to repair and restart the first and second SFs.
F e p 1 t , F m p 1 t / F e p 2 ( 2 ) , F m p 2 ( t ) The CDF of the time to infect the first/second SF.
F e r 1 t , F m r 1 t , F p r 1 t , F q r 1 t
F e r 2 t , F m r 2 t , F p r 2 ( t ) , F q r 2 ( t )
The CDF of the shortest time to exploit the other SF.
F e m 1 ( t ) / F e m 2 ( t ) The CDF of the trigger time interval for the first/second SF to recover from the exploitation state.
F m h 1 ( t ) / F m h 2 ( t ) The CDF of the recovery time from the exploitation state of the first/second SF.
F p f 1 t , F q f 1 t / F p f 2 t , F q f 2 ( t ) The CDF of the time to exfiltrate the first/second SF data.
F q h 1 ( t ) / F q h 2 ( t ) The CDF of the recovery time from the infection state of the first/second SF.
F p q 1 ( t ) / F p q 2 ( t ) The CDF of the trigger time interval for the first/second SF to recover from the infection state.
F h e 1 ( t ) / F h e 2 ( t ) The CDF of the time to exploit the first/second SF.
Table 5. Default parameter settings.
ParameterMeanDefault ValueDistributionThe Corresponding USFC EventReason
The time to obtain node access2–4 hThe three SFs are 2 h, 2.5 h and 3.3 h, respectively.ExponentialAn attacker gains access to a node in the USFC.Each malicious data packet sent by the attacker is independent, and the conditions for triggering a vulnerability each time are random and do not accumulate any useful information.
The restarting time0.1–1 h0.7 hExponential [29]The node recovers from an attack.The failure rate of the recovery process is usually assumed to be constant.
The repairing and restarting time0.1–1 h0.8 hExponential [29]
The recovery time after node is exploited/infected0.1–1 h0.1 hExponential [29]
The time to exfiltrate data0.5–4 hThe three SFs are 0.8 h, 1.4 h and 3.4 h, respectively.Hypoexponential [30]An attacker steals USFC data.The process of stealing data involves multiple stages.
The time to infect node2–4 hThe three SFs are 3 h, 3.5 h and 4 h, respectively.Weibull [31]An attacker infects node in USFC.During UAV flight, the distance between nodes and link quality changes dynamically, so the infection rate is not constant.
TTIRES/TTIRIS0–2 h10 sHeaviside [29]The time interval between detecting an attack on a node and the actual execution of a recovery operation.In real-world scenarios, the recovery operation is performed according to a preset procedure, and the time interval is fixed.
Disclaimer/Publisher’s Note: The statements, opinions and data contained in all publications are solely those of the individual author(s) and contributor(s) and not of MDPI and/or the editor(s). MDPI and/or the editor(s) disclaim responsibility for any injury to people or property resulting from any ideas, methods, instructions or products referred to in the content.