Article

The Role of Topological Parameters in Wavelength Requirements for Survivable Optical Backbone Networks

1
Department of Electrical and Computer Engineering, Instituto Superior Técnico, Universidade de Lisboa, Avenida Rovisco Pais 1, 1049-001 Lisboa, Portugal
2
Department of Electrical and Computer Engineering, Instituto de Telecomunicações, Instituto Superior Técnico, Universidade de Lisboa, Avenida Rovisco Pais 1, 1049-001 Lisboa, Portugal
*
Author to whom correspondence should be addressed.
Network 2025, 5(2), 18; https://doi.org/10.3390/network5020018
Submission received: 21 April 2025 / Revised: 22 May 2025 / Accepted: 29 May 2025 / Published: 4 June 2025

Abstract

:
As optical networks operate using light-based transmission, assigning wavelengths to the paths taken by traffic demands is a key aspect of their design. This paper revisits the wavelength assignment problem in optical backbone networks, focusing on survivability via 1 + 1 Optical Chanel (OCh) protection, which ensures fault tolerance by duplicating data over two disjoint optical paths. The analysis gives great emphasis to studying the influence of topological parameters on wavelength requirements, with algebraic connectivity being identified as the most significant parameter. The results show that, across a set of 27 real-world networks, the wavelength increment factor, defined as the ratio between the number of wavelengths required with protection and without protection, ranges from 1.49 to 3.07, with a mean value of 2.26. Using synthetic data, formulas were derived to estimate this factor from network parameters, resulting in a mean relative error of 12.7% and errors below 15% in 70% of the real-world cases studied.

1. Introduction

Today’s information societies depend deeply on optical networks to handle massive flows of data between data centers, cloud computing platforms, telecom networks, and end users, ensuring fast and reliable information exchange. Optical networks are communication infrastructures that utilize light for transmitting, processing, and switching information, relying on optical fibers as the transmission medium [1]. Since the proposal of using optical fibers for communications purposes by Charles Kao in 1966 [2], the evolution of optical networks has been marked by many breakthroughs [3]. Among the most significant ones is the development of WDM (wavelength division multiplexing) technology.
WDM can significantly increase the capacity of optical transmission by simultaneously transmitting multiple optical signals, often referred to as optical channels, through a single optical fiber, with each channel utilizing its own wavelength. Therefore, the problem of designing optical networks is markedly different from designing electrical networks in the sense that it involves, besides finding a path for each traffic demand (routing), also assigning a wavelength to that path (wavelength assignment). The routing and wavelength assignment (RWA) problem is a well-studied topic in the field of optical networking. This problem can be formulated using integer linear programming (ILP) with the objective of minimizing the number of wavelengths, leading to optimal solutions [4]. However, since the problem is NP-complete (nondeterministic polynomial-time complete), it requires intensive computation, limiting its applicability to small and medium-sized networks. For large networks, one must rely on suboptimal heuristics to speed up the calculations. (see [5] for an overview). More recently, machine learning techniques have also been explored to obtain near-optimal RWA solutions with a significant reduction in computation time [6].
The RWA problem can be static or dynamic [5]. In static RWA, all traffic demands are known in advance, and the goal is to minimize the number of wavelengths needed to route all of them. All decisions are made offline, before any traffic is actually sent. In dynamic RWA, traffic demands arrive over time in a random way. The number of available wavelengths is fixed, and the goal is to route the demands while minimizing the blocking of requests. Decisions are made online, as the demands arrive. A drawback of dynamic RWA is that it requires a very advanced control plane, such as SDN (Software-Defined Networking), which increases the complexity and sophistication of the network.
Another closely related topic that is paramount for network designers is understanding how the number of required wavelengths, also denoted wavelength usage, to accommodate a given traffic demand relates to parameters associated with network’s physical topology and identifying general trends in this relationship. This problem has been the focus of many studies. To the best of our knowledge [7,8] were the first works to study that interdependency, considering topological parameters such as node degree and its variance, physical connectivity, internodal distance, and the number of spanning trees, using statistical analysis that required the generation of large number of random networks. Furthermore, ref. [9] adds algebraic connectivity to the modelling and shows that this parameter provides the most accurate estimate of wavelength usage among those studied by the authors. Interestingly, ref. [10] also showed that algebraic connectivity is strongly correlated with other network metrics like capacity and robustness. While these studies rely on general random networks, ref. [11] addresses the wavelength usage problem but focuses on other networks models, such as small-world and scale-free networks, considering parameters like the average shortest paths length.
Survivability has become a critical feature of modern optical networks, particularly in backbone segments, due to the huge volume of traffic they handle. This involves a set of techniques that enables networks to remain fully operational during outages, typically caused by link failures due to fiber cuts or equipment failures at the network nodes. To ensure survivability, networks rely on two main approaches: protection and restoration techniques [12]. The former uses deployed backup resources (e.g., optical channels, wavelengths, etc.) that are automatically activated when a failure occurs, while the latter dynamically discovers and allocates resources after a failure is detected.
A commonly used protection technique operating in the optical domain is known as 1 + 1 Optical Channel (OCh) protection [13]. In this scheme, the source node transmits two identical optical signals over two physically disjoint optical channels. As a consequence, both signals must use the same wavelength, which increases overall wavelength consumption and adds complexity to the wavelength assignment strategies.
An important question to address is how survivability affects wavelength requirements and how it depends on topological parameters. As far as we know, this problem has received limited attention in literature. For instance, in [8,14], the authors analyzed the impact of a link restoration technique on wavelength requirements using lower bounds and heuristics, respectively. Similarly, ref. [15] investigated the issue using ILP (integer linear programming) and heuristic formulations to assess dedicated and shared path protection, as well as shared link protection. However, none of these studies have considered the influence of topological parameters in their analysis.
In this paper, we revisit the problem of wavelength assignment in optical backbone networks to understand the dependency of wavelength requirements on topological parameters, while also considering survivability features. Although great emphasis has been placed on algebraic connectivity, additional topological parameters not previously considered by other authors, such as spectral radius and robustness, are also examined. Furthermore, by relying on regression techniques, simple formulas are derived to predict wavelength requirements and the wavelength increment factor, assuming a 1 + 1 OCh protection scheme, with this factor being defined as the ratio between the number of wavelengths required with protection to the number without protection.
The paper is organized in five sections. Section 2 describes the model used to characterize the optical network, defines the topological parameters considered in the study, and defines the protection strategy adopted in this work. In Section 3, we describe the algorithms employed, with emphasis on the problem of computing disjoint node paths. Section 4 presents the methodologies for generating synthetic data sets and provides a discussion of the results, also focusing on the derivation of formulas to estimate wavelength requirements. Finally, Section 5 summarizes and concludes the paper.

2. Network Aspects and Survivability

2.1. Network and Topological Parameters Characterization

Transparency has been a widely accepted assumption in the design of optical networks, particularly in backbone segments, since the advent of optical amplifiers and WDM technologies [16]. In line with this our analysis, assumes that optical networks are transparent, meaning that optical signals are transmitted from the source to the destination without optoelectronic conversion, maintaining their optical nature throughout the entire path. Therefore, in these networks, all node functionalities (such as multiplexing, switching, etc.) take place in the optical domain, and the node structure is based on reconfigurable optical add-drop multiplexers (ROADMs) [1]. A ROADM is responsible not only for locally adding and dropping optical channels but also for enabling optical bypass by switching optical channels from incoming to outgoing optical links. An optical link represents a physical interconnection between two nodes and is implemented using a pair optical fibers and optical amplifiers adequately spaced to compensate for the fiber losses. Each optical fiber supports WDM signals, meaning it carries a specific number of optical channels, with each channel being characterized by its own wavelength. As a result, the number of optical channels is determined by the number of wavelengths N λ per link.
In this work, we also assume that optical networks are static, which is a common assumption in optical backbone networks. In such networks, optical channels are pre-established offline according to a fixed traffic, matrix and remain unchanged during operation.
The physical topology of an optical network can be described as an undirected graph G V , E , where V = { v 1 ,   ,   v N } represents the set of ROADM nodes and E = { e 1 ,   ,   e K } represents the set of optical links, with N = V being the number of nodes and K = E the number of links (also called edges). Another way to describe the physical topology is through the adjacency matrix. This is an N × N square matrix A = a i , j , where each element a i , j = 1 if there is a link between v i and v j , and 0 otherwise. The degree matrix is also fundamental for network characterization, as it provides additional structural information. It is an N × N diagonal matrix D G = d i , j , where each element d i , j is equal to the node degree δ i = j a i , j if i = j , and 0 otherwise. Note that the node degree δ i of node   v i corresponds to the number of links incident to v i .
Besides N and K , other topological parameters can be used to properly characterize a network. These topological parameters can be classified into spectral and non-spectral categories [9]. The spectral parameters are the eigenvalues of the graph Laplacian matrix, defined as L = D G A . In this work, we consider two spectral parameters: the algebraic connectivity a G and the spectral radius r G . The former corresponds to the second smallest eigenvalue of matrix L and measures how well the graph is connected, while the latter corresponds to the largest eigenvalue of matrix L and quantifies how node degree imbalance is structured across the network.
The non-spectral parameters considered in this work include the average node degree < δ > , the average number of hops per demand < h > and the robustness R G . The first parameter is defined as
< δ > = 1 N i = 1 N δ i .
The number of hops per demand corresponds to the number of links traversed by a given traffic demand, after it has been mapped to a path using a specific routing strategy. Assuming a shortest path routing strategy, the hop matrix H = h i , j is an N × N matrix, where all diagonal elements are zero, and each elements h i , j denotes the minimum number of hops traversed by the traffic demand between nodes v i , and v j . Considering a full-mesh logical topology the average minimum number of hops per demand is given by
< h > = 2 N ( N 1 ) i = i N 1 j = i + 1 N h i , j .
A full-mesh logical topology means that each node is logically connected to every other node in the network. This corresponds to a uniform traffic pattern, where there is one traffic demand between each pair nodes, a general assumption in this work.
The starting point for evaluating network robustness is computing the redundancy matrix R = r i , j . This is a N × N matrix, where each element is defined as the node disjoint pairwise connectivity and corresponds to the maximum number of nodes disjoint paths between nodes v i , and v j [17]. This value is crucial for designing protection paths in optical networks [18], a topic that will be addressed in the following subsection. The robustness is defined as the average node-disjoint pairwise connectivity and is given by [10]
R G = < r > = 1 N ( N 1 ) i = i N j = 1 N r i , j .
To perform statistical analysis, large data sets are essential. One effective way of obtaining such data sets is to generate numerous network topologies, which can be done using random graphs designed to adequately describe the characteristics of real-world networks, as explained in Section 4.1.

2.2. Network Survivability

Due to the massive volumes of data transported by optical networks, ensuring network survivability is paramount. To achieve this, these networks must implement mechanisms to recover traffic in the event of failures. Such failures can occur at either the node or link level. The former are primarily caused by equipment failures, particularly transponders (see [1] for an explanation of their role), while the latter are mainly due to fiber cuts. To guarantee resilience against failures in the working transponder (i.e., the one used to support service traffic), redundant transponders can be used. These transponders can be provided in either a dedicated or shared manner [14]. In the dedicated solution, each working transponder is duplicated, while in the shared solution, a single redundant transponder can protect multiple working transponders.
To protect against link failures, additional backup resources need to be provided. Similarly, these resources can also be dedicated or shared. In the first case, each working channel has a fully reserved backup channel, while in the second, multiple working channels share the same backup resources. Furthermore, dedicated protection can be applied at the path, or link level. In the first case, the entire end-to-end path (or connection) between the source and destination nodes is protected, while in the second case, only individual links in the path are considered. A requirement of dedicated path protection is that the working and the backup path must be node- and link-disjoint. Although shared protection schemes are more efficient in terms of resource utilization, they are not advisable in the context of backbone segments, as they involve complex coordination and may not guarantee the stringent recovery time requirements expected in these segments.
A commonly used path-dedicated protection technique operating in optical domain is designated as 1 + 1 OCh protection [13]. In this scheme, the source node transmits identical signals over two physically disjoint optical channels (working and backup), and the destination node receives both signals, selecting the one with the highest quality. This scheme is operationally simple and ensures fast protection switching because the decision is local and does not require signaling between nodes. However, since the working and backup paths use the same wavelength, this increases the complexity of wavelength assignment strategies and overall wavelength consumption. The determination of the additional wavelength consumption inherent in this scheme will be a central topic of this work.

3. Routing and Wavelength Assignment

The wavelength requirements in a network depends on both the physical topology, described by the adjacency matrix A , and the logical topology which defines the profile of traffic demands between nodes. This profile is represented by a traffic matrix, where each entry specified the demand between a pair of nodes. As noted previously, in this work we assume a uniform traffic profile where each pair of nodes has one unit of traffic demand, corresponding to a full-mesh logical topology.
For each traffic demand between a pair of nodes, a path must be found in the physical topology, and a wavelength must be assigned to it. This process is known as routing and wavelength assignment (RWA) problem. Since multiple paths exist between each pair of nodes, the routing objective is to determine the shortest path using a heuristic such as Dijkstra’s algorithm. Furthermore, in the presence of 1 + 1 OCh protection, two node-disjoint paths must be computed. Finding such paths is a well-known problem in graph theory. A common approach to deal with this problem is Suurballe’s algorithm [19] or Bhandari’s algorithm [18]. However, these algorithms compute only two shortest node-disjoint paths, and, therefore, cannot be applied to determine the robustness parameter R G , which requires computing the maximum number of node-disjoint paths between each pair of nodes. To address this limitation, this work uses a solution based on the Ford-Fulkerson algorithm, transforming the node-disjoint path problem into a maximum-flow problem [20], and subsequently using Depth-First Search (DFS) to extract the required paths. This solution is implemented using Algorithm 1.
Algorithm 1: Node disjoint paths
Input: network undirected graph: G V , E ;   s : node source; d : destination node
Output: all node-disjoint paths from s to d
1:Make a copy G of the network graph G. Initialize N F ,with n f i , j = 0 , ( i , j ) E
2:Convert the graph G into a directed graph by replacing each undirected edge with two directed edges, one in each direction
3:for each node v s , d in G V , E do
4: Replace v with two nodes   v i n and v o u t
5: Assign all incoming edges of v to v i n and all outgoing edges of v to v o u t
6: A directed edge from v i n to v o u t is added with unit capacity
7:end for
8:Execute the Ford-Fulkerson algorithm on G to find the maximum flow from s to d
9:Save the max-flow value in m a x F l o w
10:for  i = 1   t o   m a x F l o w  do
11: Perform DFS on the residual graph, considering only edges with flow equal to 1
When d is reached, retrieve the path and decrement the flow of all edges in it by 1
Merge nodes v i n and v o u t back into the original node v
12:
13
14end for
The wavelength assignment problem consists of assigning one wavelength to each path associated with a traffic demand, subject to two constraints:(i) each path must use the same wavelength on all links along its route from the source to the destination (wavelength continuity constraint); (ii) different paths that traverse the same link must be assigned different wavelengths (wavelength conflict constraint). This problem can be solved using ILP techniques, graph coloring approaches, or heuristics (e.g., first fit, most used, etc.) [5]. ILP techniques provide exact results but are computationally intensive, making them impractical for large networks. Graph coloring is faster than ILP but does not guarantee optimal results. Finally, heuristics are the fastest methods but only provide approximate solutions. As a compromise, between accuracy and computational complexity we used graph coloring in our work.
4. Results and Discussion

4.1. Synthetic Topology Dataset Generation

To investigate the dependence of wavelength usage on network topological parameters and conduct statistical analysis, it is necessary to generate a large set of synthetic network topologies. This can be achieved using random graphs designed to model the characteristics of real-world optical networks. In this work, we use the k -neighbors model described in [9] for this purpose. In a simplified way, this model works by randomly placing N network nodes in a 2D space with area A k and minimum distance d m i m between them. The nodes are then interconnecting with their nearest neighbors based on Euclidian distance. First, each node connects to k 0 nearest neighbors to form an initial graph. A minimum spanning tree is then created to ensure all nodes are connected. Next, the model continues to add links randomly between the k -nearest neighbors of each node until the maximum average node degree < δ > m a x is reached. During the interconnection process, it must also be ensured that the resulting graph is biconnected to provide a minimum degree of resilience to failures. Specifically, the networks were generated in a 2D space with area A k = N × 10 4   k m 2 , with N ranging from 7 to 50, and < δ > varying from 2 to 5. The k -neighbors model had the following parameters: k 0   = 4 and k = 8, and d m i m was equal to 25 km.

4.2. Wavelength Requirements Analyis

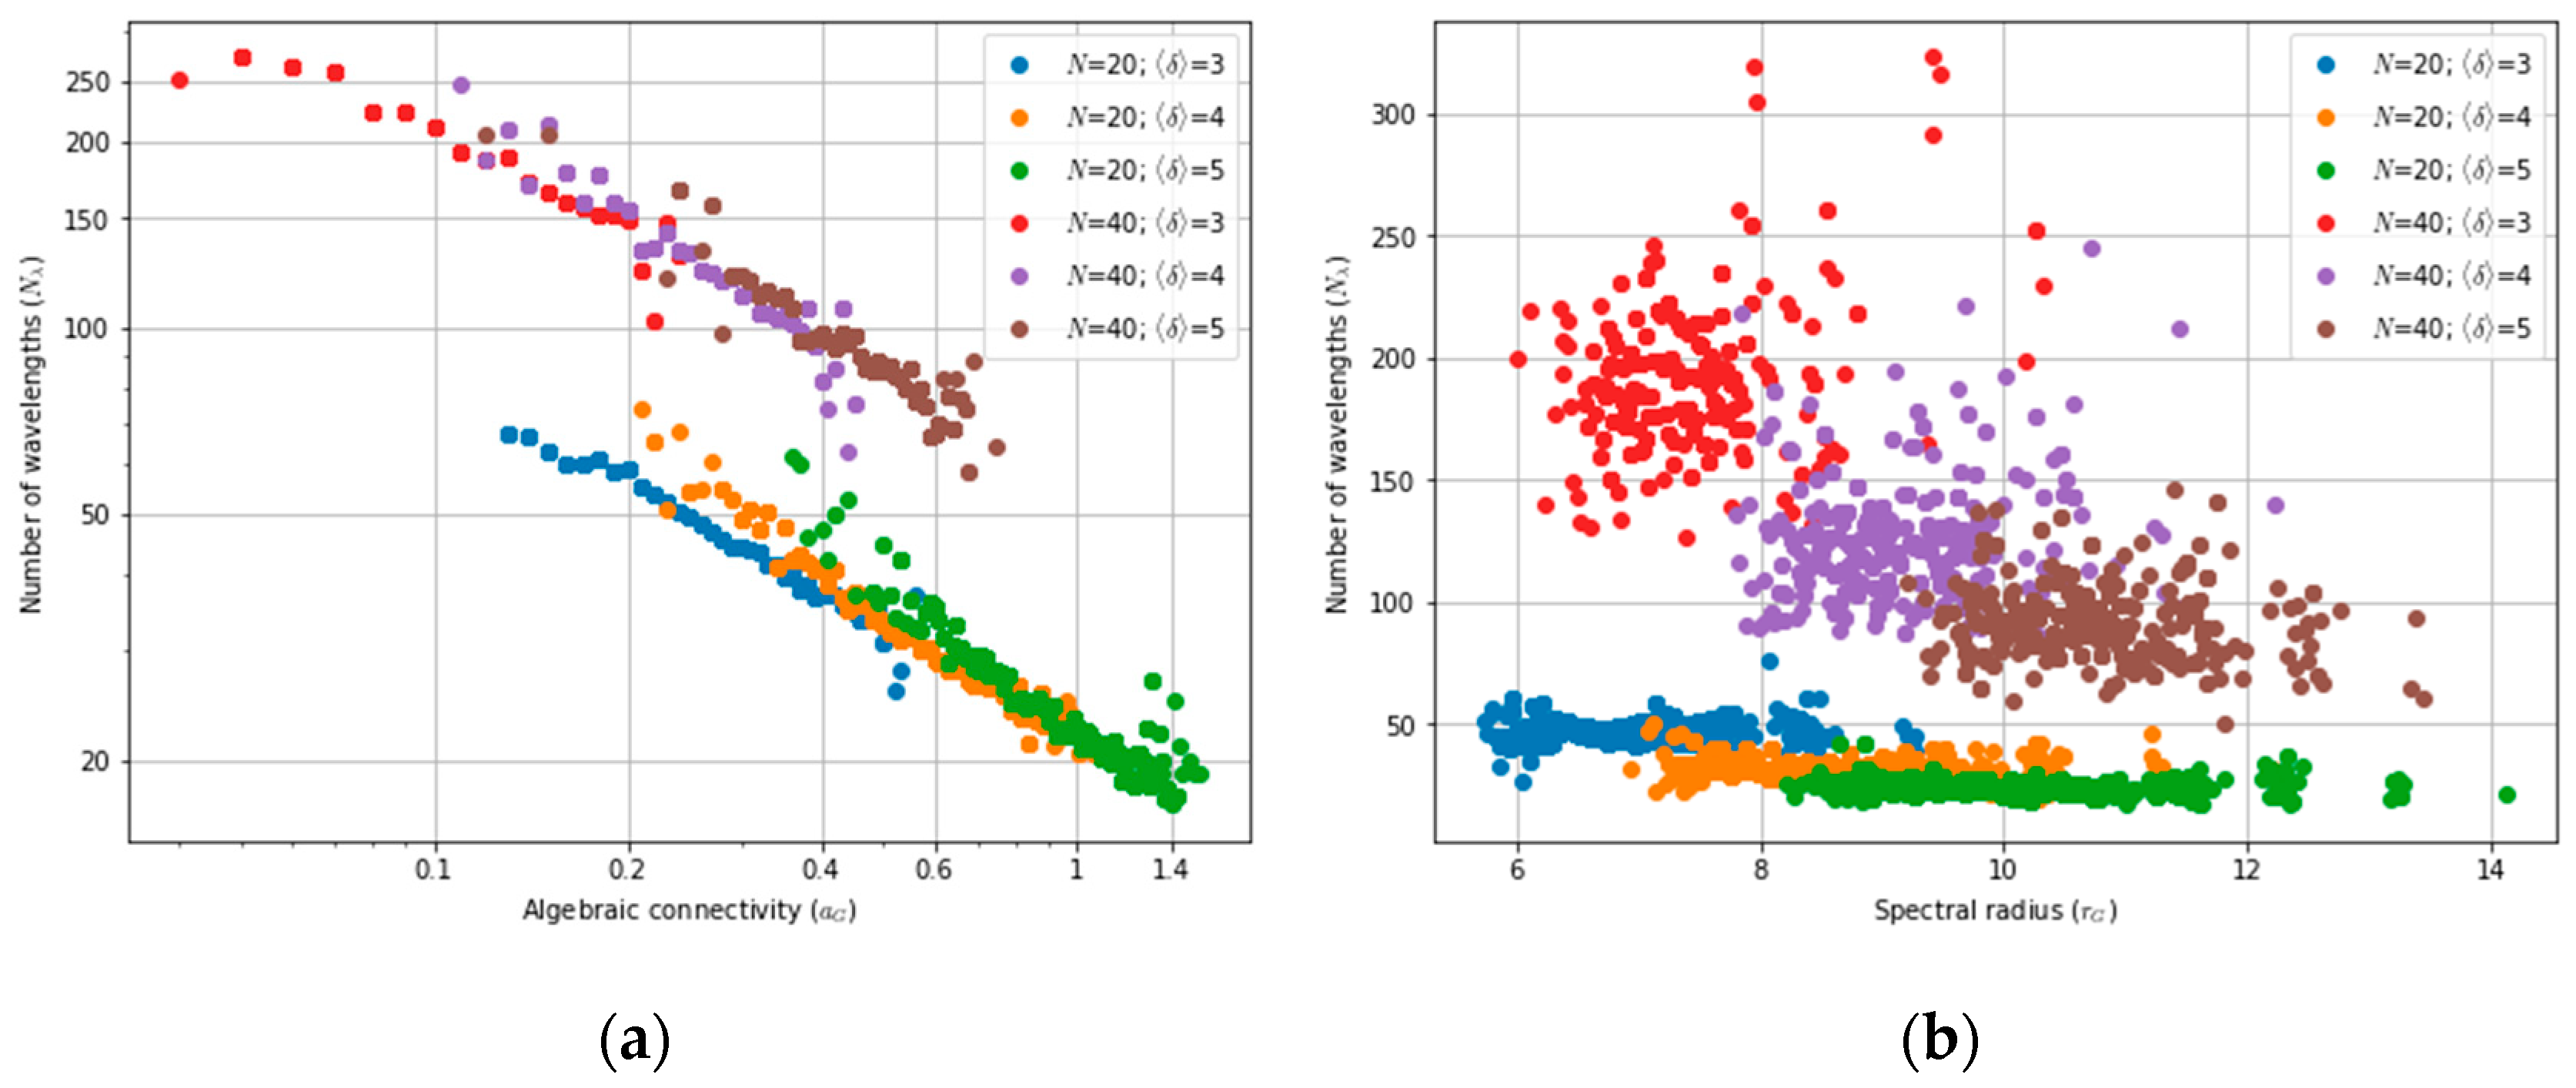
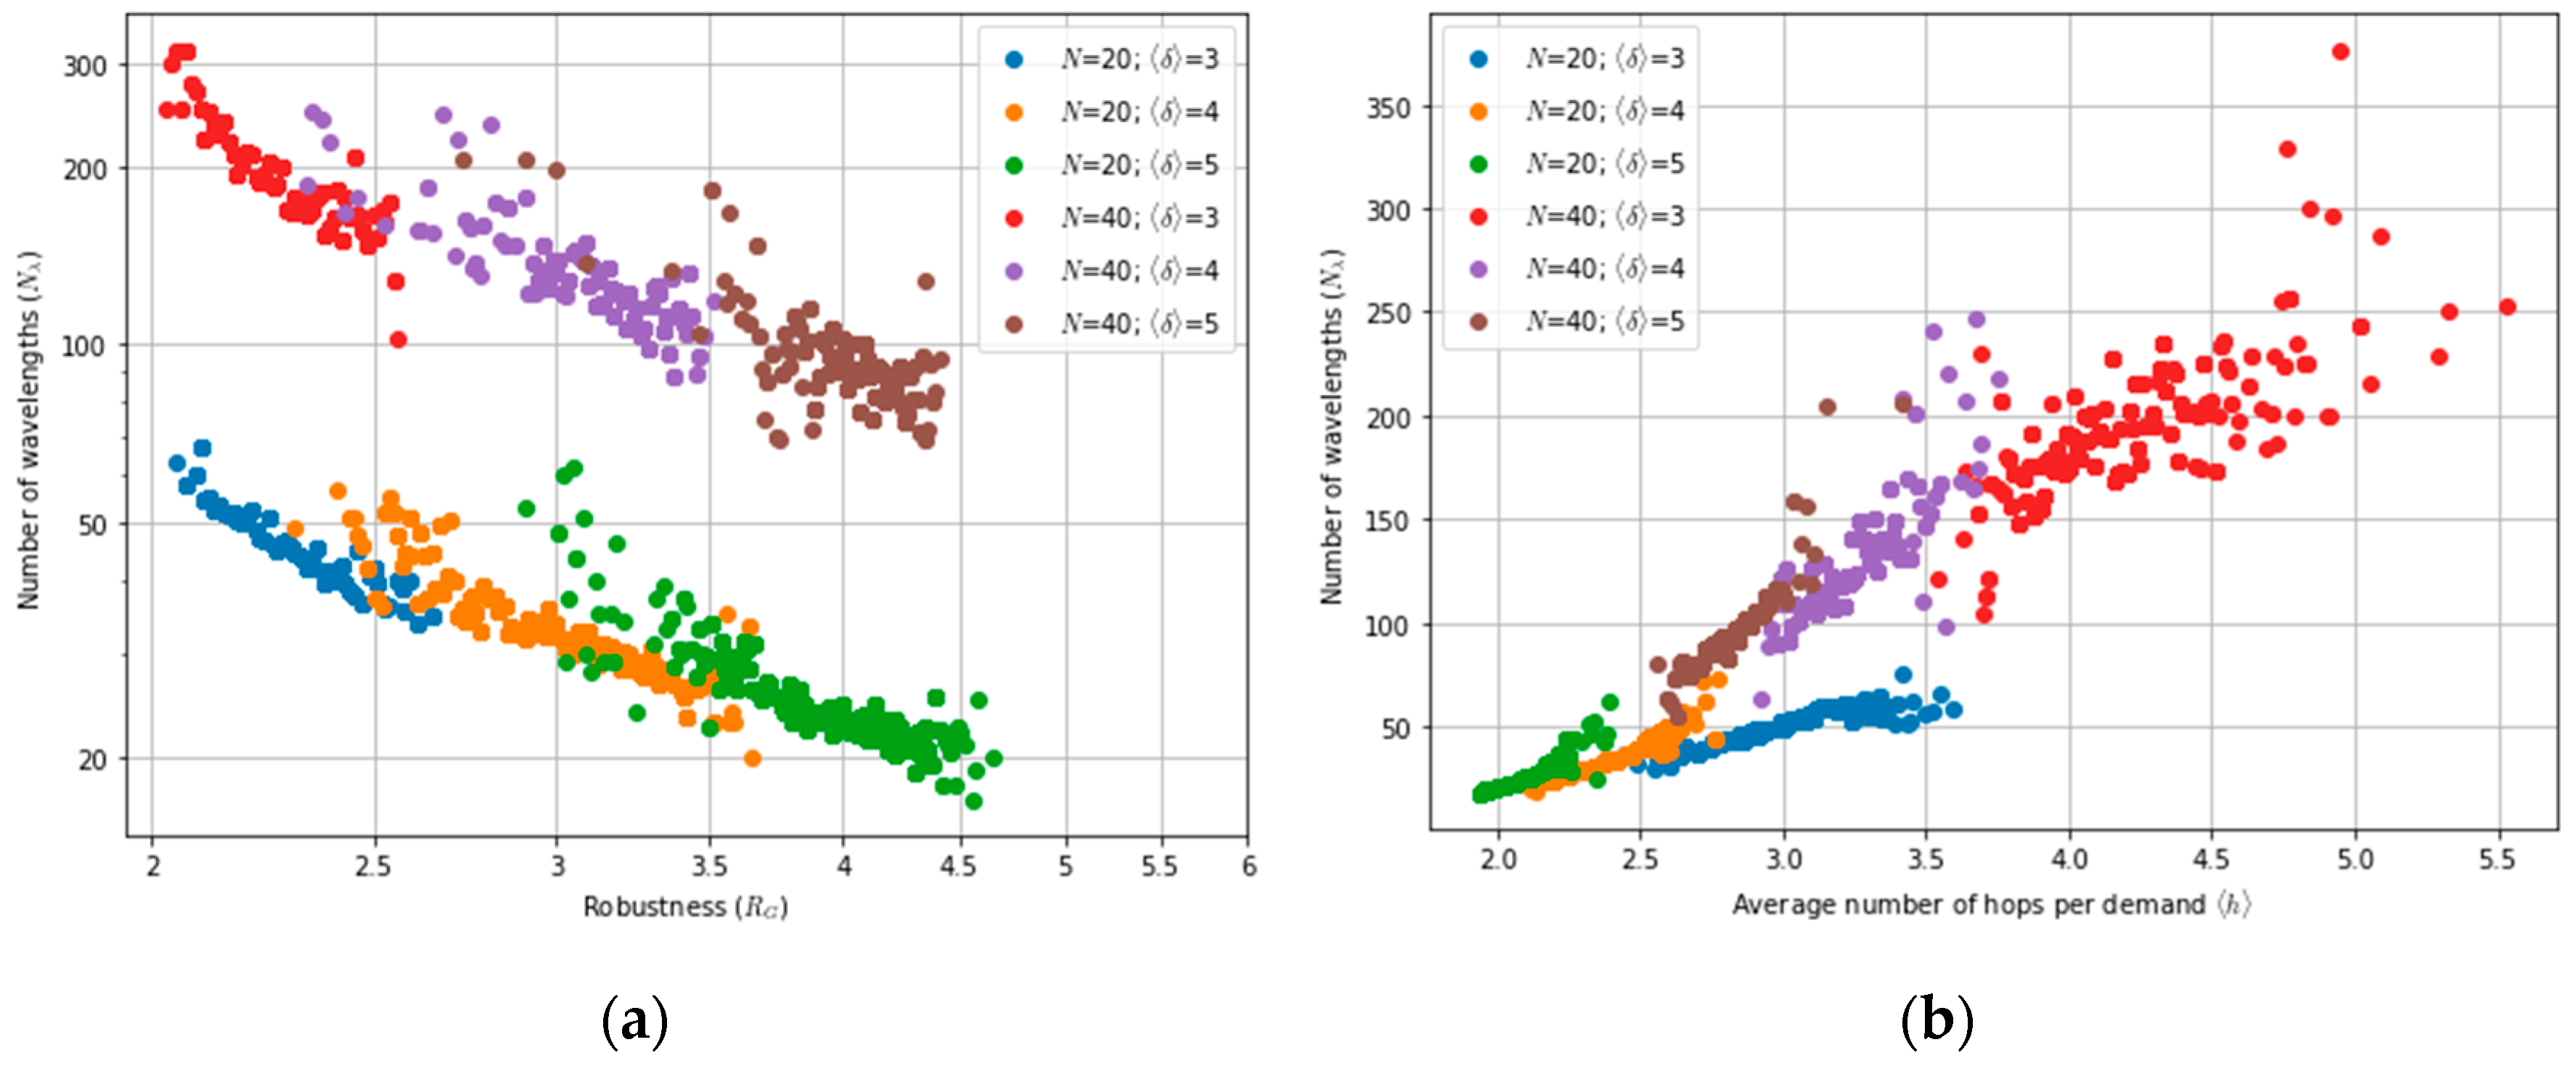
Figure 1 and Figure 2 show the average number of wavelengths N λ required to satisfy a full-mesh logical topology as a function of different topological parameters. These are based on a set of 7000 random networks with 20 and 40 nodes, an average node degree of < δ > = 3, 4 and 5, and uniform traffic. From these figures, one can see that the wavelength requirements, N λ , decrease as algebraic connectivity and the robustness increase. This behavior is expected since a G is related to R G ,   in the sense that higher robustness values indicate the availability of more node-disjoint paths. Therefore, as the number of available paths increases, the wavelength requirements decrease. In contrast, the opposite trend is observed when the average number of hops per demand increases. This occurs because a network with high < h > values implies that, on average, each traffic demand travels over more links, increasing link loads and potentially leading to wavelength conflicts on these links. Finally, from Figure 1b it appears that wavelength usage does not exhibit any correlations with the spectral radius, and no clear trend can be identified.
By focusing on Figure 1a, one can see that the dependence of N λ on algebraic connectivity approximately follows a power-law variation for each network size. Furthermore, the figure also shows that the slop of the power-law remains almost constant as the number of nodes increase from 20 to 40. This behavior was previously identified in [9] and allowed the authors to derive a formula to estimate the wavelength requirements in terms of algebraic connectivity. In our work, we aim to derive an alternative formula that may provide additional insights or improvements over the previous one. An additional trend, already identified in [8] and observable in Figure 1a, is the decrease in the wavelength usage as the average node degree increases. This is the consequence of the network becoming more connected, leading to shorter paths between node pairs.
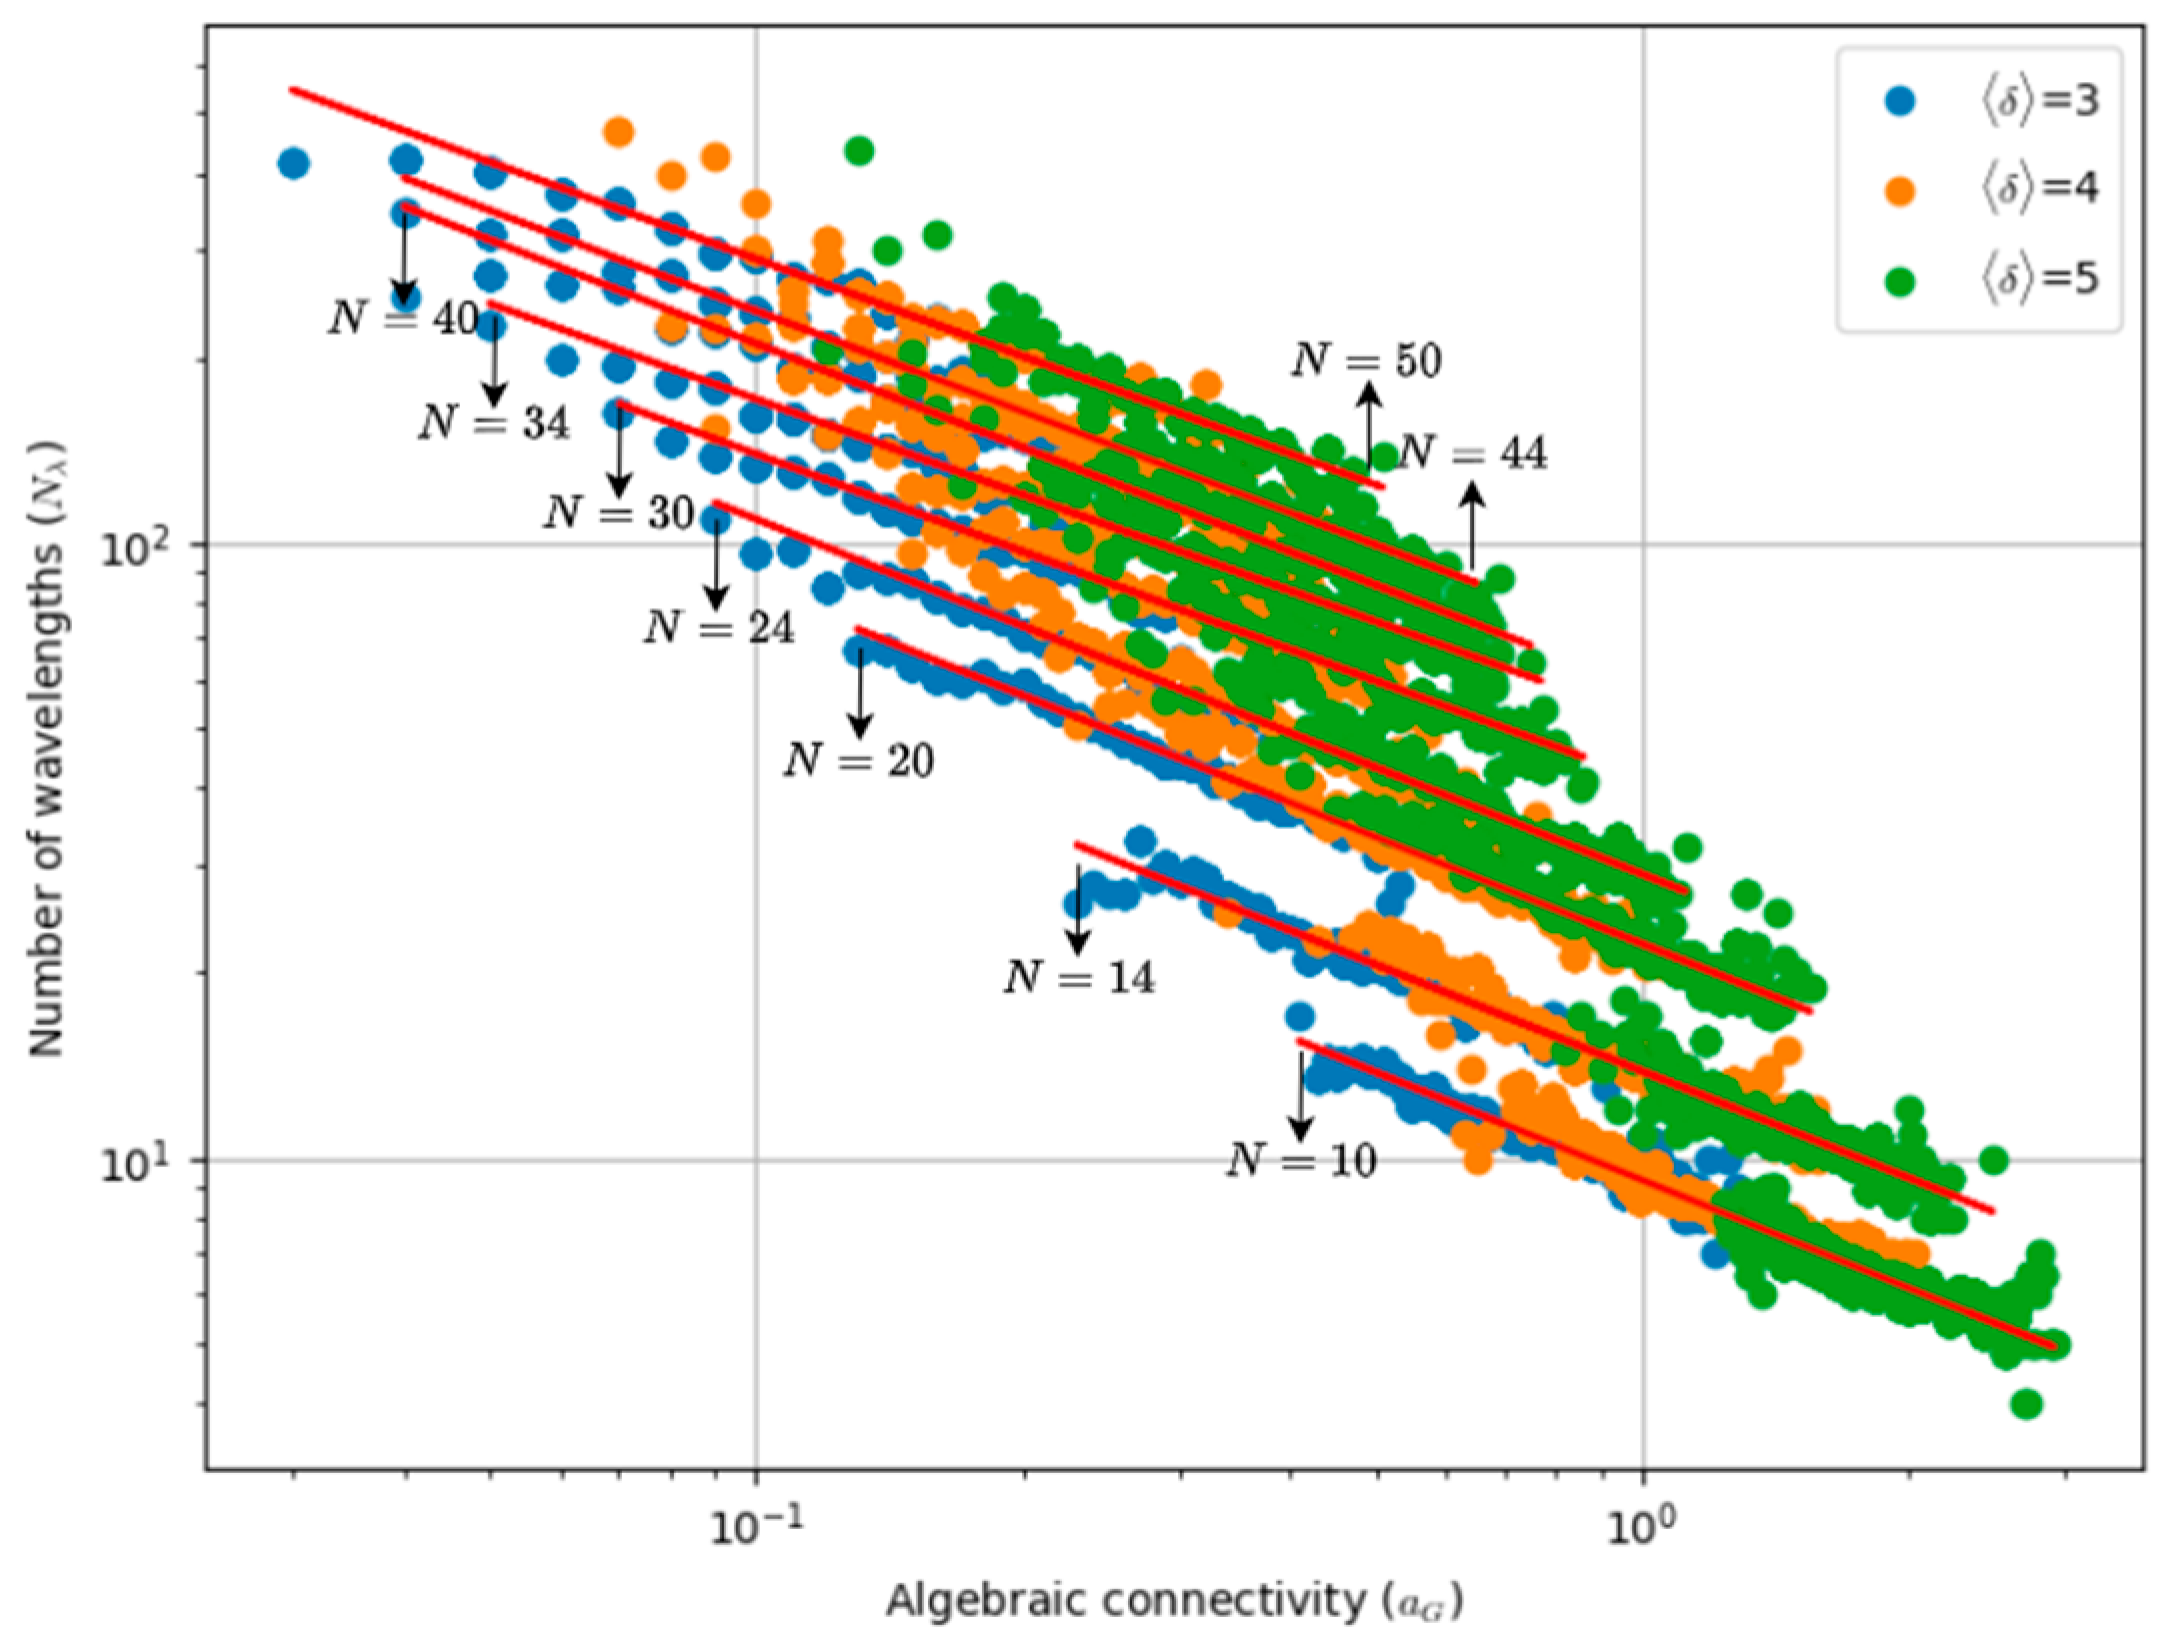
In order to derive an alternative formula, we obtained Figure 3 by generating a set of 27,000 random networks, with the number of nodes varying from 10 to 50. The linear trend lines indicate that the power-law slope remains practically unchanged as N increases, confirming the trend previously referred. Also, they suggest that as the number of nodes grows linearly, the fitted curves experience a linear upward translation along the y-axis.
The observations above may form the basis for deriving a formula to predict the number of wavelengths in terms of algebraic connectivity. The first step in this derivation consists of obtained equations of the trend lines corresponding to different values of N using least squares (LS) curve fitting, a widely used regression technique. Using these equations, along with a new level of fitting, we arrive at the following prediction formula for the wavelength requirements:
N ^ λ = 10 a N 2 + b N + c × a G d
where the regression coefficients are a = 4.19 × 10 4 , b = 4.84 × 10 2 , c = 5.39 × 10 1 and the power law slope d = 0.57 . For comparison purposes, ref. [9] presents the same formal equation but with different parameter values:
N ^ λ m i n = 10 a N 2 + b N + c × a G d
where a = 2.93 × 10 4 , b = 3.15 × 10 2 , c = 5.72 × 10 1 and d = 0.8 . We used the notation N ^ λ m i n in (5) because the number of wavelengths used to derived this equation was obtained using a lower bound.
To evaluate the accuracy of both prediction formulas, it would be useful to apply them to real-world optical networks and compare their estimation results with the wavelength requirements N λ obtained through simulations using the algorithms presented in Section 3. These comparisons can be made using the following two mean relative errors:
R E 1 ( % ) = N λ N ^ λ N λ × 100
and
R E 2   ( % ) = N λ N ^ λ m i n N λ × 100
where N ^ λ and N ^ λ m i n represent the estimated wavelength requirements values obtained using Equations (4) and (5), respectively. Table 1 shows the 27 real-world networks considered in the analysis [21]. In these networks, the number of nodes varies between 7 (SANReN) and 60 (CONUS60), the number of links ranges from 7 (SANReN) to 88 (Germany50), the average node degree extends from 2 (SANReN) to 4.73 (COST239), and the algebraic connectivity varies between 0.05 (CONUS60) and 2.15 (COST239). The average values obtained for R E 1 and R E 2 are 12.68% and 31.14%, respectively, showing that our prediction Formula (4) provides higher estimation accuracy than Formula (5). This is because Formula (5) was derived from random networks where wavelength usage was computed using a lower bound equation that sets a limit on the wavelength requirements. In contrast, Formula (4) was obtained by computing the number of wavelengths using a graph coloring technique, which yields more accurate results.

4.3. Wavelength Usage with 1 + 1 OCh Protection

This subsection studies the impact of 1 + 1 OCh protection on wavelength requirements. The objective is to determine the wavelength increment factor ,   F λ , which is defined as the ratio of the number of wavelengths required with protection   ( N λ p ) to the number of wavelengths required without protection ( N λ ) . Additionally, deriving a prediction formula for F λ would be particularly useful, as it helps estimate the extra wavelengths needed for protection without requiring complex simulations. To achieve this, one can begin by obtaining a prediction formula for   N λ p , using a procedure similar to the one previously applied to derive N ^ λ , but accounting for 1 + 1 OCh protection.
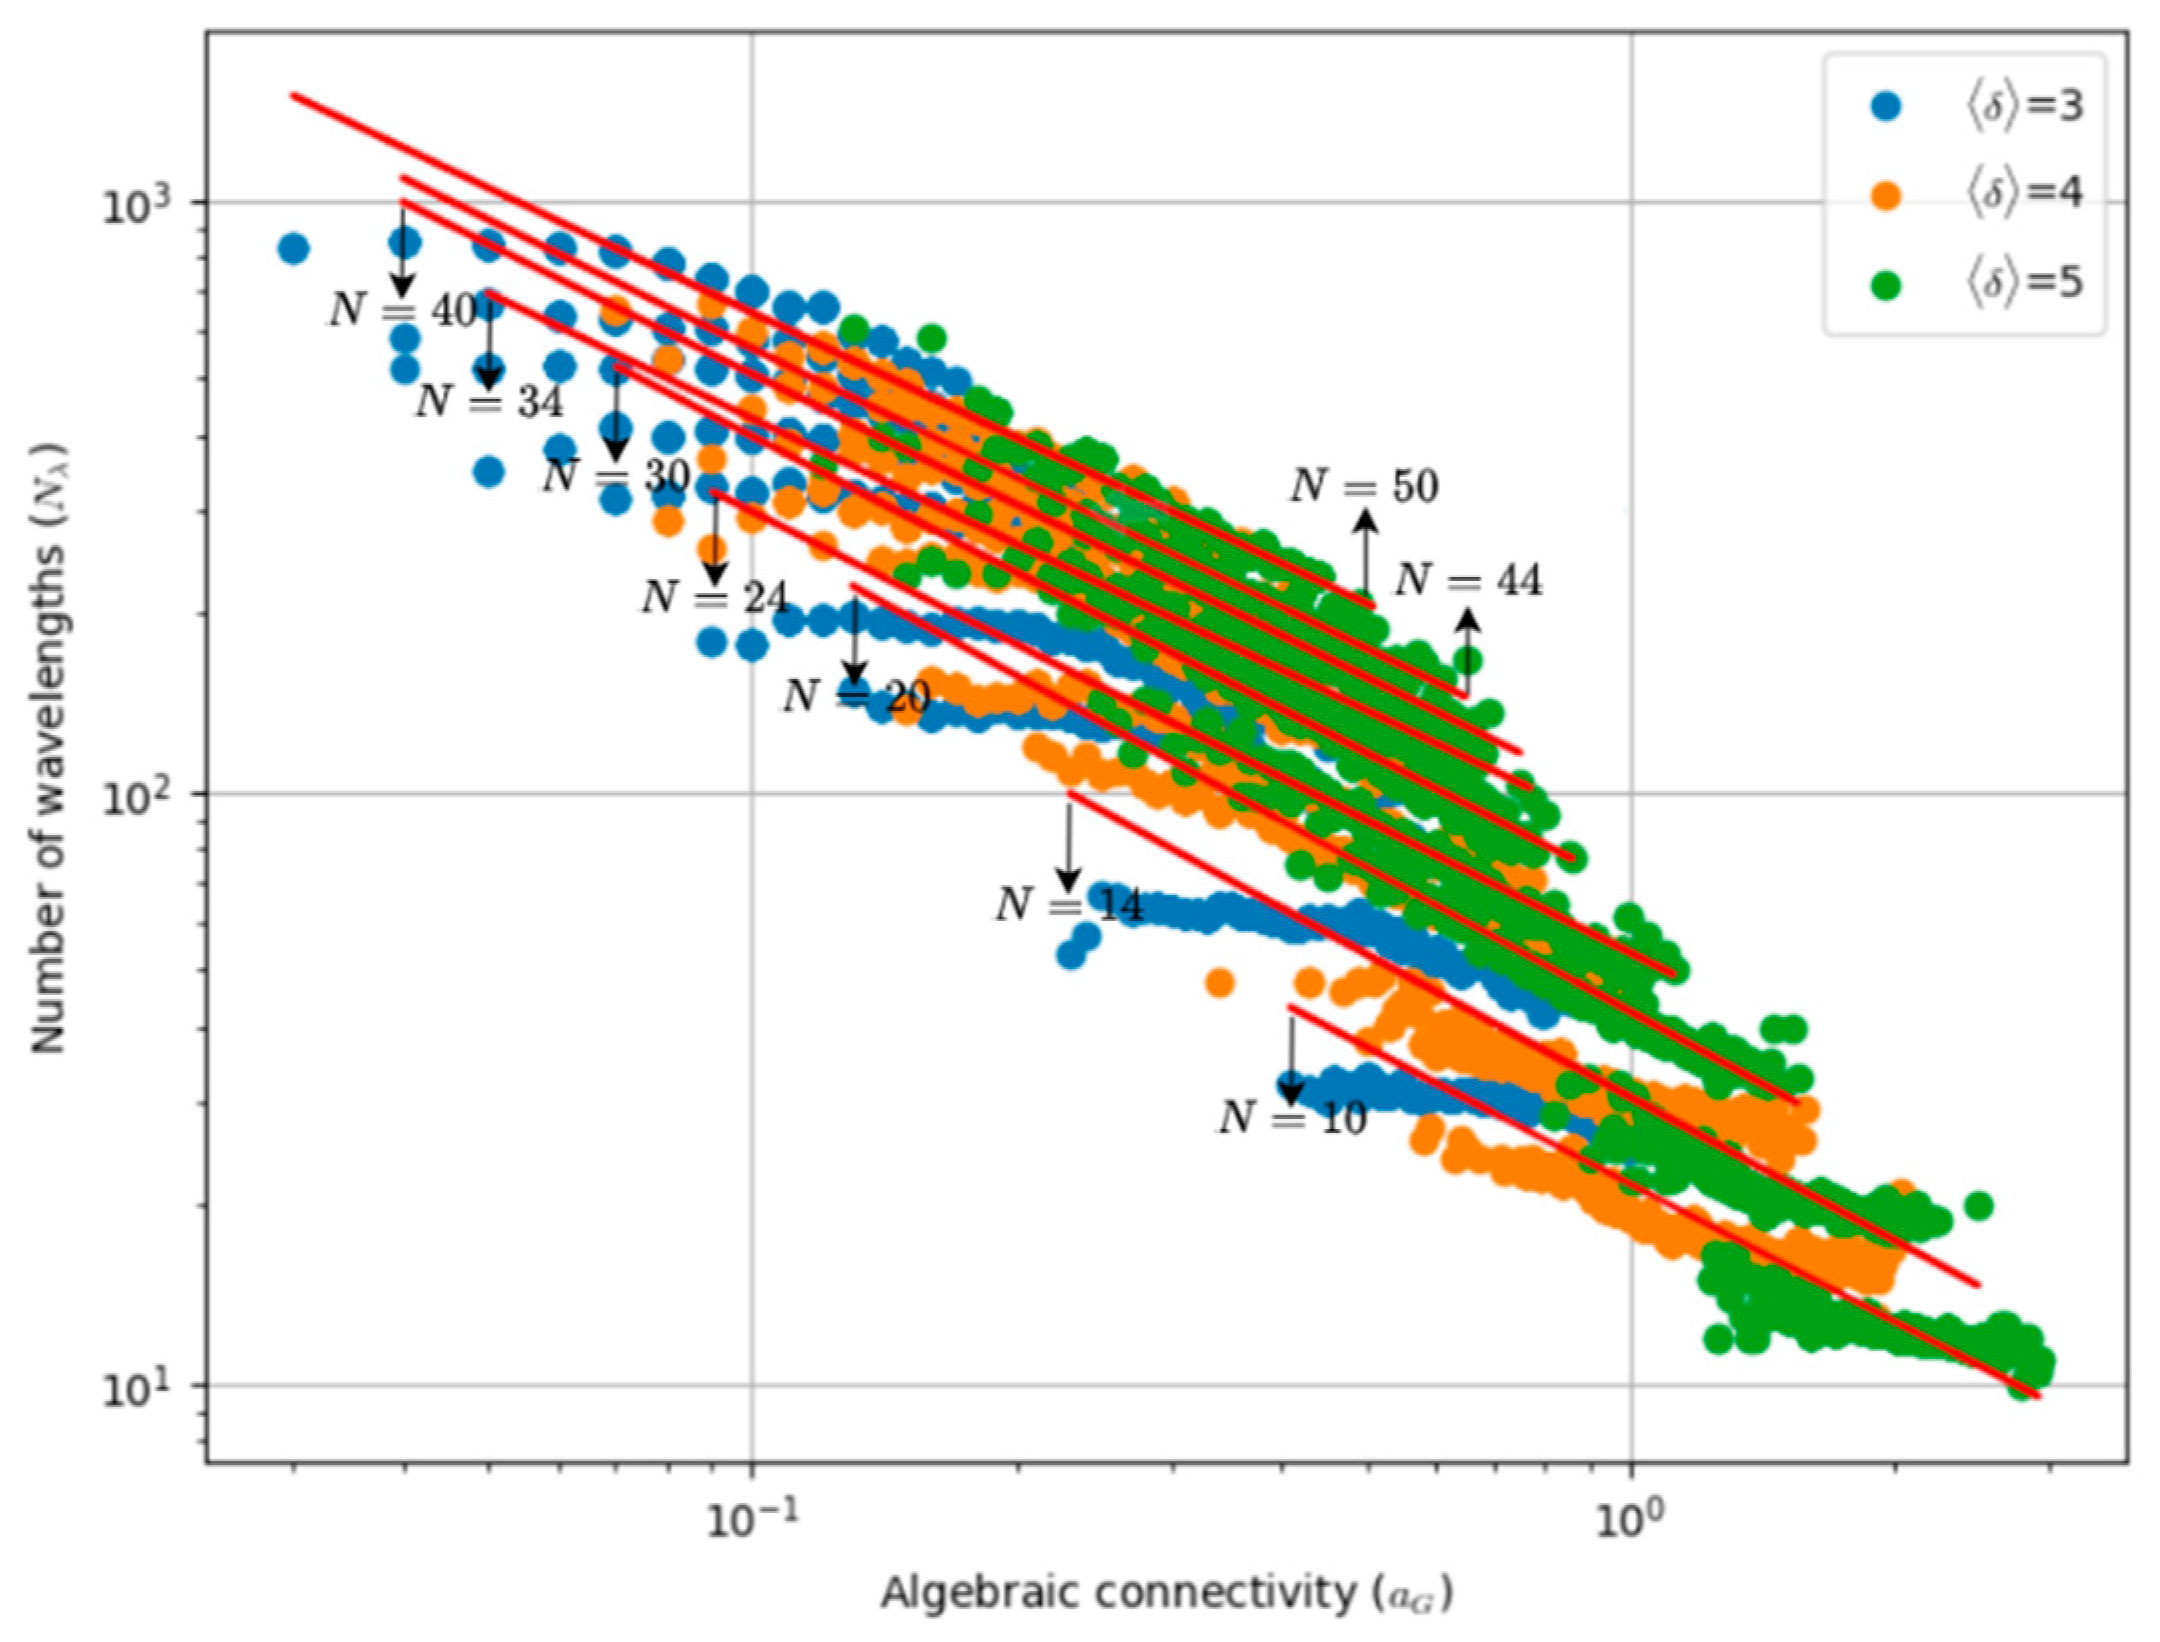
In this context, we obtained Figure 4, which depicts the number of required wavelengths   ( N λ p ) as a function of algebraic connectivity with the number of nodes and the average node degree as parameters. The data set considered is the same as in Section 4.2. The results show that the number of wavelengths   N λ p is still correlated with algebraic connectivity. However, compared with Figure 3, the power-law relationships are less evident. Therefore, the linear trend lines in the log-log graph do not fit the data points as well as they do in the unprotected case. Despite this, we still used these trend lines to derive the following prediction formula:
N ^ λ p = 10 a N 2 + b N + c × a G d
where a = 3 × 10 4 , b = 3.64 × 10 2 , c = 1.018   and the power law slope d = 0.7 . By using (4) and (8), one arrives at the following equation for the estimator of the wavelength increment factor:
F ^ λ = N ^ λ p / N ^ λ = 10 α N 2 + β N + γ × a G δ
where α = 1.186 × 10 4 , β = 1.195 × 10 2 , γ = 7.798 × 10 1 and δ = 0.13 .
To analyze the accuracy of the wavelength increment factor estimator, it makes sense to apply Formula (9) to real-world networks and compare the predicted values with those of F λ , obtained through simulations based on the procedure described in Section 3. In order to quantify this accuracy, we define the following mean relative error:
R E 3 ( % ) = F λ F ^ λ F λ × 100 .
The results presented in Table 1 show that F λ ranges from 1.49 to 3.07, with a mean value of 2.26 computed across all networks. This indicates that a network with 1 + 1 OCh protection typically requires about twice as many wavelengths as in the unprotected case. It is also observed that networks with the same number of nodes, the same number of links that implies the same average node degree can have different wavelength increment factors. This happens for instance with the Finland and Google B4 networks that have a value of F λ equal to 2.06 and 1.85, respectively. When comparing the real factor F λ with the estimated factor F ^ λ , it is observed that the prediction formula tends to underestimate or overestimate this last factor for some real networks, while providing very accurate estimations for others. The highest estimation error, 54.9%, was observed on the Italia21 network, which has the lowest wavelength increment factor, while the smallest, 0.2%, occurred on the SANReN network. The outlier result for the Italia21 network may be explained by its atypically high number of nodes with degrees above the average. On the other hand, the average estimation error is 12.7%. For approximately 70% of the networks, the estimated wavelength increment factor achieves an error of less than 15%. It is worth noting that, although the real wavelength increment factor varies from 1.49 to 3.07, the predicted values range between 1.89 and 2.62.
Finally, Table 2 presents the computational time of the RWA algorithm for different random networks. In general, the computational time increases cubically with N and decreases with the average node degree. This indicates the algorithm performs faster in more connected networks compared to those with fewer links, for a given value of N . Additionally, as expected, the average computation time is significantly higher for networks with 1 + 1 OCh protection. On average, for networks with 10 N 50 , the computational time is approximately 5 times higher than that of unprotected networks. Note that these simulation results were obtained on a computer with an Intel i7-8750H CPU @ 2.20 GHz (ASUSTeK Computer Inc., Shanghai, China) processor and 16 GB of RAM.

5. Conclusions

In this paper, the problem of wavelength assignment in optical backbone networks has been revisited, with particular attention given to the question of survivability. The dependency of wavelength requirements on both spectral and non-spectral topological parameters was also examined, indicating that algebraic connectivity is the most influential parameter among those analyzed. The analysis was performed considering both real-word networks and random networks generated using a k -nearest neighbors model. The results showed that for 1 + 1 OCh protection, the wavelength increment factor ranges from 1.49 to 3.07, with a mean value of 2.26. Other important outcomes of this work include the derivation of formulas to estimate the wavelength requirements and the wavelength increment factor in terms of algebraic connectivity and the number of nodes. Notably, by applying the latter formula to a set of 27 real-world networks, a mean relative error of 12.7% was obtained, as well as a relative error smaller than 15% for about 70% of the instances analyzed.

Author Contributions

Conceptualization, F.C. and J.P.; methodology, F.C. and J.P.; software, F.C.; validation, F.C.; formal analysis, F.C.; investigation, F.C. and J.P.; writing—original draft preparation, J.P.; writing—review and editing, J.P.; visualization, F.C.; supervision, J.P. All authors have read and agreed to the published version of the manuscript.

Funding

This research received no external funding.

Data Availability Statement

Data are contained within the article.

Conflicts of Interest

The authors declare no conflict of interest.

References

  1. Pires, J.J.O. On the capacity of optical backbone networks. Network 2024, 4, 114–132. [Google Scholar] [CrossRef]
  2. Kao, K.C.; Hockham, G.A. Dielectric-fibre surface waveguides for optical frequencies. Proc. IEE 1966, 113, 1151–1158. [Google Scholar] [CrossRef]
  3. Winzer, P.J.; Neilson, D.T.; Chraplyvy, A.R. Fiber-optic transmission and networking: The previous 20 and the next 20 years. Opt. Express 2018, 26, 24190–24239. [Google Scholar] [CrossRef] [PubMed]
  4. Ramaswami, R.; Sivarajan, K. Optimal routing and wavelength assignment in all-optical networks. In Proceedings of the IEEE INFOCOM’94, Toronto, ON, Canada, 12–16 June 1994; pp. 970–983. [Google Scholar] [CrossRef]
  5. Zang, H.; Jue, J.P.; Mukherjee, A. Review of routing and wavelength assignment approaches for wavelength routed optical WDM networks. Opt. Netw. Mag. 2000, 1, 47–60. [Google Scholar]
  6. Martín, I.; Troia, S.; Hernández, J.A.; Rodríguez, A.; Musumeci, F.; Maier, G.; Alvizu, R.; de Dios, O.G. Machine Learning-Based Routing and Wavelength Assignment in Software-Defined Optical Networks. IEEE Trans. Netw. Serv. Manag. 2019, 16, 871–883. [Google Scholar] [CrossRef]
  7. Baroni, S.; Bayvel, P. Wavelength requirements in arbitrary connected-routed optical networks. J. Lightw. Technol. 1997, 15, 242–251. [Google Scholar] [CrossRef]
  8. Fenger, C.; Limal, E.; Gliese, U. Statistical study of the influence of topology on wavelength usage in WDM Networks. In Proceedings of the Optical Fiber Communications Conference and Exhibition, Baltimore, MD, USA, 7–10 March 2000; p. TuK6-1. [Google Scholar] [CrossRef]
  9. Châtelain, B.; Bélanger, M.P.; Tremblay, C.; Gagnon, F.; Plant, D.V. Topological wavelength usage estimation in transparent wide area networks. J. Opt. Commun. Netw. 2009, 1, 196–203. [Google Scholar] [CrossRef]
  10. Higashimori, K.; Tanaka, T.; Inuzuka, F.; Ohara, T.; Inoue, T. Key physical topology features for optical backbone networks via a multilayer correlation. J. Opt. Commun. Netw. 2023, 15, B23–B32. [Google Scholar] [CrossRef]
  11. Yuan, P.; Xu, A. The Influence of physical network topologies on wavelength requirements in optical networks. J. Lightw. Technol. 2010, 28, 1338–1343. [Google Scholar] [CrossRef]
  12. Ramamurthy, S.; Sahasrabuddhe, L.; Mukherjee, B. Survivable WDM mesh networks. J. Lightw. Technol. 2003, 21, 870–883. [Google Scholar] [CrossRef]
  13. Simmons, J. Optical Network Design and Planning, 2nd ed.; Springer: Cham, Switzerland, 2014; pp. 277–347. [Google Scholar]
  14. Eira, A.; Santos, J.; Pedro, J.; Pires, J. Multi-objective design of survivable flexible-grid DWDM networks. J. Opt. Commun. Netw. 2014, 6, 326–339. [Google Scholar] [CrossRef]
  15. Baroni, S.; Bayvel, P.; Gibbens, R.J. On the number of wavelengths in arbitrarily-connected wavelength-routed optical networks. In Optical Networks and Their Applications; Optica Publishing Group: Washington, DC, USA, 1998. [Google Scholar] [CrossRef]
  16. Gladisch, A. Transparent optical networking-an European operator view. In Proceedings of the IEEE/LEOS Summer Topi All-Optical Networking, Mont Tremblant, QC, Canada, 5–17 July 2002. [Google Scholar] [CrossRef]
  17. Steiglitz, K.; Weiner, P.; Kleitman, D.J. The design of minimum-cost survivable networks. IEEE Trans. Circuit Theory 1969, 16, 455–460. [Google Scholar] [CrossRef]
  18. Bhandari, R. Optimal physical diversity algorithms and survivable networks. In Proceedings of the 2nd IEEE Symposium on Computer and Communications, Alexandria, Egypt, 1–3 July 1997; pp. 433–441. [Google Scholar] [CrossRef]
  19. Suurballe, J.W.; Tarjan, R.E. A quick method for finding shortest pairs of disjoint paths. J. Netw. 1984, 14, 325–336. [Google Scholar] [CrossRef]
  20. Wu, D. CS 4102: Algorithms. Lecture 23: Bipartite Matching; The University of Virginia: Charlottesville, VA, USA, 2019. [Google Scholar]
  21. Carmo, F. Planning of Survivable Ultra-High Bandwidth Optical Networks Using Deep Learning Techniques. Master’s Thesis, University of Lisboa, Lisboa, Portugal, October 2024. [Google Scholar]
Figure 1. Wavelength requirements considering spectral parameters for varying number of network nodes and average node degrees: (a) Algebraic connectivity; (b) Spectral radius.
Network 05 00018 g001
Figure 2. Wavelength requirements considering non-spectral parameters for varying numbers of network nodes and average node degrees: (a) Robustness; (b) Average number of hops per demand.
Network 05 00018 g002
Figure 3. Wavelength requirements as a function of algebraic connectivity with the number of nodes and average node degree as parameters.
Network 05 00018 g003
Figure 4. Wavelength requirements as a function of algebraic connectivity, with the number of nodes and average node degree as parameters, for networks with 1 + 1 OCh protection.
Network 05 00018 g004
Table 1. Estimation of wavelength requirements for real-world networks with and without protection.
NetworkNL < δ > a G N λ N λ p F λ F ^ λ RE3(%)
SANReN772.000.758212.632.620.2
BERN10112.200.4615453.002.6113.1
ComputeServe11142.250.6419462.422.440.9
COST23911264.732.159161.782.0917.4
Polska12183.000.7114433.072.3623.2
Finland12193.170.8818372.062.2911.6
Google B412193.170.420371.852.5437.4
NSFNET14213.000.7324572.382.265.0
DTAG14233.290.4321512.432.420.4
Atlanta15222.930.4337892.412.371.4
GBN17263.060.341761.852.3929.1
NLRN19232.420.16631422.252.5111.2
EON19373.890.5530612.032.135.0
ARPANET20323.200.3411132.762.2717.6
Italia2121363.430.24681011.492.3054.9
BT-UK22353.180.25581482.552.2511.7
GEANT22363.270.42421092.602.1118.9
UBN24433.580.27641402.192.161.1
PBN26362.770.14962282.382.293.5
US2626423.230.2801782.232.191.6
Euro2828412.930.71982202.242.182.9
CONUS3030362.400.081233332.712.3513.3
GEANT232523.250.221182181.852.029.1
COST26637573.080.161803171.762.0114.2
Janos-us-ca39613.130.111623582.212.085.7
Germany5050883.520.182043921.921.891.8
CONUS6060792.630.0554310401.922.2919.3
Table 2. Computational time (in ms) for random networks of different sizes.
N < δ > W/o Protection (ms)W/Protection (ms)
1034.6329.2
44.1132.0
54.0036.4
20367.9313.7
458.8316.2
554.1342.7
303404.01682.0
4322.71400.0
5289.21384.0
4031450.35251.0
41135.04312.0
5988.54018.6
5034086.915,093.2
43145.611,124.2
52565.09815.7
Disclaimer/Publisher’s Note: The statements, opinions and data contained in all publications are solely those of the individual author(s) and contributor(s) and not of MDPI and/or the editor(s). MDPI and/or the editor(s) disclaim responsibility for any injury to people or property resulting from any ideas, methods, instructions or products referred to in the content.