Article

Method for Systematic Assessment of Mobile Network Coverage for Logistic Applications on the German Highway

by
Rasmus Rettig
1,*,
Christoph Schöne
1,
Frederik Fröhlich
2 and
Christopher Niemöller
2
1
Department of Information and Electrical Engineering, Hamburg University of Applied Sciences, Berliner Tor 7, 20099 Hamburg, Germany
2
ENQT GmbH, Spaldingstrasse 210, 20097 Hamburg, Germany
*
Author to whom correspondence should be addressed.
Network 2022, 2(2), 311-328; https://doi.org/10.3390/network2020020
Submission received: 23 December 2021 / Revised: 25 May 2022 / Accepted: 26 May 2022 / Published: 30 May 2022

Abstract

:
Smart logistics, combining the capabilities of logistics with methods and techniques of the Internet of Things, Information and Communication Technologies, and the highest levels of automation are key to addressing the challenges of the 21st century and minimizing emissions while maximizing logistic performance. High-performance cellular networks are a prerequisite to fully using and leveraging their possibilities. These communication networks were developed based on the need for voice communication and streaming services. While the upcoming requirements are included in the latest versions of cellular networks, the existing infrastructure requires significant improvements and will have to adapt significantly. This study evaluates the performance of the current state of implementation of cellular networks on the German highway experimentally and analytically. The known indicators RSRP, RSSI, and RSRQ are analyzed spatially, over time, and for different driving conditions. The results indicate a high level of spatial correlation and a sufficient level of confidence, which are needed to ensure consistency and repeatability of these measurements. The procedure and the results can be used to assess the suitability of cellular networks for smart logistics applications and continuously monitor their improvement. The results indicate the status of the cellular network on the German highway which is worse compared to the network operator’s self-assessment.

1. Introduction

The Internet of Things in Logistic applications (IoTL) is considered to be a key to tackling the existing and upcoming challenges of the 21st century in the logistics industry. Specifically, consistent real-time knowledge of the position and condition of trucks and their load can significantly improve the efficiency of the logistic chain, reduce cost and greenhouse gas emissions, and improve overall performance to customer requirements. According to the World Economic Forum, “Supply-chain decarbonization will be a “game changer” for the impact of corporate climate action” [1]. However, consistent and reliable real-time communication is a prerequisite to leveraging the full potential of these smart logistics. A significant part of this communication will be based on cellular communication because of its high level of standardization and availability. However, up to Long Term Evolution (LTE) technology, the development and implementation of these networks have been strongly driven by voice communication and (video-)streaming applications, which rely on a different set of requirements compared to smart logistics. With the introduction of LTE-advanced, systems were expected to support mobile speeds up to 350 km/h or even up to 500 km/h [2,3]. The expected “level of performance” at these speeds was not specified in further detail. With the development of 5G requirements, Ultra Reliable Low-Latency Communication (URLLC) and massive Machine Type Communication (mMTC) were considered [4], which are a must in the field of smart logistics for use-cases like mobile load condition control or remote driving of logistic vehicles. However, the implementation of 5G networks on German highways with strong logistic relevance lags behind. The path from specification to real-life implementation requires means of assessment and control. Currently, network operators offer LTE-based services along the route under investigation in this study, which are, according to their websites, delivering consistent LTE coverage and “best in class” performance [5,6]. As this study shows, this is not the case. Thus, there is a need to consistently and systematically assess the performance of the current state of mobile networks with respect to logistic applications and provide means to continuously measure the status with significant reproducibility.

1.1. Smart Logistic Applications

Smart logistics applications, like intelligent trucks, containers, or cargo, rely on integrating advanced Information and Communication Technologies (ICT) to consistently and continuously exchange relevant information in real time [7,8,9]. The transmitted information can include position, speed, and condition of the vehicle [10,11], environmental data like temperature or weather conditions, or certain special emergency events that require immediate action by the operator. A container can transmit similar information, which is relevant for multi-modal transportation involving different carriers [12]. Finally, monitoring the cargo condition allows a delivery in the best possible condition [13], which is specifically relevant for the transportation of food [14,15] or medical goods. Thus, the IoTL enables functionalities like the dynamic and exact prediction of the time of arrival for a perfect unloading/loading operation and handover of goods in interconnected fleets. The collection and transmission of technical conditions and errors would allow predictive and preventive maintenance with minimal impact on operating times. Recharging of Battery Electric Vehicles (BEVs) can be optimized for both cost and time by transmitting their current energy status. By assessing logistic Key Performance Indicators (KPIs) [16], like “full and operational logistics cost” or the “length of logistics cycles”, the IoTL can significantly improve transparency by making these automatically measurable and at the same time deliver the toolset for improvement. In 2021 more than 80% of all goods have been transported on the roads in Germany [17]. Since transportation on roads is strongly dependent on e.g., traffic and weather conditions, the opportunities for ICT-based smart logistics are significant and worth assessing as part of this study.

1.2. Cellular Networks

As indicated, cellular communication is expected to be the main base for communication in smart logistic applications because of its high level of standardization and broad availability. However, the development of cellular networks up to LTE [18,19,20] has mostly been driven by voice communication, (video-)streaming, and to a lesser degree by online gaming. Thus, current standards for the Quality of Service (QoS) consider services like the File Transfer Protocol (FTP), streaming video, or IMS Multimedia Telephony service (MTSI) [21]. Under most conditions, these types of data communication are either not safety relevant or can accept short interruptions. For logistic applications, specifically, when closely linked to Intelligent Transportation Systems (ITS) such as highly-automated or autonomous transportation, this is not acceptable. Unlike the common user, who can tolerate minor interruptions in cellular service along the highway, IoTL applications with potential safety relevance require a continuous, constant data rate, low-latency cellular connection without any loss of signal. Besides the static assessment in constant positions, these applications also need a quick and lossless handover between cells when traveling at significant speeds. In contrast to Human-to-Human (H2H) voice communication, the required type of communication can be categorized as Machine-to-Machine (M2M) type. Different ways of assessing the performance of cellular networks are described in the literature. On one hand, mobile phone and network scanner-based drive tests are used, partially in combination with simulation and interpolation techniques, to obtain information for areas not experimentally covered [22]. On the other hand, cellular operator performance is analyzed based on crowd-sourced, end-user device-based data [23], which promises a huge amount of information with very little investment. However, this approach is limited by a lack of both hardware and software control of the devices acting as sensors in the cellular network. The capability to measure the location of these devices based on Global Navigation Satellite Systems (GNSS) is typically very limited with respect to both measurement frequency and quality, because of the integrated GNSS hardware and antenna. This is also valid for the cellular network receiver hardware and position of the device within a vehicle: in crowd-sourced datasets, some mobile phones could be hidden inside a bag and encapsulated within the metallic chassis of the vehicle while others could be connected to a roof antenna. While for logistic applications, like remote driving, a roof antenna for both the cellular network and the satellite-based localization is a prerequisite, end-user devices do not offer this option. Finally, the diversity of devices used in crowd-sourced studies limits reproducibility and thus, the quality of the overall results. For the service-specific overall performance of a cellular network, represented by the End-to-End QoS, and suitability of the network for an application like remote driving, the full chain of communication including the destination device has to be considered [24]. However, to assess the quality of extension of a cellular network, an assessment of simple, directly measurable parameters, which directly limit the End-to-End QoS, is an advantage, since external complex factors can be minimized. An overview of complex and simple parameters for quality assessment of cellular networks is included in Table 1. The part most easily measurable from the terminal device is the performance of the access network at the terminal equipment. This can be characterized by standard physical layer indicators like the Reference Signal Received Power (RSRP), the Received Signal Strength Indicator (RSSI), or the Reference Signal Received Quality (RSRQ). Existing studies analyze and model these in constant positions over time [25]. Others include the analysis of spatial and temporal characteristics and in some cases compare cellular and WiFi performance [26,27,28,29,30].
However, all existing studies and standards stay vague on the question of validity or reproducibility, which is a key goal of the research presented here.

1.3. Questions of Research and Contribution

Proven experimental methods and validated data analysis are a prerequisite to systematically assessing the cellular network for logistic applications to control and enforce their further expansion. For this study, the authors focus on the German highway, driving at speeds relevant for logistics, to find out if existing or slightly modified methods for cellular network analysis deliver reliable and reproducible results with sufficient confidence. The effects of the time of measurement, the vehicle speed, and the direction are evaluated. Furthermore, a method for comparison of two network operators is proposed and implemented to assess the quality and create a ranking based on objective data. In summary, this publication describes the method, its validation, and the first tests performed to assess the usability and performance of cellular LTE networks for smart logistic applications. It addresses the following questions of research:
  • Does the experimental setup used in this study provide reproducible and consistent measurement results?
  • How can different measurements, with spatial variation in vehicle position along the road under analysis, be compared?
  • What is the level of consistency assessed by the spatial correlation between different measurements with variation in time, speed, and direction?
  • What is the level of consistency based on the confidence per measured position?

1.4. Organization of this Publication

After a review of related work based on existing standards and publications in Section 2, the experimental setup and measurement configuration are described in Section 3. Furthermore, the data flow for analysis and the description of the highway under investigation are included in this section. The results of the measurements for RSRP, RSRQ, and RSSI, and their further analysis are presented in Section 4. The paper concludes with a discussion and summary of the results with respect to the questions of research, followed by an outlook on further investigations in Section 5.

2. Related Work

In this section, existing publications and standards are briefly reviewed in the context of this study.

2.1. Smart Logistics

The use of communication and IoT technologies has been subject to research since about 2008 and is still ongoing. In most recent research, Song et al. [8] provide an overview of smart logistics applications and use cases enabled by IoT technologies and includes an overview of the respective requirements. Similarly, Tran-Dang et al. [9] point out that Information and Communication Technologies (ICT) are a key enabler for efficient and sustainable logistics. In [16] the authors describe the potential of IoT technologies to measure logistics KPIs and improve the efficiency and quality of logistics processes within a balanced scorecard approach. In the publications [14,15], Jedermann and Lang describe the development and advantages of an intelligent container for fruit transportation, which is equipped with localization and communication devices. The requirement of “real-time response in case of unexpected situations detected during the transportation phase” is addressed in [10], while the idea of an IoT-based cargo tracking system was published in 2012 [13]. In the same year, Mondragon et al. [12] described the connection of ITS with multimodal logistics for a sea port location in a simulation-based approach. In 2009, an intelligent freight transportation system based on advanced fleet management, improved city logistics, and e-business was subject to research published in [11].
In summary, smart logistics have been continuously addressed in research since 2008. However, until today, the implementation of advanced use-cases was very much limited to research prototypes. Limited quality and performance of the existing cellular network are considered to be the main constraints limiting their commercial implementation and roll-out.

2.2. Performance Measurement of Cellular Networks

The performance requirements of cellular networks with respect to logistic applications in the context of Industry 4.0 was subject to recent research [7]. The authors consider 5G to be the connectivity solution addressing all logistics needs from manufacturing floors and warehouses to worldwide material transportation. The temporal behavior of the LTE standard parameters RSRP and RSRQ has been subject to research by Raida et al. [25,33] in 2020. RSRP in three specific, static locations was found to be almost constant over periods up to several days. Thus, in this study, RSRP is measured and analyzed to figure out, if it is a valid indicator also for the spatial characterization of LTE networks. The measurement of the QoS of LTE networks is addressed by several standards [21,24], that define the End-to-End QoS and include the assessment based on the perspectives of the final user and the service provider. The more recent norm ETSI TS 102 250-2 [21] includes the QoS for the applications E-mail, File Transfer, Multimedia Messaging Services (MMS), Mobile Broadcast, Ping, Push-to-talk over Cellular (PoC), Short Message Service (SMS), Streaming, Telephony, Video Telephony, and Web Browsing. Obviously, upcoming applications with relevance to smart logistics have not been included. The experimental analysis of cellular networks has been subject to continuous research. Poncela et al. [31] emphasize the need to monitor objective parameters to automatically measure and improve the end user’s Quality of Experience (QoE). Lottermann et al. [32] identify the limitations of LTE for automotive off-board applications with respect to transmission delays and packet discard rates. In [26], the authors measure and compare the spatio-temporal performance of cellular and 802.11 WiFi communication based on speed-tests on end-user devices. They find a strong variation over the time of day and a significant spatial consistency. Using end-user devices and crowd-sourced datasets has also been the base for a study by Egi et al. [22]. The authors confirmed that the QoS and coverage of cellular networks can be explained by measuring RSRP, which is one of the three parameters analyzed within this study. In a text by Kousias et al. [23], different crowd-sourced parameters are analyzed to identify an operator. The latency was found to be the most important feature. However, in contrast to this study, the dataset did not contain any position information. In a more recent study by Herrera-Garcia et al. [34], lower-layer indicators, like RSRP, RSRQ, and RSSI, are used to generate higher layer metrics and assess overall End-to-End (E2E) performance. The article confirms the relevance of the parameters under investigation in this study. According to [35], Radio Access Network (RAN) problems are causing 48% of all network performance issues. The authors create a technology-agnostic methodology to assess the QoE based on Key Quality Indicators (KQIs). In [28], the authors perform drive tests in rural Malaysia based on mobile phones to measure the performance of the 3G and 4G networks for web browsing and video streaming applications. In comparison, based on an overall statistical evaluation, they find the 4G network to perform better than the 3G cellular network. In a similar study for urban areas of Malaysia [29], a better performance than in rural areas was observed. However, the evaluation was limited to an overall statistical assessment, and neither time- nor position-related dependencies were considered. In a very recent study by El Saleh et al. [30], 3G and 4G networks were assessed for different cities in Oman in mobile phone-based, one-time drive tests. The authors observed local RSRP levels below −100 dBmW, which potentially lead to the described packet losses. An overview of the related publications is given in Table 2.
The status of the extension and quality of the cellular network is regularly self-assessed by the providers in Germany [5,6,36]. Based on this self-assessment, the quality of the LTE is classified as consistently “excellent” or “very good” both outside and inside buildings on the highway under investigation. The criteria for this assessment, however, are not given. This study delivers independent and reproducible measurement results, which do not comply with the self-assessment.

3. Materials and Methods

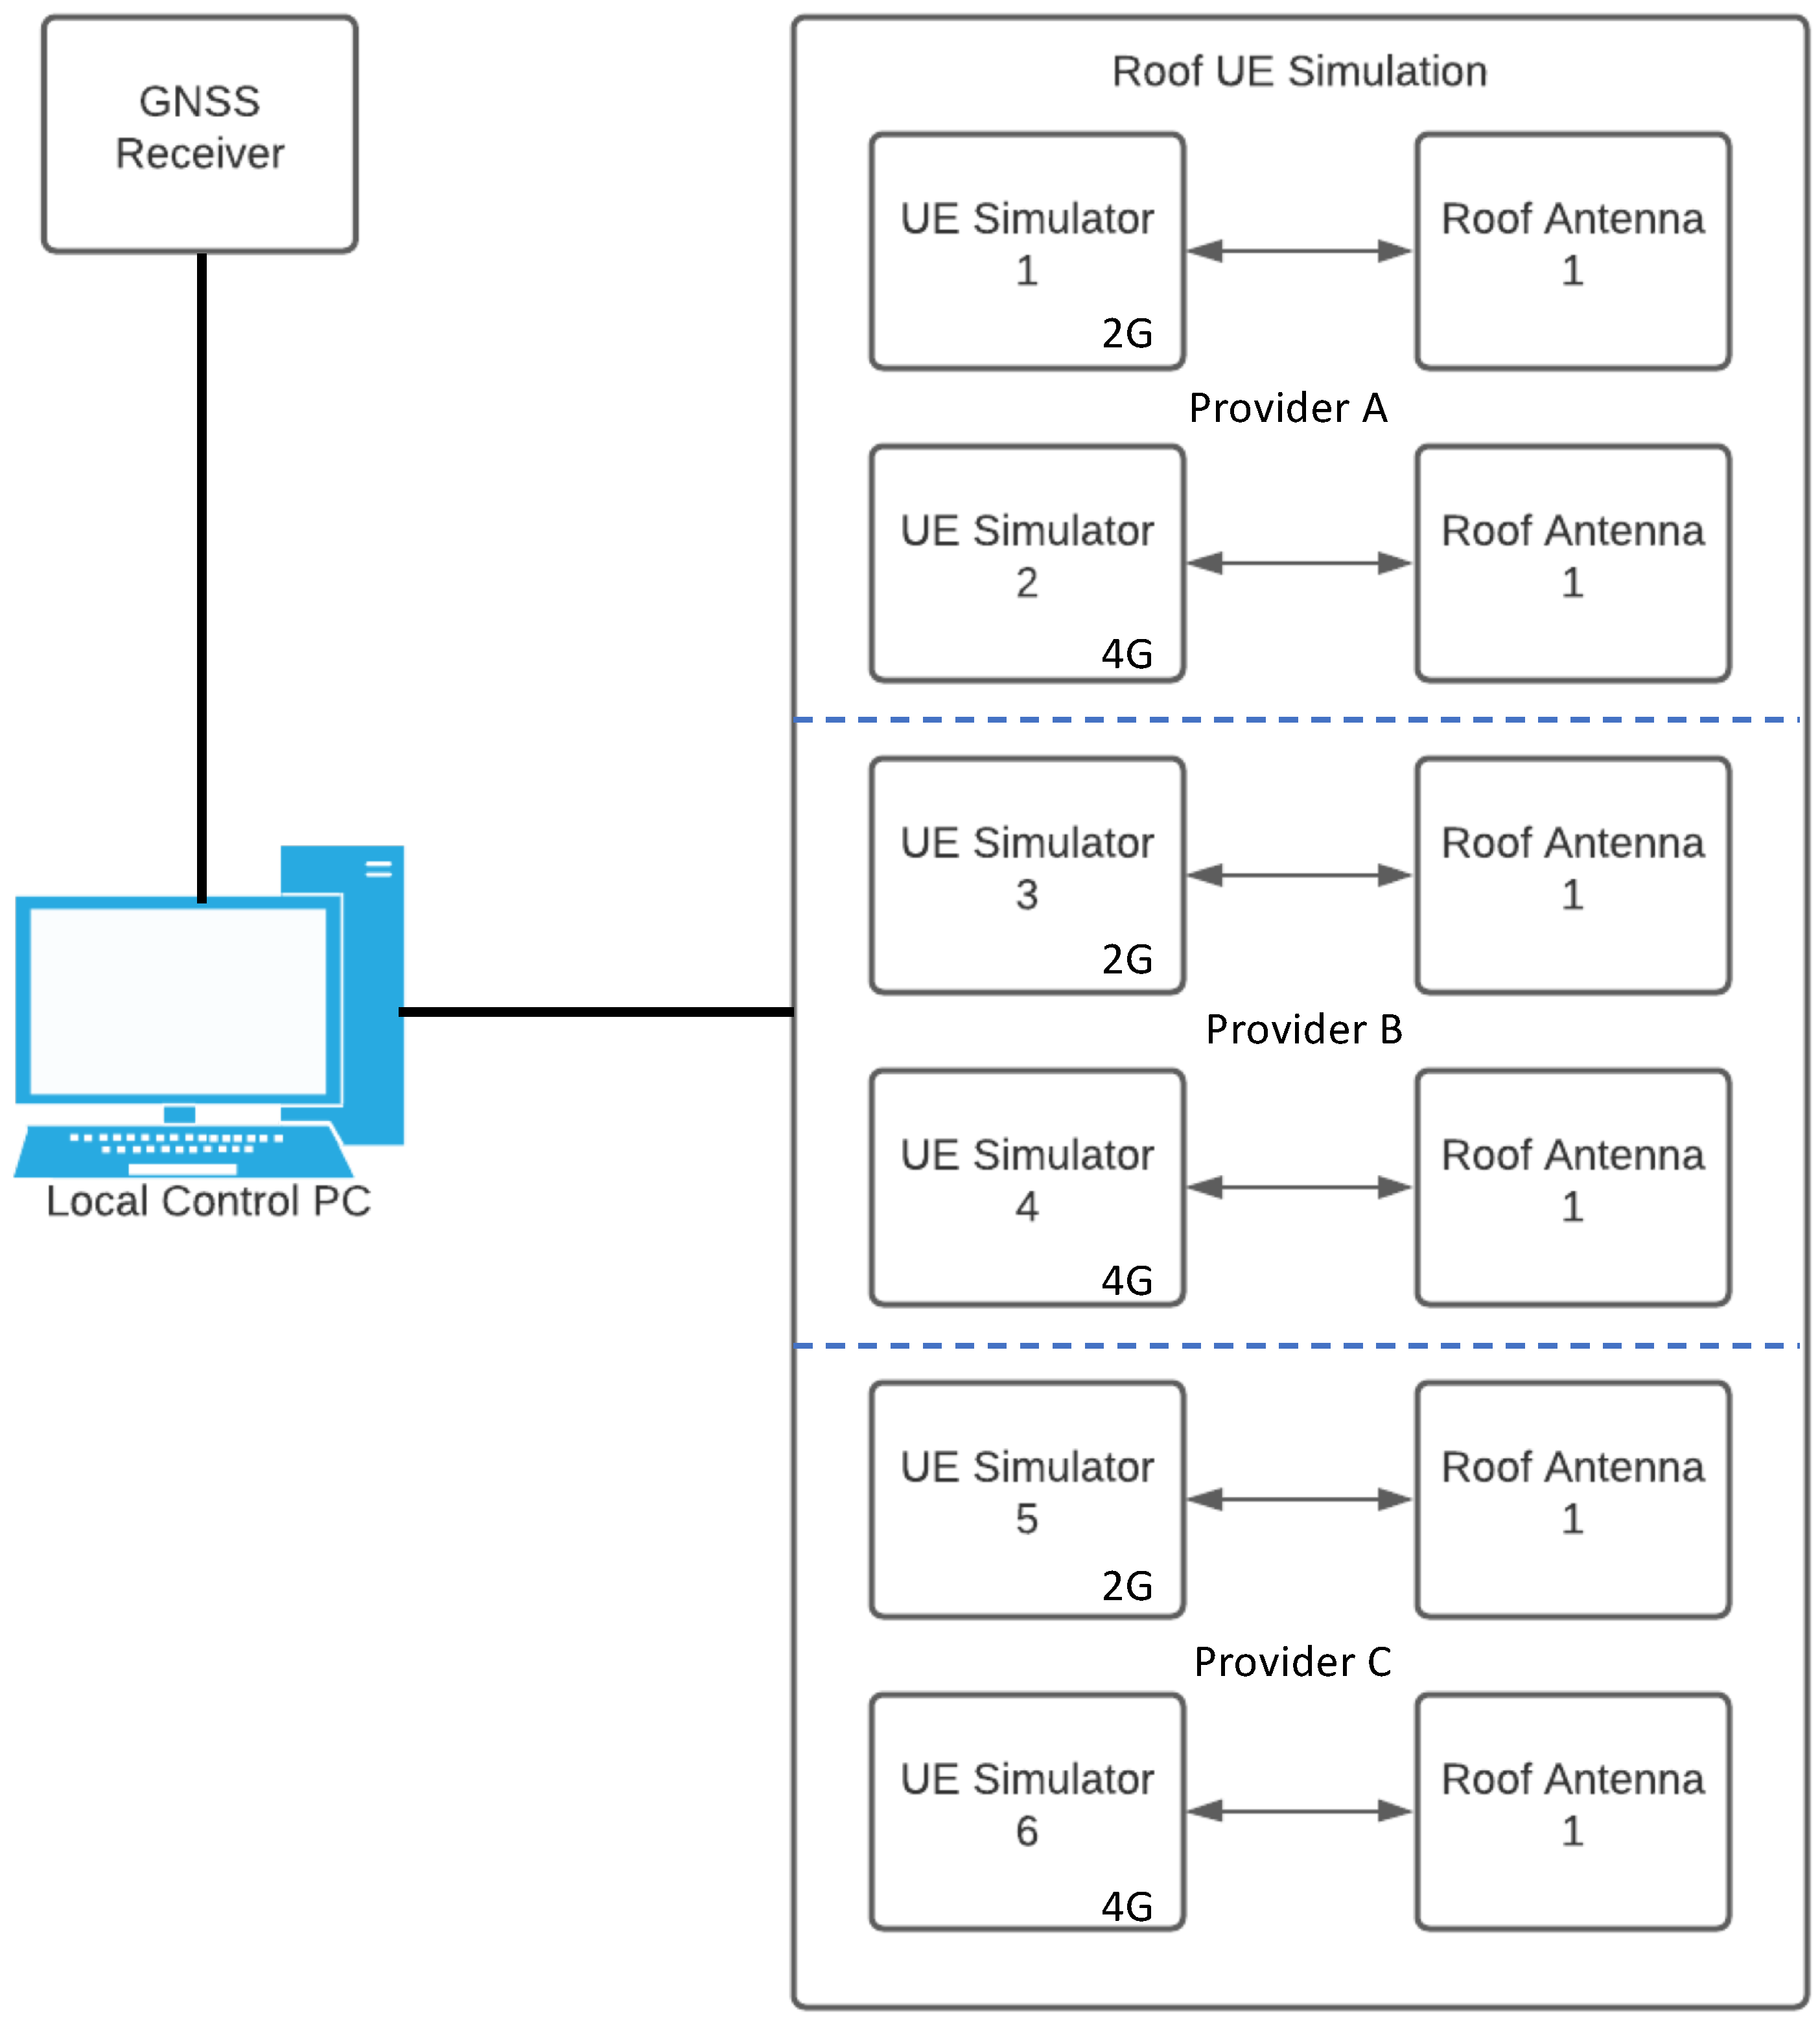
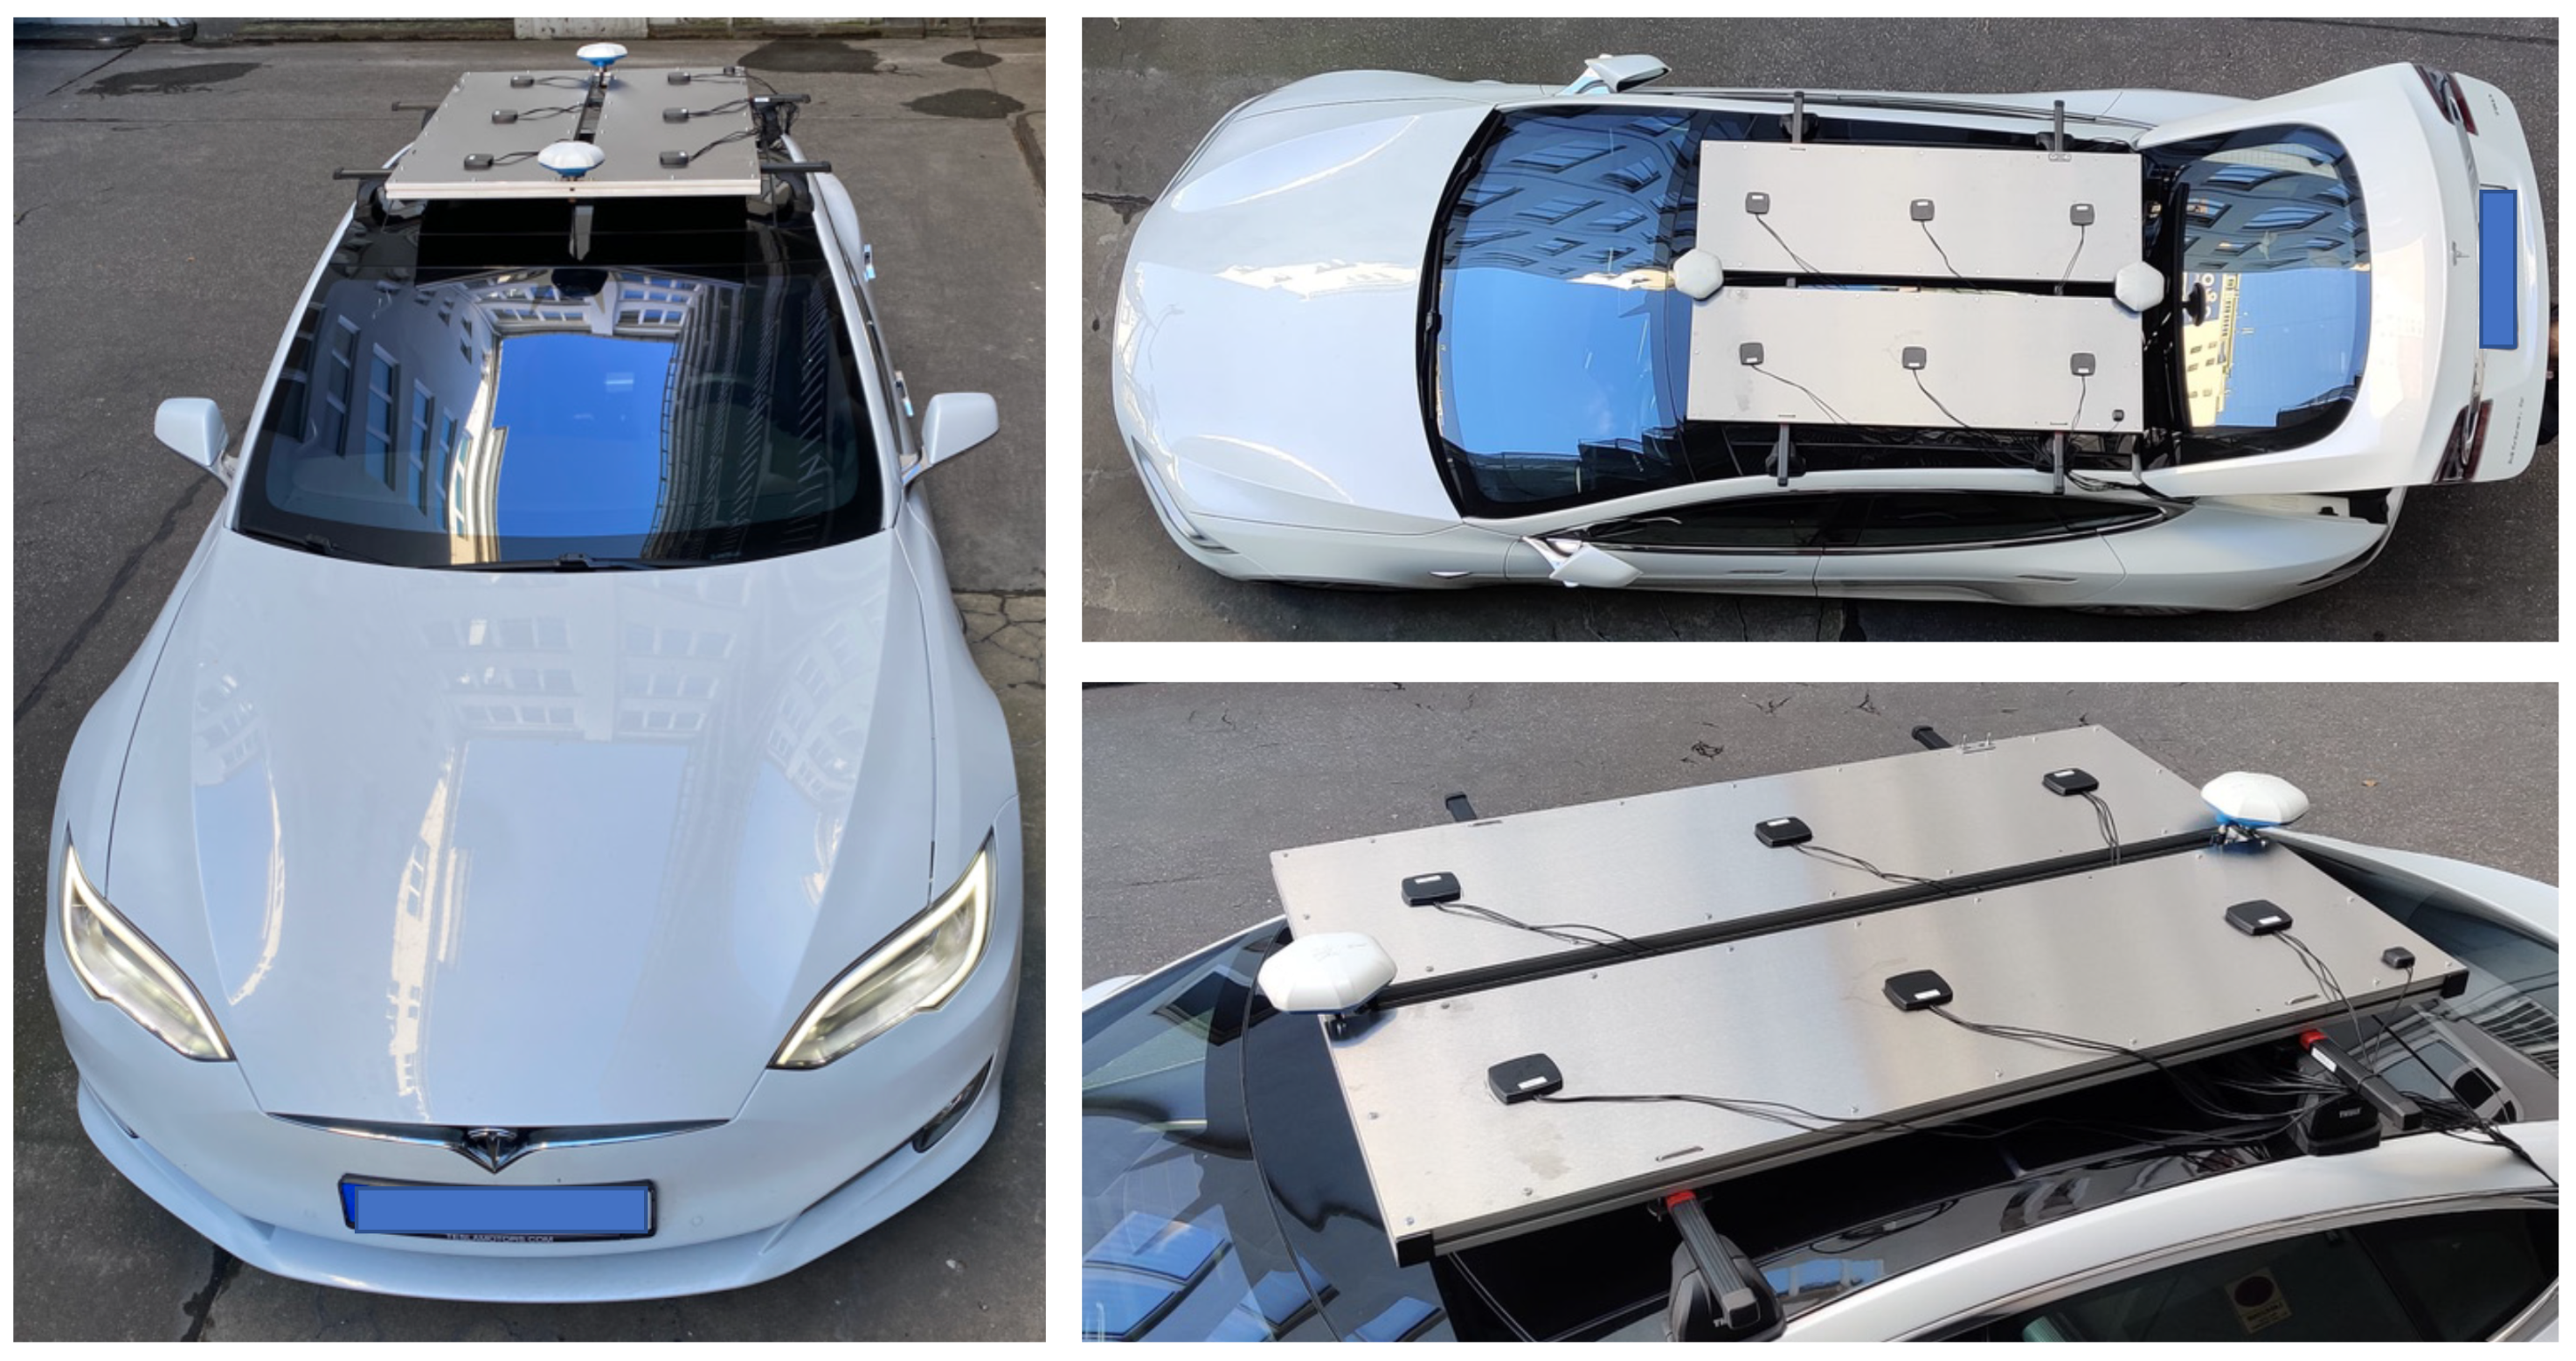
3.1. Experimental Setup

The system in Figure 1 consists of six independent measurement units, each comprising of a standard LTE modem connected to a microcontroller board, and separate power supplies. Each unit is connected to its own roof antenna as indicated in Figure 2. The antennas are set up on a defined, conductive steel surface with sufficient distance to minimize cross-coupling effects. With this setup, parallel measurement of three providers with two technologies each is possible. For this study, a subset of two providers and LTE (4G) technology was chosen. All measurement units and an independent GNSS module are connected to a mobile personal computer to collect and save data during the measurements. The relevant measurement parameters are summarized in Table 3. Since 3G service has been terminated in Germany in 2021 and the roll-out of 5G is still ongoing, the measurement setup provides a good balance between cost, complexity, and benefit.

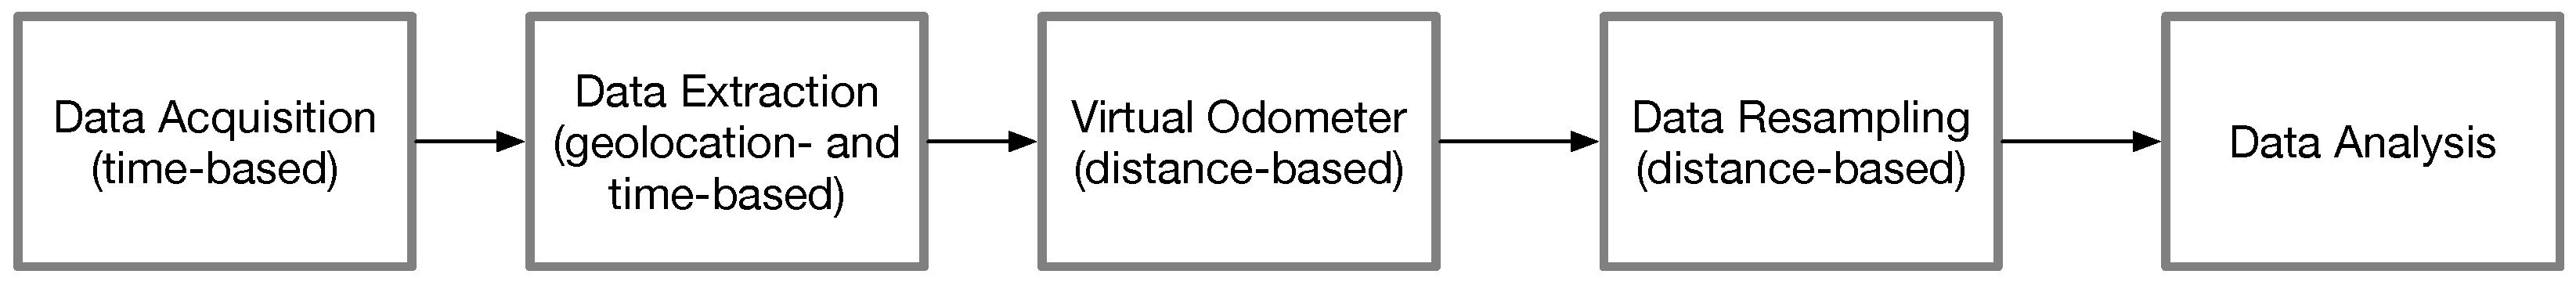
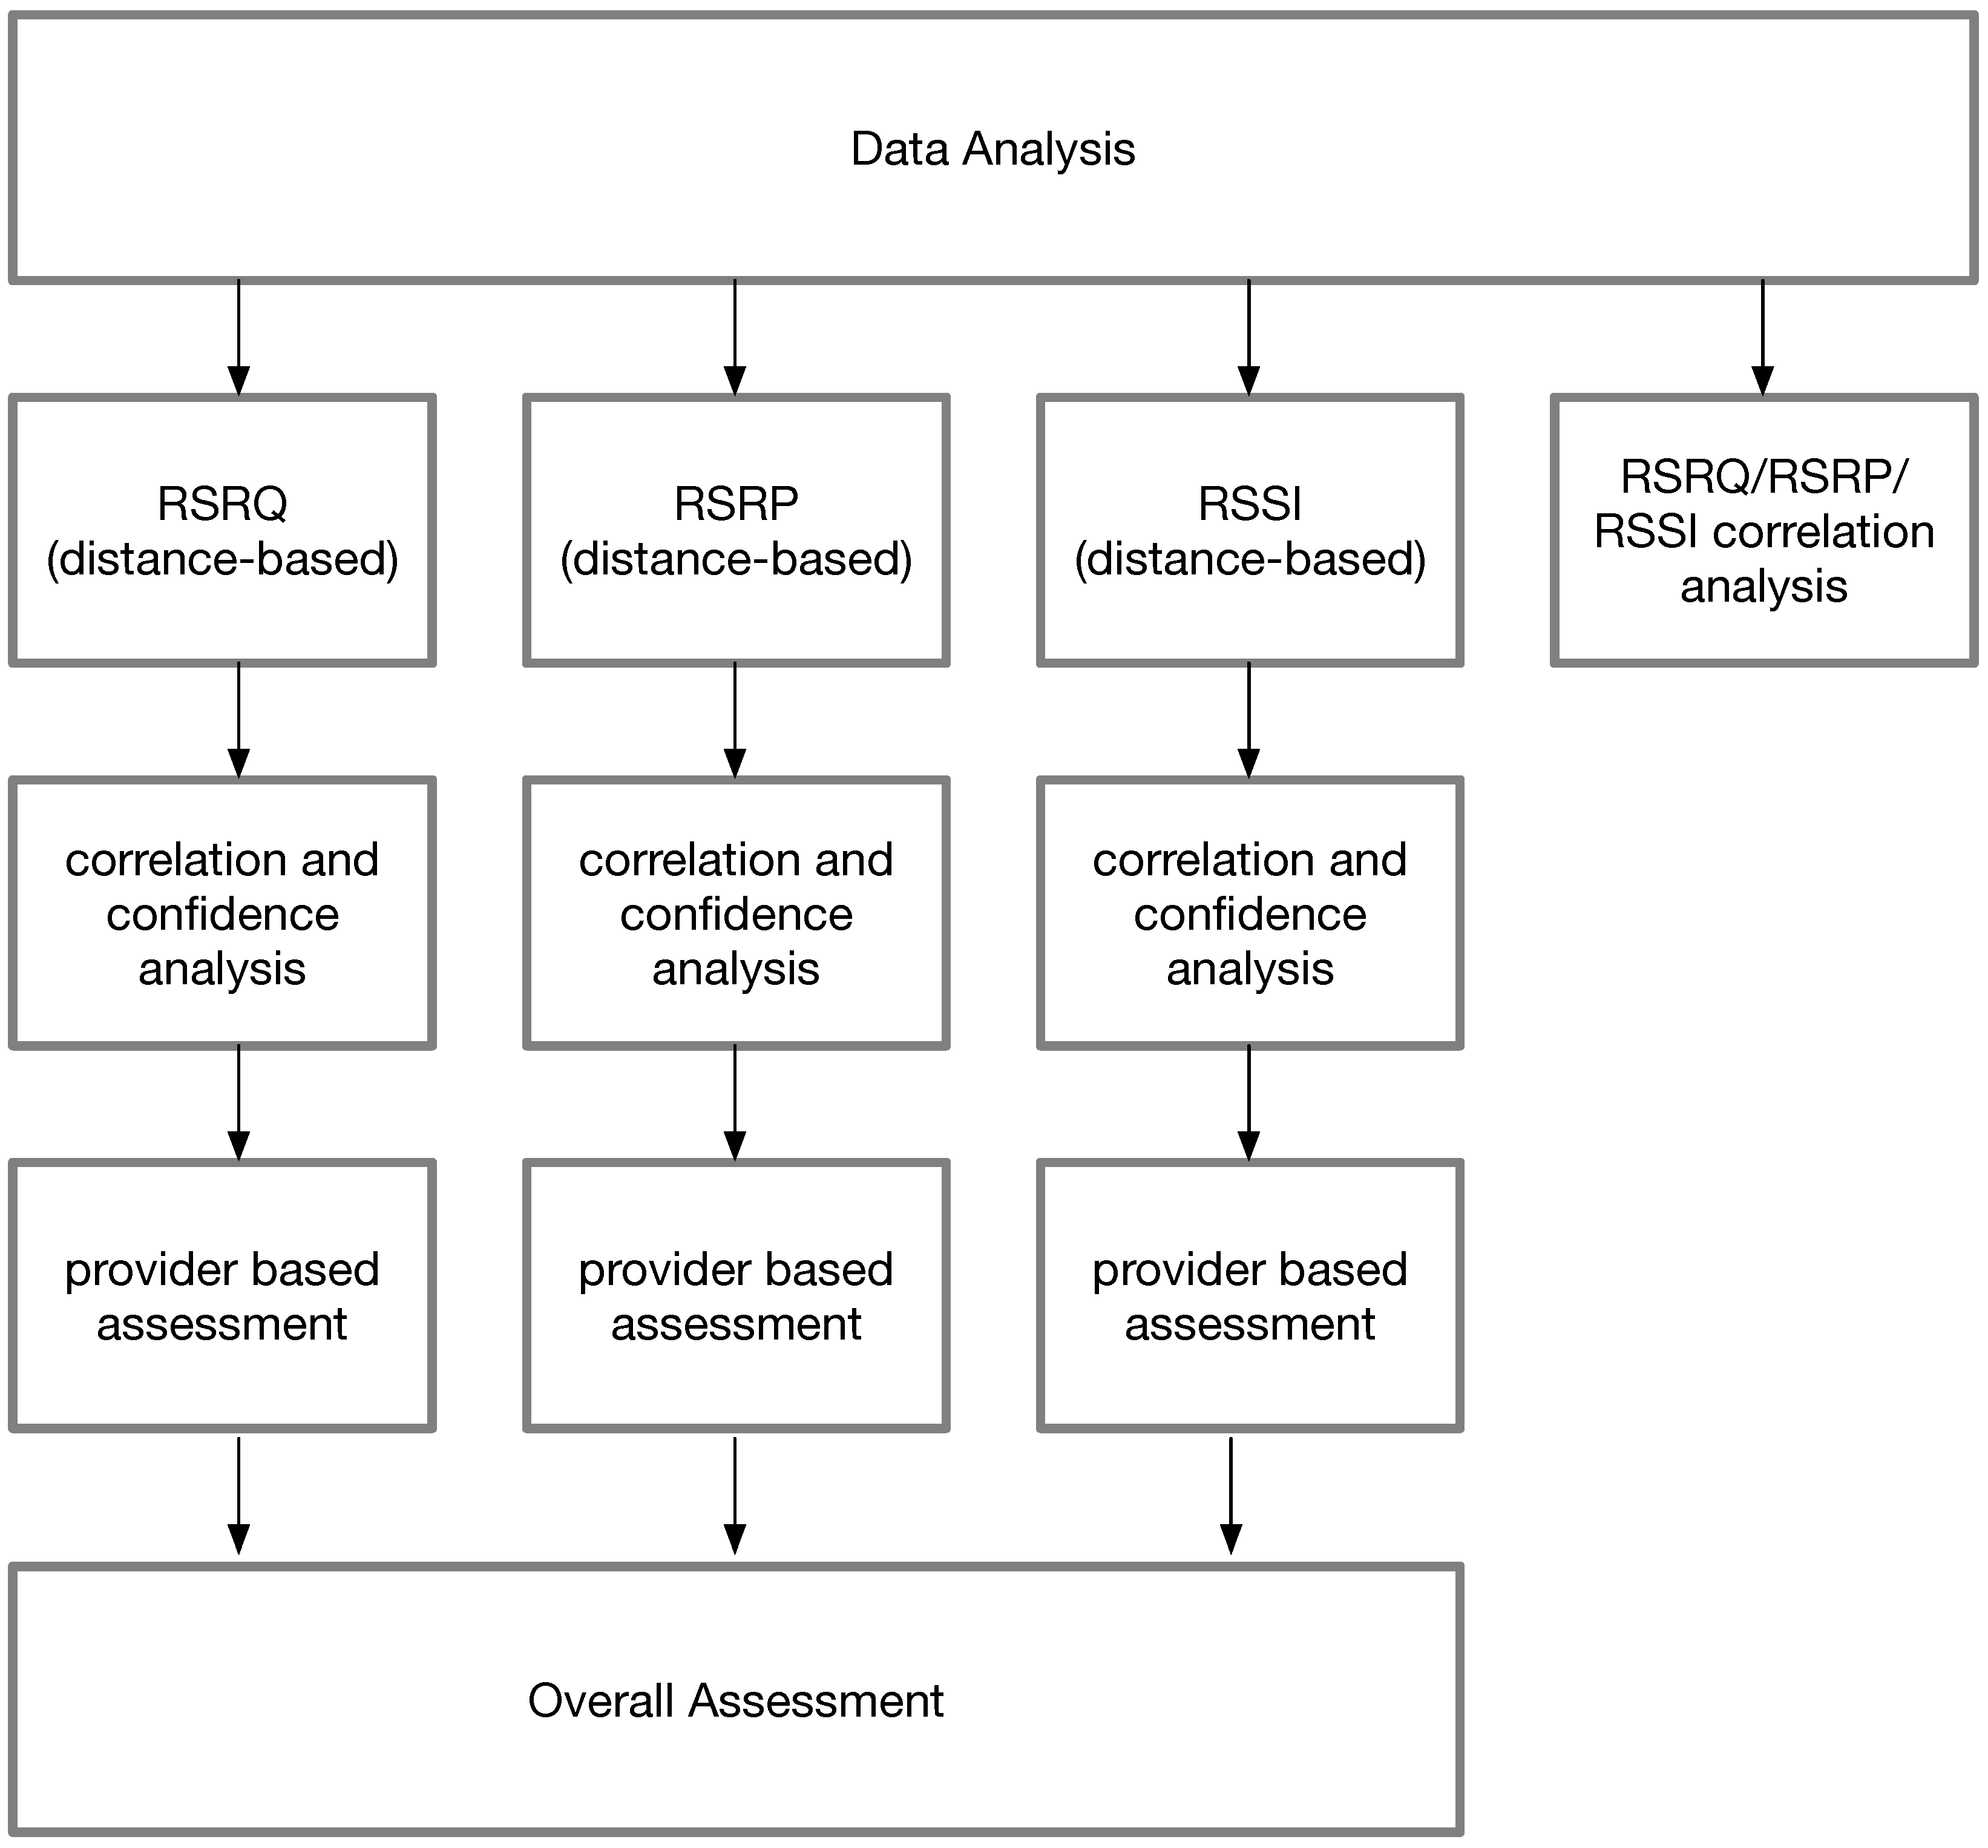
3.2. Data Preparation and Analysis Flow

The dataset was prepared as indicated in Figure 3. The data was measured with a timestamp and contained latitude and longitude information as summarized in Table 3. The area of interest was marked by its latitude and longitude range. The respective timestamps were identified and the relevant data was extracted. The dataset was transformed from a two-dimensional, latitude/longitude base to a one-dimensional, virtual-odometer base to simplify the following steps and allow comparative analysis. Special care was taken to ensure that the extracted data contained exactly the same start and endpoint. Since the data were collected at various speeds resulting in various distances between the actual measurement points, the data points were resampled with a constant distance interval of one meter. Missing data points were filled in based on linear interpolation.
The prepared data were analyzed based on the flow presented in Figure 4. A spatial correlation was performed for RSRQ, RSRP, and RSSI to check the degree of consistency for independent measurements of the same parameters. In the next step, an assessment for each provider was performed followed by a comparative analysis of the overall assessment. To check the quality of the overall measurements the three measured quantities were analyzed for correlations.

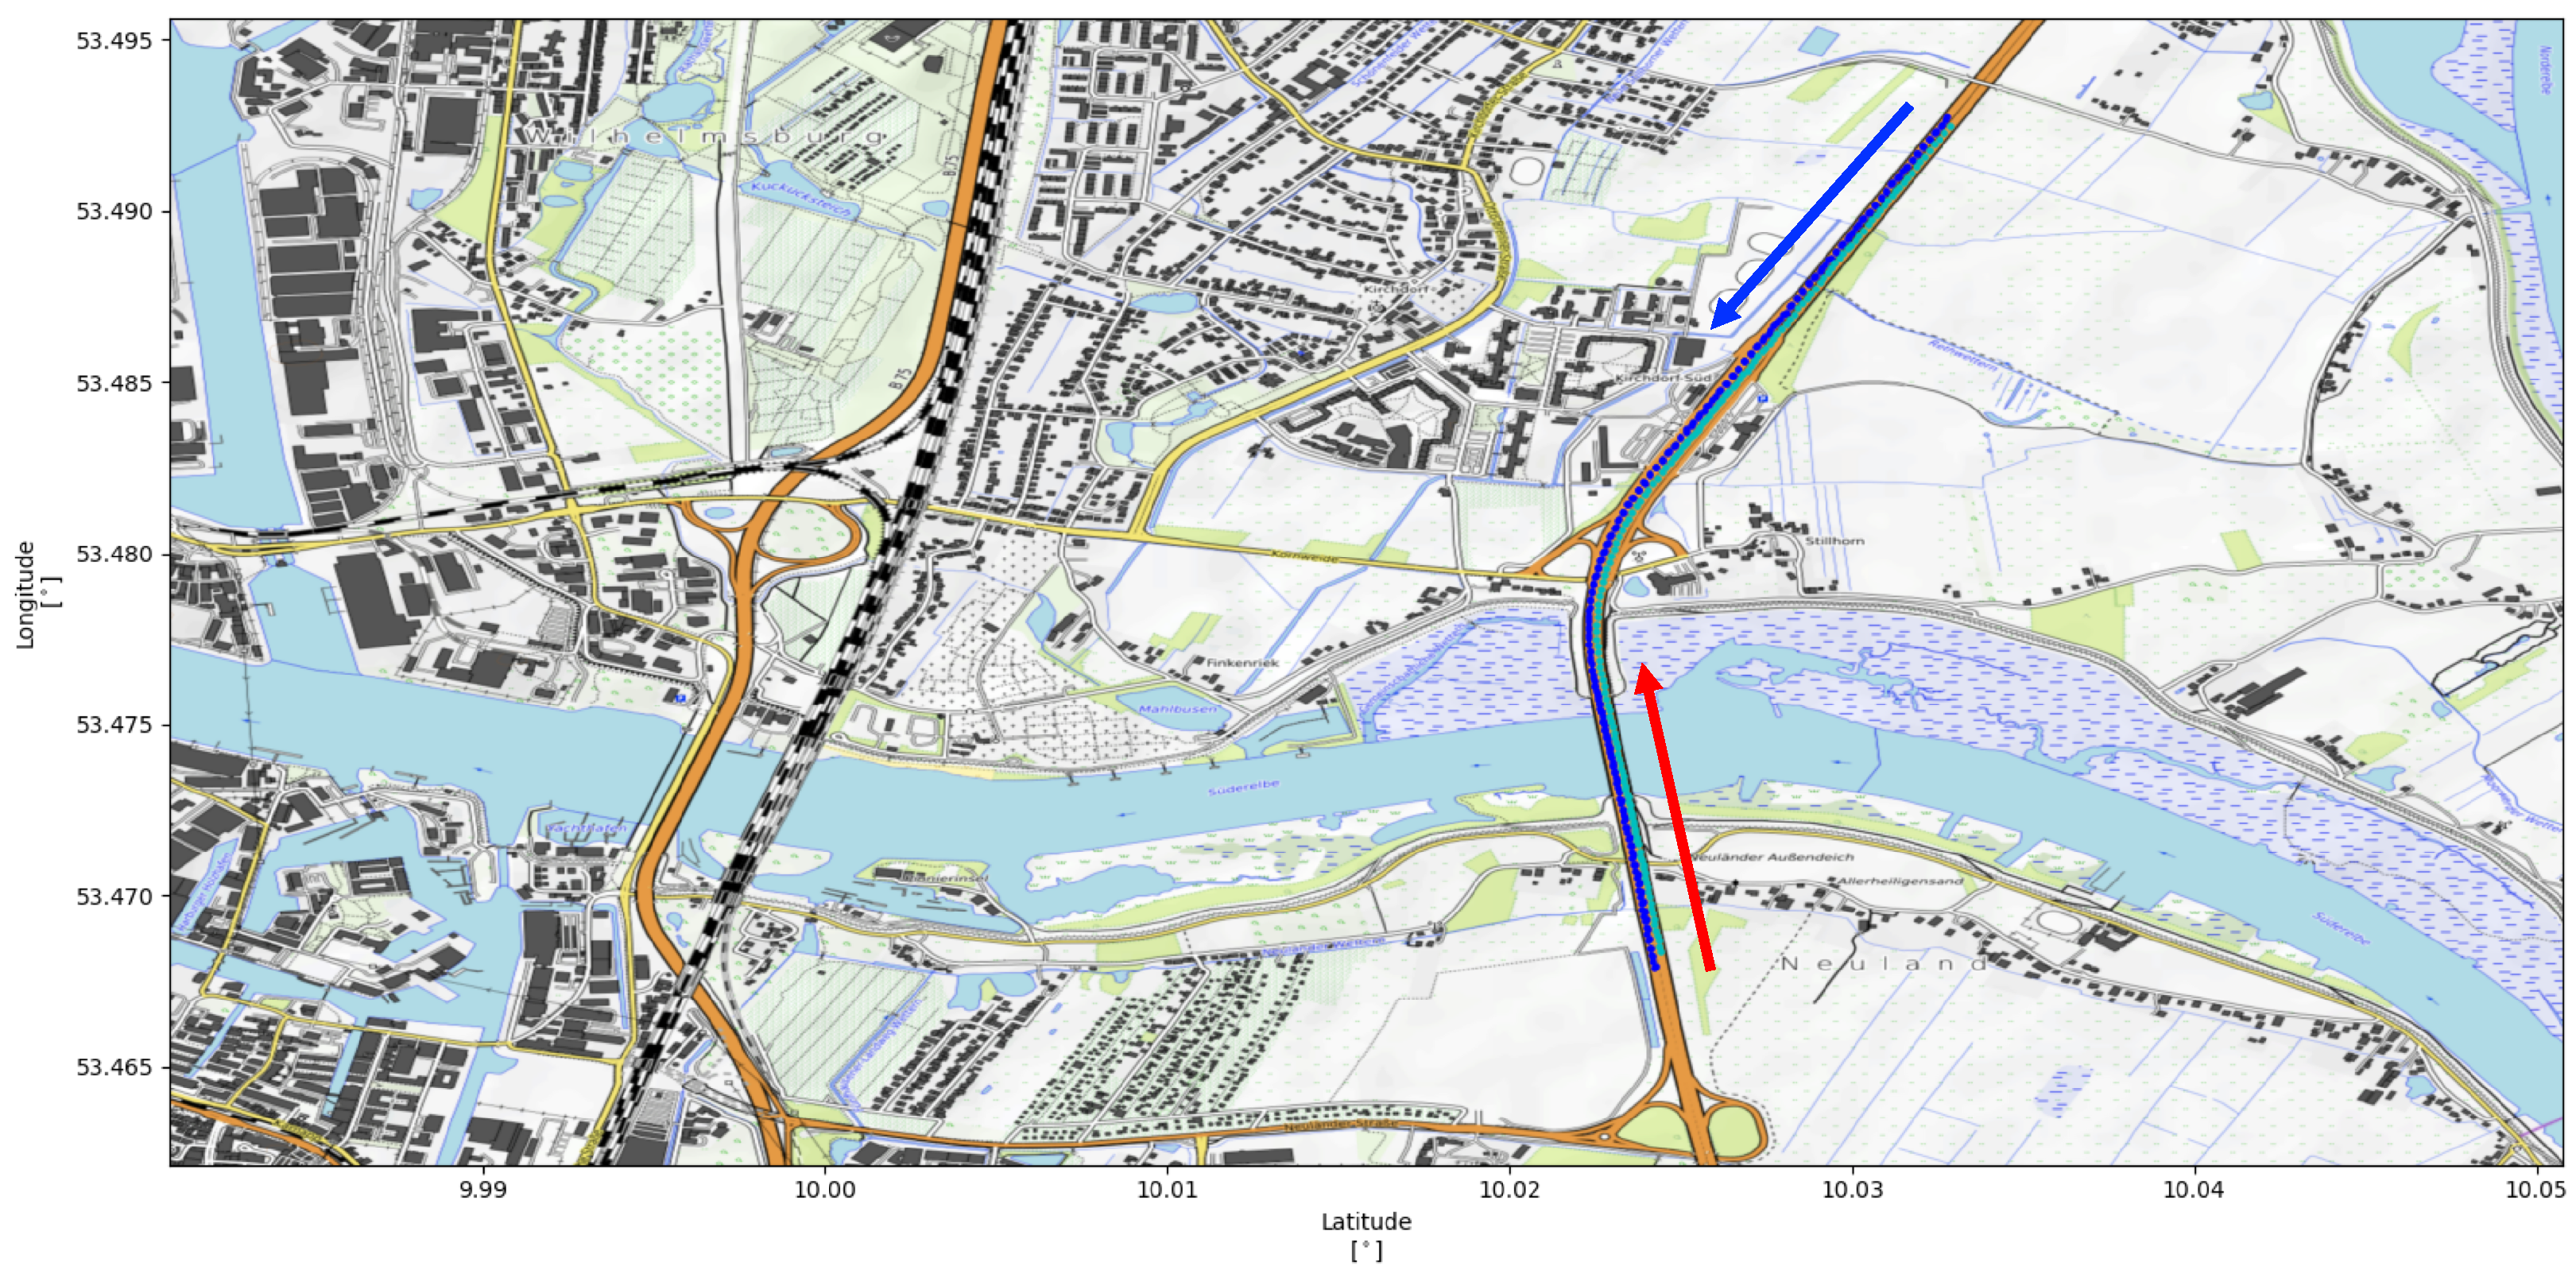
3.3. Region of Analysis

A dataset was extracted to validate and assess the performance of the measurement method, which contained information on several independent measurements obtained based on different experimental parameters. The region of analysis is marked in Figure 5. The length of the analyzed distance of highway A1 in the south of the City of Hamburg is 3 km. The typical speed was set to 90 km/h. However, the actual speed across all measurements varied between 45 km/h and 120 km/h because of the traffic variation on the highway. The highway under analysis was assessed in both directions, on different days, and at different times of day.

4. Results

The measurement results were visualized, assessed, and evaluated based on the scheme presented in Table 4, which is based on [38].

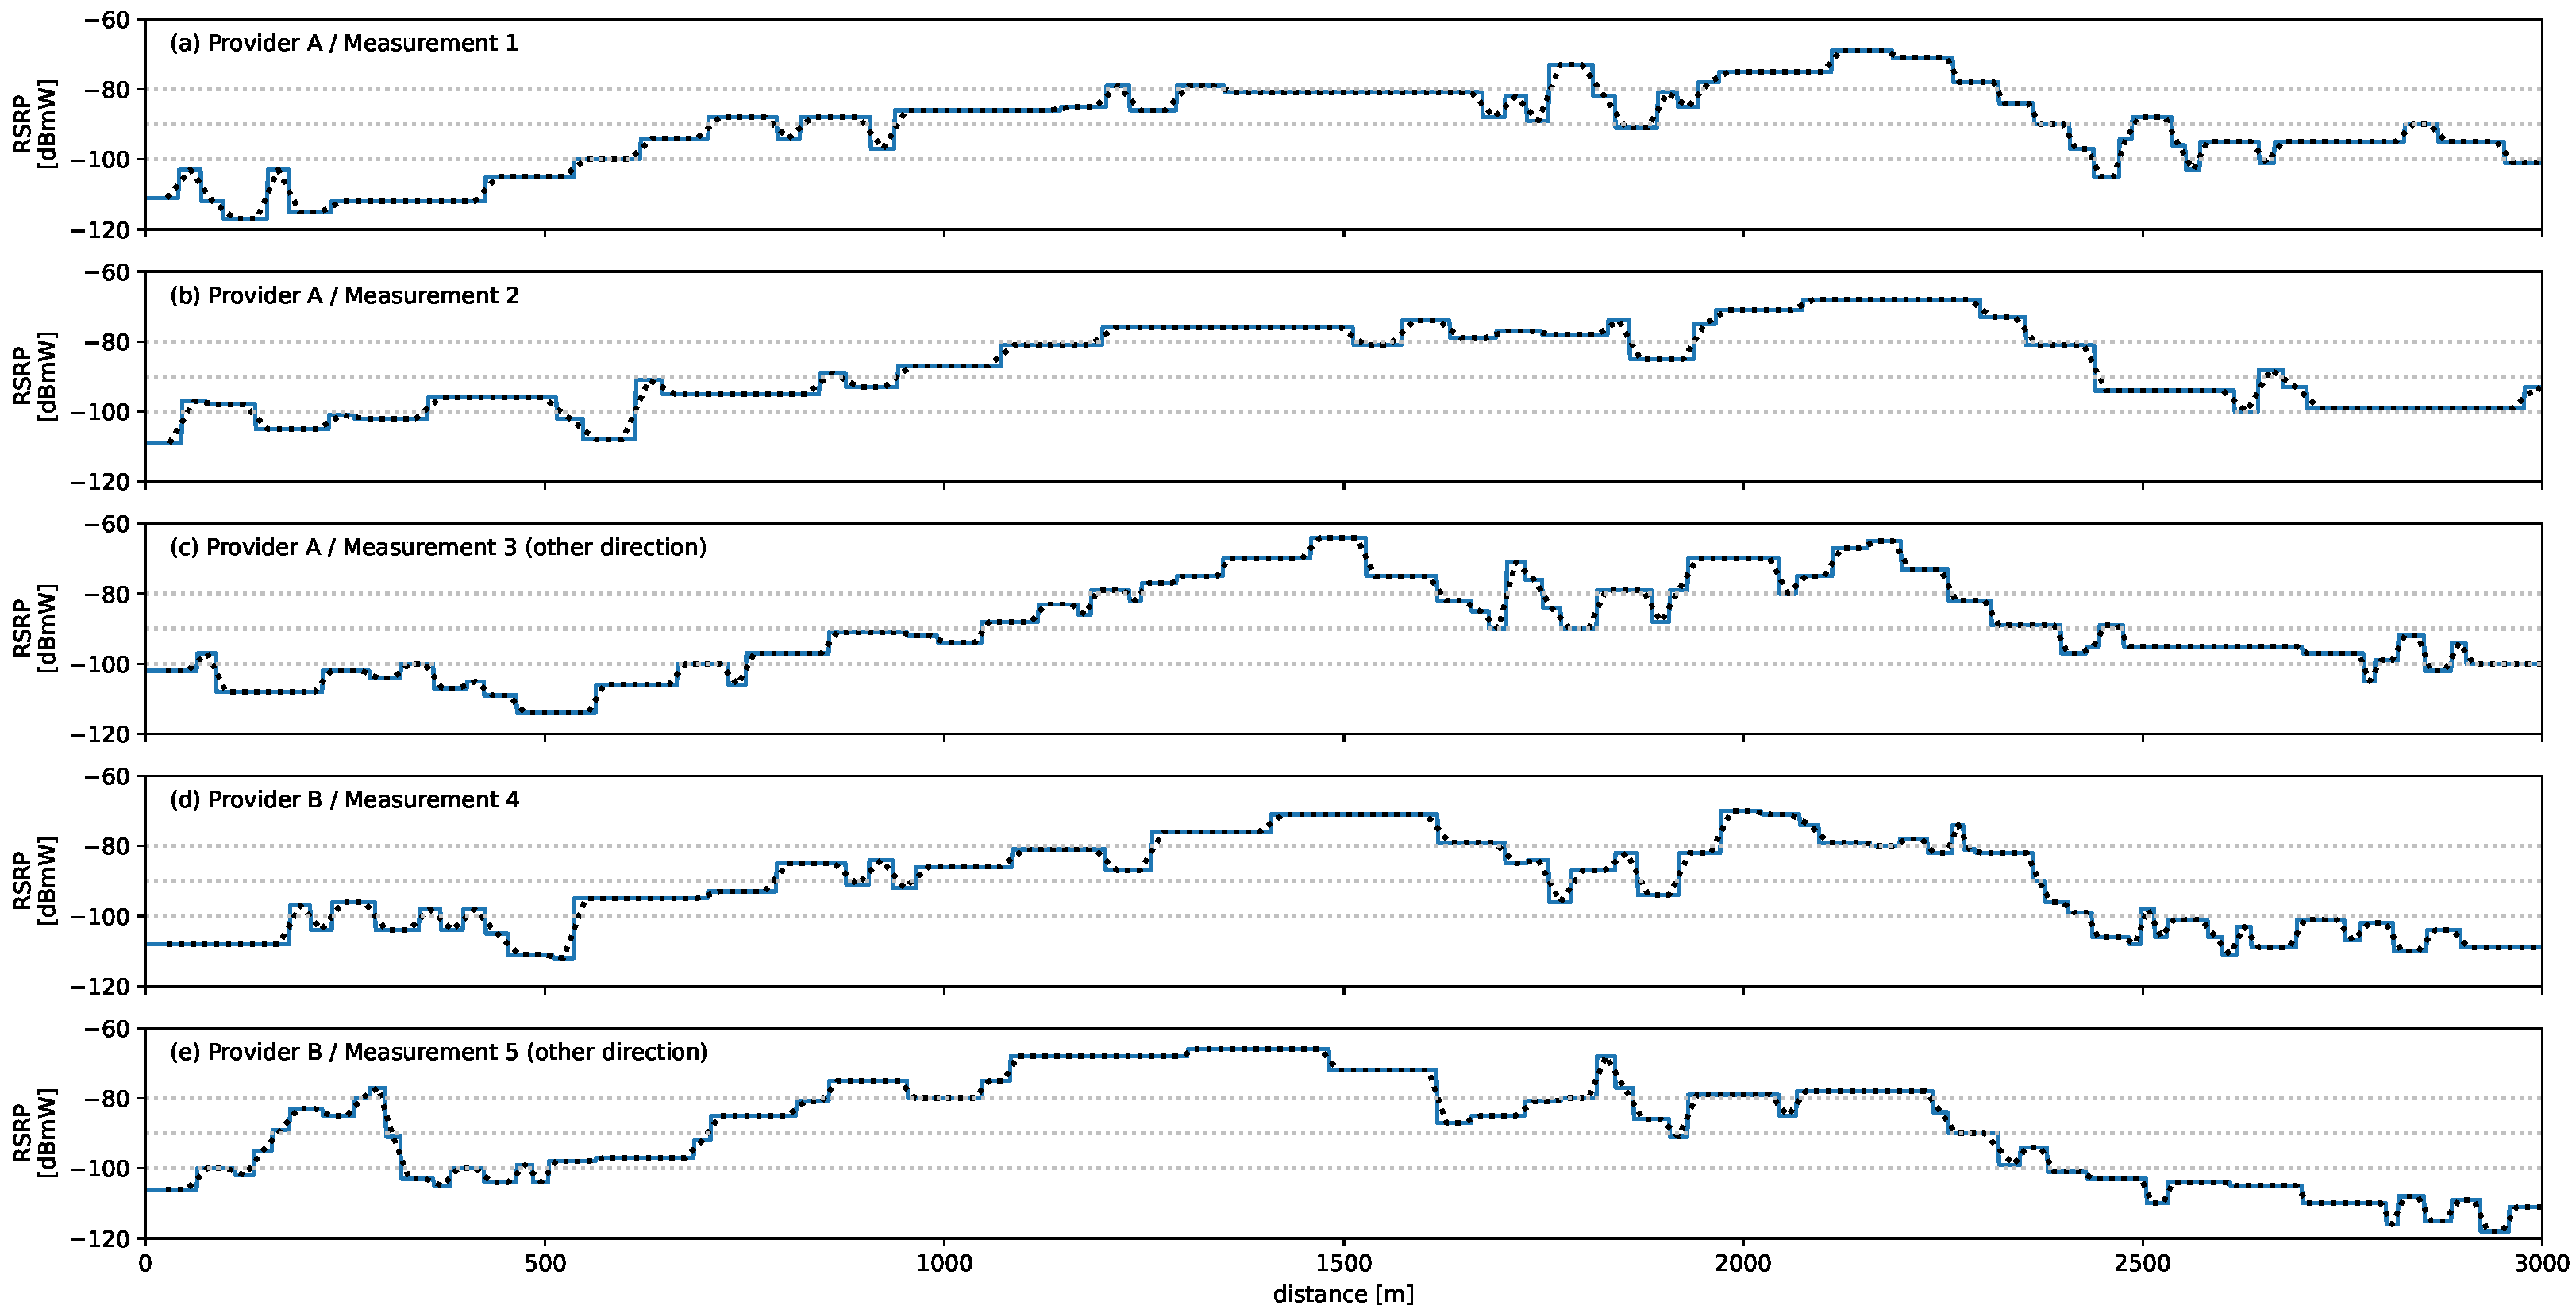
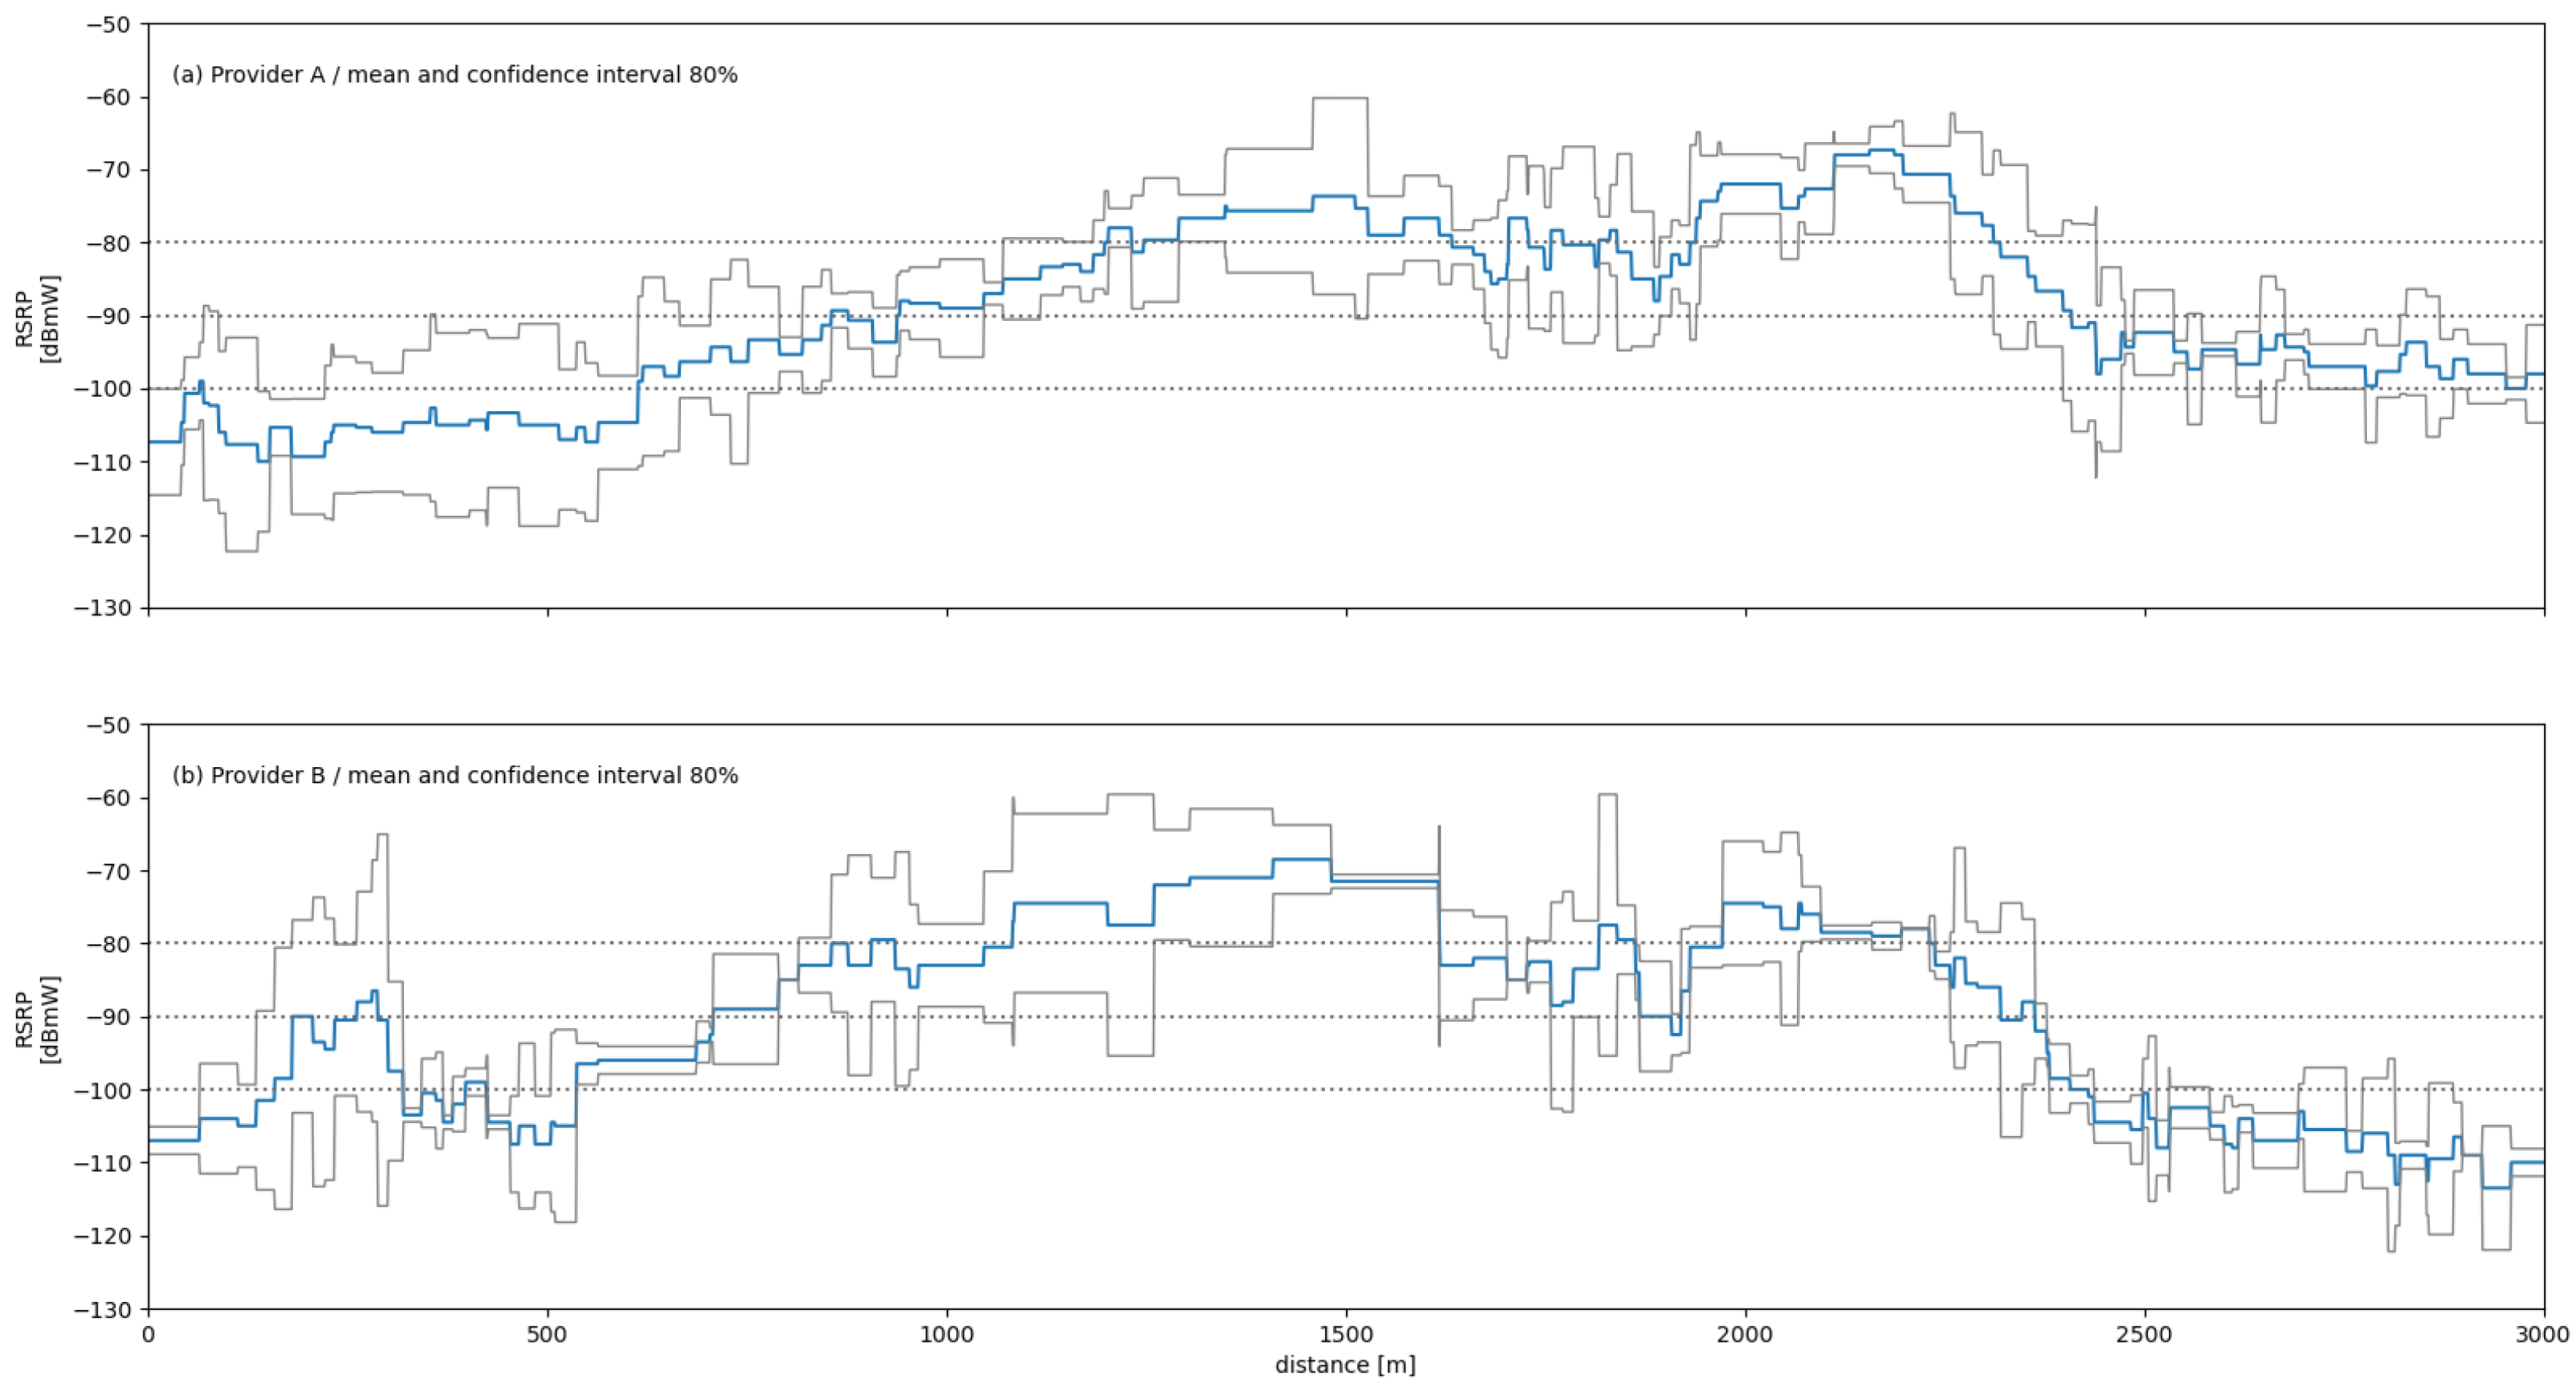
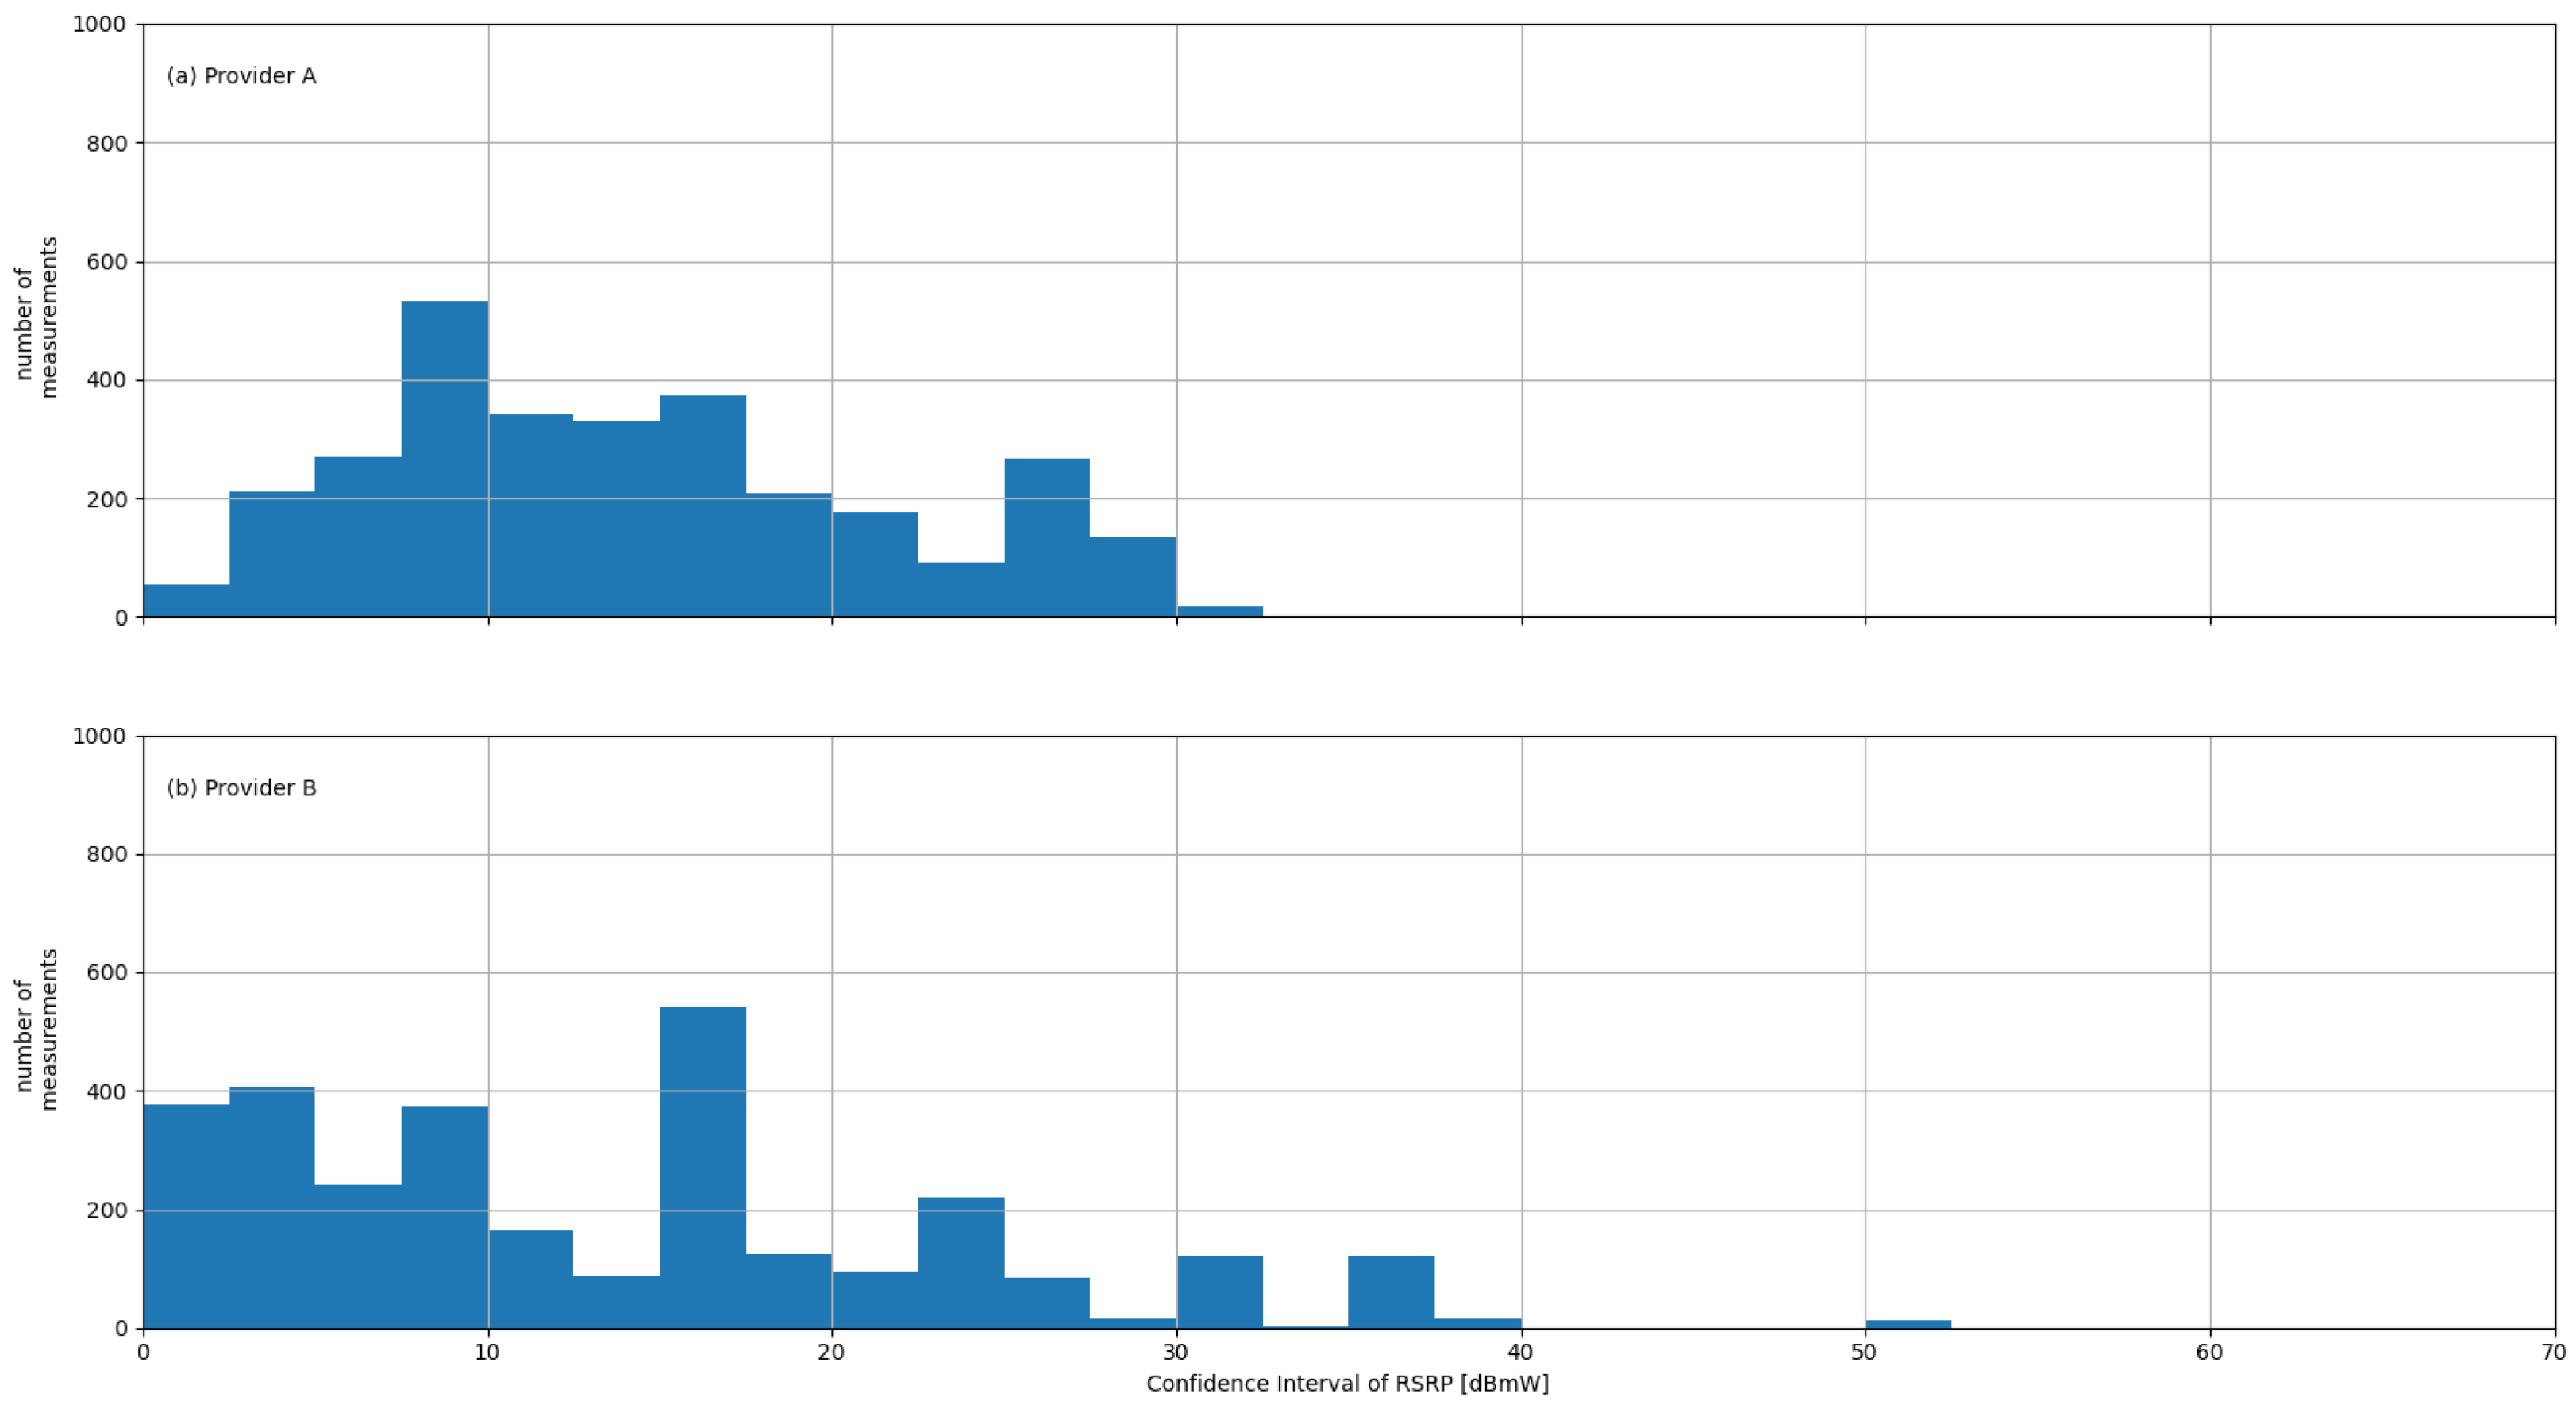
4.1. RSRP Measurements

The results of the RSRP measurements as a function of the distance are visualized in Figure 6. The plots (a), (b), and (c) show the results for provider A, with data taken at different times and for both directions. In plots (d) and (e) the RSRP has been logged for two independent test drives covering both directions for provider B. Each of these measurements has been spatially correlated with all others to check consistency for a single provider and prove sufficient differentiation between different providers. The result of this analysis is presented in Table 5. While repeated measurements under various conditions including speed, direction, and time of day indicate a spatial correlation 0.8 < s c < 0.9 , a value of s c 0.8 is found when correlating measurements for different providers.
The average of the RSRP for each position was calculated for each provider. The results are shown in Figure 7. Furthermore, the confidence interval for a confidence of 0.8 was calculated and included. When comparing Figure 7a, based on three measurements, to Figure 7b, based on two measurements, the reduction of the width of the confidence interval due to the higher number of measurements is obvious.
The width of the confidence intervals has been included in a histogram in Figure 8 to allow further analysis. Though the distributions are different in their overall characteristic, the mean values of the widths of the confidence intervals are almost identical at 14 dBmW (Figure 8a) and 13 dBmW (Figure 8b), respectively. A significant variance across different measurements for identical positions is expected if the system is connected to different network cells while performing the measurement.
The measurement shown in Figure 6 has been evaluated based on the criteria in Table 4 and the result is presented in Table 6. It indicates a significant number of measurements with RSRP < −100 dBmW for both providers, which is assessed as “risk of disconnect or no signal” (Table 4). However, for provider A the coverage is better compared to provider B when comparing the range of “risk of disconnect or no signal” as indicated in Table 6. While for provider A the measurements show a “risk of disconnect or no signal” for distances between 361 m and 671 m, those for provider B indicate a range between 831 m and 949 m.

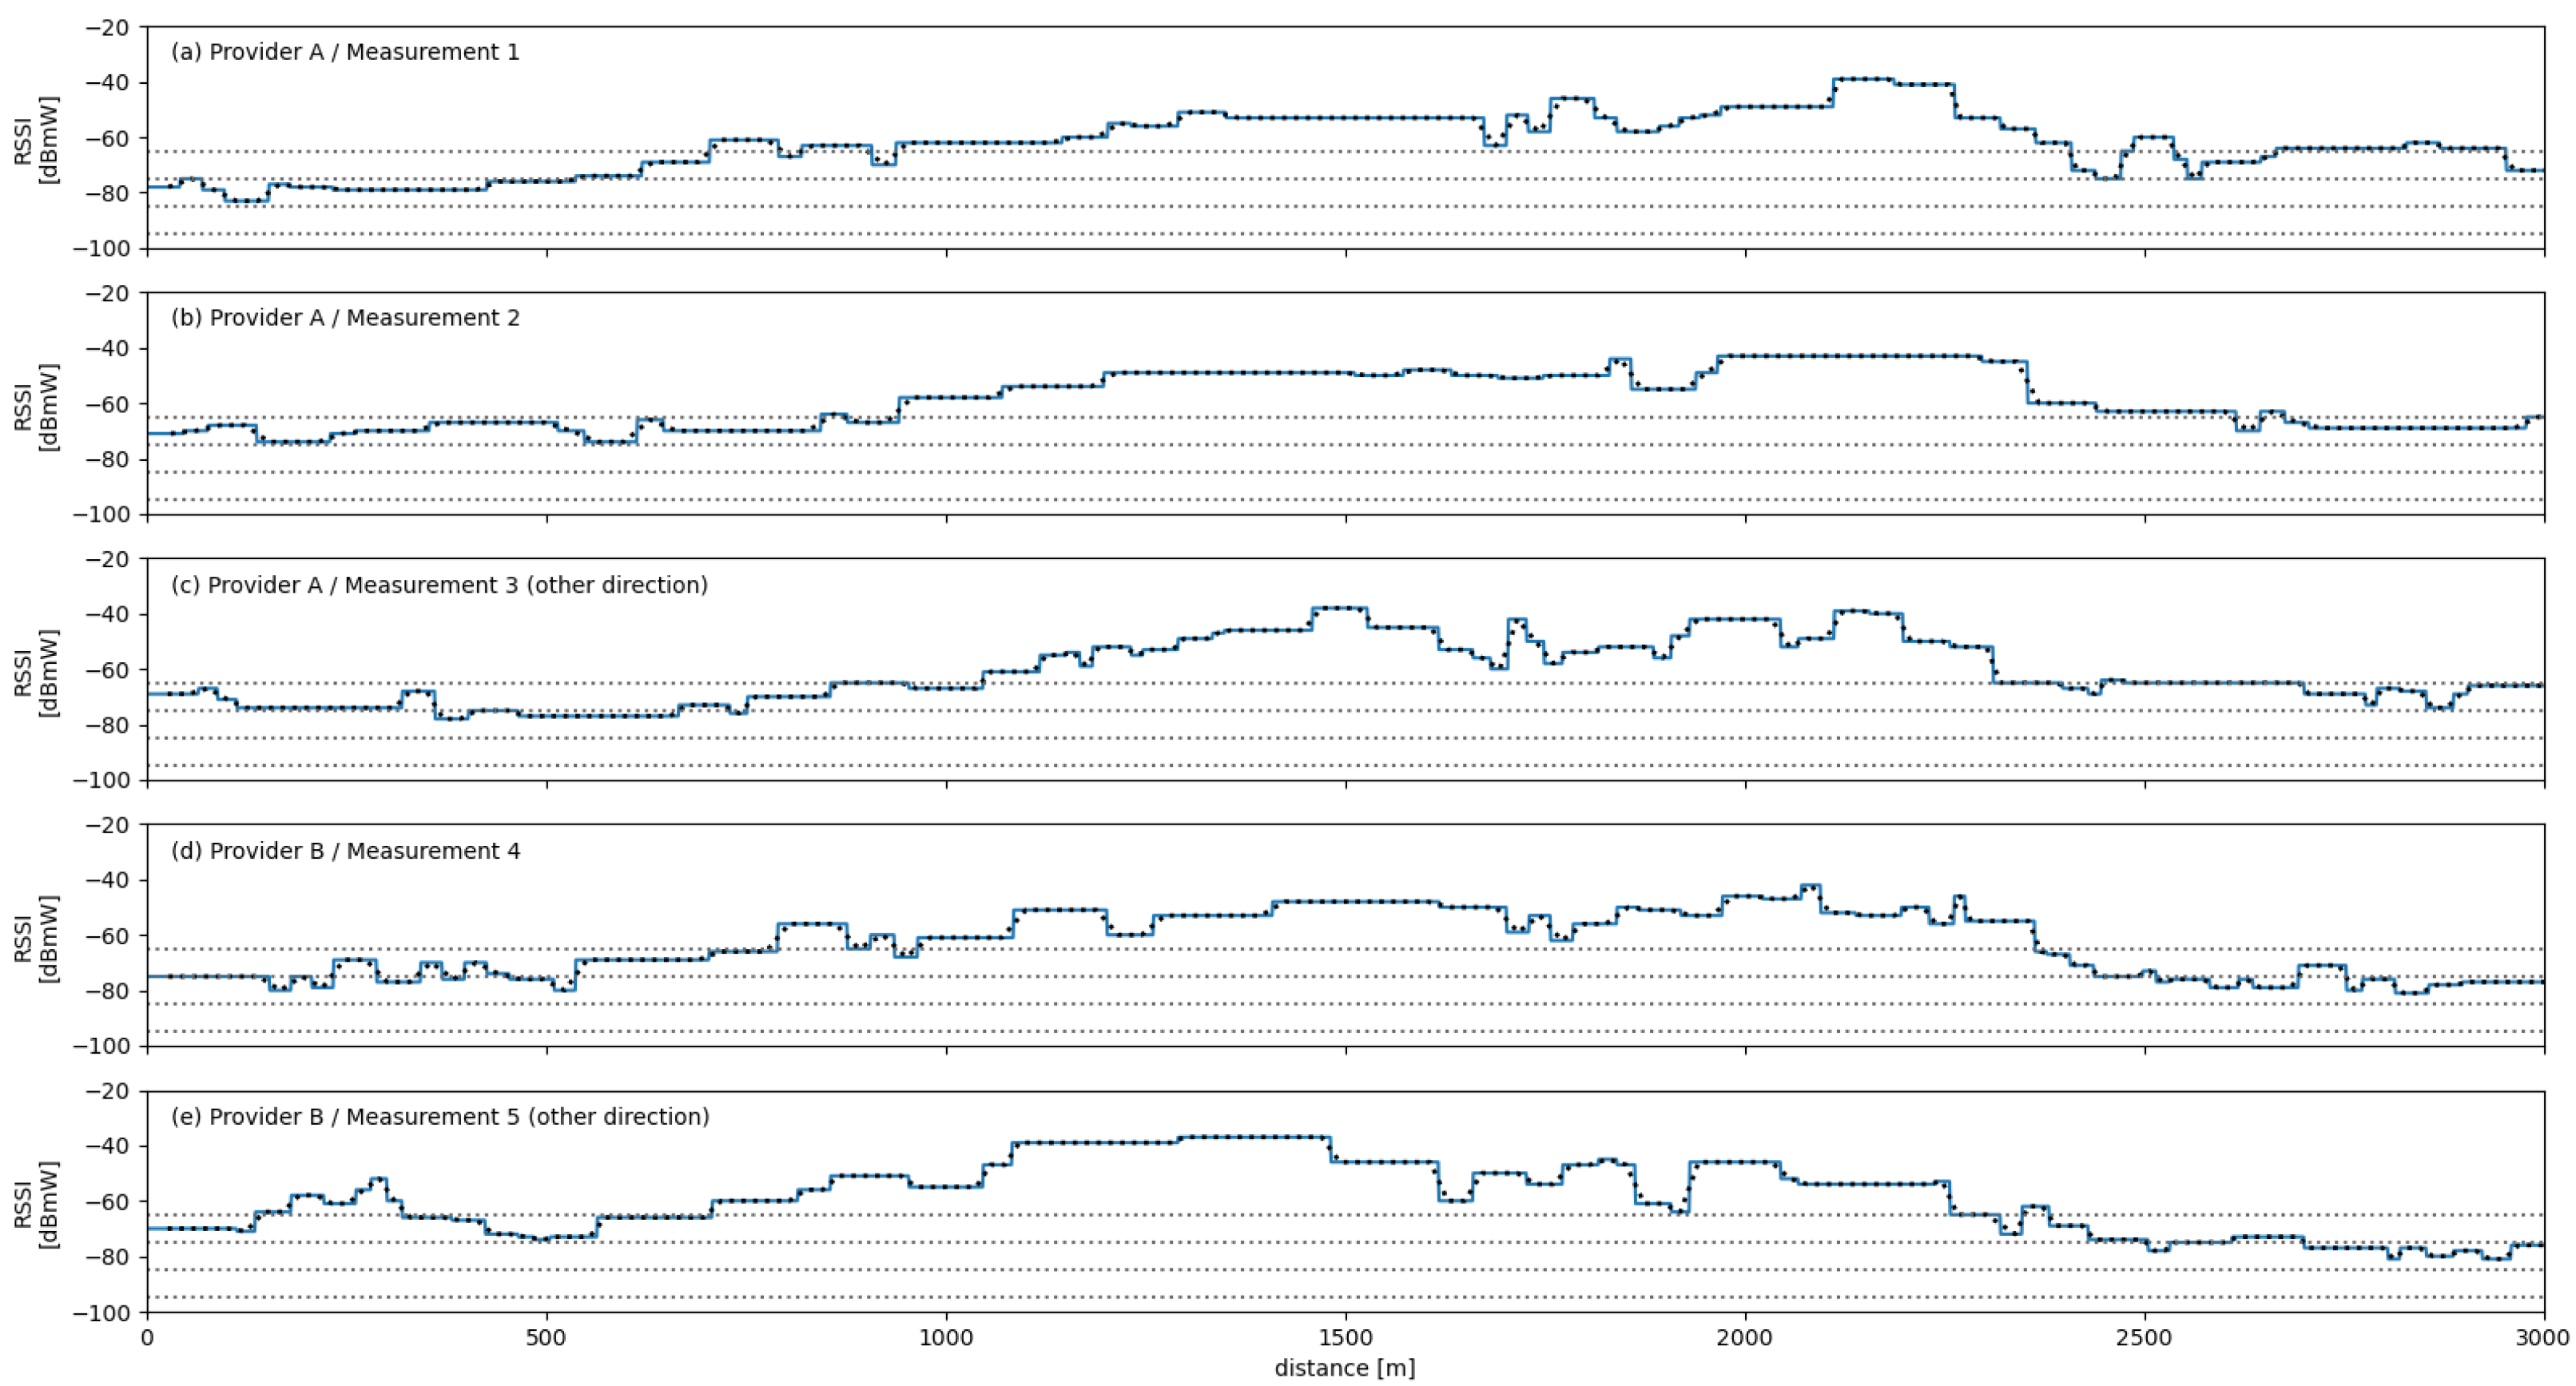
4.2. RSSI Measurements

Figure 9 shows the measurement results of the value of RSSI as a function of distance for provider A (marked as a, b, and c) and provider B (marked as d and e). The measurements presented include a variation in speed, direction, and time. Following the same approach as for RSRP, each of these measurements has been spatially correlated with all others to check consistency for a single provider and prove sufficient differentiation between different providers. The result of this analysis is presented in Table 7. While repeated measurements under various conditions including speed, direction, and time of day indicate a spatial correlation 0.8 < s c < 0.9 , a value of s c 0.8 is found correlating measurements for different providers.
The average of the RSSI value for each position was calculated for each provider. The results are shown in Figure 10. Furthermore, the confidence interval for a confidence of 0.8 was calculated and included in the figure. As in the case of the assessment of RSSI, the reduction of the width of the confidence interval due to the higher number of measurements is obvious when comparing Figure 10a to Figure 10b.
The measurement shown in Figure 9 has been evaluated based on the criteria in Table 4 and the result is presented in Table 8. In contrast to the evaluation of RSRP, the RSSI indicates at least fair to poor coverage for the full range. Nevertheless, provider A delivers better performance than provider B in the overall assessment of RSSI.

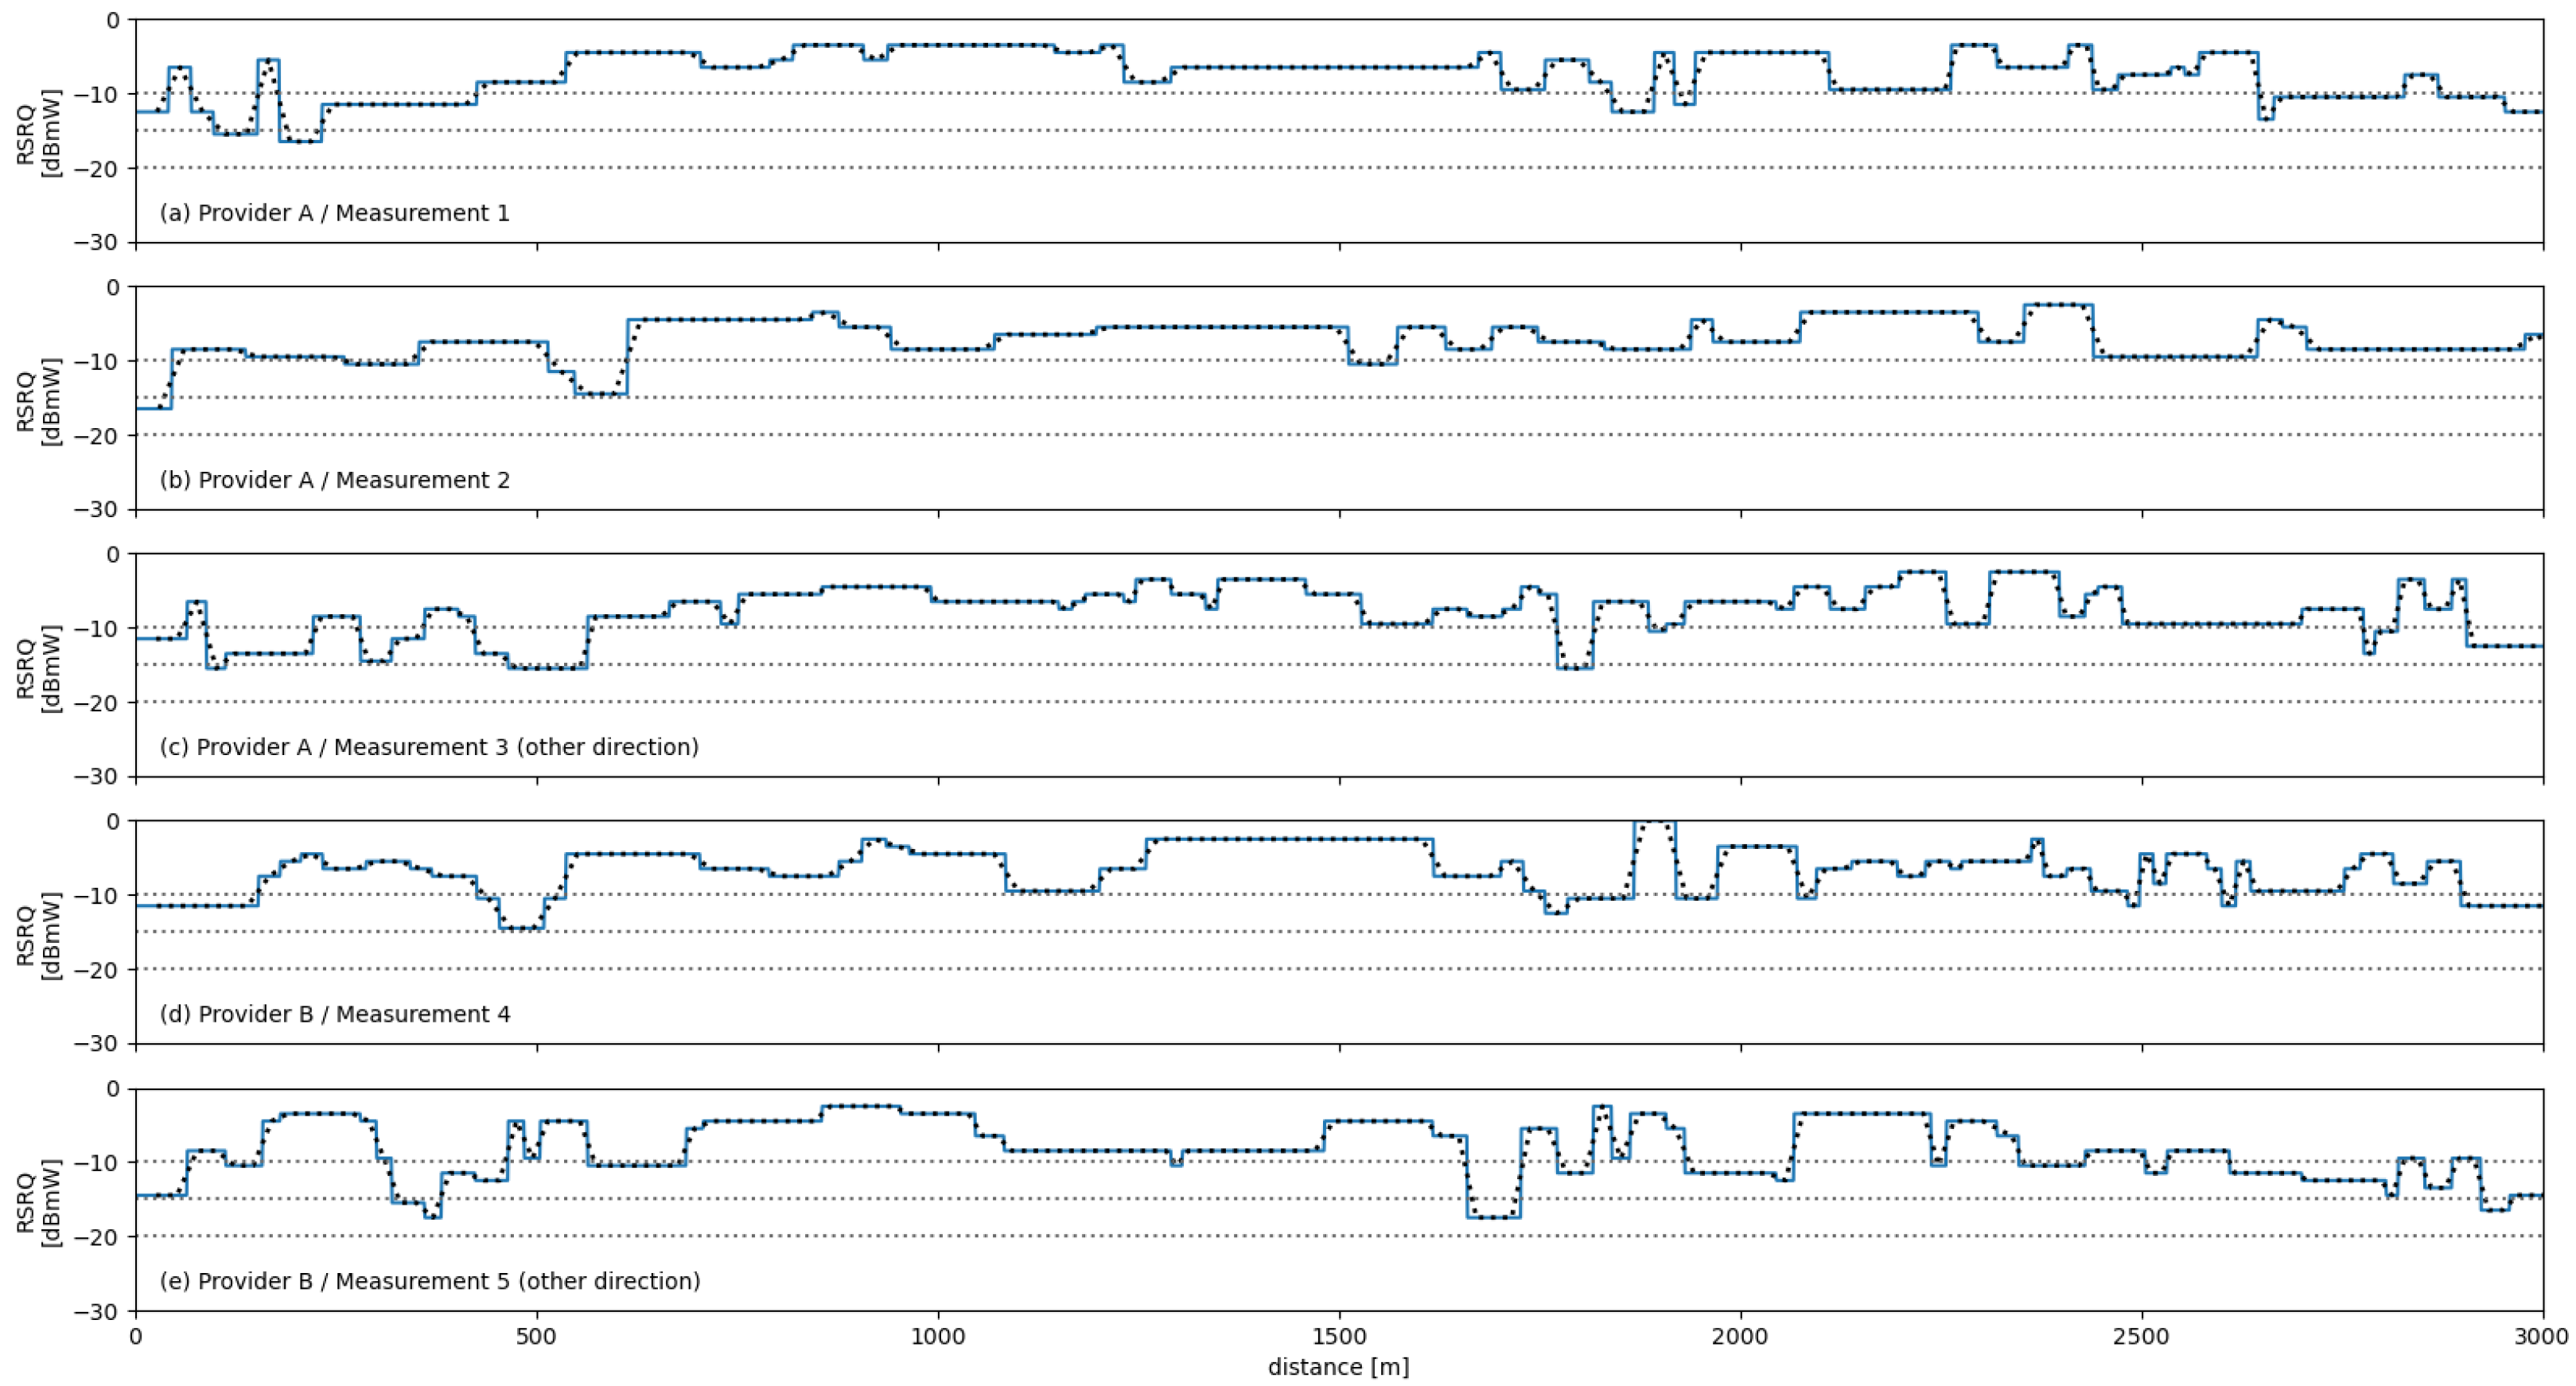
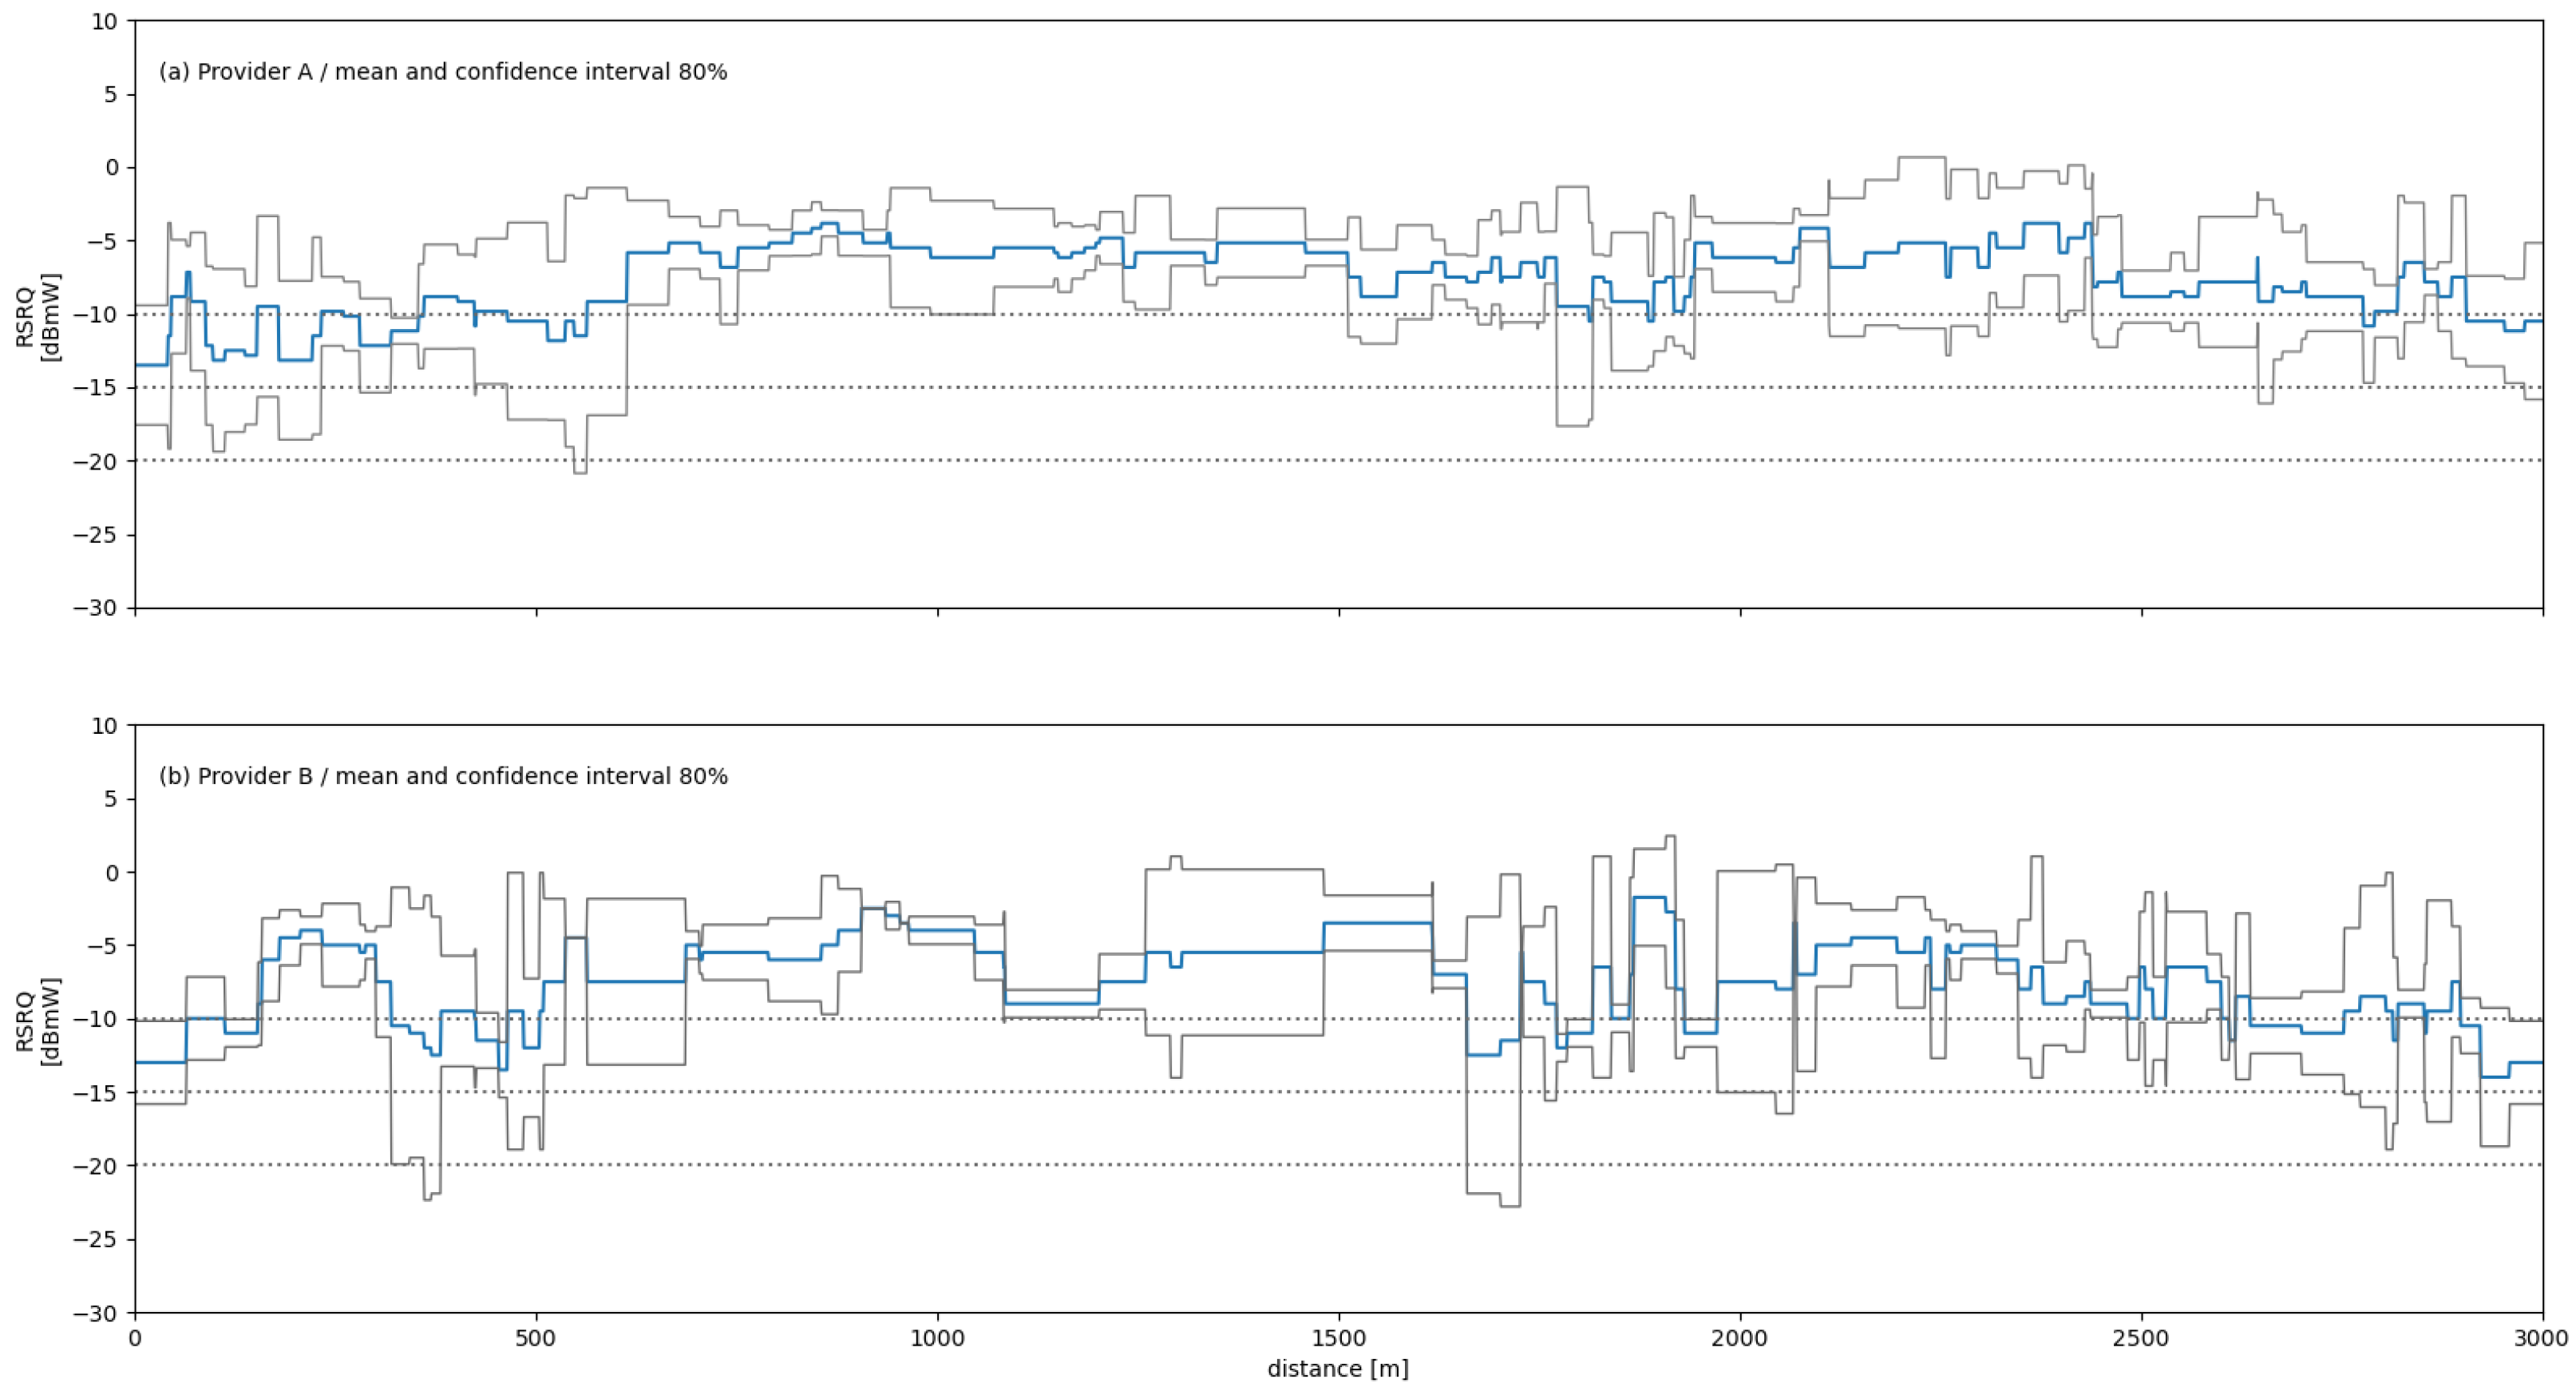
4.3. RSRQ Measurements

Experimental values for RSRQ have been obtained and are shown in Figure 11 following the same pattern as in the Figure 6 and Figure 9. A spatial correlation has been performed and the results are included in Table 9. In contrast to the results obtained for RSRP and RSSI, the spatial correlation does not indicate a high level of consistency between related measurements for the same provider. Furthermore, the values for spatial correlation are significantly lower.
The average RSRQ for each position was calculated for each provider. The results are shown in Figure 12. Furthermore, the confidence interval for a confidence of 0.8 was calculated and included in the figure. As in the case of the previous assessments, the reduction of the width of the confidence interval due to the higher number of measurements is obvious when comparing Figure 12a to Figure 12b.
The measurement shown in Figure 11 has been evaluated based on the criteria in Table 4 and the result is presented in Table 10. Similar to the result for RSSI, the evaluation for RSRQ indicates at least fair to poor coverage for the full range for both providers. Furthermore, the results do not indicate a clearly superior provider.

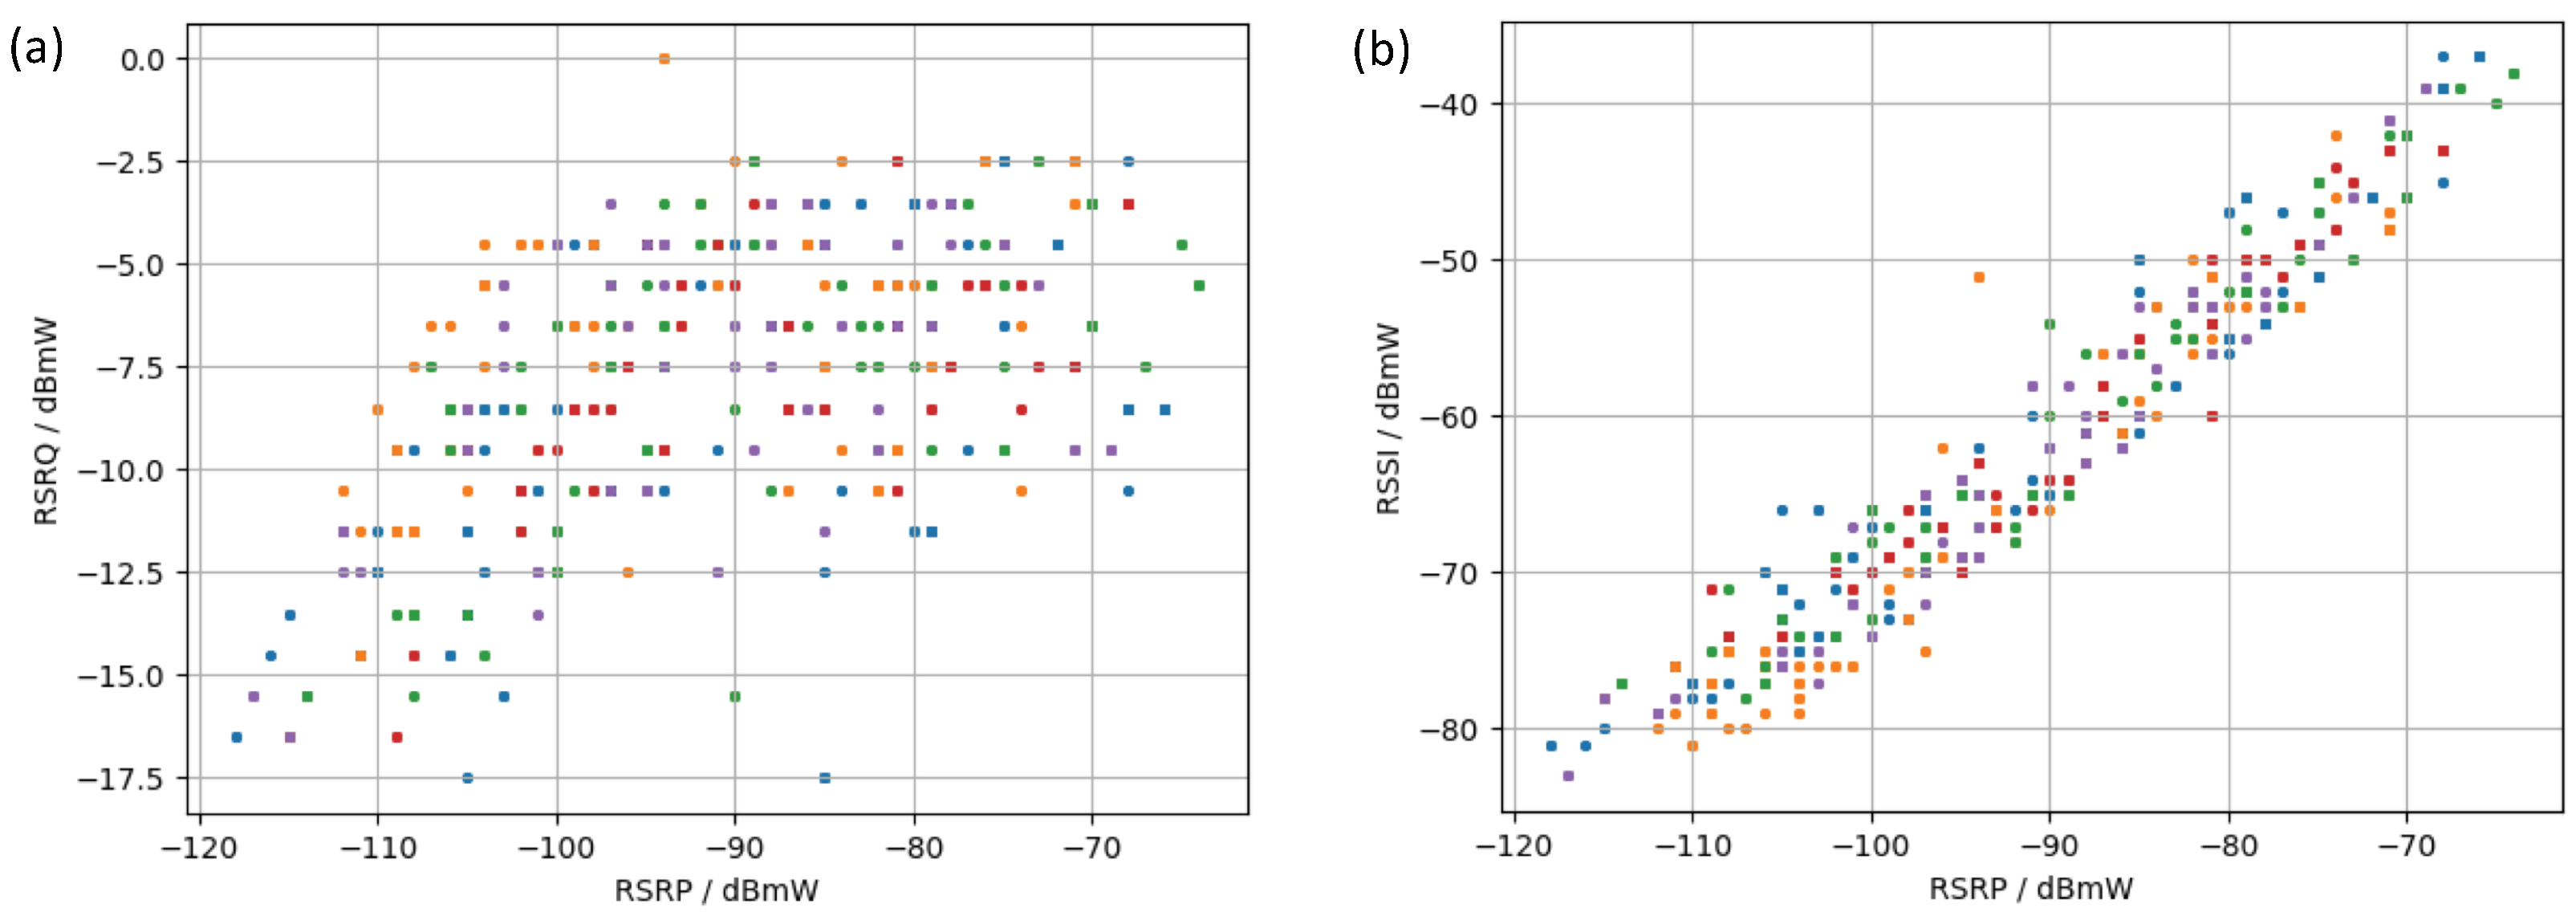
4.4. Correlation Analysis

A correlation between RSRP, RSSI, and RSRQ is included as a scatterplot in Figure 13 to further analyze the relation of these quantities. While RSRP and RSRQ show no visible correlation, the scatterplot in Figure 13b indicates a linear relationship between RSRP and RSSI.

5. Discussion, Conclusions, and Outlook

A setup for automated, high-resolution driving measurements of cellular network performance on highways has been developed and installed. Repeated measurements have been performed on a specific range of the German highway with variations in time, speed, and direction. A data preparation and analysis flow was implemented to obtain and evaluate data with consistent spatial resolution. The presented results for the measurement of RSRP and RSSI indicate significant repeatability and spatial correlation for a chosen provider, which is a prerequisite for a regular, standardized performance assessment. Correlation coefficients above 0.8 were found for different measurements of RSRP and RSSI for the same provider while values lower than 0.8 were found for the correlation for different providers. For RSRQ, the correlation coefficient for non-identical measurements was below 0.5 and different providers could not be distinguished. This can be explained based on the definition: while RSRP and RSSI are basically power measurements, RSRQ additionally depends on the number of available resource blocks which can vary depending on provider, time, and position. Nevertheless, the value is relevant for network performance in terms of data rate or latency. The confidence interval for a confidence level of 0.8 was calculated considering multiple measurements for each location under analysis. The average total width of the confidence interval for RSRP was found to be 13 dBmW to 14 dBmW, which confirms the validity of the measurements performed. The self-assessments of the providers of the respective cellular networks [5,6] have been compared in the exact same locations to the results of this study. Both providers promise a “very good” coverage of LTE both outside and inside buildings. In contrast to the self-assessment, the authors cannot confirm a “best in class” cellular network. The assessment provided in this study indicates significant areas with a “risk of disconnect or poor signal” (Table 6). With respect to the questions of research, presented in Section 1.3, this study contributes as follows:
  • Does the experimental setup used in this study provide reproducible and consistent measurement results? Yes, the measurements were spatially and temporarily consistent.
  • How can different measurements, with spatial variation in vehicle position along the road under analysis, be compared? The authors implemented a GNSS-based, virtual odometer which provided the base for the vehicle position. The correlation of different measurements indicates a good ability to distinguish between different network operators.
  • What is the level of consistency assessed by the spatial correlation between different measurements with variation in time, speed, and direction? The spatial correlation for different measurements for the same provider was above 0.8, while the correlation coefficient across providers showed values below 0.5.
  • What is the level of consistency based on the confidence per measured position? The confidence intervals for a confidence of 0.8 provided consistent limits across all measurements. However, additional measurements are required for further improvement.
The analysis presented indicates that the setup and analysis method is suitable for reliable performance measurements of cellular networks. It allows a detailed assessment to identify weaknesses and develop corrective actions.
The authors intend to increase the range of interest to larger distances and cover full highways between German cities. Additionally, parameters like latency or data rate are to be included in the assessment to finally allow a classification of certain routes as suitable for smart logistics.

Author Contributions

Conceptualization, R.R. and C.N.; methodology R.R. and C.N.; software F.F., C.S. and R.R.; investigation F.F. and C.S.; resources C.N. and R.R.; data curation F.F. and C.S.; writing—original draft preparation R.R.; writing—review and editing C.N., C.S. and F.F.; funding acquisition, C.N. and R.R. All authors have read and agreed to the published version of the manuscript.

Funding

This research was funded by the German Federal Ministry for Digital and Transport under grant number 19F1061B (mfund).

Data Availability Statement

Conflicts of Interest

The authors declare no conflict of interest.

Abbreviations

The following abbreviations are used in this manuscript:
BEVsBattery Electric Vehicles
CSSCellular Signal Strength [28,29]
E2EEnd to End
FTPFile Transfer Protocol
GNSSGlobal Navigation Satellite System
GSMGlobal System for Mobile communication (2G cellular network)
H2HHuman to Human
ICTInformation and Communication Technologies
IMSIP Multimedia Subsystems
IoTLInternet of Things Logistics
KPIsKey Performance Indicators
KQIKey Quality Indicators
LTELong Term Evolution (4G cellular network)
M2MMachine to Machine
MMSMultimedia Messaging Services
MTSIMultimedia Telephony Services over IMS
PoCPush-to-talk over Cellular
QoEQuality of Experience
QoSQuality of Service
RANRadio Access Network
RSRPReference Signal Received Power
RSRQReference Signal Received Quality
RSSIReceived Signal Strength Indicator
scspatial correlation
SMSShort Message Service
WiFiWireless Fidelity

References

  1. World Economic Forum. Net-Zero Challenge: The Supply Chain Opportunity. Insight Report. January 2021. Available online: https://www3.weforum.org/docs/WEF_Net_Zero_Challenge_The_Supply_Chain_Opportunity_2021.pdf (accessed on 21 December 2021).
  2. Rohde & Schwarz, Whitepaper: LTE-Advanced. Available online: https://cdn.rohde-schwarz.com/pws/dl_downloads//dl_application/application_notes/1ma169/1MA169_3e_LTE-Advanced_technology.pdf (accessed on 6 March 2022).
  3. Kottkamp, M. LTE-Advanced-What’s Next? Available online: https://www.wirelessinnovation.org/assets/Proceedings/2011Europe/2011-europe-1a-kottkamp.pdf (accessed on 6 March 2022).
  4. Henry, S.; Alsoheily, A.; Sousa, E.S. 5G is Real: Evaluating the Compliance of the 3GPP 5G New Radio System With the ITU IMT-2020 Requirements. IEEE Access 2020, 8, 42828–42840. [Google Scholar] [CrossRef]
  5. Deutsche Telekom: Mobilfunk Netzausbau. Available online: https://www.telekom.de/netz/mobilfunk-netzausbau (accessed on 6 March 2022).
  6. Vodafone: Netzkarte für Ganz Deutschland. Available online: https://www.vodafone.de/hilfe/netzabdeckung.html (accessed on 7 March 2022).
  7. Khatib, E.J.; Barco, R. Optimization of 5G Networks for Smart Logistics. Energies 2021, 14, 1758. [Google Scholar] [CrossRef]
  8. Song, Y.; Richard, Y.F.; Zhou, L.; Yang, X.; He, Z. Applications of the Internet of Things (IoT) in Smart Logistics: A Comprehensive Survey. IEEE Internet Things J. 2021, 8, 6. [Google Scholar] [CrossRef]
  9. Tran-Dang, H.; Krommenacker, N.; Charpentier, P.; Kim, D.-S. The Internet of Things for Logistics: Perspectives, Application Review, and Challenges. IETE Tech. Rev. 2022, 39, 93–121. [Google Scholar] [CrossRef]
  10. Forcolin, M.; Fracasso, E.; Tumanischvili, F.; Lupieri, P. Euridice-IoT applied to logistics using the intelligent cargo concept. In Proceedings of the 17th international Conference on Concurrent Enterprising, Aachen, Germany, 20–22 June 2011; pp. 1–9. [Google Scholar]
  11. Crainic, T.G.; Gendreau, M.; Potvin, J.-Y. Intelligent freight-transportation systems: Assessment and the contribution of operations research. Transp. Res. C Emerg. Technol. 2009, 17, 541–557. [Google Scholar] [CrossRef]
  12. Mondragon, A.E.C.; Lalwani, C.S.; Mondragon, E.S.C.; Mondragon, C.E.C.; Pawar, K.S. Intelligent transport systems in multimodal logistics: A case of role and contribution through wireless vehicular networks in a sea port location. Int. J. Prod. Econ. 2012, 137, 165–175. [Google Scholar] [CrossRef] [Green Version]
  13. Zhou, L.; Lou, C.X. Intelligent cargo tracking system based on the internet of things. In Proceedings of the 15th international Conference on Network-Based Information Systems, Melbourne, Australia, 26–28 September 2012; pp. 489–493. [Google Scholar]
  14. Lang, W.; Jedermann, R. What can MEMS do for logistics of food? Intelligent container technologies: A review. IEEE Sens. J. 2016, 16, 6810–6818. [Google Scholar] [CrossRef]
  15. Jedermann, R.; Lang, W. 15 Years of Intelligent Container Research. In Dynamics in Logistics; Freitag, M., Kotzab, H., Megow, N., Eds.; Springer: Cham, Switzerland, 2021. [Google Scholar] [CrossRef]
  16. Dubolazov, V.A.; Shchelkonogov, A.A.; Temirgaliev, E.R. Use of Internet of things to assess KPI in the transport logistics service. In Proceedings of the International Conference on Digital Transformation in Logistics and Infrastructure (ICDTLI 2019), St. Petersburg, Russia, 4–5 April 2019; pp. 275–279. [Google Scholar]
  17. Statistisches Bundesamt. Goods Transport. Available online: https://www.destatis.de/EN/Themes/Economic-Sectors-Enterprises/Transport/Goods-Transport/_node.html (accessed on 20 December 2021).
  18. Gai, R.; Du, X.; Ma, S.; Chen, N.; Gao, S. A Summary of 5G applications and prospects of 5G in the Internet of Things. In Proceedings of the 2021 IEEE 2nd International Conference on Big Data, Artificial Intelligence and Internet of Things Engineering (ICBAIE), Nanchang, China, 26–28 March 2021; pp. 858–863. [Google Scholar] [CrossRef]
  19. Chettri, L.; Bera, R. A Comprehensive Survey on Internet of Things (IoT) Toward 5G Wireless Systems. IEEE Internet Things J. 2020, 7, 16–32. [Google Scholar] [CrossRef]
  20. Akpakwu, G.A.; Silva, B.J.; Hancke, G.P.; Abu-Mahfouz, A.M. A Survey on 5G Networks for the Internet of Things: Communication Technologies and Challenges. IEEE Access 2018, 6, 3619–3647. [Google Scholar] [CrossRef]
  21. ETSI TS 102.250 Series QoS Aspects for Popular Services in Mobile Networks. 2019. Available online: http://www.etsi.org/ (accessed on 27 May 2022).
  22. Egi, Y.; Eyceyurt, E.; Kostanic, I.; Otero, T.C.E. An Efficient Approach for Evaluating Performance in LTE Wireless Networks. In Proceedings of the International Conference Wireless Networks ICWN 17, Las Vegas, NV, USA, 17–20 July 2017; pp. 48–54. [Google Scholar]
  23. Kousias, K.; Midoglu, C.; Alay, O.; Lutu, A.; Argyriou, A.; Riegler, M. The Same, Only Different: Contrasting Mobile Operator Behavior from CrowdSourced Dataset. In Proceedings of the IEEE 28th Annual International Symposium on Personal, Indoor, and Mobile Radio Communications (PIMRC), Montreal, QC, Canada, 8–13 October 2017. [Google Scholar] [CrossRef]
  24. International Telecommunication Union (ITU): ITU-T. E.800 SERIES Definitions of Terms Related to Quality of Service. Available online: https://www.itu.int/rec/T-REC-E.800-200809-I (accessed on 27 May 2022).
  25. Raida, V.; Svoboda, P.; Koglbauer, M.; Rupp, M. On the Stability of RSRP and Variability of Other KPIs in LTE Downlink—An Open Dataset. In Proceedings of the GLOBECOM 2020-2020 IEEE Global Communications Conference, Taipei, Taiwan, 7–11 December 2020. [Google Scholar] [CrossRef]
  26. Sommers, J.; Barford, P. Cell vs. WiFi: On the Performance of Metro Area Mobile Connections. In Proceedings of the IMC’12, Boston, MA, USA, 14–16 November 2012; pp. 301–314. [Google Scholar]
  27. Imoize, A.L.; Orolu, K.; Atayero, A.A. Analysis of key performance indicators of a 4G LTE network based on experimental data obtained from a densely populated smart city. Data Brief 2020, 29, 105304. [Google Scholar] [CrossRef] [PubMed]
  28. Shayea, I.; Ergen, M.; Azmi, M.H.; Nandi, D.; El-Salah, A.A.; Zahedi, A. Performance Analysis of Mobile Broadband Networks With 5G Trends and Beyond: Rural Areas Scope in Malaysia. IEEE Access 2020, 8, 65211–65229. [Google Scholar] [CrossRef]
  29. Shayea, I.; Azmi, M.H.; Ergen, M.; El-Saleh, A.A.; Han, C.T.; Arsad, A.; Rahman, T.A.; Alhammadi, A.; Daradkeh, Y.I.; Nandi, D. Performance Analysis of Mobile Broadband Networks With 5G Trends and Beyond: Urban Areas Scope in Malaysia. IEEE Access 2021, 9, 90767–90794. [Google Scholar] [CrossRef]
  30. El-Saleh, A.A.; Alhammadi, A.; Shayea, I.; Alsharif, N.; Alzahrani, N.M.; Khalaf, O.I.; Aldhyani, T.H.H. Measuring and Assessing Performance of Mobile Broadband Networks and Future 5G Trends. Sustainability 2022, 14, 829. [Google Scholar] [CrossRef]
  31. Poncela, J.; Gomez, G.; Hierrezuelo, A.; Lopez-Martinez, F.J.; Aamir, M. Quality Assessment in 3G/4G Wireless Networks. Wirel. Pers. Commun. 2014, 76, 363–377. [Google Scholar] [CrossRef]
  32. Lottermann, C.; Botsov, M.; Fertl, P.; Muellner, R. Performance Evaluation of Automotive Off-board Applications in LTE Deployments. In Proceedings of the IEEE Vehicular Networking Conference (VNC), Seoul, Korea, 14–16 November 2012; pp. 211–218. [Google Scholar]
  33. Raida, V.; Svoboda, M.; Rupp, M. Real World Performance of LTE Downlink in a Static Dense Urban Scenario—An Open Dataset. In Proceedings of the GLOBECOM 2020-2020 IEEE Global Communications Conference, Taipei, Taiwan, 7–11 December 2020. [Google Scholar] [CrossRef]
  34. Herrera-Garcia, A.; Fortes, S.; Baena, E.; Mendoza, J.; Baena, C.; Barco, R. Modeling of Key Quality Indicators for End-to-End Network Management: Preparing for 5G. IEEE Veh. Technol. Mag. 2019, 14, 76–84. [Google Scholar] [CrossRef]
  35. Laselva, D.; Mattina, M.; Kolding, T.E.; Hui, J.; Liu, L.; Weber, A. Advancements of QoE assessment and optimization in mobile networks in the machine era. In Proceedings of the 2018 IEEE Wireless Communications and Networking Conference Workshops (WCNCW), Barcelona, Spain, 15–18 April 2018; pp. 101–106. [Google Scholar] [CrossRef]
  36. O2: Willkommen im Sehr Guten Netz von O2. Available online: https://www.o2online.de/netz/ (accessed on 9 March 2022).
  37. Map Provided by OpenTopoMap. Based on OpenStreetMap, OpenStreetMap Contributors. Available online: https://www.openstreetmap.org (accessed on 5 March 2022).
  38. Teltonica Wiki Knowledge Base. Available online: https://wiki.teltonika-networks.com/view/RSRP_and_RSRQ (accessed on 21 December 2021).
Figure 1. The setup of the measurement system.
Network 02 00020 g001
Figure 2. The antenna setup of the vehicle.
Network 02 00020 g002
Figure 3. The data preparation flow used for this study.
Network 02 00020 g003
Figure 4. The data assessments performed within this study.
Network 02 00020 g004
Figure 5. Highway under analysis. Test drives were performed in both directions as indicated by the arrows, based on [37].
Network 02 00020 g005
Figure 6. RSRP as a function of distance based on five independent measurements (solid lines: raw data; dots: resampled, interpolated data). Gray, dotted horizontal lines indicate ranges according to Table 4.
Network 02 00020 g006
Figure 7. Mean values of RSRP as a function of distance including the limits of the confidence interval for a confidence of 0.8.
Network 02 00020 g007
Figure 8. Histogram of the confidence intervals for RSRP.
Network 02 00020 g008
Figure 9. RSSI as a function of distance (solid lines: raw data; dots: resampled, interpolated data). Gray, dotted horizontal lines indicate ranges according to Table 4.
Network 02 00020 g009
Figure 10. Mean values of RSSI as a function of distance including the limits of the confidence interval for a confidence of 0.8.
Network 02 00020 g010
Figure 11. RSRQ as a function of distance (solid lines: raw data; dots: resampled, interpolated data). Gray, dotted horizontal lines indicate ranges according to Table 4.
Network 02 00020 g011
Figure 12. Mean values of RSRQ as a function of distance including the limits of the confidence interval for a confidence of 0.8.
Network 02 00020 g012
Figure 13. Correlation of (a) RSRP and RSRQ; (b) RSRP and RSSI.
Network 02 00020 g013
Table 1. Typically assessed parameters, based on [21,27,31,32].
Service Specific, Complex CharacteristicsSimple, Directly Measurable Parameters
Quality of Experience (QoE)Reference Signal Received Power (RSRP)
Quality of Service (QoS)Reference Signal Received Quality (RSRQ)
Received Signal Strength Indicator (RSSI)
Delay, Latency
Packet Loss
Table 2. Related work and analysis carried out in this study.
ReferenceNetworksMeasurementParametersParameters
AssessedMethodControlledUnder Investigation
[23]4Gcrowd sourced-RSRP, RSRQ, latency, data rate
[22]4Gphone, scannerpositionRSRP
[25]4GphonetimeRSRP
[33]4GphonetimeRSRP, RSRQ, RSSI, others
[26]2G–4G, WiFicrowd sourcedtime, positiondata rate, latency
[27]4GmodempositionRSRP, RSRQ, RSSI, others
[28]3G,4Gphone-CSS, web browsing, streaming
[29]3G, 4Gphone-CSS, web browsing, streaming
[30]3G, 4GphonepositionRSRP, RSRQ, RSSI, others
[31]2G–4GphonepositionRSRP, others
this study4Gdedicated setuptime, position directionRSRP, RSRQ, RSSI
Table 3. Measured parameters.
ParameterRange/Resolution /FormatUnit
Latitude0.000001° dec.
Longitude0.000001° dec.
Time of dayYYYY-MM-DD HH:MM:SS.000-
Data rate1Hz
RSRP−120 … 0dBmW
RSSI−120 … 0dBmW
RSRQ−10 … 0dB
Number of operators LTE (4G)3-
Number of operators GSM (2G)3-
Table 4. LTE assessment criteria, based on [38].
AssessmentRSRPRSRQRSSI
excellent>= −10 dBmW>= −10 dB> −15 dBmW
good−10 dBmW …−10 dBmW−10 dB …−15 dB−15 dBmW …−15 dBmW
fair−10 dBmW …−100 dBmW−15 dB …−10 dB−15 dBmW …−15 dBmW
poor−15 dBmW …−15 dBmW
risk of disconnect or no signal<= −100 dBmW<= −10 dB< −15 dBmW
Table 5. Spatial correlation of RSRP. A and B indicate the respective providers under investigation.
(a)(b)(c)(d)(e)
AAABB
(a)A10.840.820.760.59
(b)A0.8410.860.750.60
(c)A0.820.8610.780.67
(d)B0.760.750.7810.85
(e)B0.590.600.670.851
Table 6. Provider based assessment RSRP.
MeasurementProviderExcellentGoodFair to PoorRisk of Disconnect or No SignalRange under Analysis
(a)A520 m1164 m663 m654 m3001 m
(b)A1014 m584 m1078 m361 m3001 m
(c)A881 m500 m949 m671 m3001 m
(d)B715 m735 m602 m949 m3001 m
(e)B1176 m555 m439 m831 m3001 m
Table 7. Spatial correlation of RSSI, A and B reference to two providers under investigation.
(a)(b)(c)(d)(e)
AAABB
(a)A10.860.840.740.55
(b)A0.8610.880.800.64
(c)A0.840.8810.780.67
(d)B0.740.800.7810.82
(e)B0.550.640.670.821
Table 8. Provider-based assessment RSSI.
MeasurementProviderExcellentGoodFair to PoorRisk of Disconnect or No SignalRange Under Analysis
(a)A1983 m431 m587 m-3001 m
(b)A1737 m1264 m--3001 m
(c)A1294 m1380 m327 m-3001 m
(d)B1515 m599 m887 m-3001 m
(e)B1767 m828 m406 m-3001 m
Table 9. Spatial correlation of RSRQ.
(a)(b)(c)(d)(e)
AAABB
(a)A10.220.330.390.34
(b)A0.2210.480.110.16
(c)A0.330.4810.330.21
(d)B0.390.110.3310.41
(e)B0.340.160.210.411
Table 10. Provider based assessment RSRQ.
MeasurementProviderExcellentGoodFair to PoorRisk of Disconnect or No SignalRange under Analysis
(a)A2238 m655 m108 m-3001 m
(b)A2702 m253 m46 m-3001 m
(c)A2377 m456 m168 m-3001 m
(d)B2413 m588 m--3001 m
(e)B1909 m927 m165 m-3001 m
Publisher’s Note: MDPI stays neutral with regard to jurisdictional claims in published maps and institutional affiliations.

