Abstract
Flavonoids are a class of natural chemicals with variable phenolic structures that have long been recognized for their health advantages, they have recently attracted researchers’ attention for treating diabetes and hyperglycemia. The goal of this research is to develop a novel antihyperglycemic formulation using a combination of three plant flavonoids: Linum usitatissimum L. seeds (FLU), Coriandrum sativum L. seeds (FCS), and Olea europaea var. sylvestris leaves (FOE) based on a mixture design experiment approach which generates the most effective ratio of each component in a mixture instead of the trial-and-error method. Prior to the test, sub-acute toxicity research was conducted to establish a safe and effective dosage. The Oral Glucose Tolerance Test (OGTT) was used to assess the antihyperglycemic impact of these extracts and their combinations in Swiss albino mice. The dose that showed efficacy and safety was 25 mg/kg, which was utilized in all formulations. According to the results, the binary and ternary combinations showed the most significant synergetic effects. The optimum combination with the most potent effect was 37% FLU, 20% FCS, and 43% FOE. This study’s mixture design and prediction model for glycemic variation (GV) may be utilized at an industrial level to develop a novel antidiabetic and antihyperglycemic formulation that is safe and effective.
Keywords:
diabetes; hyperglycemia; formulation; flavonoids; medicinal plants; flax; Coriander; Olea europaea; olive; oleaster 1. Introduction
Diabetes mellitus (DM) is considered one of the most challenging metabolic disorders, with multiple underlying factors resulting in elevated blood glucose levels (BGL). It comes with various and severe life-threatening health problems, resulting in low life quality, increased mortality, and higher medical care costs [1]. The global prevalence of diabetes has been estimated by the International Diabetes Federation (IDF), indicating a rise from 151 million in 2000 to more than 693 million by 2045 [2], concomitant with an increased prevalence of the impaired glucose tolerance in adults [3]. This increasing prevalence is explicitly attributed to economic growth and urbanization, contributing to a shift in lifestyles marked by less physical activity and increased obesity [4,5]. Nowadays, herbal medicines are implicated in chronic disorders prevention and treatment [6]. Their use is common as a primary form of health care by a substantial part of the population [7]. They are still partly known, regardless of their long-term use, and their complexity and variability made it difficult to identify and understand their preventive and curative proprieties in diseases [8].
In this approach, this study was conducted to explore and valorize the discarded leftovers of three medicinal plants, more precisely their polar fraction (flavonoids), in a well-designed mixture to treat diabetes and hyperglycemia.
Using a single compound/bioactive molecule may result in an increased risk of disease resistance, especially in long-term treatments. Considering that many diseases are regulated by multiple molecular targets, a combination of molecules with various molecular targets will be a promising solution [9]. Confirmed by numerous studies that have shown that disease resistance was more with a single active molecule against a combination of compounds (Extract) [10,11]. Plants developed over a decade of evolution numerous bioactive compounds to interact with their environment, those compounds were proven to have medicinal properties, and they were in some cases the perfect choice for some diseases [12]. Herbal mixtures are an essential resource for developing new multi-target drugs, and their study is now of paramount importance [10].
In this study, three plants were selected: Coriandrum sativum L., Linum usitatissimum L., and Olea europaea var. sylvestris. C. sativum is a well-known antidiabetic plant [13] as it stimulates insulin release from pancreatic beta cells [14] and has a cholesterol-lowering property [15]. L. usitatissimum also has a proven antidiabetic activity [16,17], as well as O. europaea var. sylvestris [18]. The seeds of coriander and flax are mainly exploited for their oil, for their cosmetic and health benefit, while Olea europaea var. sylvestris is a variety of wild olive trees non-used for the production of olive oil. Flavonoids studied in this research are part of the polyphenol class, widely found in daily consumed food, drinks, and herbs [19], with over 8000 individual known compounds [20]. They are well known for their health benefits and serve multiple functions such as anticancer, antiviral, anti-allergic, antibacterial, antidiabetic, and anti-inflammatory [21]. They demonstrate their antidiabetic activity through different pathways and multiple molecule targets such as insulin signaling, secretion, and action, carbohydrate regulation, digestion, the management of the body’s glucose level through the liver and the cells, the regulation of the β-cells function by promoting their proliferation and insulin secretion [22,23]. A better antidiabetic activity combines different modes of action with different pathways, which can be possible by the intake of different flavonoids that complement each other by triggering additional pathways. The multiplicity and complexity of all those biological changes occurring during the ingestion of flavonoids contribute to their antihyperglycemic activity and explain the glycemic variation during the time. To effectively study mixtures and optimize each component’s best ratio, a mixture design study is used [24]. Mixture design is a class of response surface experiments that can generate the most effective ratio of each component in a mixture instead of the trial-and-error method [25]. The mixture design is used to optimize mixture proportions in the food industry, pharmaceutical industry, and many others [24].
Our work aims to provide a practical way to design and study the mixture of flavonoids from three plants with multi-target compounds in the case of diabetes and hyperglycemia to optimize their best combination.
2. Results and Discussion
2.1. Yield of Extraction
The yield of extraction of the different flavonoids fraction was: for Olea europaea var. sylvestris: 5.7%, Linum usitatissimum: 1.1%, Coriandrum sativum: 1.6%.
The flavonoid composition of the three plants used in this study varies: Flax seeds contain mainly herbacetin diglucoside (HDG) and kaempferol diglucoside (KDG) [26]. Coriander seeds contain mostly rutin, quercetin, kaempferol, rhamnetin, and apigenin [27]. Olea europaea genre contains mainly luteolin, apigenin, rutin [28,29], and in a recent study published by our team using this same oleaster extract it was shown that it only contains flavonoids namely: amentoflavone, quercetin-3-O-glucoside, quercetin-3-O-hexose-deoxyhexose, luteolin-7-O-glucoside and rutin [18]. Almost all flavonoids identified in the three plants exhibit an important antidiabetic activity with different action mechanisms. For example, quercetin improves glucose absorption and GLUT 4 translocation, inhibits GLUT2, and blocks the tyrosine kinase activity [30,31]. Rutin reduces carbohydrates absorption, improves their uptake by the cells, stimulates the β-cells to secrete insulin, and protects Langerhans’ islets from degenerative changes [32]. Kaempferol also works by stimulating the secretion and production of insulin [33], enhancement of glucose uptake leading to reduced hyperglycemia, [34] it also has a significant role in enhancing the cellular viability and repressing apoptosis [35], promoting the synthesis of new glucose transporters [36], decreasing the serum levels of HbA1c, fasting blood glucose (FBG), increasing insulin sensitivity, and suppressing hepatic gluconeogenesis [37]. For apigenin, it exhibits its antidiabetic activity by reducing the activities of glutathione, glucose 6-phosphatase superoxide dismutase, and hepatic catalase resulting in reduced hyperglycemia and serum cholesterol levels [38]. It also works by enhancing GLUT4 translocation [39], limiting oxidative damage of pancreatic β-cells [40]. As for luteolin, it reduces apoptosis and improves insulin secretion [41,42].
2.2. Sub-Acute Toxicity
After daily oral administration of the flavonoids extracts of the three plants at three different doses, no mortality was recorded, but some toxicity signs were recorded for the dose of 100 mg/kg, this dose also caused a slight perturbation in the animal’s body weight.
However, the doses of 25 and 50 mg/kg did not present any toxic reactions, and they maintained a normal body weight during the test period (partial data could be assessed in [18]).
The dose of 25 mg/kg was selected to pursue the study because of its safety, and for being at the same efficacity as the dose of 50 mg/kg.
2.3. Antihyperglycemic Activity of the Formulation
2.3.1. Experiment Results
The blood glucose level in all groups showed a high peak value at 30 min after glucose load, and all treatments were significantly (p < 0.001) better than the normal group. Those results clearly show the antihyperglycemic activity of all treatments. Blood glucose level continues to drop significantly until the end of the test (Table 1).

Table 1.
Glycemia variation after administration of different treatments.
The AUCs of blood glucose levels (Figure 1) in groups treated with glibenclamide were significantly reduced by 62.47% compared to the normal control group. For the single flavonoids treatment, the best reduction was noted by FCS (59.24%) followed by FLU (50.36%) then FOE (49.59%). For the binary result, the combination of FLU and FOE gives us the best reduction with 60.56%, followed by the combination between FLU and FCS (53.83%), FCS, and FOE (44.63%). The ternary combination with an equal proportion of all plant flavonoids gave by far the best reduction among all different combinations with 67.07%. Those results show that the ternary combinatory effect is present, not only it is effective, but it has the best reduction against single, binary, and glibenclamide.
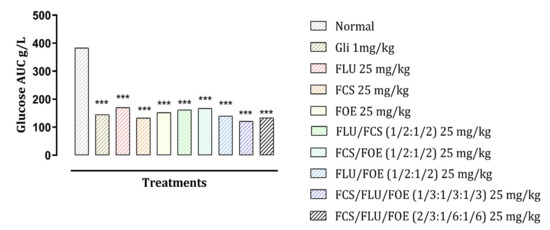
Figure 1.
Effect of different treatments on the total area under the curves (AUCs) of blood glucose based on the 120 min of the OGTT test results. *** p < 0.001 compared to normal control. Gli: Glibenclamide; FLU: L. usitasimum flavonoids; FCS: C. sativum flavonoids; FOE: O. europaea flavonoids.
2.3.2. Establishment of Response Prediction Models
The coefficient of determination (R2) and the adjusted R2 values indicated that the selected models provided an excellent fit to the data (Table 2). The analysis of variance (ANOVA) showed the statistical significance of the regression models.
Table 2.
Coefficients of each model fitted and their level of significance determined by p-value.
2.3.3. Effect of Mixtures and Validation of Their Interactions
The linear model contains first-order terms for each of the components. The quadratic model adds cross terms between pairs of components. The special-cubic model adds terms using products of the three components. Following Table 2, all analyzed models were special cubic. However, binary and ternary interaction outcomes were time-dependent. Follow their p-values, b12 becomes significant just after 30 min, while the b13 effect disappears after 1 h to reappear after 30 min. After 1 h 30, all interactions were significantly present, to reach 2 h with the extinction of b13 influence.
The interpretation of the extract effect is linked to the coefficient sign. In sum, a negative sign of a coefficient in the fitted model indicates its associated factor’s ability to decrease the response, contrary to the positive one. In the present study, the goal is to increase the GV values.
The GV reflects the variance of glycemia between two successive measures. Five readings were taken at 0; 30; 60; 90, and 120 min permitting to have four GV. The mixture’s impact on GV is modeled following the mixture design approach.
Four fitted models time-dependent were being established, equations obtained are:
After 30 min:
After 1 h:
After 1 h30
After 2 h
2.3.4. Optimal Mixture Prediction
Figure 2 represents the 3D plots that show GV variations by variations of formulations and in time. The pink zones are the most efficient formulations decreasing the GV index. The optimal formulation was highlighted by the desirability function (Figure 3) represented by a ratio of 0.37, 0.2, and 0.43 of FLU, FCS, and FOE, respectively.

Figure 2.
Surface plots for the effect of different combinations of the studied flavonoids extract on GV variations over time A: after 30 min, B: after 1 h, C: after 1 h 30, D: after 2 h.
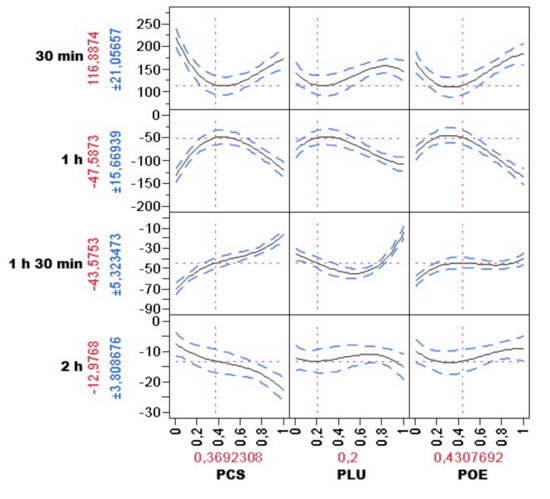
Figure 3.
Optimal combination against hyperglycemia using desirability function, with the predicted BGL on each time (presented on the left by the mean ± SD) and the best combination based on the test result (presented at the bottom as a percentage).
3. Materials and Methods
3.1. Plant Material
Linum usitatissimum L. seeds (BPRN57) and Coriandrum sativum L. seeds (BPRN28) were purchased from herbalists, while Olea europaea var. sylvestris leaves (BPRN12) was collected in April 2019 from the Taounate region in northern Morocco. All three plants were identified taxonomically, and their voucher specimen was stored in the LBEAS laboratory in the Faculty of Sciences Dhar el Mahraz Fez Morocco.
3.2. Preparation of Flavonoids Extracts
The seeds of Linum usitatissimum, Coriandrum sativum, and leaves of Olea europaea var. sylvestris were well cleaned with water, air-dried (room temperature), and then reduced to a fine powder using an electric grinder.
The seeds were defatted before proceeding with the extraction of 10 g of powdered seeds washed out with 30 mL Hexane 3 times.
The extraction starts using 10 g of the plant powder mixed with 100 mL of 70% methanol in an ultrasound-assisted apparatus for 40 min at a frequency of 35 KHz. The extract was then filtered using Whatman paper number 5 (Merk, Espoo, Finland), then concentrated to have a crude extract. In order to get the flavonoids fraction, this extract was diluted in distilled water, then washed with chloroform and dichloromethane (2 times, v:v) (For the elimination of lipids and pigments as well as the mannitol), and then extracted with N-butanol (2 times) [43]. The organic phase (N-butanol) containing the flavonoids was concentrated and stored for future use.
3.3. Animals
For the in vivo study, and since the test used does not affect hormones, nor does the gender impact the results, Swiss albino mice (aged 3–4 weeks) of both sex with an average weight of 20–26 g were used in this study. They were procured from the animal house facility in the faculty of Sciences Dhar el Mahraz Fez. They were maintained at standard housing conditions and had free access to food and water during the experiment period. All treatments administered in this study were orally (gavage) using a bulb-tipped gastric gavage needle. Experimental procedures were carried out in compliance with the international standards for the treatment and use of laboratory animals [44], and the procedure was accepted by the Animal Ethics Institutional Committee (10/2019/LBEAS).
3.4. Sub-Acute Toxicity Studies
A sub-acute toxicity study (28-day repeated oral toxicity study) was carried out in order to set the safe and lethal dose.
Mice of both sexes were divided into 10 groups with 5 animals.
Group I received 0.2 mL saline orally and served as a control group, whereas group II, group III, and group IV received flavonoids extract from Linum usitatissimum seeds (FLU) at 25, 50, and 100 mg/kg body weight, orally, group V, group VI, and group VII received flavonoids extract from Coriandrum sativum seeds (FCS) at 25, 50 and 100 mg/kg body weight orally, group VIII, group XI, and group X received flavonoids extract from Olea europaea var. sylvestris (FOE) at 25, 50, 100 mg/kg body weight, orally.
During the daily administration of the extract, the mice were monitored twice daily to record any sign of toxicity that appeared, and any mortality or morbidity until the end of the test, and the body weights measurements were taken weekly.
3.5. Mixture Design and Glucose Tolerance Test
The combined hypoglycemic effect of the three flavonoids extract was carried out using a combination of Oral Glucose Tolerance Test (OGTT) and formulation by Mixture design based on a simplex-centroid design matrix. The results are expressed as glycemic variation (GV).
3.5.1. Oral Glucose Tolerance Test
Mice were fasting the night before the experiment. After an hour of drug administration, the animals were given orally a D-glucose solution (5 g/kg).
Blood Glucose Level (BGL) was measured at the 0 times of the test (glucose administration) and after 30, 60, and 120 min by a tail vein puncture. The measurements were being taken using the Accu-Chek blood glucose monitoring system (Roche, Basel, Switzerland) and compatible blood glucose test strips.
Doses and groups were set following the result of the toxicity and the suggested combination from the mixture study software as follows:
(1) Normal group receiving saline (2 mL); (2) positive control group Gli (Glibenclamide) receiving a dose of 1 mg/kg; (3) group receiving 100% FLU at the dose of 25 mg/kg; (4) group receiving 100% FCS at the dose of 25 mg/kg; (5) group receiving 100% FOE at the dose of 25 mg/kg; (6) group receiving equal doses of FLU/FCS (1/2:1/2) in a final dose of 25 mg/kg; (7) group receiving equal doses of FOE/FCS (1/2:1/2) in a final dose of 25 mg/kg; (8) group receiving equal doses of FLU/FOE (1/2:1/2) in a final dose of 25 mg/kg; (9) group receiving equal doses of FLU/FCS/FOE (1/3:1/3:1/3) in a final dose of 25 mg/kg; (10) group receiving unequal doses of FCS/FLU/FOE (2/3:1/6:1/6) in a final dose of 25 mg/kg.
3.5.2. Mixture Design
The simplex-centroid design was used to study the ternary antihyperglycemic effect of the flavonoids. An equilateral triangle is used to represent three-component mixtures (Figure 4). Points 1,2,3 are at the vertices of the equilateral triangle, they are 1st-degree centroids, each of them contains only pure products. Binary mixtures are represented by the sides of the triangle (point 5,6,7), and they are 2nd-degree centroids, each of them has two non-zero components with equal values. Point 4 is a 3rd-degree centroid where all three components have the same value.
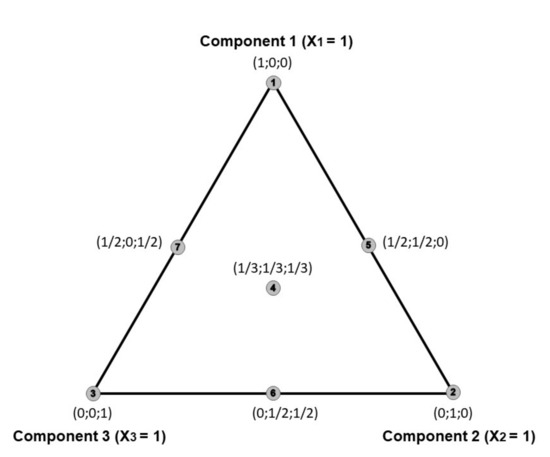
Figure 4.
An overview of the simplex-centroid design for the three-component.
The experimental design, as shown in Table 1, consisted of 10 experiments with 5 replication each, and they were performed in random order.
The responses (dependent variable) were the evolution of the mice’s glycemia during the time of the test.
Subsequently, data were fitted to a special cubic polynomial model using the least square regression for estimating unknown coefficients in Equation (5).
Y = b1 × 1 + b2 × 2 + b3 × 3 + b12 × 1 × 2 + b13 × 1 × 3 + b23 × 2 × 3 + b123 × 1 × 2 × 3
Considering Y is the response, bi is the magnitude of the effect of each component. Xi, bij is the magnitude of the interactive effect of two components, and bijk is the magnitude of the interactive effect of the three components on the response. Xi indicates the proportions of the component ‘(i) of the mixture.
This analysis was performed using the SAS JMP ® software version 8.0.1 for windows.
3.6. Statistical Analysis
Graph pad prism (Version 8.0 for windows) was used to perform the statistical analysis. Differences between groups were evaluated by one-way analysis of variance (ANOVA) followed by Tukey’s post-test. Values less than p < 0.05 were considered statistically significant.
4. Conclusions
A mixture design experiment is a powerful tool to study the combinatory and synergic effects of multiple compounds and optimize the desired effect response. This first study on an alternative antihyperglycemic mixture showed that the single, binary, and ternary combination was very effective compared to the positive and negative control, the synergistic effects in the binary and ternary mixtures were highly significant, and the best combination was set according to the software analysis. This study indicates that a mixture design experiment could be successfully applied to elaborate new medicines for various diseases. Demonstrating total safety, the obtained formulation could be used as a new antihyperglycemic phytomedicine or as a supplement to conventional drugs.
Author Contributions
Conceptualization H.M. and D.B., Writing—Original Draft, H.M. and I.E.-s., data curation, I.E.-s., A.A. and F.z.J. Methodology, W.O. supervision D.B. All authors have read and agreed to the published version of the manuscript.
Funding
This research received no external funding.
Institutional Review Board Statement
The study was conducted according to the guidelines of the Declaration of Helsinki, and approved by the Institutional Review Board of the Faculty of Sciences Dhar el Mahraz Fez, Fez, Morocco ((#10/2019/LBEAS and 21/11/2019).
Informed Consent Statement
Not applicable.
Data Availability Statement
Data are available upon request.
Acknowledgments
This work is part of the European Union (EU) international staff exchange project H2020-MSCA-RISE-Marie Skłodowska- Curie Actions (MSCA), Research and Innovation Staff Exchange (RISE), Project Acronym: VAHVISTUS – Project Number: 734759.
Conflicts of Interest
The authors declare no conflict of interest.
References
- Baena-Díez, J.M.; Peñafiel, J.; Subirana, I.; Ramos, R.; Elosua, R.; Marín-Ibañez, A.; Guembe, M.J.; Rigo, F.; Tormo-Díaz, M.J.; Moreno-Iribas, C.; et al. Risk of Cause-Specific Death in Individuals With Diabetes: A Competing Risks Analysis. Diabetes Care 2016, 39, 1987–1995. [Google Scholar] [CrossRef] [PubMed] [Green Version]
- Cho, N.H.; Shaw, J.E.; Karuranga, S.; Huang, Y.; Da Rocha Fernandes, J.D.; Ohlrogge, A.W.; Malanda, B. IDF Diabetes Atlas: Global Estimates of Diabetes Prevalence for 2017 and Projections for 2045. Diabetes Res. Clin. Pract. 2018, 138, 271–281. [Google Scholar] [CrossRef] [PubMed]
- Ogurtsova, K.; Da Fernandes, J.D.R.; Huang, Y.; Linnenkamp, U.; Guariguata, L.; Cho, N.H.; Cavan, D.; Shaw, J.E.; Makaroff, L.E. IDF Diabetes Atlas: Global Estimates for the Prevalence of Diabetes for 2015 and 2040. Diabetes Res. Clin. Pract. 2017, 128, 40–50. [Google Scholar] [CrossRef] [Green Version]
- Blas, E.; Kurup, A.S. Equity, Social Determinants, and Public Health Programmes; World Health Organization: Geneva, Switzerland, 2010; ISBN 978-92-4-156397-0. [Google Scholar]
- Whiting, D.R.; Guariguata, L.; Weil, C.; Shaw, J. IDF Diabetes Atlas: Global Estimates of the Prevalence of Diabetes for 2011 and 2030. Diabetes Res. Clin. Pract. 2011, 94, 311–321. [Google Scholar] [CrossRef]
- Petrovska, B.B. Historical Review of Medicinal Plants’ Usage. Pharmacogn. Rev. 2012, 6, 1–5. [Google Scholar] [CrossRef] [Green Version]
- Mechchate, H.; Es-safi, I.; Zahra Jawhari, F.; Bari, A.; Grafov, A.; Bousta, D. Ethnobotanical Survey about the Management of Diabetes with Medicinal Plants Used by Diabetic Patient in Region of Fez-Meknes, Morocco. Ethnobot. Res. Appl. 2020, 19. [Google Scholar] [CrossRef] [Green Version]
- Es-Safi, I.; Mechchate, H.; Amaghnouje, A.; El Moussaoui, A.; Cerruti, P.; Avella, M.; Grafov, A.; Bousta, D. Marketing and Legal Status of Phytomedicines and Food Supplements in Morocco. J. Complementary Integr. Med. 2020, 18. [Google Scholar] [CrossRef]
- Wagner, H.; Ulrich-Merzenich, G. Synergy Research: Approaching a New Generation of Phytopharmaceuticals. Phytomedicine 2009, 16, 97–110. [Google Scholar] [CrossRef]
- Caesar, L.K.; Cech, N.B. Synergy and Antagonism in Natural Product Extracts: When 1 + 1 Does Not Equal 2. Nat. Prod. Rep. 2019, 36, 869–888. [Google Scholar] [CrossRef] [PubMed] [Green Version]
- Van Vuuren, S.; Viljoen, A. Plant-Based Antimicrobial Studies—Methods and Approaches to Study the Interaction between Natural Products. Planta Med. 2011, 77, 1168–1182. [Google Scholar] [CrossRef] [PubMed] [Green Version]
- Raskin, I.; Ripoll, C. Can an Apple a Day Keep the Doctor Away? Curr. Pharm. Des. 2004, 10, 3419–3429. [Google Scholar] [CrossRef]
- Mechchate, H.; Es-safi, I.; Amaghnouje, A.; Boukhira, S.; Alotaibi, A.A.; Al-zharani, M.; Nasr, F.A.; Noman, O.M.; Conte, R.; Amal, E.H.E.Y.; et al. Antioxidant, Anti-Inflammatory and Antidiabetic Proprieties of LC-MS/MS Identified Polyphenols from Coriander Seeds. Molecules 2021, 26, 487. [Google Scholar] [CrossRef] [PubMed]
- Eidi, M.; Eidi, A.; Saeidi, A.; Molanaei, S.; Sadeghipour, A.; Bahar, M.; Bahar, K. Effect of Coriander Seed (Coriandrum Sativum L.) Ethanol Extract on Insulin Release from Pancreatic Beta Cells in Streptozotocin-Induced Diabetic Rats. Phytother. Res. Int. J. Devoted Pharmacol. Toxicol. Eval. Nat. Prod. Deriv. 2009, 23, 404–406. [Google Scholar]
- Dhanapakiam, P.; Joseph, J.M.; Ramaswamy, V.; Moorthi, M.; Kumar, A.S. The Cholesterol Lowering Property of Coriander Seeds (Coriandrum Sativum): Mechanism of Action. J. Environ. Biol. 2007, 29, 53. [Google Scholar]
- Ghule, A.E.; Jadhav, S.S.; Bodhankar, S.L. Effect of Ethanolic Extract of Seeds of Linum Usitatissimum (Linn.) in Hyperglycaemia Associated ROS Production in PBMNCs and Pancreatic Tissue of Alloxan Induced Diabetic Rats. Asian Pac. J. Trop. Dis. 2012, 2, 405–410. [Google Scholar] [CrossRef]
- Bouzghaya, S.; Amri, M.; Homblé, F. Improvement of Diabetes Symptoms and Complications by an Aqueous Extract of Linum Usitatissimum (L.) Seeds in Alloxan-Induced Diabetic Mice. J. Med. Food 2020, 23, 1077–1082. [Google Scholar] [CrossRef] [PubMed]
- Mechchate, H.; Es-Safi, I.; Bourhia, M.; Kyrylchuk, A.; El Moussaoui, A.; Conte, R.; Ullah, R.; Ezzeldin, E.; Mostafa, G.A.; Grafov, A.; et al. In-Vivo Antidiabetic Activity and In-Silico Mode of Action of LC/MS-MS Identified Flavonoids in Oleaster Leaves. Molecules 2020, 25, 5073. [Google Scholar] [CrossRef]
- Ahmad, M.; Akhtar, M.S.; Malik, T.; Gilani, A.H. Hypoglycaemic Action of the Flavonoid Fraction of Cuminum Nigrum Seeds. Phytother. Res. 2000, 14, 103–106. [Google Scholar] [CrossRef]
- Cushnie, T.P.T.; Lamb, A.J. Antimicrobial Activity of Flavonoids. Int. J. Antimicrob. Agents 2005, 26, 343–356. [Google Scholar] [CrossRef]
- Abotaleb, M.; Samuel, S.; Varghese, E.; Varghese, S.; Kubatka, P.; Liskova, A.; Büsselberg, D. Flavonoids in Cancer and Apoptosis. Cancers 2018, 11, 28. [Google Scholar] [CrossRef] [Green Version]
- Graf, B.A.; Milbury, P.E.; Blumberg, J.B. Flavonols, Flavones, Flavanones, and Human Health: Epidemiological Evidence. J. Med. Food 2005, 8, 281–290. [Google Scholar] [CrossRef] [PubMed]
- Vinayagam, R.; Xu, B. Antidiabetic Properties of Dietary Flavonoids: A Cellular Mechanism Review. Nutr. Metab. 2015, 12. [Google Scholar] [CrossRef] [PubMed] [Green Version]
- Abdullah, N.; Chin, N.L. Simplex-Centroid Mixture Formulation for Optimised Composting of Kitchen Waste. Bioresour. Technol. 2010, 101, 8205–8210. [Google Scholar] [CrossRef] [PubMed] [Green Version]
- Mechchate, H.; Es-safi, I.; Haddad, H.; Bekkari, H.; Grafov, A.; Bousta, D. Combination of Catechin, Epicatechin, and Rutin:Optimization of a Novel Complete Antidiabetic Formulation Using a Mixture Design Approach. J. Nutr. Biochem. 2020, 108520. [Google Scholar] [CrossRef]
- Qiu, S.-X.; Lu, Z.-Z.; Luyengi, L.; Lee, S.K.; Pezzuto, J.M.; Farnsworth, N.R.; Thompson, L.U.; Fong, H.H.S. Isolation and Characterization of Flaxseed (Linum Usitatissimum) Constituents. Pharm. Biol. 1999, 37, 1–7. [Google Scholar] [CrossRef] [Green Version]
- Rajeshwari, C.U.; Andallu, B. Isolation and Simultaneous Detection of Flavonoids in the Methanolic and Ethanolic Extracts of Coriandrum Sativum L. Seeds by RP-HPLC. Pak. J. Food Sci. 2011, 21, 13–21. [Google Scholar]
- Le Tutour, B.; Guedon, D. Antioxidative Activities of Olea Europaea Leaves and Related Phenolic Compounds. Phytochemistry 1992, 31, 1173–1178. [Google Scholar] [CrossRef]
- Meirinhos, J.; Silva, B.M.; ValentÃo, P.; Seabra, R.M.; Pereira, J.A.; Dias, A.; Andrade, P.B.; Ferreres, F. Analysis and Quantification of Flavonoidic Compounds from Portuguese Olive (Olea Europaea L.) Leaf Cultivars. Nat. Prod. Res. 2005, 19, 189–195. [Google Scholar] [CrossRef]
- Haddad, P.; Eid, H. The Antidiabetic Potential of Quercetin: Underlying Mechanisms. Curr. Med. Chem. 2017, 24, 355–364. [Google Scholar] [CrossRef]
- Yao, Z.; Gu, Y.; Zhang, Q.; Liu, L.; Meng, G.; Wu, H.; Xia, Y.; Bao, X.; Shi, H.; Sun, S.; et al. Estimated Daily Quercetin Intake and Association with the Prevalence of Type 2 Diabetes Mellitus in Chinese Adults. Eur. J. Nutr. 2019, 58, 819–830. [Google Scholar] [CrossRef]
- Hao, H.; Shao, Z.; Tang, D.; Lu, Q.; Chen, X.; Yin, X.; Wu, J.; Chen, H. Preventive Effects of Rutin on the Development of Experimental Diabetic Nephropathy in Rats. Life Sci. 2012, 91, 959–967. [Google Scholar] [CrossRef]
- Zhang, Y.; Liu, D. Flavonol Kaempferol Improves Chronic Hyperglycemia-Impaired Pancreatic Beta-Cell Viability and Insulin Secretory Function. Eur. J. Pharmacol. 2011, 670, 325–332. [Google Scholar] [CrossRef]
- An, G.; Gallegos, J.; Morris, M.E. The Bioflavonoid Kaempferol Is an Abcg2 Substrate and Inhibits Abcg2-Mediated Quercetin Efflux. Drug Metab. Dispos. 2011, 39, 426–432. [Google Scholar] [CrossRef] [PubMed] [Green Version]
- Jorge, A.P.; Horst, H.; De Sousa, E.; Pizzolatti, M.G.; Silva, F.R.M.B. Insulinomimetic Effects of Kaempferitrin on Glycaemia and on 14C-Glucose Uptake in Rat Soleus Muscle. Chemico-Biol. Interact. 2004, 149, 89–96. [Google Scholar] [CrossRef]
- Zanatta, L.; Rosso, Â.; Folador, P.; Figueiredo, M.S.R.B.; Pizzolatti, M.G.; Leite, L.D.; Silva, F.R.M.B. Insulinomimetic Effect of Kaempferol 3-Neohesperidoside on the Rat Soleus Muscle. J. Nat. Prod. 2008, 71, 532–535. [Google Scholar] [CrossRef] [PubMed]
- Alkhalidy, H.; Moore, W.; Wang, Y.; Luo, J.; McMillan, R.; Zhen, W.; Zhou, K.; Liu, D. The Flavonoid Kaempferol Ameliorates Streptozotocin-Induced Diabetes by Suppressing Hepatic Glucose Production. Molecules 2018, 23, 2338. [Google Scholar] [CrossRef] [PubMed] [Green Version]
- Rauter, A.P.; Martins, A.; Borges, C.; Mota-Filipe, H.; Pinto, R.; Sepodes, B.; Justino, J. Antihyperglycaemic and Protective Effects of Flavonoids on Streptozotocin-Induced Diabetic Rats. Phytother. Res. 2010, 24, S133–S138. [Google Scholar] [CrossRef] [Green Version]
- Hossain, C.M.; Ghosh, M.K.; Satapathy, B.S.; Dey, N.S.; Mukherjee, B. Apigenin Causes Biochemical Modulation, GLUT4 and CD38 Alterations to Improve Diabetes and to Protect Damages of Some Vital Organs in Experimental Diabetes. Am. J. Pharmacol. Toxicol. 2014, 9, 39–52. [Google Scholar] [CrossRef]
- Wang, N.; Yi, W.J.; Tan, L.; Zhang, J.H.; Xu, J.; Chen, Y.; Qin, M.; Yu, S.; Guan, J.; Zhang, R. Apigenin Attenuates Streptozotocin-Induced Pancreatic β Cell Damage by Its Protective Effects on Cellular Antioxidant Defense. In Vitro Cell. Dev. Biol. Anim. 2017, 53, 554–563. [Google Scholar] [CrossRef]
- Ding, Y.; Shi, X.; Shuai, X.; Xu, Y.; Liu, Y.; Liang, X.; Wei, D.; Su, D. Luteolin Prevents Uric Acid-Induced Pancreatic β-Cell Dysfunction. J. Biomed. Res. 2014, 28, 292–298. [Google Scholar] [CrossRef] [Green Version]
- Miean, K.H.; Mohamed, S. Flavonoid (Myricetin, Quercetin, Kaempferol, Luteolin, and Apigenin) Content of Edible Tropical Plants. J. Agric. Food Chem. 2001, 49, 3106–3112. [Google Scholar] [CrossRef] [PubMed]
- Andersen, O.M.; Markham, K.R.; Markham, K.R. Flavonoids: Chemistry, Biochemistry and Applications; CRC Press: Boca Raton, FL, USA, 2005; ISBN 978-0-429-12158-6. [Google Scholar]
- National Research Council. Guide for the Care and Use of Laboratory Animals. In The National Academies Collection: Reports Funded by National Institutes of Health, 8th ed.; National Academies Press: Washington, DC, USA, 2011; ISBN 978-0-309-15400-0. [Google Scholar]
Publisher’s Note: MDPI stays neutral with regard to jurisdictional claims in published maps and institutional affiliations. |
© 2021 by the authors. Licensee MDPI, Basel, Switzerland. This article is an open access article distributed under the terms and conditions of the Creative Commons Attribution (CC BY) license (https://creativecommons.org/licenses/by/4.0/).