Article

Augmented Sensitivity of At-Home Rapid SARS-CoV-2 Antigen Test (RAT) Kits with Computer Vision: A Framework and Proof of Concept

1
School of Chemical Engineering, Aalto University, 02150 Espoo, Finland
2
School of Science, Aalto University, 02150 Espoo, Finland
3
Department of Bioproducts and Biosystems, Aalto University, 02150 Espoo, Finland
4
Department of Communications and Networking, Aalto University, 02150 Espoo, Finland
*
Author to whom correspondence should be addressed.
BioMed 2022, 2(2), 199-209; https://doi.org/10.3390/biomed2020018
Submission received: 27 February 2022 / Revised: 1 April 2022 / Accepted: 6 April 2022 / Published: 14 April 2022

Abstract

:
At-home rapid antigen test (RAT) kits for severe acute respiratory syndrome coronavirus 2 (SARS-CoV-2) are valuable public health tools during the present coronavirus disease (COVID-19) pandemic. They provide fast identification of coronavirus infection, which can help to reduce the transmission rates and burden on the healthcare system. However, they have lower sensitivity compared to the reverse transcription polymerase chain reaction (RT-PCR) tests. One of the reasons for the lower sensitivity is due to the RAT color indicators being indistinct or invisible to the naked eye after the measurements. For this reason, we present a proof of concept of a novel approach, through which we investigated anonymously provided at-home RAT kit results by using our in-house open-source image processing scripts developed for affordable Raspberry Pi computer and Raspberry Pi HQ camera systems. Therefore, we aimed at minimizing the human-related analysis errors for such kits and believe that the present computer vision-based assessment framework can contribute to reducing delayed quarantines of infected individuals and the spread of the current infectious disease.

1. Introduction

Since being declared as a global pandemic, severe acute respiratory syndrome coronavirus 2 (SARS-CoV-2) has caused dramatic public health challenges all over the world [1,2,3,4]. In order to overcome the pandemic and its consequences, various strategies including lockdowns, isolations, and preventive acts (widespread use of face masks, sanitizers, and social distancing) have been implemented worldwide [5,6,7]. Although these strategies have been effectively implemented, they are expected to result in economical and social challenges in the following years due to reduced labor and disruptions in supply-chains [8,9]. Therefore, in order to minimize the spreading of SARS-CoV-2 and constantly maintain it at a baseline level, the medical community has been working on rapid, easy-to-use, and affordable testing [10,11]. For this goal, several assays have been developed in order to identify the infected people, who may have almost no symptoms (asymptomatic), very mild, or distinct symptoms [12,13,14]. The time span of sampling and sensitivity of the assays are crucial, especially for quarantine and contact tracing at early stages [15,16]. Therefore, unprecedented global infectious diseases could be curtailed.
Among the assays, the sensitivity and specificity (referring to the probabilities of positive and negative tests, respectively) of reverse transcription polymerase chain reaction (RT-PCR) tests are undeniable [17,18,19]. RT-PCR tests are accepted as the ‘gold standard tests’, which require extraction of viral ribonucleic acid (RNA) as well as stationary instrumentation for nucleic acid amplification and detection [20]. Diagnostic laboratories routinely perform RT-PCR tests as being considered the most reliable methodology for testing of cases and contacts [21]. However, requirements for designated laboratories and equipment, specialized staff, and several hours of turnaround time for RT-PCR tests, in turn, may result in delayed diagnosis and quarantine of the infected individuals, which further causes spreading of the disease [22]. In addition, the cost of RT-PCR tests, current global demand, and procurement challenges also result in jeopardizing the health care infrastructure and management [23].
Despite their lower sensitivity compared to RT-PCR tests, rapid SARS-CoV-2 antigen test (RAT) kits, which are immunochromatographic assays, can be an affordable and timely solution for the identification and quarantine of infected individuals with minimal need of training and equipment [24,25]. RAT kits are intended for the comparative detection of nucleocapsid protein from SARS-CoV-2 in nasal swab specimens, for which the samples have to be collected within 7 days of coronavirus disease (COVID-19) symptom onset [26]. RATs detect the presence of a specific viral antigen, which implies current viral infection. They are authorized to be performed on nasopharyngeal or nasal swab specimens placed directly into the extraction buffer or reagent of the assay. The currently authorized tests include point-of-care, laboratory-based, and at-home (self-tests) and are applicable to people of any age [27]. The recently developed RAT kits offer multiple benefits in comparison to RT-PCR tests for the detection of SARS-CoV-2. They are simpler than RT-PCR tests because they do not require specially trained laboratory staff or a specialized laboratory. Results are normally generated in 10 to 30 min after the start of the analysis and at low cost [28]. Therefore, at-home RAT kits have been increasingly available for public use on the market shelves. Several hundreds of CE marked RATs have been recently included in the ‘COVID-19 In Vitro Diagnostic Devices and Test Methods Database’ of the European Commission [29].
Despite their pros, publicly available off-the-shelf at-home RAT kits quite often produce lower sensitivity compared to the standard RT-PCR tests (while their specificity is generally reported to be high) [30,31]. Unless there are significant symptoms, follow-up RT-PCR tests or RATs are ignored by most individuals, due to the increasing cost of repetitive testing (thus, financial burdens), extensive reservation queues for official testing, and high demand and low level of availability of at-home RAT kits in the market. As a result of initial false negatives (due to lower RAT sensitivity) and challenges with follow-up testing, the delays for preventive action and quarantine are inevitable, which easily result in the spreading of the infectious disease and places a heavy burden on the healthcare infrastructure.
In order to ensure and enhance the observed sensitivity of the at-home RAT kits, we developed a computer vision-based assessment framework, which uses open-source image processing libraries and highly affordable Raspberry Pi computer and camera systems (please, see the schematic illustration in Figure 1). We expect the provided framework and scripts (readily available at https://github.com/kmiikki/ratcv (accessed on 26 February 2022)) to be adopted by other researchers, which can advance the current state of the art.

2. Materials and Methods

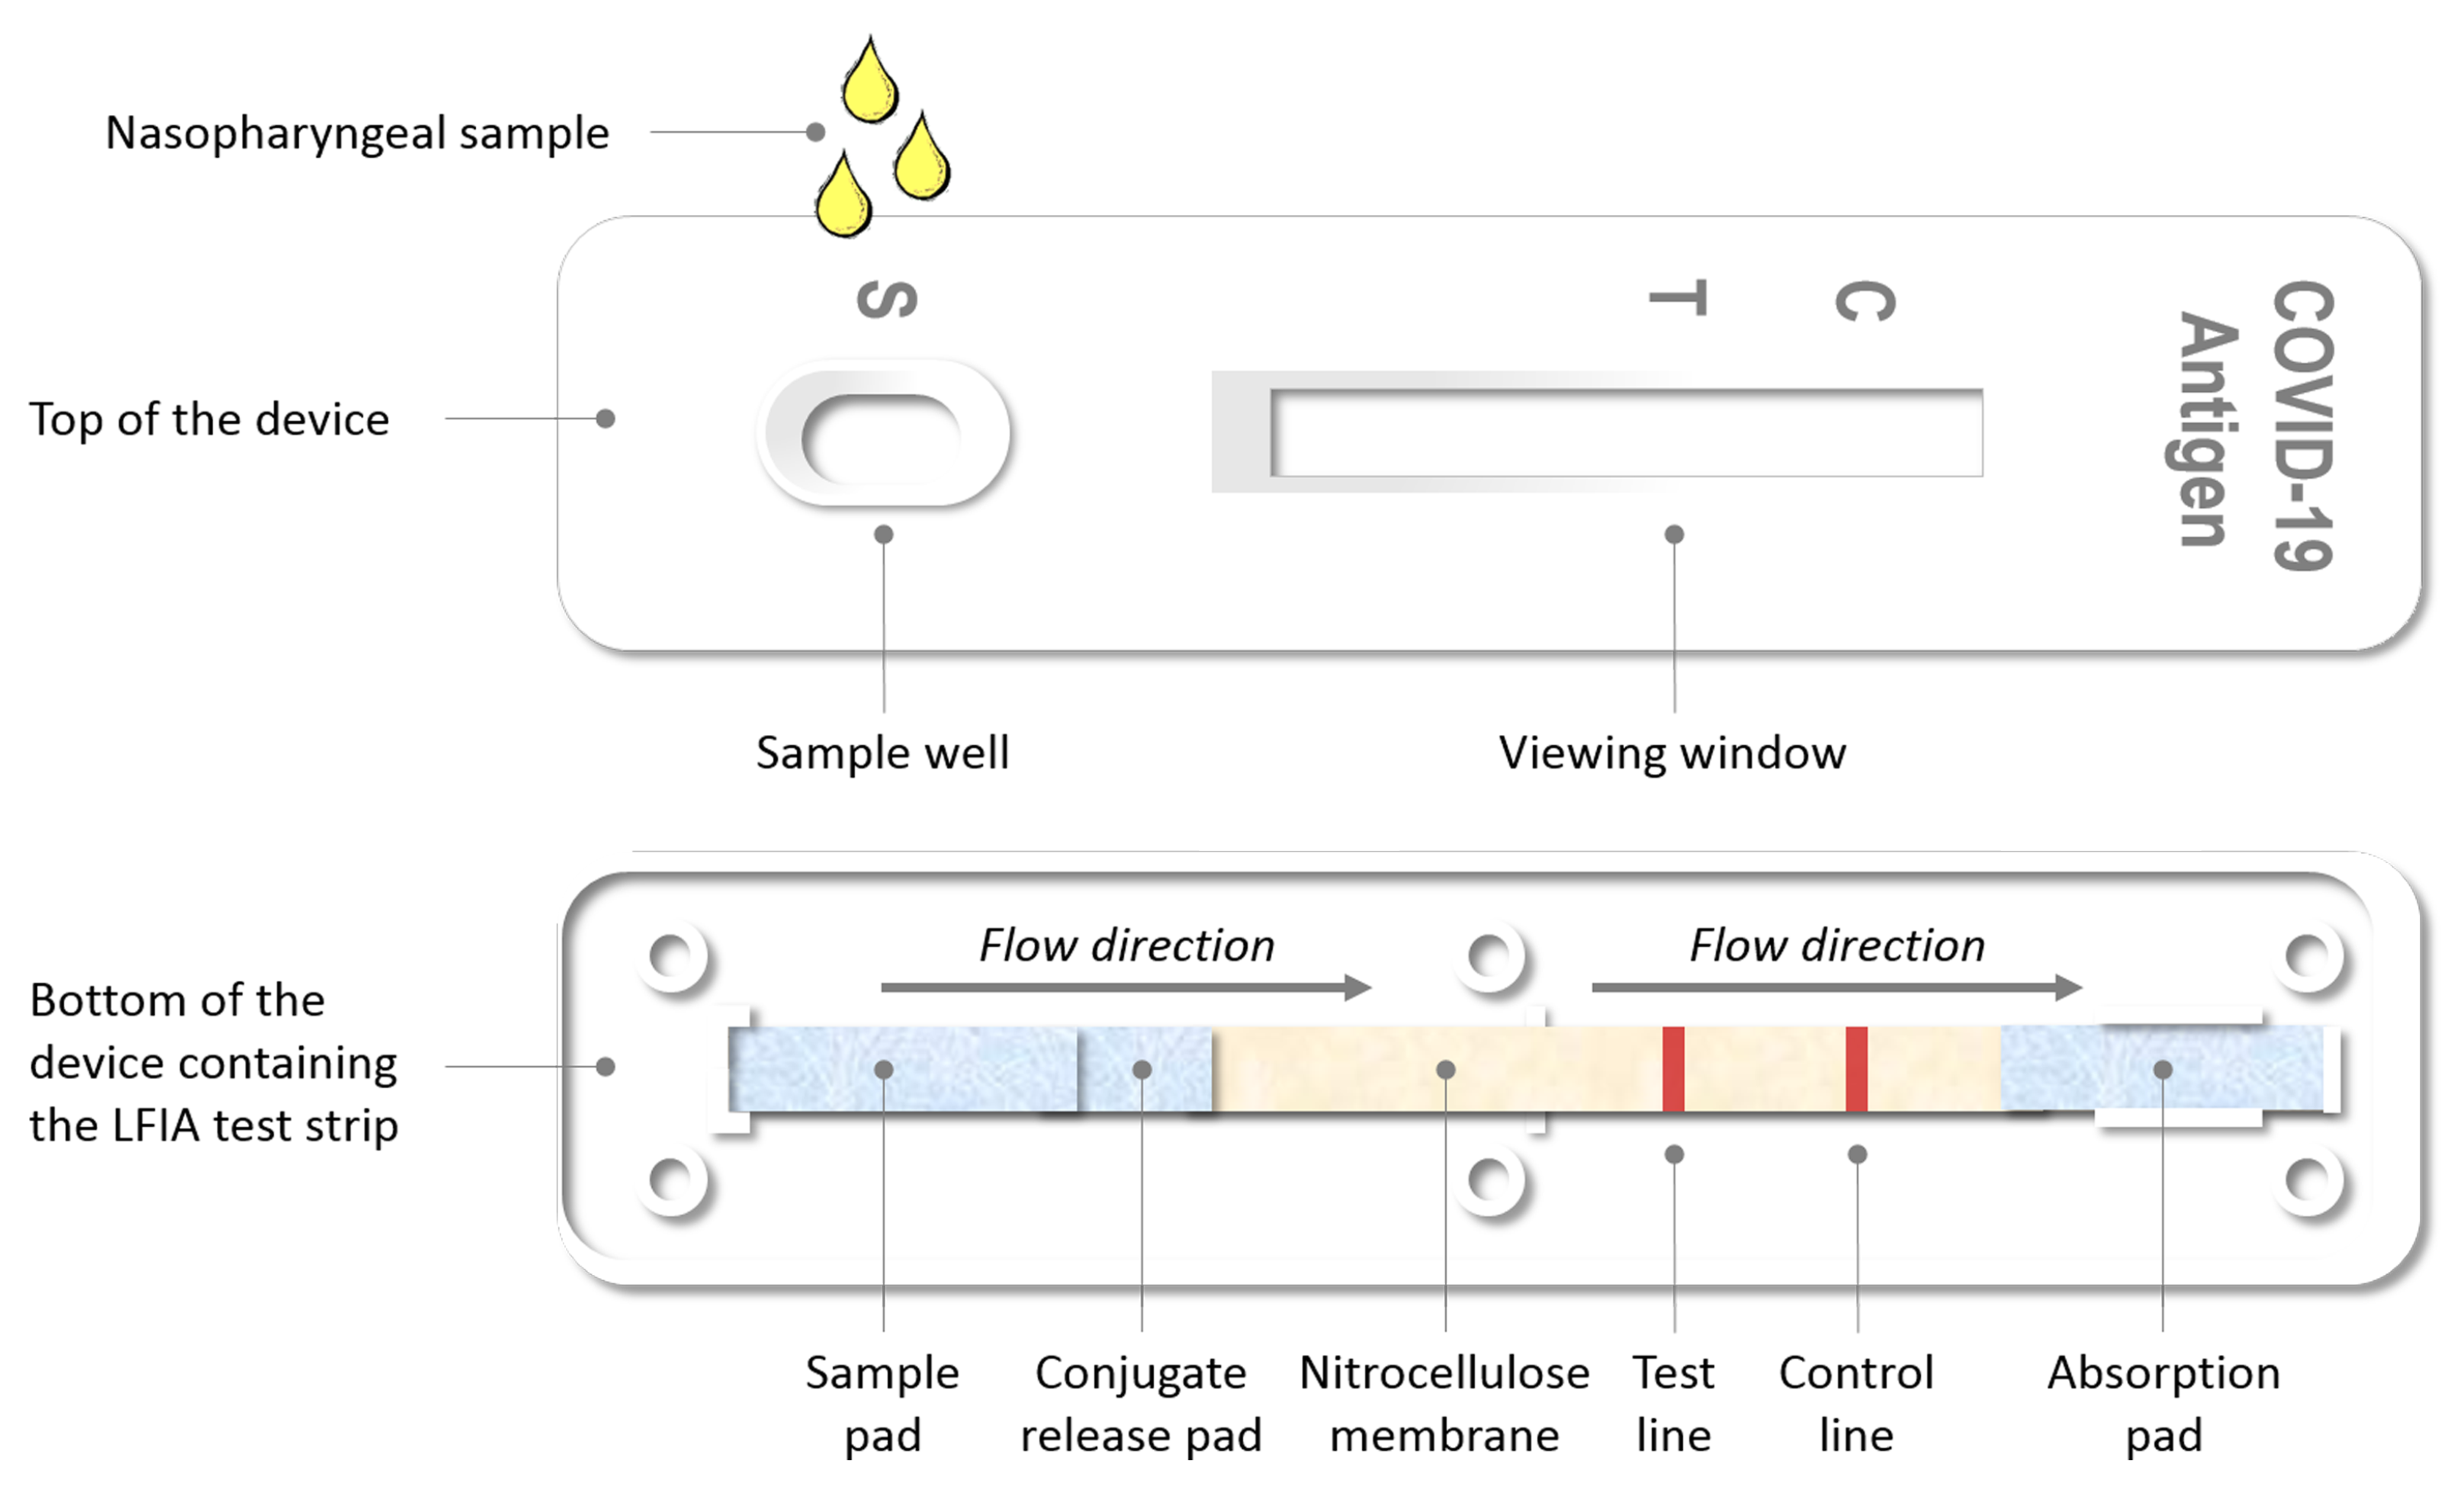
2.1. Foundations of the Evaluated Assays

The immunochromatography devices used in the present study are lateral flow immunoassays (LFIA) for the qualitative detection of specific antigens (nucleocapsid protein, nucleoprotein) of SARS-CoV-2 present in the human nasopharynx. Due to its low cost and simplicity, LFIA is the technology behind most of the commercially available RAT kits for diagnostic self-testing of SARS-CoV-2 infection and other detection devices used in various biomedical and environmental studies [32].
The principle of LFIA is based on the capillary flow of a liquid sample through a polymeric strip containing molecules that interact with the analyte providing a signal, which can be visually detected. As shown in Figure 2, a lateral flow test strip is typically composed of overlapping membranes, which are mounted on an inert backing card for better stability and handling. The main active components of the strip are: sample pad, conjugate release pad, nitrocellulose membrane containing the test line (T line) and control line (C line), and absorption pad [33,34,35]. To start the assay, the sample is first applied on the sample pad. It then migrates through the conjugate release pad, which contains target antigen-specific labeled antibodies. If the antigen is present, the antibody will bind to it and form a molecular complex suitable for interaction with the detection system. As the antibody-antigen complex moves along the nitrocellulose membrane, the binding reagents covering the T line will bind to the complex. A colored line will form, and the density of the line will vary depending on the quantity of the target present. A visual C line should appear next to the T line indicating that the test is valid. The read-out, represented by the appearing of the lines, can be assessed by eye or computer vision for augmented sensitivity as proposed in the present study. Two lines (T + C lines) indicate a positive result, while one line (C line) indicates a negative result.
In RAT kits, the strip is, in general, packaged in a small cartridge that protects its components and makes the test very simple for anyone to perform. The result should be seen with the naked eye within the specified test time, but sometimes this is not the case, for example, if the level of the virus is very low in the nasopharyngeal sample.

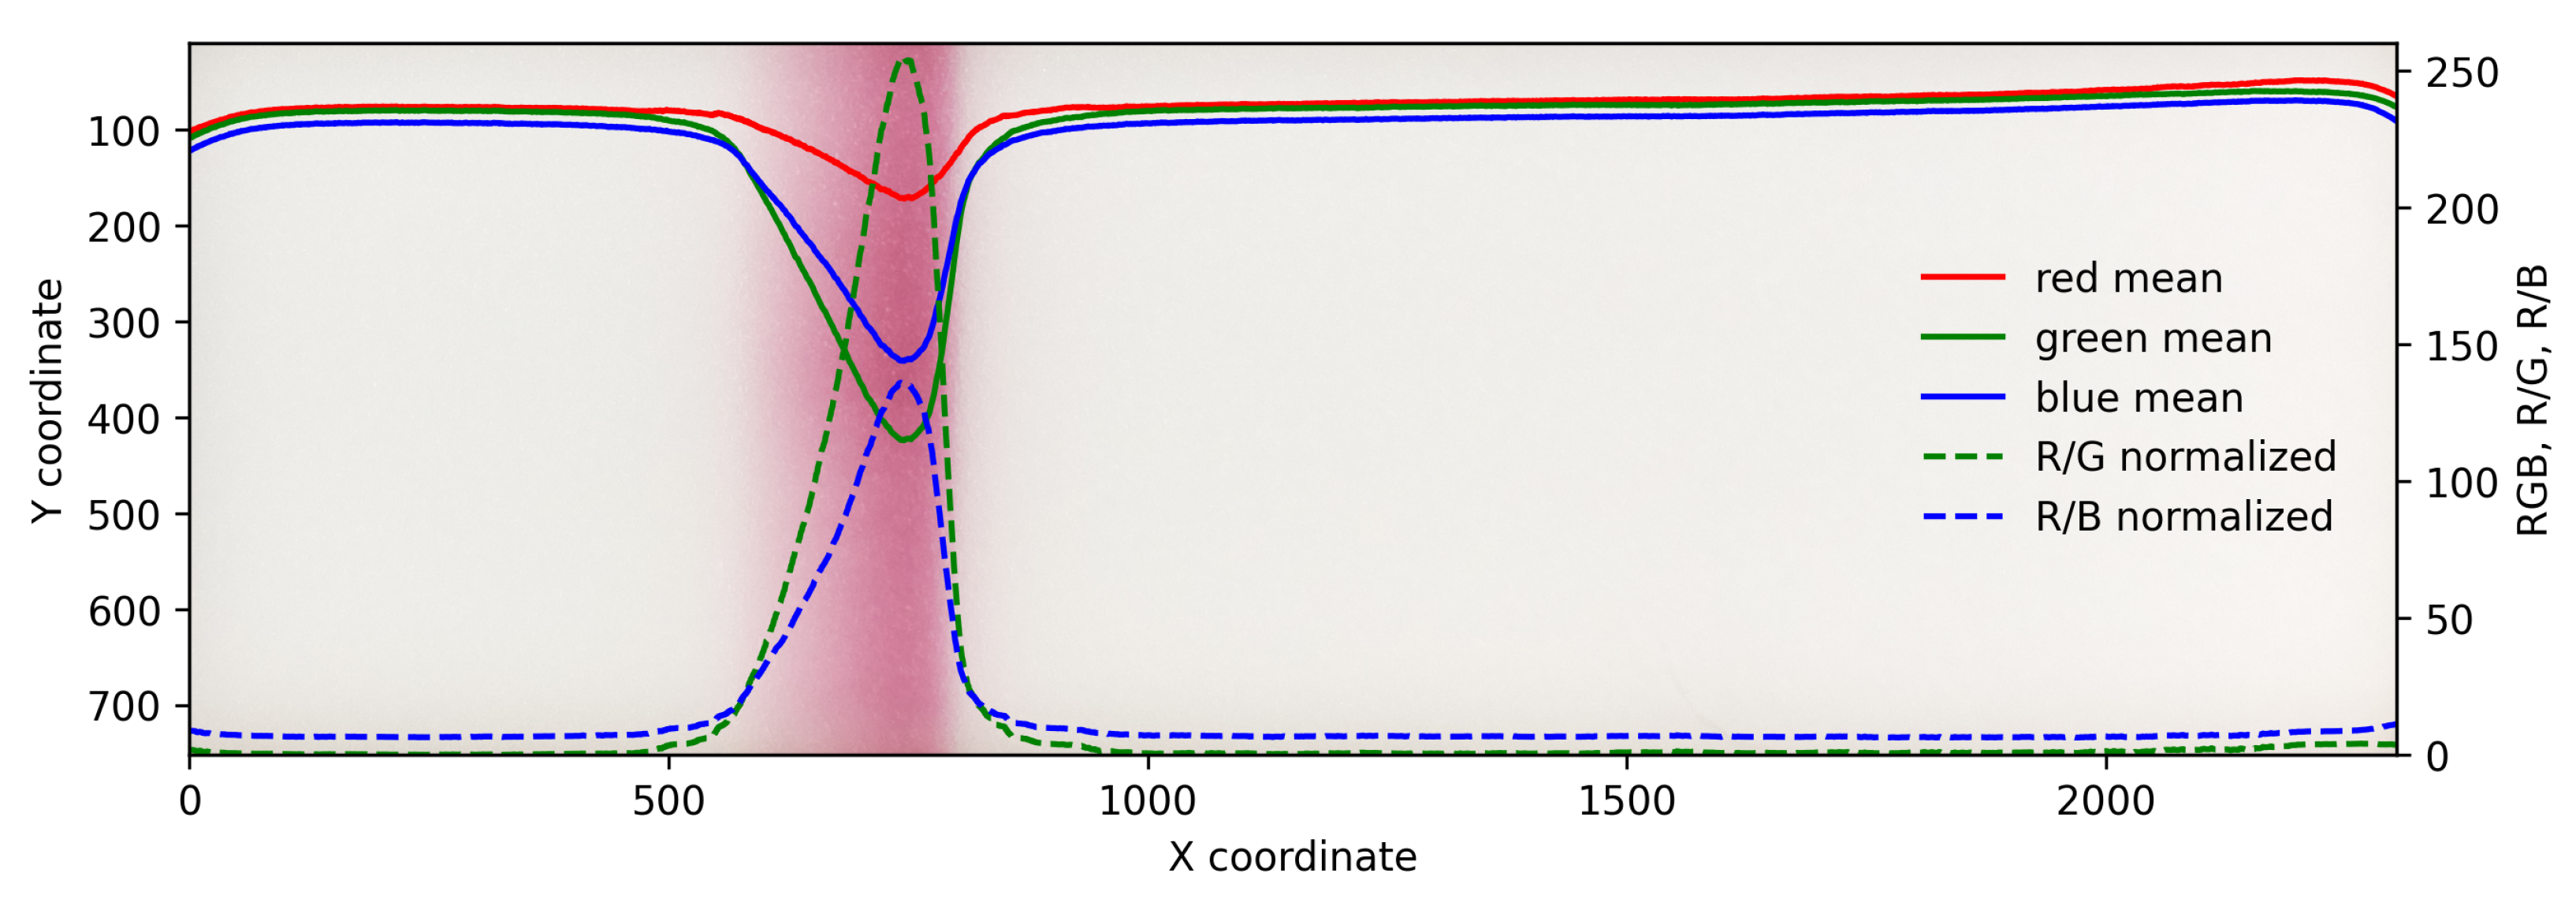
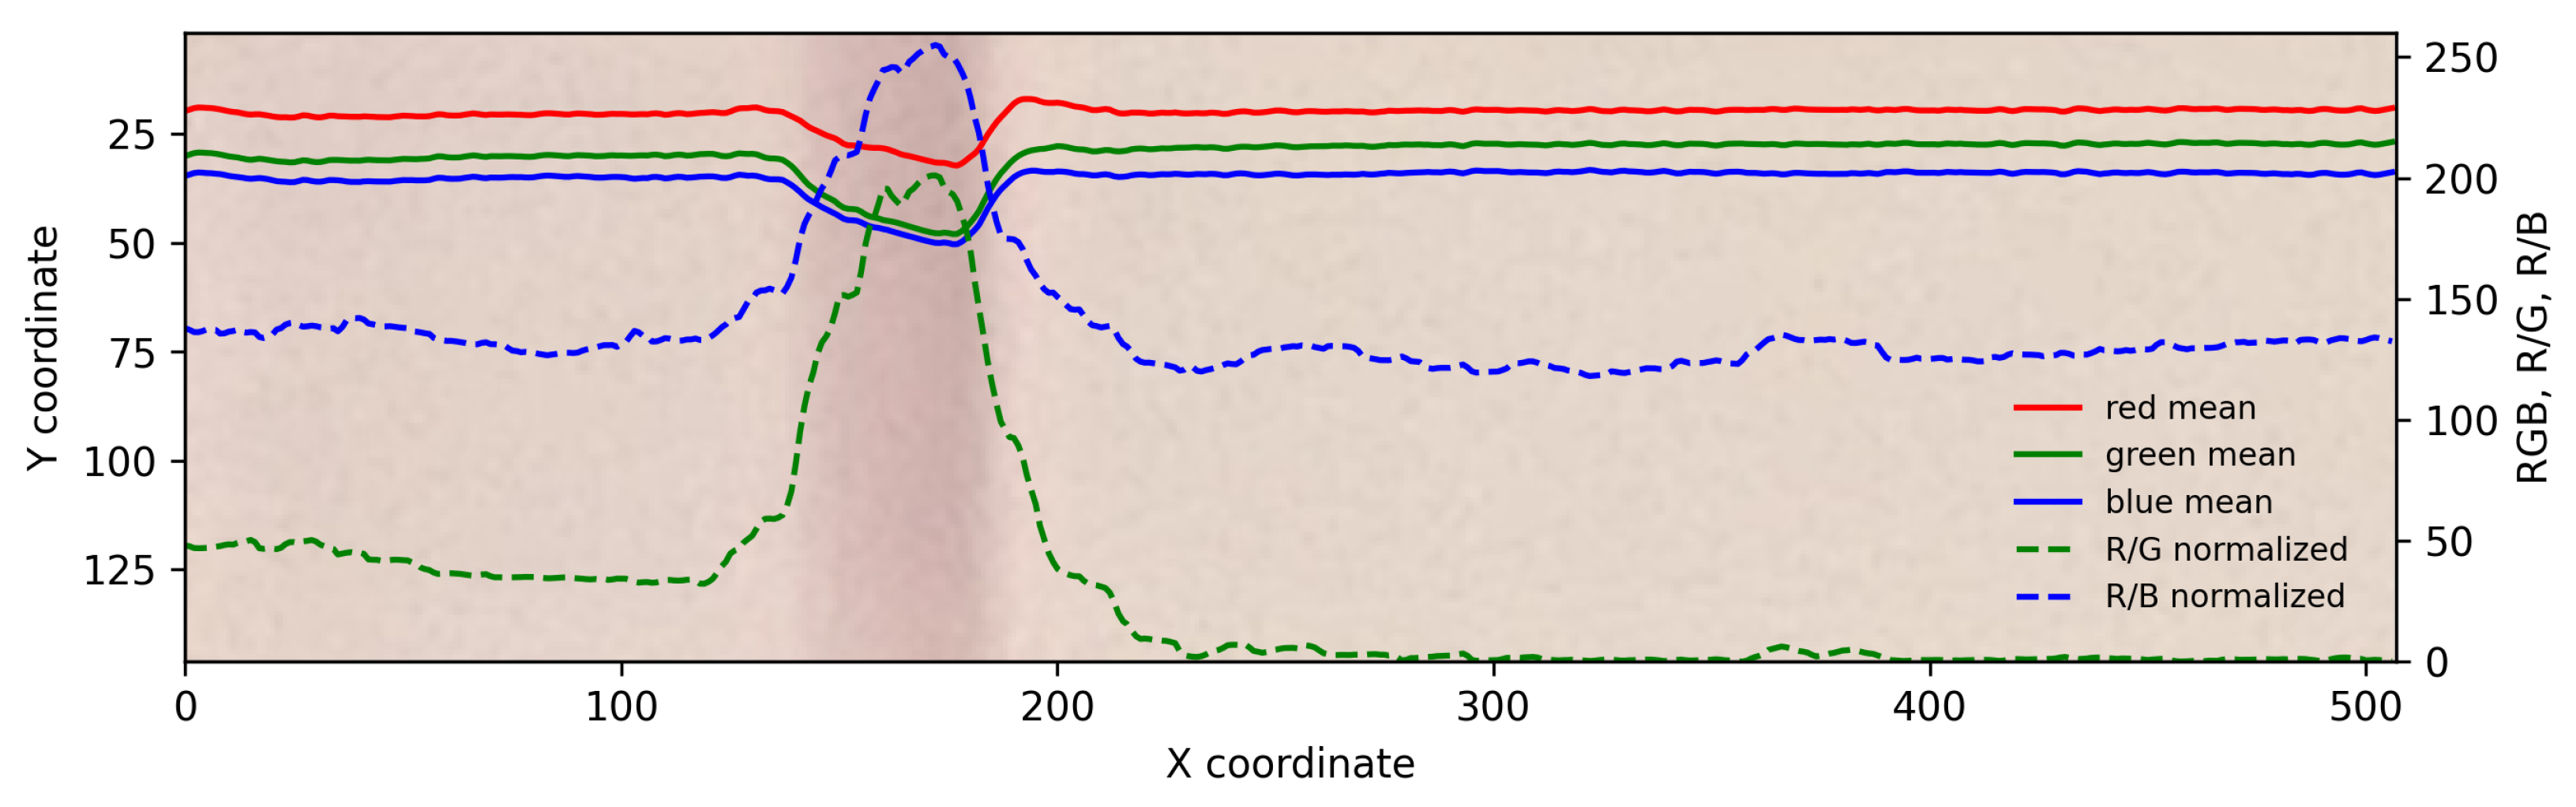
2.2. Sampling and Color Analysis

To test and demonstrate the practical viability of our framework, we tested it in real-life context using selected RAT kits widely available in the consumer market. The total number of people who participated in COVID-19 in vitro antigen testing was 9, and the tests used were: Boson Biotech Rapid SARS-CoV-2 Antigen Test Card (cases 1 and 2), Alltest SARS-CoV-2 Antigen Rapid Test (Nasal Swab) (cases 3 and 4), and Deepblue COVID-19 (SARS-CoV-2). According to the manufacturers, all these tests met the minimum recommendations for rapid antigen detection tests, given by the European Center for Disease Prevention and Control: ≥90% sensitivity and >98% specificity [36].
The images and videos for the RGB analysis were captured with a Raspberry Pi based system [37]. The optical setup for imaging RAT windows is shown in Figure 3. A 35 mm Waveshare telephoto lens for Pi was used with three C-CS adapters to get a minimum focusing distance close enough for macro photography. The test cartridge was illuminated with three Manfrotto Lumimuse 8 LED lights, and the colors were calibrated by using a gray card (Lastolite Ezybalance).
The color analysis used in this study is based on directional color profiling by red, green, and blue colors; the colors are marked in all figures as R, G, and B, respectively. The mean of the three colors is interpreted as gray and noted here as black and white (BW). Color profiling is normally done in horizontal or vertical directions. Each row or column of pixels is read, its means of R, G, and B are calculated, and these values represent the color values for the current coordinate (x or y). The eluent in a chromatographic test moves in one direction, and the C and T lines are aligned perpendicular to the fluid direction; therefore, color profiling is only needed in one direction, which has been chosen here as horizontal (x) direction.
All captured images were processed and analyzed using Python scripts [38]. Before capturing any pictures, the Raspberry Pi camera sensor red and blue gains were calibrated by using the mapgains.py. Thereafter, manual white balance, with the acquired gain values, were used with a constant shutter speed. In order to perform a decent directional color analysis, the image should be straight, and only the test windows should be analyzed. The corresponding image operations are rotate and crop. The image composition should be composed properly, so there should not be any need to rotate the images. The directional color analysis can be performed with rgbxy.py, the peak properties can be examined with rgbxy-peaks.py, and finally, the internal ratios of red, green, and blue can be inspected by executing rgbxy-iratios.py.

3. Results

3.1. Detection of Simulated Weak Test Lines

The white part of a negative test, which is described in the next subsection, was used as a template for simulated weak T lines. These were created with testlines.py script. Red, green, and blue ratios were acquired from a positive T line which was analyzed using rgb-peaks.py peak find utility. The color ratios for the simulated lines are R:G:B = 0.21:0.43:0.36, where R is a peak and G, B are valleys. The line width is 40, including a 35-pixels-wide gradual fading on the right side, the distance between the two lines is 50 pixels wide, and the maximum strengthening per line is 2.0. The following command generates the Figure 4a, when the name of the template is test_area.png: testlines.py test_area.png -w 40 -d 50 -right -r -dec -grad 35 -rf 0.21 -gf 0.43 -bf 0.36 -s 2.
A directional color analysis of the created T lines was performed, and the horizontal BW (mean of R, G, and B channels) and RGB profiles are shown in Figure 4b,c, respectively. The weakest lines are barely seen in the BW profile, but they are more visible in the RGB profile. However, when dividing colors with each other, or with the means of two colors, the color differences can often be enhanced, especially if any of the color peaks point in the opposite direction. This can be seen in Figure 4d, where R represents a color peak and G and B color valleys while the R/G and R/B horizontal color ratios are normalized to values between 0–255.

3.2. Detection of C Line

Sensitivity of this color analysis method can be used to study how fast the C line is detectable. First, a video was captured; then, its images were extracted and cropped at the C line area. X directional color analysis was performed, and local extrema for RGB channels were detected. The extremum height is the absolute difference between its value and the baseline color intensity level value. In this experiment, all RGB channel extrema were valleys. The results are shown in Figure 5.
The RGB valleys were detected starting from t = 55 s, when the eluent was propagating over the C line zone. The Figure 5b indicates very strong changes for all RGB channels, especially the green and blue channel. The decrease in color intensities starts immediately when the eluent reaches the C line area.

3.3. Case 1 Negative (Reference Case)

A negative COVID-19 RAT was performed as a reference, by analyzing only the extraction buffer without a biological specimen. The C line appeared in the test window, which can be seen in Figure 6. Only one valley is detected at the same x coordinate range as the C line, as expected. The weakening of the red color is smaller than for blue and green, hence the R/G and R/B ratios give strong peaks, and the C line has a red hue. The RAT was done correctly, and the result was negative.

3.4. Case 2 False Negative—Very Weak Positive

In this case, the picture was acquired in auto white balance mode with a smartphone (Nokia 8 Sirocco) after the RAT, and analyzed with a Raspberry Pi computer. The image was cropped, and a directional RGB analysis was performed in x direction. The result was negative with the naked eye, as well with the basic color analysis in Figure 7. However, as seen in R/G and R/B color ratios profile, a very weak signal can be detected at x = 350–400, if the red channel values are divided with green or blue color values. An official RT-PCR test was performed the next day by HUS labs (Finland), and the result was determined to be positive, which confirms the analysis.

3.5. Case 3 False Negative—Weak Positive

COVID-19 RAT was performed by a person at home, and two lines appeared in the test window: C line and T line. Both lines were visible for at least 20 min, and the test result was determined to be positive. However, after 12 h, the T line had disappeared from the test window. An image was captured of the aged test window, cropped, and analyzed with rgbxy.py and rgb-iratios.py. The results can be seen in Figure 8, where the second signal is still observable at x ≈ 2000. The detected signal is at the T line. Therefore, the RGB color analysis indicates a positive signal, as well as the original result of the test.

3.6. Case 4 Positive

This COVID-19 RAT gave a positive result, and the test window was captured after 20 min from the start of the test. Both C and T lines are visible in Figure 9. The cropped test window was analyzed, and the strong signals appear at C and T lines. The test window and its color profile indicate a positive test result.

4. Discussion

RT-PCR testing is the key criterion, or ‘gold standard test’, for identification and hospital discharging for the diagnosed patients. However, repetitive testing leads to increasing costs, jeopardizing the healthcare infrastructure and prolonged hospitalizations [39]. Therefore, alternative test methods have been proposed, out of which RATs emerge as a viable alternative for mass testing. RATs have low cost, short turnaround time, vast availability, and ease of use as some of their pros. However, their reported lower sensitivity in comparison to RT-PCR test results require further investigations for identification and early diagnosis [40]. As a contribution to these investigations on the RATs, we proposed an augmented sensitivity method through computer vision, which uses affordable hardware (Raspberry Pi computer and Raspberry Pi camera or mobile phone camera in our case studies) and open-source scripts readily available at our Github repository. In these investigations, the principal idea is to evaluate the RAT results using color analysis and detect whether there is any presence of viral antigens and color indication, which may not be seen with the naked eye and, thus, result in false negatives and decrease the sensitivity of RAT kits.
Based on our methodology, we managed to detect false negative results, for which there was no clear indicative T line on the result window of the test strip. In Case 2, we examined the RAT result, for which there was no clear indication of a T line with the naked eye. Thus, the patient considered it as a negative result. However, the next day, the RT-PCR test result was positive. Our method showed a very weak signal around the T line as seen in Figure 7b, which was also interpreted as a positive result. In Case 3, an extraordinary case was assessed such that the color indication around the T line disappeared after 12 h. Similar to Case 2, our investigations for this case with the color analysis again showed a signal around the T line, which means that the patient was infected. Therefore, our framework can be used as an inexpensive yet preventive approach, which enhances the current level of sensitivity of RAT kits by analyzing the color of the T line. The analysis of the RAT kits can be done at home using a mobile phone camera and a Raspberry Pi computer. As our proof of concept demonstrates, our framework is a promising, new, highly affordable technique which can be developed to contribute to reducing delayed quarantines of infected individuals and the spread of the current infectious disease. While this proof of concept demonstrates the technical feasibility of our framework, further investigations would be valuable to verify how much enhancement in the sensitivity can be achieved by using the method and how much the analysis system can reduce the false-negative rate.
By means of the present framework, sensitivity investigations of samples collected from patients of varying conditions and age groups can also be used to generate statistical models, which provides a deep insight into the transmission routes and risks of the current viral infection. The present framework can be further developed to generate a centralized database and used to provide early diagnosis, or at least preventive actions just in time. Eventually, delayed quarantine of infected individuals and spreading of the current infectious disease can be reduced.
Additionally, we believe that the framework can, in the future, be successfully applied also to other areas of chromatography.

Author Contributions

K.M., J.W. and A.K. generated the concept. K.M. was the main programmer and tester, while A.K. assisted for the earlier scripts to realize the work. K.M., L.M., J.W. and A.K. All authors have read and agreed to the published version of the manuscript.

Funding

A.K. gratefully acknowledges the funding from the Academy of Finland BESIMAL project (decision number 334197). J.W. also acknowledges the funding from the Jenny and Antti Wihuri Foundation.

Institutional Review Board Statement

Not applicable.

Informed Consent Statement

Informed consent was obtained from all subjects involved in the study.

Data Availability Statement

The scripts are accessible at https://github.com/kmiikki/ratcv (accessed on 26 Feburary 2022).

Conflicts of Interest

The authors declare no conflict of interest.

References

  1. Weitzel, T.; Legarraga, P.; Iruretagoyena, M.; Pizarro, G.; Vollrath, V.; Araos, R.; Munita, J.M.; Porte, L. Head-to-head comparison of four antigen-based rapid detection tests for the diagnosis of SARS-CoV-2 in respiratory samples. BioRxiv 2020. [Google Scholar] [CrossRef]
  2. Salvagno, G.L.; Gianfilippi, G.; Bragantini, D.; Henry, B.M.; Lippi, G. Clinical assessment of the Roche SARS-CoV-2 rapid antigen test. Diagnosis 2021, 8, 322–326. [Google Scholar] [CrossRef]
  3. Porte, L.; Legarraga, P.; Vollrath, V.; Aguilera, X.; Munita, J.M.; Araos, R.; Pizarro, G.; Vial, P.; Iruretagoyena, M.; Dittrich, S.; et al. Evaluation of a novel antigen-based rapid detection test for the diagnosis of SARS-CoV-2 in respiratory samples. Int. J. Infect. Dis. 2020, 99, 328–333. [Google Scholar] [CrossRef]
  4. Nioi, M.; Napoli, P.E.; Finco, G.; Demontis, R.; Fossarello, M.; d’Aloja, E. Fear of the COVID-19 and medical liability. Insights from a series of 130 consecutives medico-legal claims evaluated in a single institution during SARS-CoV-2-related pandemic. J. Anesth. Intens. Care Emerg. Pain Med. 2021, 17, 79–85. [Google Scholar]
  5. Sen-Crowe, B.; McKenney, M.; Elkbuli, A. Social distancing during the COVID-19 pandemic: Staying home save lives. Am. J. Emerg. Med. 2020, 38, 1519–1520. [Google Scholar] [CrossRef]
  6. Lippi, G.; Henry, B.M.; Bovo, C.; Sanchis-Gomar, F. Health risks and potential remedies during prolonged lockdowns for coronavirus disease 2019 (COVID-19). Diagnosis 2020, 7, 85–90. [Google Scholar] [CrossRef]
  7. Bostanci Ceran, B.; Karakoç, A.; Taciroğlu, E. Airborne pathogen projection during ophthalmic examination. Graefes Arch. Clin. Exp. Ophthalmol. 2020, 258, 2275–2282. [Google Scholar] [CrossRef]
  8. Hobbs, J.E. Food supply chains during the COVID-19 pandemic. Can. J. Agric. Econ. Can. D’Agroecon. 2020, 68, 171–176. [Google Scholar] [CrossRef] [Green Version]
  9. Pujawan, I.N.; Bah, A.U. Supply chains under COVID-19 disruptions: Literature review and research agenda. In Supply Chain Forum: An International Journal; Taylor & Francis: Abingdon, UK, 2021; pp. 1–15. [Google Scholar]
  10. Crozier, A.; Rajan, S.; Buchan, I.; McKee, M. Put to the test: Use of rapid testing technologies for COVID-19. BMJ 2021, 372, n208. [Google Scholar] [CrossRef]
  11. Eshghifar, N.; Busheri, A.; Shrestha, R.; Beqaj, S. Evaluation of analytical performance of seven rapid antigen detection kits for detection of SARS-CoV-2 virus. Int. J. Gen. Med. 2021, 14, 435. [Google Scholar] [CrossRef]
  12. Yang, R.; Gui, X.; Xiong, Y. Comparison of clinical characteristics of patients with asymptomatic vs symptomatic coronavirus disease 2019 in Wuhan, China. JAMA Netw. Open 2020, 3, e2010182. [Google Scholar] [CrossRef]
  13. Lavezzo, E.; Franchin, E.; Ciavarella, C.; Cuomo-Dannenburg, G.; Barzon, L.; Del Vecchio, C.; Rossi, L.; Manganelli, R.; Loregian, A.; Navarin, N.; et al. Suppression of a SARS-CoV-2 outbreak in the Italian municipality of Vo’. Nature 2020, 584, 425–429. [Google Scholar] [CrossRef]
  14. Khan, S.; Ali, A.; Shi, H.; Siddique, R.; Nabi, G.; Hu, J.; Wang, T.; Dong, M.; Zaman, W.; Han, G.; et al. COVID-19: Clinical aspects and therapeutics responses. Saudi Pharm. J. 2020, 28, 1004–1008. [Google Scholar] [CrossRef]
  15. Burki, T.K. Testing for COVID-19. Lancet Respir. Med. 2020, 8, e63–e64. [Google Scholar] [CrossRef]
  16. Nalumansi, A.; Lutalo, T.; Kayiwa, J.; Watera, C.; Balinandi, S.; Kiconco, J.; Nakaseegu, J.; Olara, D.; Odwilo, E.; Serwanga, J.; et al. Field evaluation of the performance of a SARS-CoV-2 antigen rapid diagnostic test in Uganda using nasopharyngeal samples. Int. J. Infect. Dis. 2021, 104, 282–286. [Google Scholar] [CrossRef]
  17. Vashist, S.K. In vitro diagnostic assays for COVID-19: Recent advances and emerging trends. Diagnostics 2020, 10, 202. [Google Scholar] [CrossRef] [Green Version]
  18. Khalid, M.F.; Selvam, K.; Jeffry, A.J.N.; Salmi, M.F.; Najib, M.A.; Norhayati, M.N.; Aziah, I. Performance of Rapid Antigen Tests for COVID-19 Diagnosis: A Systematic Review and Meta-Analysis. Diagnostics 2022, 12, 110. [Google Scholar] [CrossRef]
  19. Jääskeläinen, A.; Ahava, M.J.; Jokela, P.; Szirovicza, L.; Pohjala, S.; Vapalahti, O.; Lappalainen, M.; Hepojoki, J.; Kurkela, S. Evaluation of three rapid lateral flow antigen detection tests for the diagnosis of SARS-CoV-2 infection. J. Clin. Virol. 2021, 137, 104785. [Google Scholar] [CrossRef]
  20. Corman, V.M.; Landt, O.; Kaiser, M.; Molenkamp, R.; Meijer, A.; Chu, D.K.; Bleicker, T.; Brünink, S.; Schneider, J.; Schmidt, M.L.; et al. Detection of 2019 novel coronavirus (2019-nCoV) by real-time RT-PCR. Eurosurveillance 2020, 25, 2000045. [Google Scholar] [CrossRef] [Green Version]
  21. ECDC. Options for the Use of Rapid Antigen Tests for COVID-19 in the EU/EEA and the UK; Technical Report; ECDC: Solna, Sweden, 2020. [Google Scholar]
  22. Kretzschmar, M.E.; Rozhnova, G.; Bootsma, M.C.; van Boven, M.; van de Wijgert, J.H.; Bonten, M.J. Impact of delays on effectiveness of contact tracing strategies for COVID-19: A modelling study. Lancet Public Health 2020, 5, e452–e459. [Google Scholar] [CrossRef]
  23. Thornton, J. Covid-19: Delays in getting tests are keeping doctors from work, health leaders warn. BMJ 2020, 370, m3755. [Google Scholar] [CrossRef]
  24. Merckx, J.; Wali, R.; Schiller, I.; Caya, C.; Gore, G.C.; Chartrand, C.; Dendukuri, N.; Papenburg, J. Diagnostic accuracy of novel and traditional rapid tests for influenza infection compared with reverse transcriptase polymerase chain reaction: A systematic review and meta-analysis. Ann. Intern. Med. 2017, 167, 394–409. [Google Scholar] [CrossRef]
  25. Pray, I.W. Performance of an antigen-based test for asymptomatic and symptomatic SARS-CoV-2 testing at two university campuses—Wisconsin, September–October 2020. MMWR. Morb. Mortal. Wkly. Rep. 2021, 69, 1642–1647. [Google Scholar] [CrossRef]
  26. Embrett, M.; Sim, M. At-Home COVID-19 Testing: A Rapid Scoping Review. 2021. Available online: https://sporevidencealliance.ca/wp-content/uploads/2021/05/At-home-COVID-19-testing_Full-Report_2021.02.12.pdf (accessed on 8 May 2021).
  27. CDC. Interim Guidance for Antigen Testing for SARS-CoV-2; CDC: Atlanta, GA, USA, 2022. [Google Scholar]
  28. Weitzel, T.; Legarraga, P.; Iruretagoyena, M.; Pizarro, G.; Vollrath, V.; Araos, R.; Munita, J.M.; Porte, L. Comparative evaluation of four rapid SARS-CoV-2 antigen detection tests using universal transport medium. Travel Med. Infect. Dis. 2021, 39, 101942. [Google Scholar] [CrossRef]
  29. European Commission. COVID-19 In Vitro Diagnostic Devices and Test Methods Database; European Commission: Brussels, Belgium, 2022. [Google Scholar]
  30. Ciotti, M.; Maurici, M.; Pieri, M.; Andreoni, M.; Bernardini, S. Performance of a rapid antigen test in the diagnosis of SARS-CoV-2 infection. J. Med. Virol. 2021, 93, 2988–2991. [Google Scholar] [CrossRef]
  31. Mendels, D.A.; Dortet, L.; Emeraud, C.; Oueslati, S.; Girlich, D.; Ronat, J.B.; Bernabeu, S.; Bahi, S.; Atkinson, G.J.; Naas, T. Using artificial intelligence to improve COVID-19 rapid diagnostic test result interpretation. Proc. Natl. Acad. Sci. USA 2021, 118, e2019893118. [Google Scholar] [CrossRef]
  32. Koczula, K.M.; Gallotta, A. Lateral flow assays. Essays Biochem. 2016, 60, 111–120. [Google Scholar]
  33. Berg, J.M.; Tymoczko, J.L.; Stryer, L. Biochemistry, 5th ed.; International Version; W. H. Freeman: New York, NY, USA, 2002; pp. 921–950. [Google Scholar]
  34. Yetisen, A.K.; Akram, M.S.; Lowe, C.R. based microfluidic point-of-care diagnostic devices. Lab Chip 2013, 13, 2210–2251. [Google Scholar] [CrossRef]
  35. Hansson, J.; Yasuga, H.; Haraldsson, T.; Van der Wijngaart, W. Synthetic microfluidic paper: High surface area and high porosity polymer micropillar arrays. Lab Chip 2016, 16, 298–304. [Google Scholar] [CrossRef] [Green Version]
  36. ECDC. Options for the Use of Rapid Antigen Detection Tests for COVID-19 in the EU/EEA—First Update; Technical Report; ECDC: Solna, Sweden, 2021. [Google Scholar]
  37. Miikki, K.; Karakoç, A.; Rafiee, M.; Lee, D.W.; Vapaavuori, J.; Tersteegen, J.; Lemetti, L.; Paltakari, J. An open-source camera system for experimental measurements. SoftwareX 2021, 14, 100688. [Google Scholar] [CrossRef]
  38. Miikki, K. Raspberry Pi High Speed Camera. Available online: https://github.com/kmiikki/rpi-camera (accessed on 26 February 2022).
  39. Iancu, R.I.; Zară, A.D.; Mireștean, C.C.; Iancu, D.P.T. Radiomics in COVID-19: The Time for (R) evolution Has Came. BioMed 2022, 2, 60–68. [Google Scholar] [CrossRef]
  40. Mattiuzzi, C.; Henry, B.M.; Lippi, G. Making sense of rapid antigen testing in severe acute respiratory syndrome coronavirus 2 (SARS-CoV-2) diagnostics. Diagnosis 2021, 8, 27–31. [Google Scholar] [CrossRef]
Figure 1. Schematic illustration of the present framework for augmented sensitivity of at-home rapid antigen test (RAT) kits with affordable hardware and open-source scripts and libraries.
Biomed 02 00018 g001
Figure 2. Typical lateral flow immunoassay (LFIA) test strip configuration in RAT devices.
Biomed 02 00018 g002
Figure 3. A Raspberry Pi-based photo system for macro imaging coronavirus disease (COVID-19) RAT windows.
Biomed 02 00018 g003
Figure 4. (a) Weak test lines (T lines) created with testlines.py script, (b) BW horizontal color profile of the T line image, (c) horizontal RGB channels profile, (d) R/G and R/B color ratios profile.
Biomed 02 00018 g004
Figure 5. Appearance of the control line (C line): (a) time series of the C line after the specimen is applied to the sample pad, (b) detection of RGB extrema, and their absolute color height values as a function of time.
Biomed 02 00018 g005
Figure 6. Negative RAT result of the extraction buffer liquid: only the C line is visible, horizontal RGB color profile, normalized R/G and R/B ratios horizontal profile.
Biomed 02 00018 g006
Figure 7. Negative COVID-19 RAT result with only a visible C line using the naked eye or basic color analysis. A very weak signal in R/G and R/B color ratios profile.
Biomed 02 00018 g007
Figure 8. Originally positive COVID-19 RAT turning into negative after several hours (only the C line is visible after 12 h; however, the T line was also visible during the first 20 min test time); a weak signal in the color profile is detected around x = 2000.
Biomed 02 00018 g008
Figure 9. Positive COVID-19 RAT with visible C and T lines.
Biomed 02 00018 g009
Publisher’s Note: MDPI stays neutral with regard to jurisdictional claims in published maps and institutional affiliations.

