Entry

Partially Ordered Sets in Socio-Economic Data Analysis

Department of Statistics and Quantitative Methods, University of Milano-Bicocca, Via Bicocca degli Arcimboldi, 8, 20126 Milano, Italy
*
Author to whom correspondence should be addressed.
Encyclopedia 2025, 5(3), 100; https://doi.org/10.3390/encyclopedia5030100
Submission received: 29 May 2025 / Revised: 3 July 2025 / Accepted: 8 July 2025 / Published: 11 July 2025
(This article belongs to the Collection Encyclopedia of Social Sciences)

Definition

A partially ordered set (or a poset, for short) is a set endowed with a partial order relation, i.e., with a reflexive, anti-symmetric, and transitive binary relation. As mathematical objects, posets have been intensively studied in the last century, coming to play essential roles in pure mathematics, logic, and theoretical computer science. More recently, they have been increasingly employed in data analysis, multi-criteria decision-making, and social sciences, particularly for building synthetic indicators and extracting rankings from multidimensional systems of ordinal data. Posets naturally represent systems and phenomena where some elements can be compared and ordered, while others cannot be and are then incomparable. This makes them a powerful data structure to describe collections of units assessed against multidimensional variable systems, preserving the nuanced and multi-faceted nature of the underlying domains. Moreover, poset theory collects the proper mathematical tools to treat ordinal data, fully respecting their non-numerical nature, and to extract information out of order relations, providing the proper setting for the statistical analysis of multidimensional ordinal data. Currently, their use is expanding both to solve open methodological issues in ordinal data analysis and to address evaluation problems in socio-economic sciences, from multidimensional poverty, well-being, or quality-of-life assessment to the measurement of financial literacy, from the construction of knowledge spaces in mathematical psychology and education theory to the measurement of multidimensional ordinal inequality/polarization.

1. Introduction

Partially ordered sets (posets) are relevant in socio-economic studies and data analysis for both conceptual and technical reasons. Phenomena like poverty, well-being, and sustainability are complex, nuanced, and multi-faceted, and trying to reduce them to a single point of view is at odds with their nature. For example, not only can individuals be poor with different intensity, but also in alternative and different ways that cannot be compared and that require different actions to be contrasted. Any statistical representation of this kind of trait must preserve such nuances and irreducible facets, and posets that allow for both comparabilities and incomparabilities between objects/units are the proper data structure to do that. Moreover, in social sciences, data are often of an ordinal kind and cannot be treated through the usual metric tools employed in the statistical analysis of numerical variables. Order theory, a branch of discrete mathematics designed to deal with order relations and order structures, provides the concepts and the tools for dealing with this kind of input and is the natural setting for the multidimensional analysis of ordinal data.
Historically, posets emerged in pure mathematics in the XIX century and appear in many mathematical areas as a ubiquitous structure. In particular, lattices (a special kind of partially ordered sets, whose systematic and general study solidified around 1930) play a key role in abstract algebra and in logic. In the 1960s, posets also became relevant in theoretical computer science, where they provide the mathematical framework to formalize the semantics of computer programs. Progressively, they were recognized not only as pure mathematical objects but also as a tool to describe, model, and represent problems and data in different scientific domains. They made their appearance in applied data analysis and social sciences in the 1980s (although some traces of them can be found even before), becoming a relevant tool in socio-economic statistics at the beginning of this century. This occurred mainly in connection with the problem of building synthetic indicators and rankings out of multidimensional variable systems, avoiding both the aggregative/compensative procedures, typical of composite indicators, and the inconsistency of treating ordinal data as numerical ones (a quite usual practice in data analysis). The increasing awareness of the complexity of socio-economic phenomena and the necessity of capturing and representing it also contributed to raising interest in posets. Advances in the study of their mathematical properties and improvements in computational efficiency led poset theory to intertwine with multi-criteria decision-making and the development of evaluation tools for multi-faceted traits. At the same time, order theory began to be acknowledged as the proper mathematical foundation of multidimensional ordinal data analysis, in perspective making it an asset of methodological statistics.

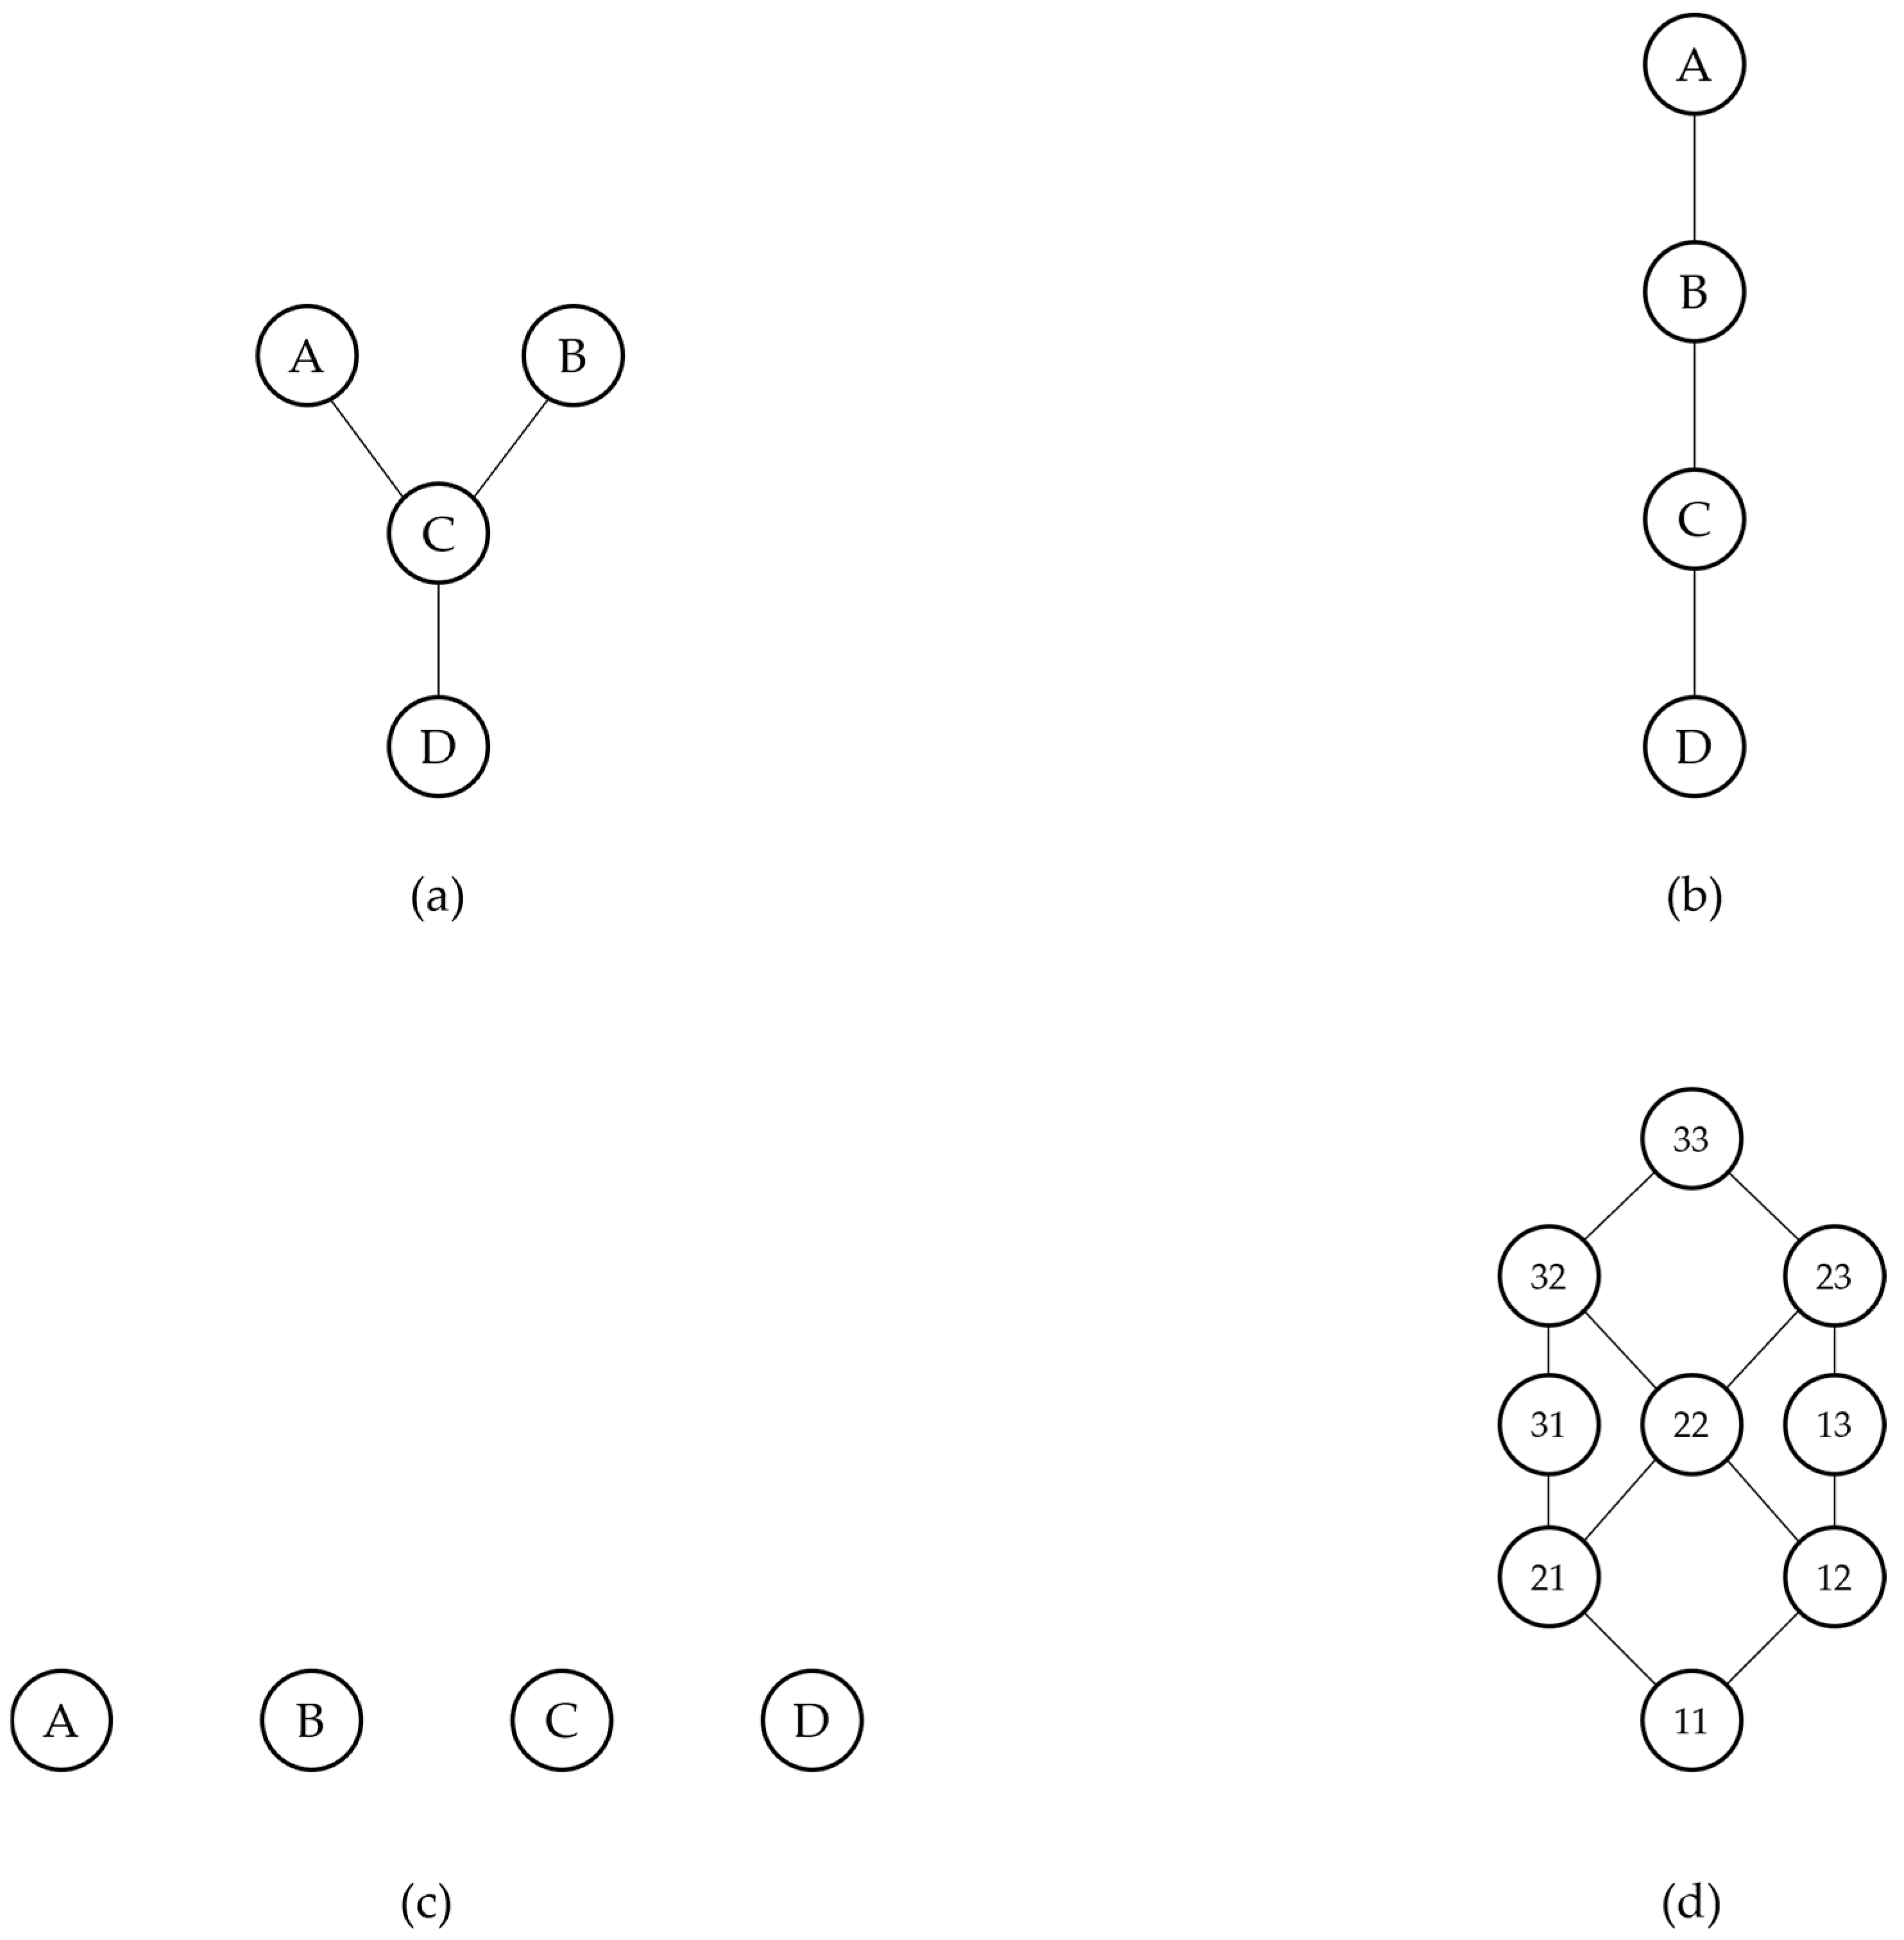
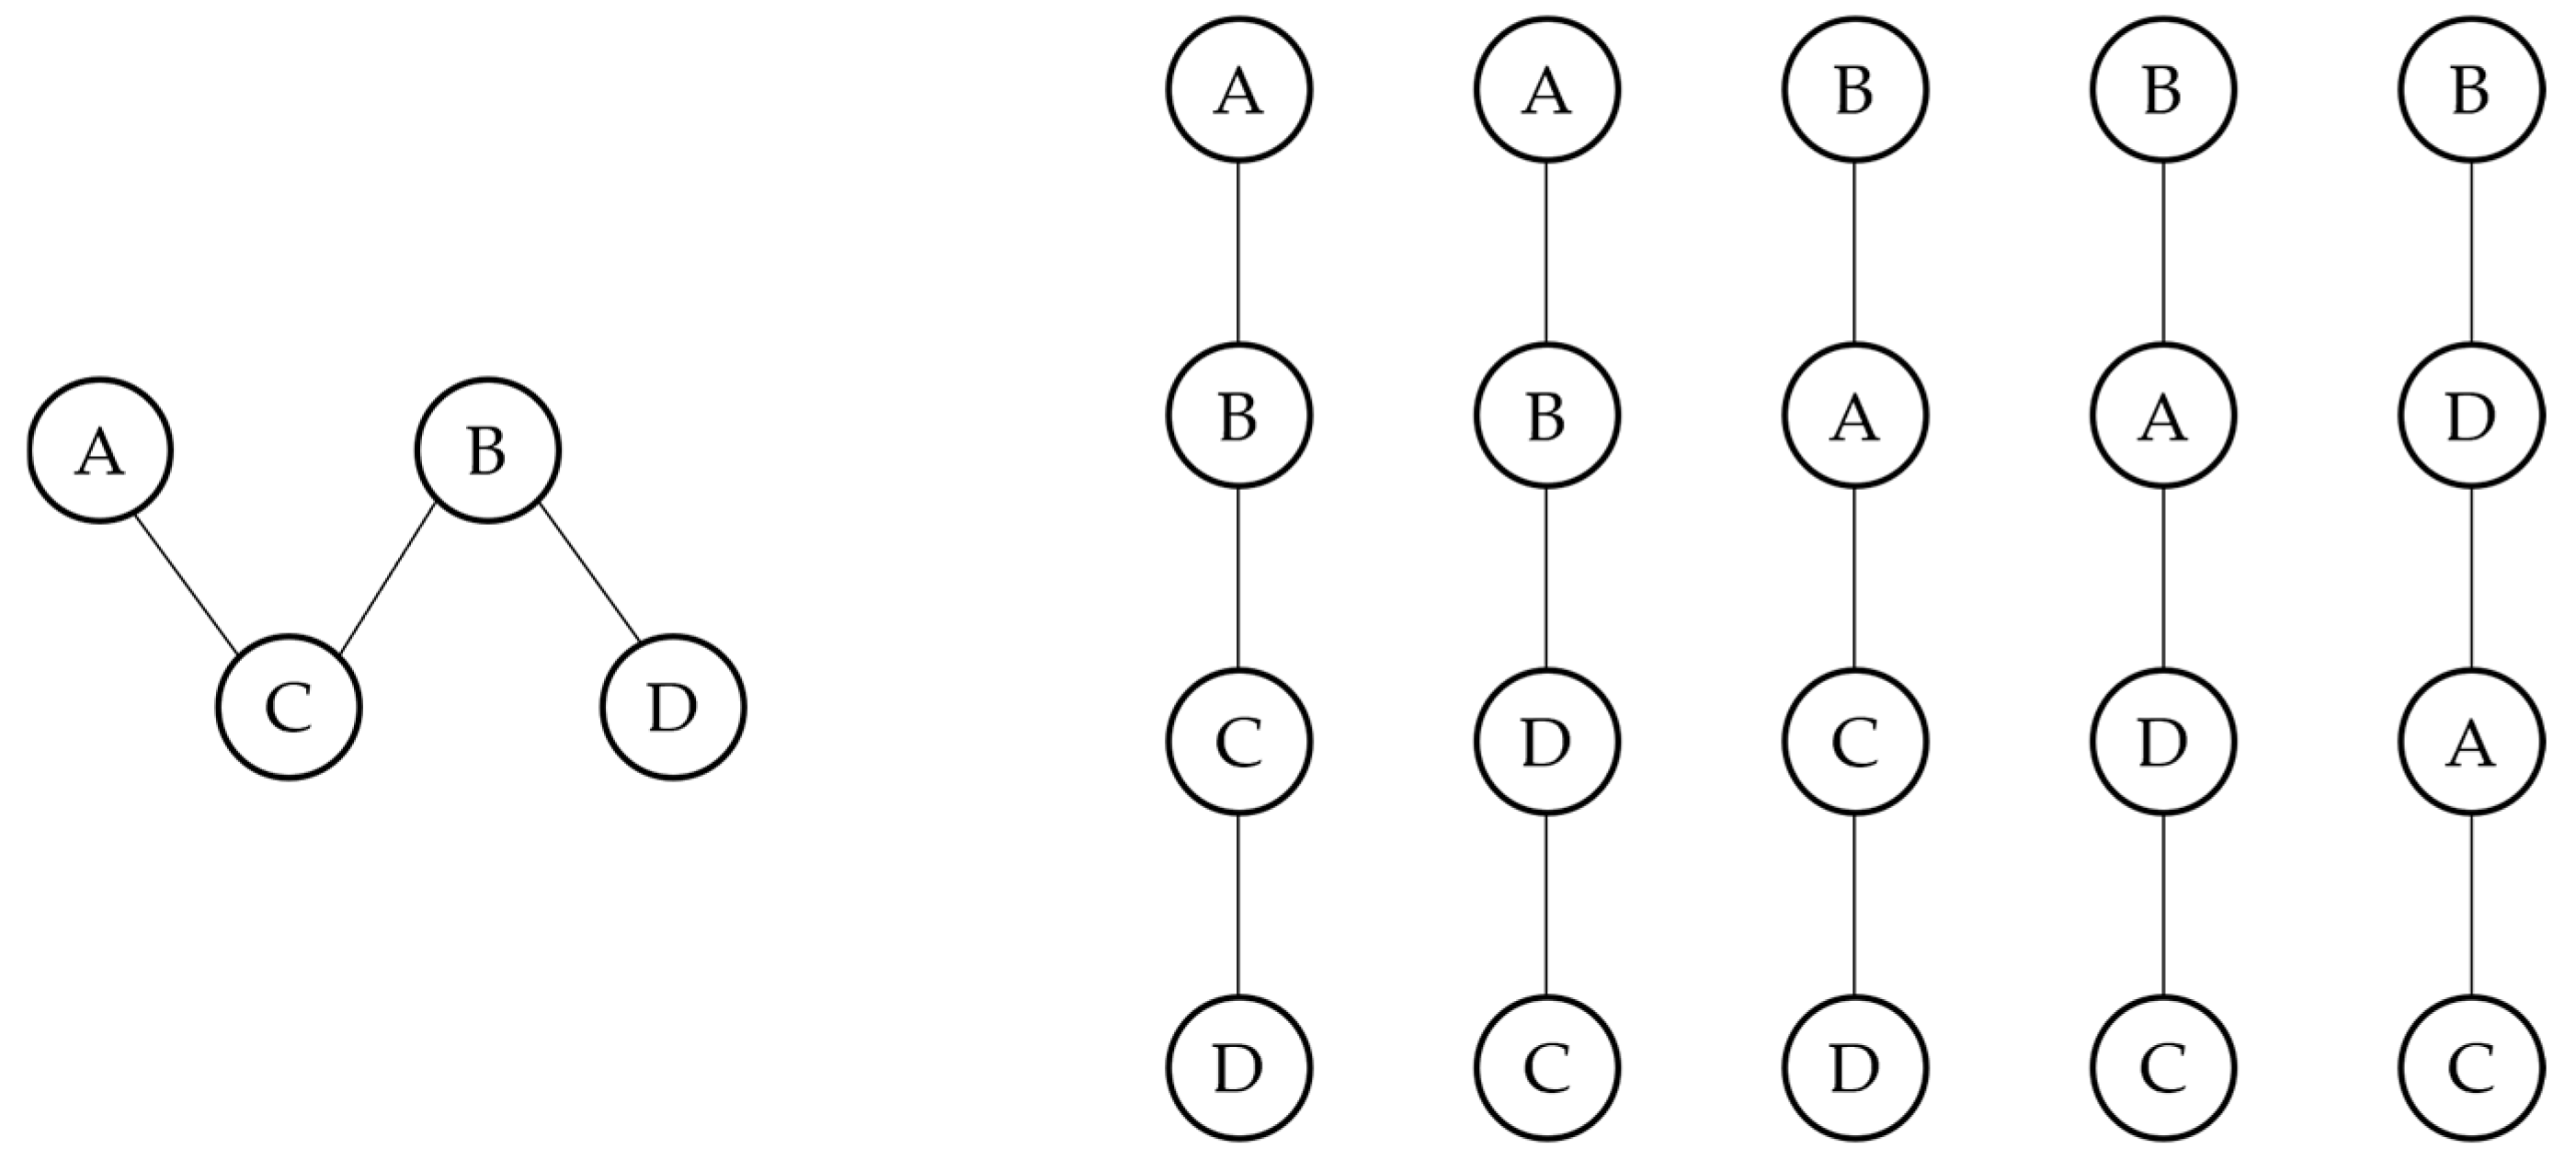
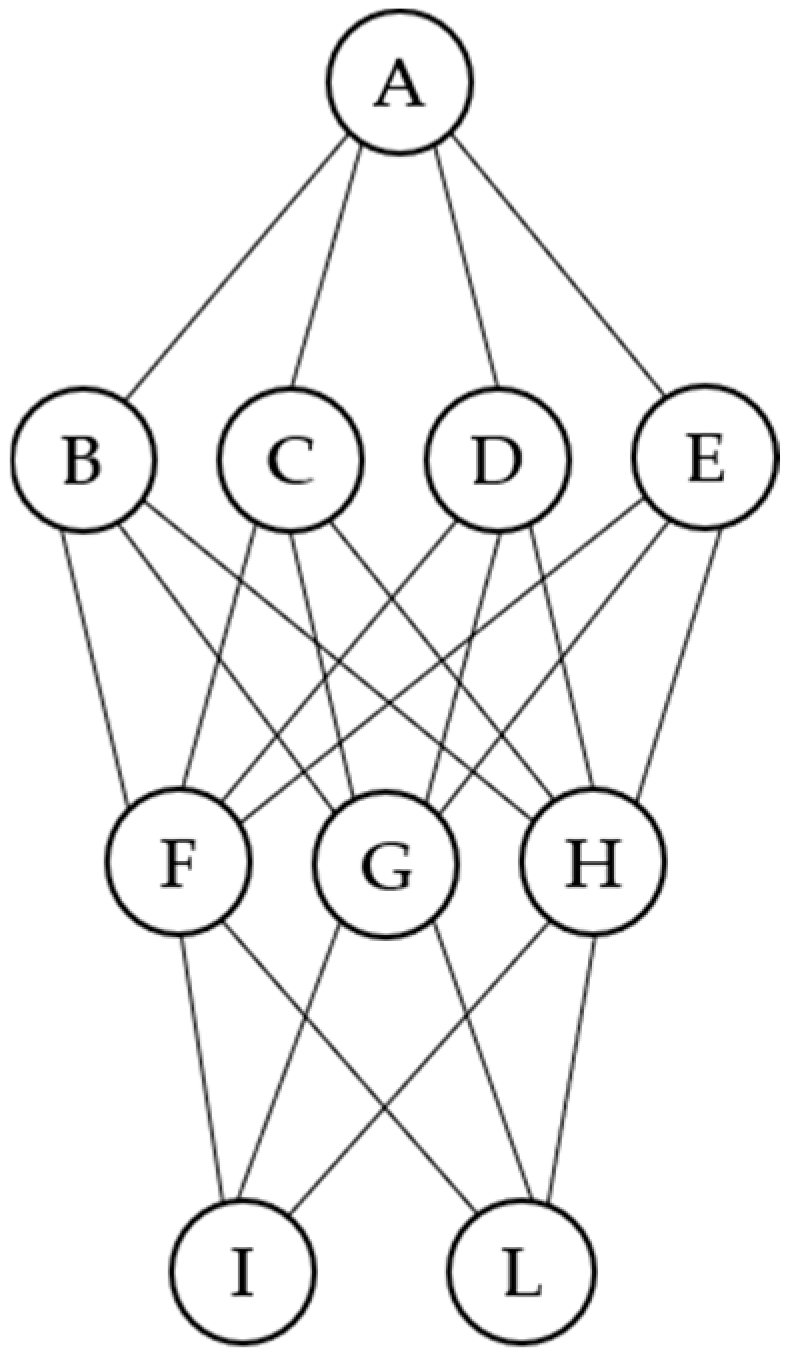
2. Some Essential Concepts on Posets and Order Relations

Let X be a set. A partial order relation ≤ on X is a binary relation satisfying the following properties:
  • x ≤ x, for all x ∈ X (reflexivity).
  • x ≤ y and y ≤ x ⇒ x = y (anti-symmetry).
  • x ≤ y and y ≤ z ⇒ x ≤ z (transitivity).
The pair P = (X, ≤) is called a partially ordered set (poset) [1]. When x ≤ y, y is said to dominate x. If x ≤ y or y ≤ x, the two elements are comparable; otherwise, they are incomparable. If y dominates x and there is no other element u such that x < u < y (where “x<y” means “x ≤ y and x ≠ y”), then y is said to cover x. A poset where any two elements are comparable is called a complete (or linear, or total) order, or also a chain. On the opposite, a poset where any two elements are incomparable is called an antichain. Finite posets can be represented as Hasse diagrams, a kind of acyclic directed graph built according to the following two simple rules: (i) if x < y, then node x is placed below node y, and (ii) if y covers x, then an edge is drawn joining the two nodes (see Figure 1 for some examples). An element of P dominating all the other elements is called the maximum (or top) of P, while an element non-dominated by any other element is called maximal. Dually, an element being dominated by all the others is called the minimum (or the bottom) of P, while an element not dominating any other element is called minimal. A downset D ⊆ P is a collection of poset elements “downward” closed, i.e., such that y ∈ D and x ≤ y ⇒ x ∈ D. Given a subset A = {x1,…,xn} of elements of P, the set {y ∈ P: y ≤ xi for some xi ∈ A} is a downset (called the downset generated by A and denoted ↓A). Analogously, an upset U ⊆ P is a subset of P “upward” closed, i.e., such that y ∈ U and y ≤ x ⇒ x ∈ U. The set {y ∈ P: xi ≤ y for some xi ∈ A} is an upset (called the upset generated by A and denoted ↑A).
Given two elements x and y in poset P, the minimum element (if existing) among the elements dominating both is called the join (or their least upper bound) of x and y, while the maximum (if existing) among the elements dominated by both is called their meet (or their greatest lower bound). A lattice is a poset such that any pair of elements x and y has both join and meet [2].
In social science applications, posets arise typically from ordinal multi-indicator systems. Let V1, …, Vk be a collection of k ordinal variables, measured on scales with m1, …, mk degrees, respectively. The set M of all m1 ×…× mk score configurations (called profiles) built on the variable scales (i.e., their Cartesian product) is naturally turned into a poset by endowing it with the component-wise order ≤cmp, defined as follows:
(p1, …, pk) ≤cmp (q1,…,qk) if and only if pii qi for all i = 1, …, k
where ≤i is the (complete) order of the i-th scale. The resulting poset Pcmp = (M, ≤cmp) is a lattice.
Let P1 = (X, ≤1) and P2 = (X, ≤2) be two posets on the same set X. P2 is said to be an extension of P1 if x ≤1 y ⇒ x ≤2 y, i.e., if P2 comprises the same dominances of P1 and (possibly) some more. An extension of poset P, which is also a linear order, is called a linear extension of P [3] (see Figure 2). It can be proved that any finite poset (i.e., a poset on a finite set) can be uniquely reconstructed by its set of linear extensions [4]. As illustrated below, linear extensions play a key role in posetic data analysis, particularly in the construction of synthetic indicators and rankings. Finally, an order-preserving map from poset P1 = (X1, ≤1) to poset P2 = (X2, ≤2) is a function f from X1 to X2 such that x ≤1 y ⇒ f(x) ≤2 f(y).
A binary relation satisfying the properties of reflexivity and transitivity, but not that of anti-symmetry, is called a quasi-order, or pre-order. Quasi-orders play a relevant role in mathematics, on a par with partial orders, but are also important in applications to data analysis. For example, in multi-indicator systems many different statistical units may share the same profile, so they inherit a quasi-order from the component-wise order put on the profile set. They also appear in applications of fuzzy relation theory to frequency distribution comparison (see Section 3.3).

3. Applications of Posets and Order Theory to Data Analysis and Social Sciences

The use of posets in data analysis and social sciences covers a wide range of domains and problems. Hereafter, a synthetic description of both consolidated and more recent applications is provided, with a final focus on current research.

3.1. Scoring and Ranking on Multi-Indicator Systems

A typical problem in multidimensional data analysis is to condense multi-indicator systems into a single variable, scoring and ranking statistical units. In the social sciences, this is usually carried out by means of so-called composite indicators, which are weighted aggregations of the scores of the input profiles (i.e., of the variable scores configurations attached to the statistical units). The composite approach, however, suffers from compensation effects, often produces indicators that are not easy to interpret, and cannot be applied when the input variables are of an ordinal type. Posets provide an alternative way of addressing the construction of non-aggregative synthetic indicators, particularly in the ordinal case. In general terms, the posetic approach goes through the following steps:
  • The set of all possible profiles, over the input variables, is structured as a component-wise lattice, and to each profile its observed frequency in the input dataset is attached.
  • A scoring function over the lattice is built, exploiting only its order structure. The scoring function can be seen as a way to quantify the degree of dominance between profiles, even when they are incomparable.
  • Each statistical unit is assigned a synthetic score by summing up its degree of dominance over the other units, based on their respective profiles.
  • Synthetic scores can then be used to compare and rank statistical units (possibly with ties).
The above general scheme, particularly the construction of the scoring function, can be implemented in alternative ways, most of which rely on the use of linear extensions. Usually, the dominance degree dom(x,y) of y over x is measured as the fraction of linear extensions where y dominates x (being complete orders, in a linear extension either x ≤ y or vice versa). In the posetic literature, such a fraction is referred to as the mutual ranking probability (mrp) of y over x [3]. Interestingly, the sum of the mutual ranking probabilities of element y over the others is essentially equivalent to computing its so-called average rank [3], which is the average, over the set of linear extensions, of the quantity “1 + the number of elements dominated by y” in each single linear extension. The average rank, which should be better called average height, is one of the first scoring functions to appear in the posetic literature.
The mrp-based dominance degree dom(x,y), or its strict version sdom(x,y), which obeys sdom(x,x) = 0, reflects the “tendency” of y to dominate x but does not convey any direct information on the separation between them, i.e., on the number of elements between x and y. As a result, the final scores are less informative than they could be. Combining fuzzy logic and mutual ranking probabilities, it is, however, possible to overcome this limitation by computing so-called separation scores [5] between pairs of poset elements. From pairwise separations, synthetic indicators and rankings are then derived, as in the dominance degree case. Interpreting strict dominance degrees sdom(x,z) and sdom(z,y) as the fuzzy truth values of the statements “z dominates x” and “y dominates z”, the truth value of “z is between x and y” can be obtained by employing the fuzzy counterparts of the “and” and “or” logical connectives (see [5]). Summing over all of the poset elements, a measure of the effective number of elements z such that x < z < y can be computed, as well as that of the elements u such that y < u < x. From these quantities, one can measure the overall separation between x and y, together with its decomposition into “vertical” and “horizontal” components, which, respectively, capture differences in the “intensity” or in the “structure” of the units’ profiles. Finally, from separations, scoring functions are computed and more informative rankings obtained [5].
The number of linear extensions of the posets typically encountered in real applications is astonishingly high, making it impossible to generate all of them and to compute mutual ranking probabilities or separations exactly. Various alternatives have been proposed in the literature, based on sampling algorithms or, in the case of component-wise lattices derived from multi-indicator systems, by restricting the class of linear extensions to so-called lexicographic linear extensions [6]. In this latter case, some closed formulas and effective algorithms allow us to compute mutual ranking probabilities and separations in very efficient ways. Finally, pairwise dominance measures not based on linear extensions have also been proposed (see [5] and references therein). These can be used to compute scoring functions and separations in the same way as using mutual ranking probabilities, with a lower computational effort.
The construction of rankings from multi-indicator systems (or from any kind of finite poset) can also be addressed without going through the construction of scoring functions [7], e.g., by considering ranking extraction as a dimensionality reduction problem, where the input poset is reduced to unidimensionality. The reduction problem can be solved by searching for the linear order (with elements weighted by observed frequencies) optimally approximating the input poset. This is the approach followed in [8], where the approximation between posets is measured as a point-wise distance between the respective dominance functions.
Scoring poset elements and ranking them is unavoidably forced, since incomparabilities are necessarily turned into comparabilities. In order to give an account of the representativeness of the final ranking, dominance/separation scores can be complemented by incomparability scores [9] that provide a quantification of the tendency of the poset elements to be not comparable with the others.
An interesting extension of poset ranking algorithms involves the concept of bucket order [8], which can be described as a “linear order of antichains” (see Figure 3). Bucket orders are the simplest type of posets that comprise both comparabilities and incomparabilities and are useful when the aim is to obtain a “ranking” without forcing all the input objects to be made comparable. The construction of the bucket order optimally approximating the input poset is not an easy task and requires specialized numerical algorithms.

3.2. Multi-Criteria Decision-Making and Evaluation Procedures

Posets provide a very natural setting for multi-criteria decision-making and the design of evaluation procedures [5]. To make a prototypical example in the social sciences, consider the problem of poverty assessment. In the unidimensional case, this is performed in monetary terms by comparing individual/household income or consumption to some benchmark, assumed as the poverty threshold, finally classifying units as poor or not in a binary way. In a multidimensional setting, as in the measurement of material deprivation, poverty becomes a nuanced and multi-faceted trait, and its assessment becomes much more complex, since individuals/households can be poor not only with different intensity but also in many “structurally” different ways. In addition, data on deprivation are often of an ordinal type. The measurement of multidimensional poverty may then be addressed by achieving the following: (i) building the component-wise lattice from the input ordinal variables; (ii) identifying a collection of incomparable profiles as poverty benchmarks; and (iii) assessing the position of each statistical unit with respect to the benchmarks [5]. Units whose profile belongs to the downset (or upset, based on the variables’ orientation) of the benchmarks are classified as poor, while all of the others are attached a fuzzy poverty “membership” score in [0, 1), based on their dominance degree over the benchmarks. This way, a nuanced classification of poor and non-poor is obtained. Poverty intensity can then be quantified and characterized usingvertical/horizontal separations: large vertical separations from non-poor profiles mean that the units are deeply poor and, for escaping poverty, should strongly improve their achievements; large horizontal separations mean that the units have profiles structurally different from those of the non-poor and should “restructure” them in order to achieve non-poverty. The posetic evaluation approach, sketched here with reference to poverty, is completely general and can be implemented in any multidimensional domain of interest.

3.3. Multidimensional Frequency Distribution Comparison

Posets offer an interesting solution to the problem of comparing frequency distributions, defined over ordinal multi-indicator systems, a relevant task in view of ranking populations. In the unidimensional case, frequency distributions are usually compared and ordered in terms of different types of stochastic dominance. The direct extension of this approach to the ordinal multidimensional case is, however, problematic and often leads to classifying distributions as non-comparable. Using posets, the comparison can be cast into fuzzy terms, attaching to each pair of distributions a degree of stochastic dominance, solving the incomparability problem. To this goal, the degrees of dominance between pairs of distributions defined over the input poset are first computed on each linear extension of it (using a fuzzy version of unidimensional stochastic dominances [10]) and are then averaged over the set of all linear extensions. When the number of linear extensions is too large, the comparison procedure can be performed either on a sample of them or, as in the case of component-wise lattices, on the lexicographic class [10]. The comparison between distribution pairs gives rise to a quasi-order, which is then converted to a partial order by clustering distributions that “co-dominate” each other.

3.4. Formal Concept Analysis

Formal Concept Analysis (FCA) is a mathematical technique to build taxonomies from data tables expressing the relation between a set of objects and a set of attributes [1]. It is one of the first systematic uses of posets and order (namely, lattice) theory in data analysis. Let G be a set of objects, M a set of attributes that the objects may or may not enjoy, and R a binary relation on them, so that (g, m) ∈ R if object g has attribute m. The triple (G, M, R) is called a context. Given a set U = {g1,…, gh} of objects, the set of attributes common to them is denoted U’; similarly, given a set V = {m1,…, mk} of attributes, the set of objects sharing them is denoted V’. A formal concept of the context (G, M, R) is a pair (U, V), where U is a set of objects and V a set of attributes, such that U’ = V and V’ = U. The sets U and V are called the extent and the intent of the concept, respectively. Hence, formal concepts are “closed” pairings of objects and attributes, such that no other object exists (in the context) sharing all the attributes in V and no other attribute exists (in the context) shared by all the objects in U. Formal concepts can be partially ordered by (U1, V1) ≤ (U2, V2) if and only if U1 ⊆ U2 if and only if V2 ⊆ V1. This partial ordering turns the set of concepts into a lattice B(G, M, R), called the concept lattice of the context (G, M, R). Moving upwards in B(G, M, R) corresponds to concept generalization, Moving downwards in B(G, M, R) corresponds to concept specification. FCA identifies and extracts formal concepts from a context and arranges them into a lattice, delivering the final taxonomy. The concept lattice can then be used to derive logic implications between subsets of attributes, holding in the context. FCA can be employed to explore the structure of binary datasets in virtually any application domain.

3.5. Examples of Applications to the Social Sciences

In recent decades, poset theory has been increasingly often employed to address socio-economic problems. Below a (necessarily partial) summary of some of the main topics and references is given to provide an idea of the several and diverse application areas:
  • Multidimensional poverty measurement and material deprivation assessment [6,11]. As already mentioned, the shift from a unidimensional (monetary) to a multidimensional perspective on poverty measurement leads to the need to describe the different facets of deprivation and its nuances, which are naturally represented using posets, as somehow suggested also by Amartya Sen in his book on inequality [12]. In this perspective, the posetic approach overcomes the limitations of so-called counting approaches, which in the end deliver a black-and-white picture of deprivation, providing instead a fuzzy view of it, which effectively fits its multi-faceted nature. Due to computational issues, the posetic approach was initially mainly of theoretical interest; recent advances in analytical results and algorithmic implementations are now making it an effective tool in concrete applications.
  • Life satisfaction and individual and societal well-being [13,14,15]. Along similar lines as in the case of poverty, posetic tools have been employed in studies on life satisfaction, subjective well-being, and quality of life to assess them and to build rankings at the individual and societal/territorial levels.
  • Sustainability and human development [16,17,18,19,20,21]. In more recent years, posets have attracted the attention of researchers in sustainability and, interestingly, in human development studies. In the perspective of Sen’s Capability Approach, posets can in fact accommodate different criteria, points of view, and references to diverse “informational spaces”, avoiding too restricted normative approaches to the evaluation of the flourishing of human beings and societies.
  • Other applications. The use of posets is progressively spreading across the diverse domains of social sciences. For example, they have been employed in studies on gender inequality [22,23], in crime analysis [24,25,26], and in fiscal systems comparisons [27,28].
Although not directly related to social sciences, it is worth mentioning that poset theory has been widely applied to environmental chemistry, toxicology, and pollution analysis [29,30,31,32,33]. Historically, it is in these domains that posetic data analysis was first developed in a systematic way, somehow pushing its use in other research areas.

3.6. Open Problems in Posetic Data Analysis

Many research avenues are currently open, both in the development of new posetic tools and in their application to data analysis. The following list provides a synthetic overview of some of the main active research areas:
  • Cluster analysis on multidimensional ordinal indicator systems and component-wise lattices. The development of consistent and effective procedures for the hierarchical clustering of ordinal data is still an open issue in the statistical literature. Available algorithms follow a similarity-based approach, involving some metrics defined on the ordinal score configurations (profiles) of the statistical units, analogously to what is performed with numerical data. This way, however, the component-wise order of the input data is by no means taken into account. As the input units’ profiles are partially ordered, so the final clusters (that can be considered as “macro” units) should be partially ordered as well. Therefore, the clustering algorithm should produce clusters, together with an order relation defined on them, somehow inherited from the input component-wise order. Lattice theory provides the proper way to pursue this goal, through the concept of lattice congruences [34], i.e., of equivalence relations compatible with the input component-wise order. Usual hierarchical clustering can be seen as a process producing a chain of equivalence relations on the set of inputs. In the component-wise case, the chain must be instead restricted to the set of lattice congruences, so assuring the final clusters to constitute a lattice as well. However, this poses some relevant computational issues, since building congruences is not a trivial task. Current research is exploring ways to search the space of congruences in a computationally efficient manner.
  • Measuring multidimensional ordinal inequality/polarization. While the theory of inequality/polarization measurement on cardinal variables is well-established, the multidimensional ordinal case is still open, and just a few attempts to address it can be found in the literature [35]. Interestingly, in more or less explicit ways, these attempts rely on posets, which have so made their appearance in this research area. In this perspective, the use of order theory is promising. It allows us to abstract the structure of unidimensional inequality/polarization indexes away from their unidimensional context, reformulating them in posetic terms as functionals over distributions on component-wise lattices, and naturally leading to their multidimensional generalization.
  • Visualization of multidimensional ordinal data systems. Many dimensionality reduction algorithms exist in statistical literature to optimally approximate multidimensional numerical data systems in spaces of lower dimension. In the multidimensional ordinal case, just one tool (called POSAC [36]) is currently available. The POSAC has been developed in the context of facet theory and is a numerical algorithm designed to optimally map and approximate generic posets in the Euclidean plane, ordered component-wise. More specific partially ordered structures should, however, deserve better-tuned algorithms, capable of exploiting their properties and easing the interpretation of the final results. Currently, research is focusing on the bidimensional visualization of component-wise lattices built from systems of binary ordinal variables (called Boolean lattices). The mathematical properties of this class of lattices, in fact, make the bidimensional embedding computationally feasible for a number of variables up to 10, or even more. The resulting visualization not only approximates in an optimal way the input lattice but also unveils the dependence structure of the input variables, providing richer information than the generic POSAC embedding.

4. Conclusions

Although the use of posets and lattices in data analysis dates to the eighties of the last century, their systematic use in socio-economic studies is still at an early stage, although it is raising increasing interest in scholars. Posets and order theory are the natural conceptual and formal settings for representing multi-faceted phenomena and addressing scoring, ranking, and multi-criteria decision/evaluation problems. They provide the proper mathematical language to treat multidimensional systems of ordinal data in a consistent and effective way, filling a gap in the statistical literature that is still largely devoid of a comprehensive toolbox for this type of data. In this respect, order theory is shifting from being used as an ad hoc tool to solve specific data analysis problems to an asset of methodological statistics. This is definitely relevant, as the multi-faceted and nuanced nature of socio-economic phenomena is increasingly acknowledged, calling for new ways of representing and inspecting their complexity. Historically, the computational burden of posetic procedures, often of a combinatoric kind, prevented them from being applied to too large datasets and limited their adoption. Currently, new software resources are being made available, widening the range of applicability of posetic tools and easing their practical use.

Author Contributions

Both authors contributed equally to the manuscript. All authors have read and agreed to the published version of the manuscript.

Funding

This research received no external funding.

Conflicts of Interest

The authors declare no conflicts of interest.

Abbreviations

The following abbreviations are used in this manuscript:
FCAFormal Concept Analysis
mrpmutual ranking probability
POSACPartial Order Scalogram Analysis with Base Coordinates
Posetpartially ordered set

References

  1. Davey, B.A.; Priestley, A. Introduction to Lattices and Order, 2nd ed.; Cambridge University Press: Cambridge, UK, 2002. [Google Scholar]
  2. Gratzer, G. General Lattice Theory; Academic Press, Inc.: New York, NY, USA, 1978. [Google Scholar]
  3. De Loof, K. Efficient Computation of Rank Probabilities in Posets. Ph.D. Thesis, University of Ghent, Ghent, Belgium, 2010. [Google Scholar]
  4. Schroeder, B.S.W. Ordered Stes: An Introduction; Birkhaser: Boston, MA, USA, 2002. [Google Scholar]
  5. Fattore, M.; De Capitani, L.; Avellone, A. A fuzzy posetic toolbox for multi-criteria evaluation on ordinal data systems. Ann. Oper. Res. 2024. [Google Scholar] [CrossRef]
  6. Fattore, M.; Arcagni, A. A reduced posetic approach to the measurement of multidimensional ordinal deprivation. Soc. Indic. Res. 2018, 136, 1053–1070. [Google Scholar] [CrossRef]
  7. Patil, G.P.; Taillie, C. Multiple indicators, partially ordered sets, and linear extensions: Multi-criterion ranking and prioritization. Environ. Ecol. Stat. 2004, 11, 199–228. [Google Scholar] [CrossRef]
  8. Arcagni, A.; Fattore, M.; Avellone, A. Complexity reduction and approximation of multidomain systems of partially ordered data. Comput. Stat. Data. An. 2022, 173, 107520. [Google Scholar] [CrossRef]
  9. Rimoldi, S.M.L.; Arcagni, A.; Fattore, M.; Barbiano di Belgiojoso, E. Targeting policies for multidimensional poverty and social fragility relief among migrants in Italy, using F-FOD analysis. Soc. Indic. Res. 2021, 157, 57–75. [Google Scholar] [CrossRef]
  10. Fattore, M.; Arcagni, A. F-FOD: Fuzzy first order dominance analysis and populations ranking over ordinal multi-indicators system. Soc. Indic. Res. 2019, 144, 1–29. [Google Scholar] [CrossRef]
  11. Ivaldi, E.; Ciacci, A.; Soliani, R. Urban deprivation in Argentina: A POSET analysis. Pap. Reg. Sci. 2020, 99, 1723–1747. [Google Scholar] [CrossRef]
  12. Sen, A. Inequality Reexamined; Clarendon Press: Oxford, UK, 1992. [Google Scholar]
  13. Caperna, G.; Boccuzzo, G. Use of poset theory with big datasets: A new proposal applied to the analysis of life satisfaction in Italy. Soc. Indic. Res. 2018, 136, 1071–1088. [Google Scholar] [CrossRef]
  14. Cavalletti, B.; Corsi, M. Beyond GDP Effects on National Subjective Well-Being of OECD Countries. Soc. Indic. Res. 2018, 136, 931–966. [Google Scholar] [CrossRef]
  15. della Queva, S. Analysis of Social Participation: A Multidimensional Approach Based on the Theory of Partial Ordering. In Partial Order Concepts in Applied Sciences; Fattore, M., Bruggemann, R., Eds.; Springer: Cham, Switzerland, 2017; pp. 151–160. [Google Scholar]
  16. Alaimo, L.S.; Ciacci, A.; Ivaldi, E. Measuring Sustainable Development by Non-aggregative Approach. Soc. Indic. Res. 2021, 157, 101–122. [Google Scholar] [CrossRef]
  17. Alaimo, L.S.; Maggino, F. Sustainable Development Goals Indicators at Territorial Level: Conceptual and Methodological Issues–The Italian Perspective. Soc. Indic. Res. 2020, 147, 383–419. [Google Scholar] [CrossRef]
  18. Comim, F. A Poset-Generalizability Method for Human Development Indicators. Soc. Indic. Res. 2021, 158, 1179–1198. [Google Scholar] [CrossRef]
  19. Comin, F.; Abreu, M.; Guinesi Mattos Borges, C. Defining left behind places: An international comparative poset analysis. Camb. J. Reg. Econ. Soc. 2024, 17, 163–180. [Google Scholar] [CrossRef]
  20. Hilckmann, A.; Bach, V.; Bruggemann, R.; Ackermann, R.; Finkbeiner, M. Partial order analysis of the government dependence of the sustainable development performance in Germany’s federal states. In Partial Order Concepts in Applied Sciences; Fattore, M., Bruggemann, R., Eds.; Springer: Cham, Switzerland, 2017; pp. 219–228. [Google Scholar]
  21. Hirai, T.; Comim, F. Measuring the sustainable development goals: A poset analysis. Ecol. Indic. 2022, 145, 109605. [Google Scholar] [CrossRef]
  22. Di Brisco, A.; Farina, P. Measuring gender gap from a poset perspective. Soc Indic. Res. 2018, 136, 1109–1124. [Google Scholar] [CrossRef]
  23. Carlsen, L.; Bruggemann, R. Gender equality in Europe: The development of the sustainable development goal No. 5 illustrated by exemplary cases. Soc. Indic. Res. 2021, 158, 1127–1151. [Google Scholar] [CrossRef]
  24. Levy, S. Partial order analysis of crime indicators. Soc. Indic. Res. 1985, 16, 195–199. [Google Scholar] [CrossRef]
  25. Raveh, A.; Landau, S.F. Partial Order Scalogram Analysis with Base Coordinates (POSAC): Its Application to Crime Patterns in all the states in the United States. J. Quant. Criminol. 1993, 9, 83–99. [Google Scholar] [CrossRef]
  26. Canter, D. A Partial Order Scalogram Analysis of Criminal Network Structures. Behaviormetrika 2004, 31, 131–152. [Google Scholar] [CrossRef]
  27. Bachtrogler, J.; Badinger, H.; de Clairfontaine, A.F.; Reuter, W.H. Summarizing data using partially ordered set theory: An application to fiscal frameworks in 97 countries. Stat. J. IAOS 2016, 32, 383–402. [Google Scholar] [CrossRef]
  28. Badinger, H.; Reuter, W.H. Measurement of Fiscal Rules: Introducing the Application of Partially Ordered Set (POSET) Theory. J. Macroecon. 2015, 43, 108–123. [Google Scholar] [CrossRef]
  29. Sorensen, P.B.; Bruggemann, R.; Carlsen, L.; Mogensen, B.B.; Kreuger, J.; Pudenz, S. Analysis of monitoring data of pesticide residues in surface waters using partial order ranking theory. Environ. Tox. Chem. 2003, 22, 661–670. [Google Scholar] [CrossRef]
  30. Voigt, K.; Welzl, G.; Bruggemann, R. Data analysis of environmental air pollutant monitoring systems in Europe. Environmetrics 2004, 15, 577–596. [Google Scholar] [CrossRef]
  31. Voigt, K.; Bruggemann, R. Water contamination with pharmaceuticals: Data availability and evaluation approach with Hasse diagram technique and METEOR. MATCH Commun. Math. Comput. Chem. 2005, 54, 671–689. [Google Scholar]
  32. Bruggemann, R.; Carlsen, L. (Eds.) Partial Order in Environmental Sciences and Chemistry; Springer: Berlin/Heidelberg, Germany, 2006. [Google Scholar]
  33. Voigt, K. Bruggemann R, Ranking of pharmaceuticals detected in the environment: Aggregation and weighting procedures. Combin. Chem. High Through. Screen. 2008, 11, 770–782. [Google Scholar] [CrossRef]
  34. Gratzer, G. The Congruences of a Finite Lattices: A Proof-by-Picture Approach; Birkhauser: Cham, Switzerland, 2005. [Google Scholar]
  35. Kobus, M.; Kurek, R. Multidimensional polarization for ordinal data. J. Econ. Inequal. 2019, 17, 301–317. [Google Scholar] [CrossRef]
  36. Shye, S. Multiple Scaling: The Theory and Application of Partial Order Scalogram Analysis (POSAC); North Holland: Amsterdam, The Netherlands, 1985. [Google Scholar]
Figure 1. Hasse diagrams of (a) a generic poset, (b) a linear order, (c) an antichain, and (d) a component-wise lattice built on two variables assessed on a 3-degree scale.
Encyclopedia 05 00100 g001
Figure 2. A poset on four elements (left) and its set of linear extensions (right).
Encyclopedia 05 00100 g002
Figure 3. Hasse diagram of a bucket order on ten elements.
Encyclopedia 05 00100 g003
Disclaimer/Publisher’s Note: The statements, opinions and data contained in all publications are solely those of the individual author(s) and contributor(s) and not of MDPI and/or the editor(s). MDPI and/or the editor(s) disclaim responsibility for any injury to people or property resulting from any ideas, methods, instructions or products referred to in the content.

