Article

Transit Time Determination Based on Similarity-Symmetry Method in Multipath Ultrasonic Gas Flowmeter

State Key Laboratory of Industrial Control Technology, College of Control Science and Engineering, Zhejiang University, Hangzhou 310027, China
*
Author to whom correspondence should be addressed.
Metrology 2025, 5(4), 71; https://doi.org/10.3390/metrology5040071
Submission received: 18 August 2025 / Revised: 2 November 2025 / Accepted: 11 November 2025 / Published: 18 November 2025

Abstract

The cross-correlation algorithm, widely used for transit-time determination in ultrasonic gas flowmeters, becomes susceptible to significant errors under high flow rates. Fluid disturbances and noise distort ultrasonic waveforms, causing cycle-skipping errors that result in large, integer-period miscalculations of time-of-flight. To overcome these limitations, this study introduces a novel similarity-symmetry method. First, a similarity-based technique is proposed that exploits the stable rising-edge profile of the signal envelope, which remains consistent across flow rates, to accurately pinpoint the arrival time and mitigate cycle-skipping. Second, for multi-path flowmeters, the inherent physical symmetry between upstream and downstream transit times in each channel provides a basis for cross-validation. Any significant asymmetry flags potential cycle-skip events for correction. By integrating these two principles, our hybrid method enhances robustness. Experimental results on a six-path gas flowmeter rig demonstrate that the proposed approach reduces average flow rate errors by 75% compared to the standard cross-correlation method and maintains the maximum relative error below 1% when the flow rate is above 71.78 m3/h. This work provides a reliable solution for high-precision gas flow measurement in demanding conditions, with direct relevance to applications such as natural gas custody transfer and industrial process control where measurement accuracy is critical.

1. Introduction

Ultrasonic gas flowmeters (UGFMs) offer significant advantages, including no moving or throttling components, no pressure loss, and a wide measurement range [1,2]. These features make them particularly suitable for high-accuracy natural gas custody transfer in large-diameter pipelines. There are two main types of ultrasonic flowmeters: Doppler effect [3,4] and transit time [5,6]. Doppler ultrasonic flowmeters require reflecting solid particles or bubbles in the fluid, and are not suitable for clear fluids. The transit time method has emerged as the dominant paradigm for ultrasonic gas flowmeters (UGFMs), owing to its superior balance between accuracy and implementation feasibility. This technique derives flow velocity from the differential transit time or time-of-flight (TOF) of ultrasonic pulses propagating with and against the flow direction. Therefore, the accurate measurement of transit time is the key to improving the accuracy of flow measurement [7,8].
To improve the measurement accuracy of transit time, many methods were proposed, including threshold detection, cross-correlation, and model fitting methods. The threshold method measures the transit time of the ultrasound by setting the threshold voltage and detecting the zero crossing of the received signal [9,10]. Although computationally efficient, this method exhibits significant amplitude dependence. Variable threshold method [11], or variable-ratio threshold modification [12] partially mitigates this issue through adaptive thresholding, yet remains fundamentally limited by its single-point detection paradigm. The model fitting method is based on the echo signal model, such as Gaussian model and the exponential model [13,14,15]. This method is computationally intensive, rendering real-time implementation challenging. The cross-correlation method [16,17,18,19] is widely applied in the determination of transit time due to its exceptional noise rejection capabilities. By maximizing the correlation between received and reference waveforms, this approach can maintain high accuracy under low SNR conditions. By using an averaging reference wave, the flow rate accuracy was improved from ±3% to ±1.5% [16]. The mean flow rate error was improved from ±5% to ±1% by using variational mode decomposition (VMD)–Hilbert spectrum and cross-correlation [18]. Nevertheless, the method suffers from inherent cycle-skipping vulnerabilities at elevated flow velocities, where waveform distortion causes correlation peak misidentification. Cycle-skipping exists both in threshold detection and cross correlation. Most research focuses on threshold detection methods, such as automatic gain control [20], and onset-point detection [21]. Dual-frequency excitation was used to mitigate the cycle-skipping in cross correlation [22]. The existing measures can reduce cycle-skipping frequency, but fail to provide complete immunity. Compared to single-path configurations, multi-path ultrasonic flowmeters achieve superior measurement accuracy by integrating velocity profiles from multiple acoustic paths [23,24,25,26].
The literature revealed two persistent gaps in transit-time (TOF) measurement for ultrasonic gas flowmeters: the lack of amplitude-invariant timing detection, and the difficulty in reliably identifying cycle-skipping errors. To address these issues, this paper introduces a novel two-stage similarity-symmetry framework. The proposed method first leverages the stability of the rising-edge envelope similarity across flow regimes to achieve robust TOF estimation, and subsequently exploits the inherent path-to-path transit-time symmetry for cycle-skip detection. By integrating signal shape characteristics with system-level physical redundancy, this dual-mechanism approach offers fundamental improvements over single-criterion methods. Experimental validation on a six-path ultrasonic gas flowmeter demonstrates the effectiveness of the method under real-world conditions. This work not only provides a reliable solution for high-accuracy TOF measurement but also contributes to the development of more robust ultrasonic flow metering technology.

2. Materials and Methods

2.1. Experimental System Configuration

The experimental setup comprises four primary components (Figure 1a): a pipeline system with an inner diameter (ID) of 100.0 mm, a custom six-path ultrasonic gas flowmeter (UGFM) prototype, an IMETER gas meter calibration system serving as reference standard (accuracy: ±1%), and a data acquisition and processing PC with RS232 interface.
The airflow through the system is precisely controlled by the IMETER calibrator, which simultaneously provides traceable flow rate measurements. The experimental gas used throughout this study was dry air. The physical implementation of the experimental platform is shown in Figure 1b, demonstrating the industrial-relevant configuration of the test setup.
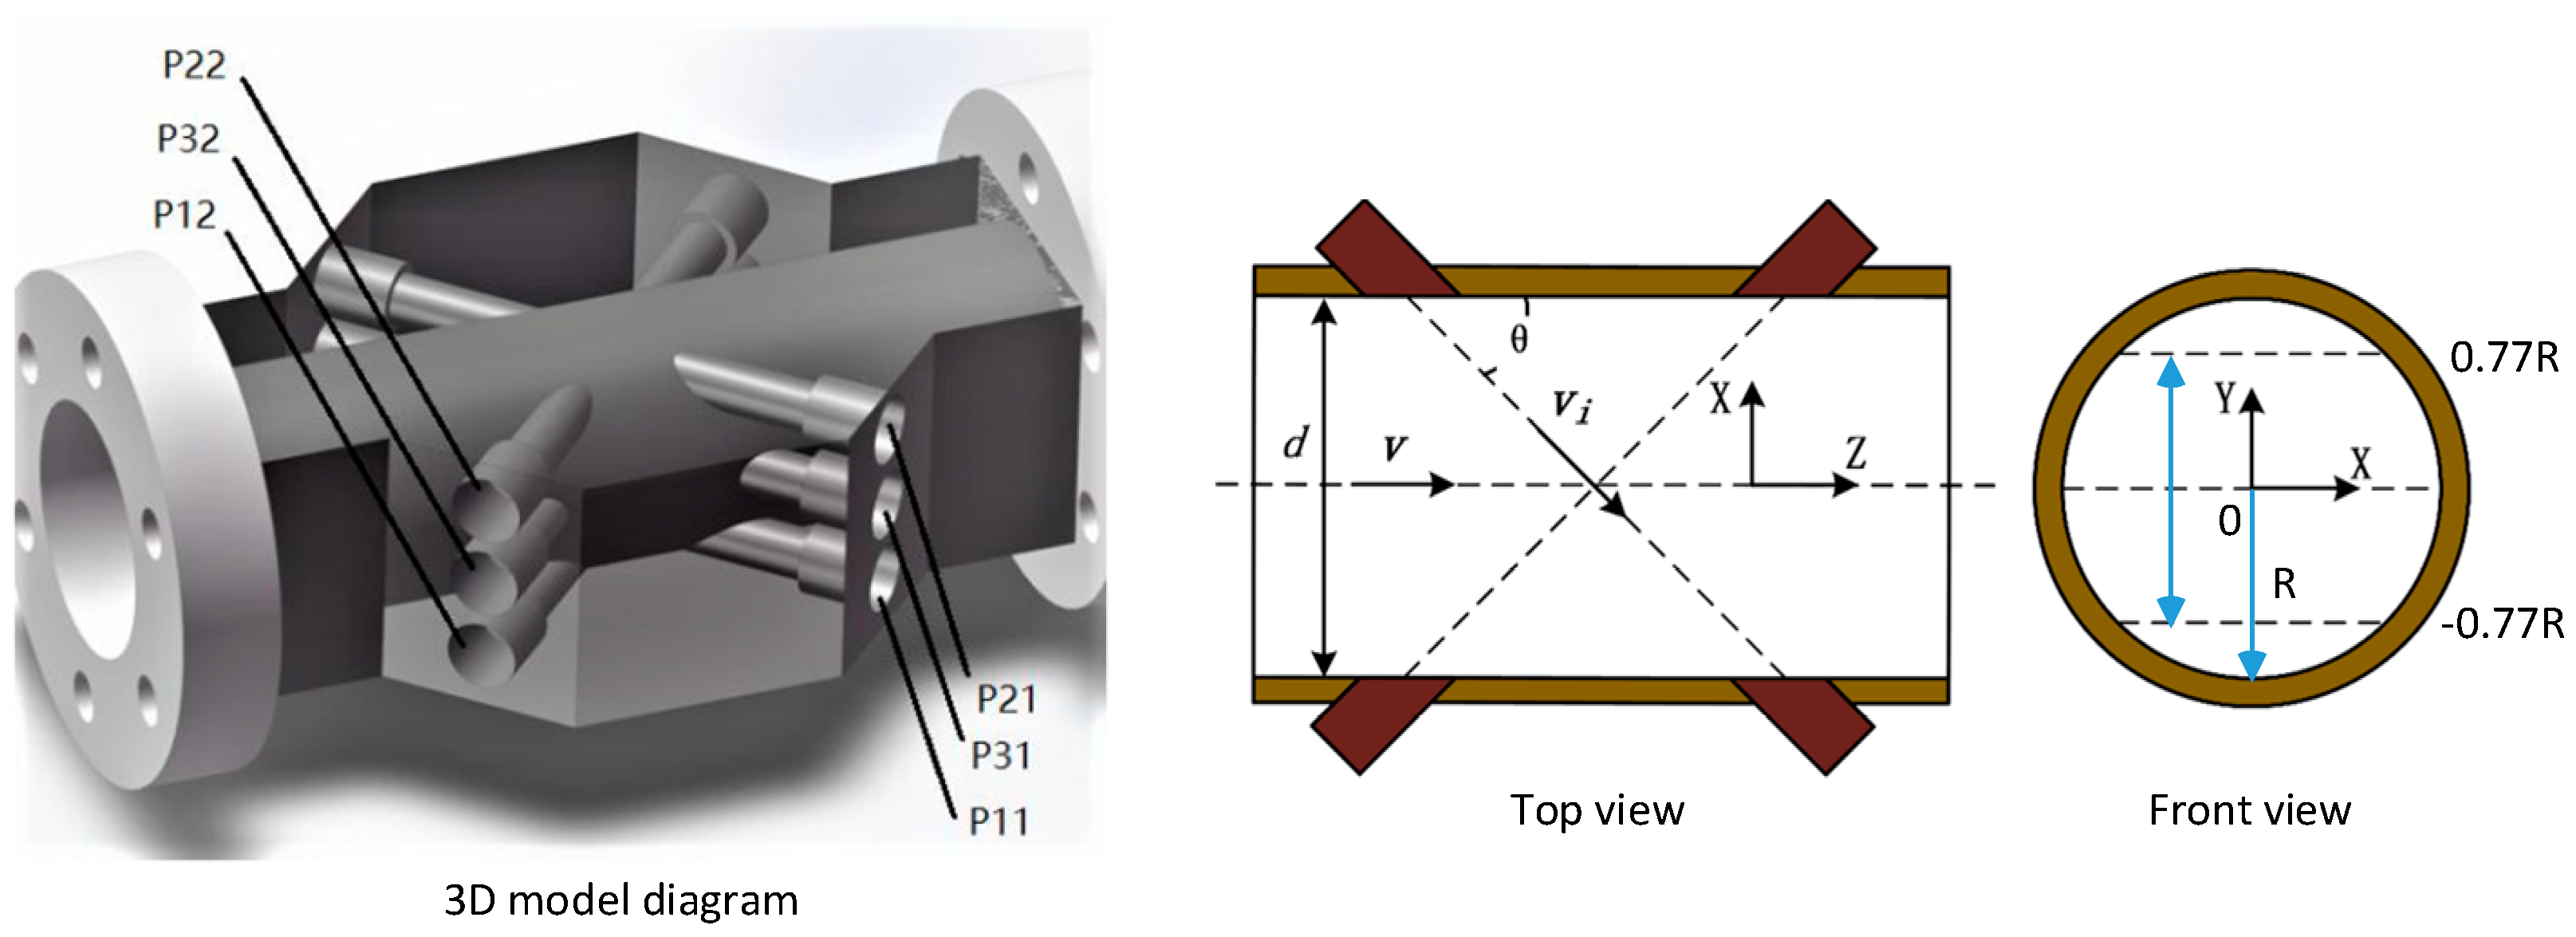
The UGFM prototype’s six acoustic paths are arranged according to Gauss-Legendre quadrature principles [16] to optimally sample the velocity profile. This approach is widely adopted in industry standards (e.g., ASME PTC 18-2002) and by major manufacturers due to its theoretical optimality for numerical integration on a circular cross-section. Unlike equally spaced methods, Gaussian quadrature optimally selects both the location of the evaluation points (the acoustic paths) and their corresponding weights to achieve the highest possible algebraic degree of precision. For a given number of paths N, it can exactly integrate polynomials of degree up to (2N-1). In the context of flow measurement, where the goal is to numerically integrate the velocity profile v (r) across the pipe area, this method provides the most accurate approximation with a minimal number of measurement points. While other integration schemes (e.g., Tchebychev, Tailored, OWICS) exist, the Gauss-Legendre method remains the predominant and most referenced baseline due to its well-established mathematical rigor and efficiency. Six-path UGFM prototype includes two diametral paths (designated Path 31 and Path 32) and four chordal paths (Path 11, Path 12, Path 21, and Path 22), as shown in Figure 2. The path numbering system is defined based on their arrangement in acoustic planes. Plane 3 (Paths 31 & 32) is the horizontal diametrical plane. Paths 31 and 32 are two symmetrically crossed paths within this plane. Plane 2 (Paths 21 & 22) is the upper horizontal chordal plane at a radial position of +0.77R. Paths 21 and 22 are two symmetrically crossed chordal paths within this plane. Plane 1 (Paths 11 & 12) is the lower horizontal chordal plane at a radial position of −0.77R. Paths 11 and 12 are two symmetrically crossed chordal paths within this plane. The units digit (1 or 2) in the path number distinguishes between the two symmetrically crossed acoustic paths within the same plane. This crossed configuration helps to average out flow asymmetries and improve measurement robustness. The parameters for the six acoustic channels are presented in Table 1, The theoretical acoustic path angle Ө, based on optimal flow integration, is 45°. However, the practical mounting angle of the transducers was adjusted to 56.6°. This adjustment was necessary due to the relatively large physical diameter of the ultrasonic transducers (approximately 20 mm). A 45° mounting angle would have posed significant challenges for machining the threaded ports and ensuring robust mechanical sealing of the transducers. The operating frequency of the ultrasound probes is 200 kHz.
The experiments were conducted under ambient laboratory conditions. The gas was drawn through the pipeline by a suction fan, ensuring that the gas temperature remained equal to the ambient temperature and avoiding any heating effects associated with compression. While the absolute pressure was not actively controlled, it was continuously monitored. To ensure measurement accuracy, the system was equipped with integrated, high-accuracy temperature and pressure sensors. The raw transit time measurements were compensated in real-time based on the monitored gas temperature and pressure using the standard equation for the speed of sound in the test gas, and all resulting flow rates are reported under standard reference conditions. This compensation process effectively isolates the flow-induced changes in transit time from variations caused by environmental factors.

2.2. The Layer Feature of Transit Time by the Cross-Correlation Method

The cross-correlation method determines transit time by computing the cross-correlation function between the received waveform and a reference waveform (typically acquired under static conditions) [16]. However, this approach faces significant challenges in practical flow measurement due to three primary factors: flow-induced waveform distortion caused by gas turbulence, acoustic noise interference from pipeline vibrations and electronic systems, and multipath propagation effects in large-diameter pipes. These factors collectively contribute to correlation peak misalignment. Specifically, the identified maximum point of the cross-correlation function may shift by integer multiples of the signal period, a phenomenon known as cycle-skipping [19]. This error mechanism is particularly problematic as it introduces discrete, large-magnitude timing errors rather than continuous small deviations.
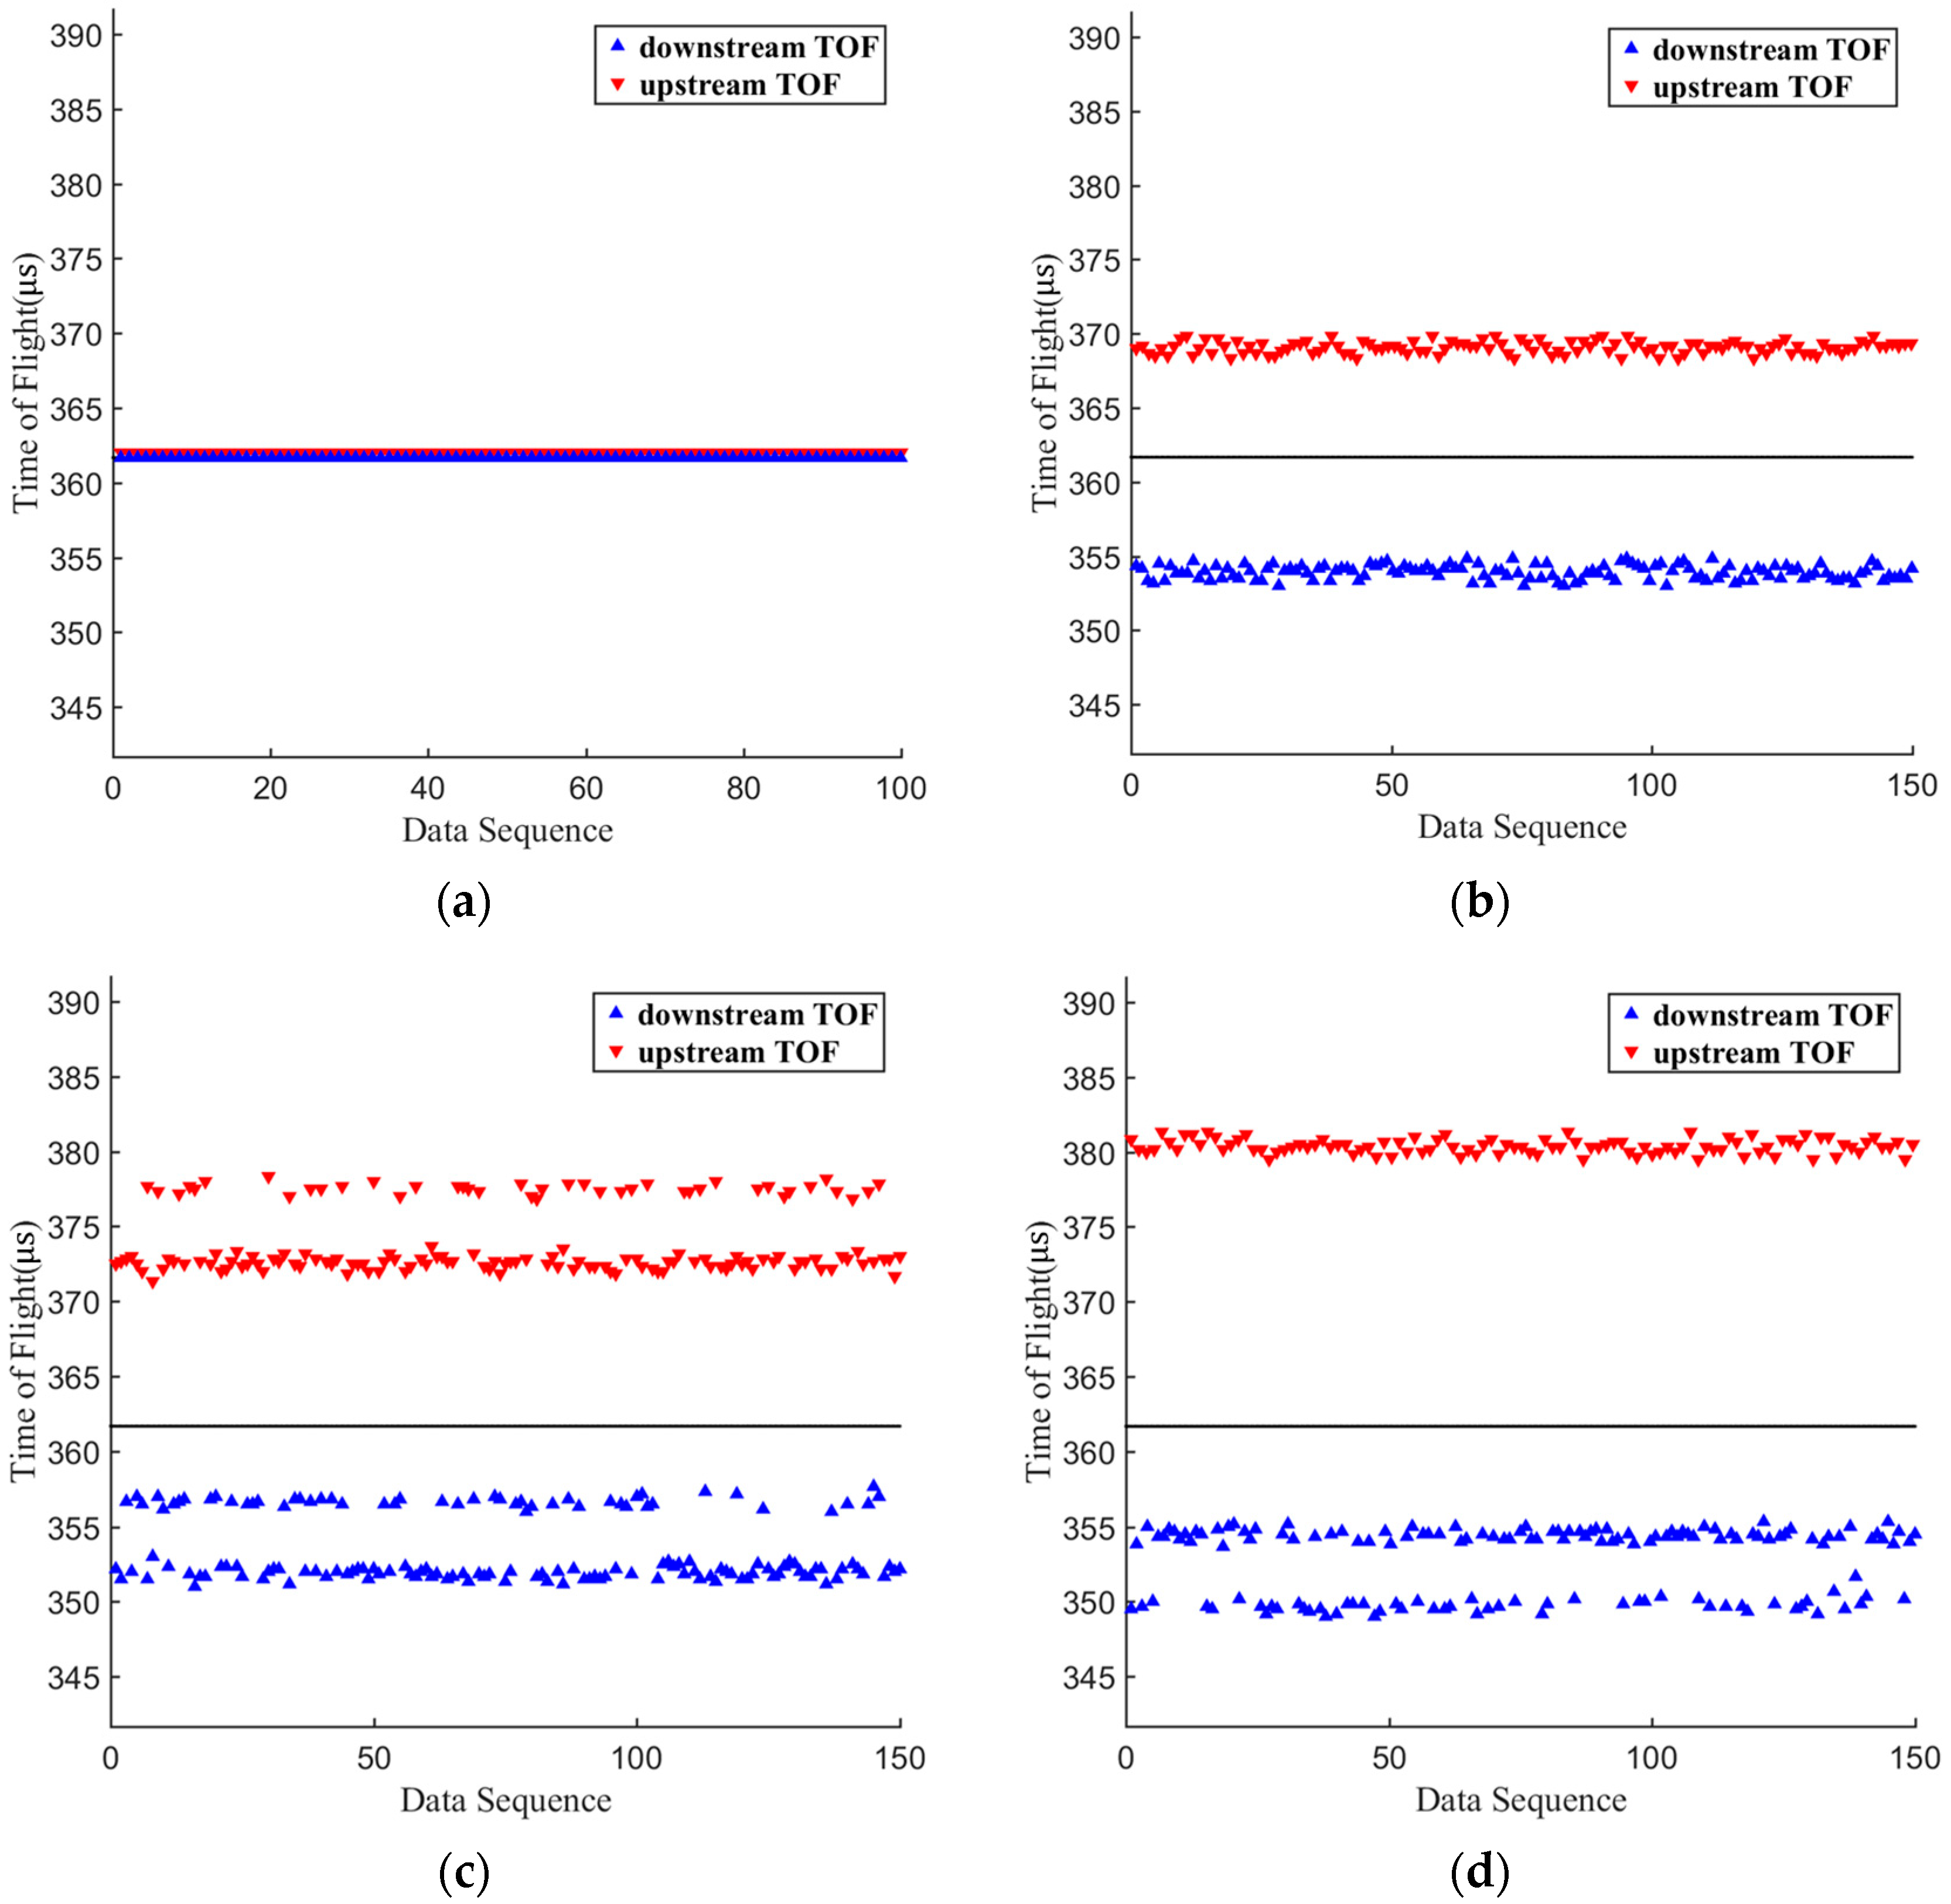
Figure 3 shows the distribution of consecutive transit time measurements for both upstream and downstream directions of Path 32 using cross-correlation analysis under different flow rates (after gross error elimination). The abscissa data sequence refers to the measurement period indices arranged in chronological order in continuous repeated experiments. The results reveal distinct flow-dependent characteristics. In the low-flow regime (<500 m3/h), the concentration of data points forms a primary cluster representing the correct transit time, as evidenced by the 6.63 m3/h and 425.6 m3/h cases. In the transition regime (500–600 m3/h), at 563 m3/h, a distinct secondary cluster appears, manifesting as a “second line” in the distribution. This phenomenon is the visual evidence of the cycle-skipping error that this paper aims to solve. The discrete jumps in transit time (approximately 5 μs, corresponding to the 200 kHz echo signal period) are unmistakable. In the high-flow regime (>600 m3/h), the 704.5 m3/h case demonstrates more complex behavior. While upstream measurements appear continuous (one primary cluster), systematic analysis reveals all values are offset by one period when compared to the expected linear flow-transit time relationship. This highlights the insidious nature of cycle-skipping errors that may escape immediate visual detection.
Figure 4 shows the received waveform of Path 32 at static status, which is composed of multiple envelopes. The abscissa represents the sampling points, which refers to a discrete sample of a waveform within a measurement period. Here the sampling frequency is 6 MHz. In the received waveform, P 1 is the maximum peak point of the first envelope, P 2 is the minimum peak point at the junction between the first envelope and the second envelope, and P 3 is the maximum peak point of the second envelope.
At low flow rates, the received ultrasonic wave exhibits minor distortion, yet the overall waveform remains consistent with the reference waveform, allowing accurate transit time determination via the cross-correlation method. However, as the flow rate increases, the waveform distortion becomes more pronounced. Notably, the upstream waveform is more susceptible to distortion compared to the downstream waveform. Therefore, this study primarily focuses on analyzing the upstream waveform.
Figure 5a presents the normalized upstream waveforms of Path 32 at a flow rate of 563 m3/h, where the blue curve represents the waveform with accurate transit time and the red curve shows the waveform with erroneous transit time. P 1 is the maximum peak point of the first envelope, P 2 is the minimum peak point at the junction between the first envelope and the second envelope, and P 3 is the maximum peak point of the second envelope. P 1 , P 2 and P 3 are featured points in the blue waveform, while P 1 , P 2 and P 3 are featured points in the red waveform. Comparative analysis reveals all corresponding feature points pairs ( P 1 / P 1 and P 2 / P 2 ) exhibit a one-cycle displacement, except for P 3 / P 3 . Furthermore, the red waveform demonstrates greater falling-edge amplitude than the blue waveform. Figure 5b displays the corresponding cross-correlation functions. The blue curve labeled correct cross-correlation function corresponds to the normal waveform in Figure 5a, while the red curve labeled wrong cross-correlation function corresponds to the distorted waveform in Figure 5a. Comparing the lags of the maximum-value point in the cross-correlation function, the latter shows one cycle shift. Through extensive waveform comparisons, conclusions can be drawn that it is the enhanced falling-edge amplitude of the envelope that causes the key peak points of the waveform to shift, which lead to the cycle-skip phenomenon in transit time calculations.
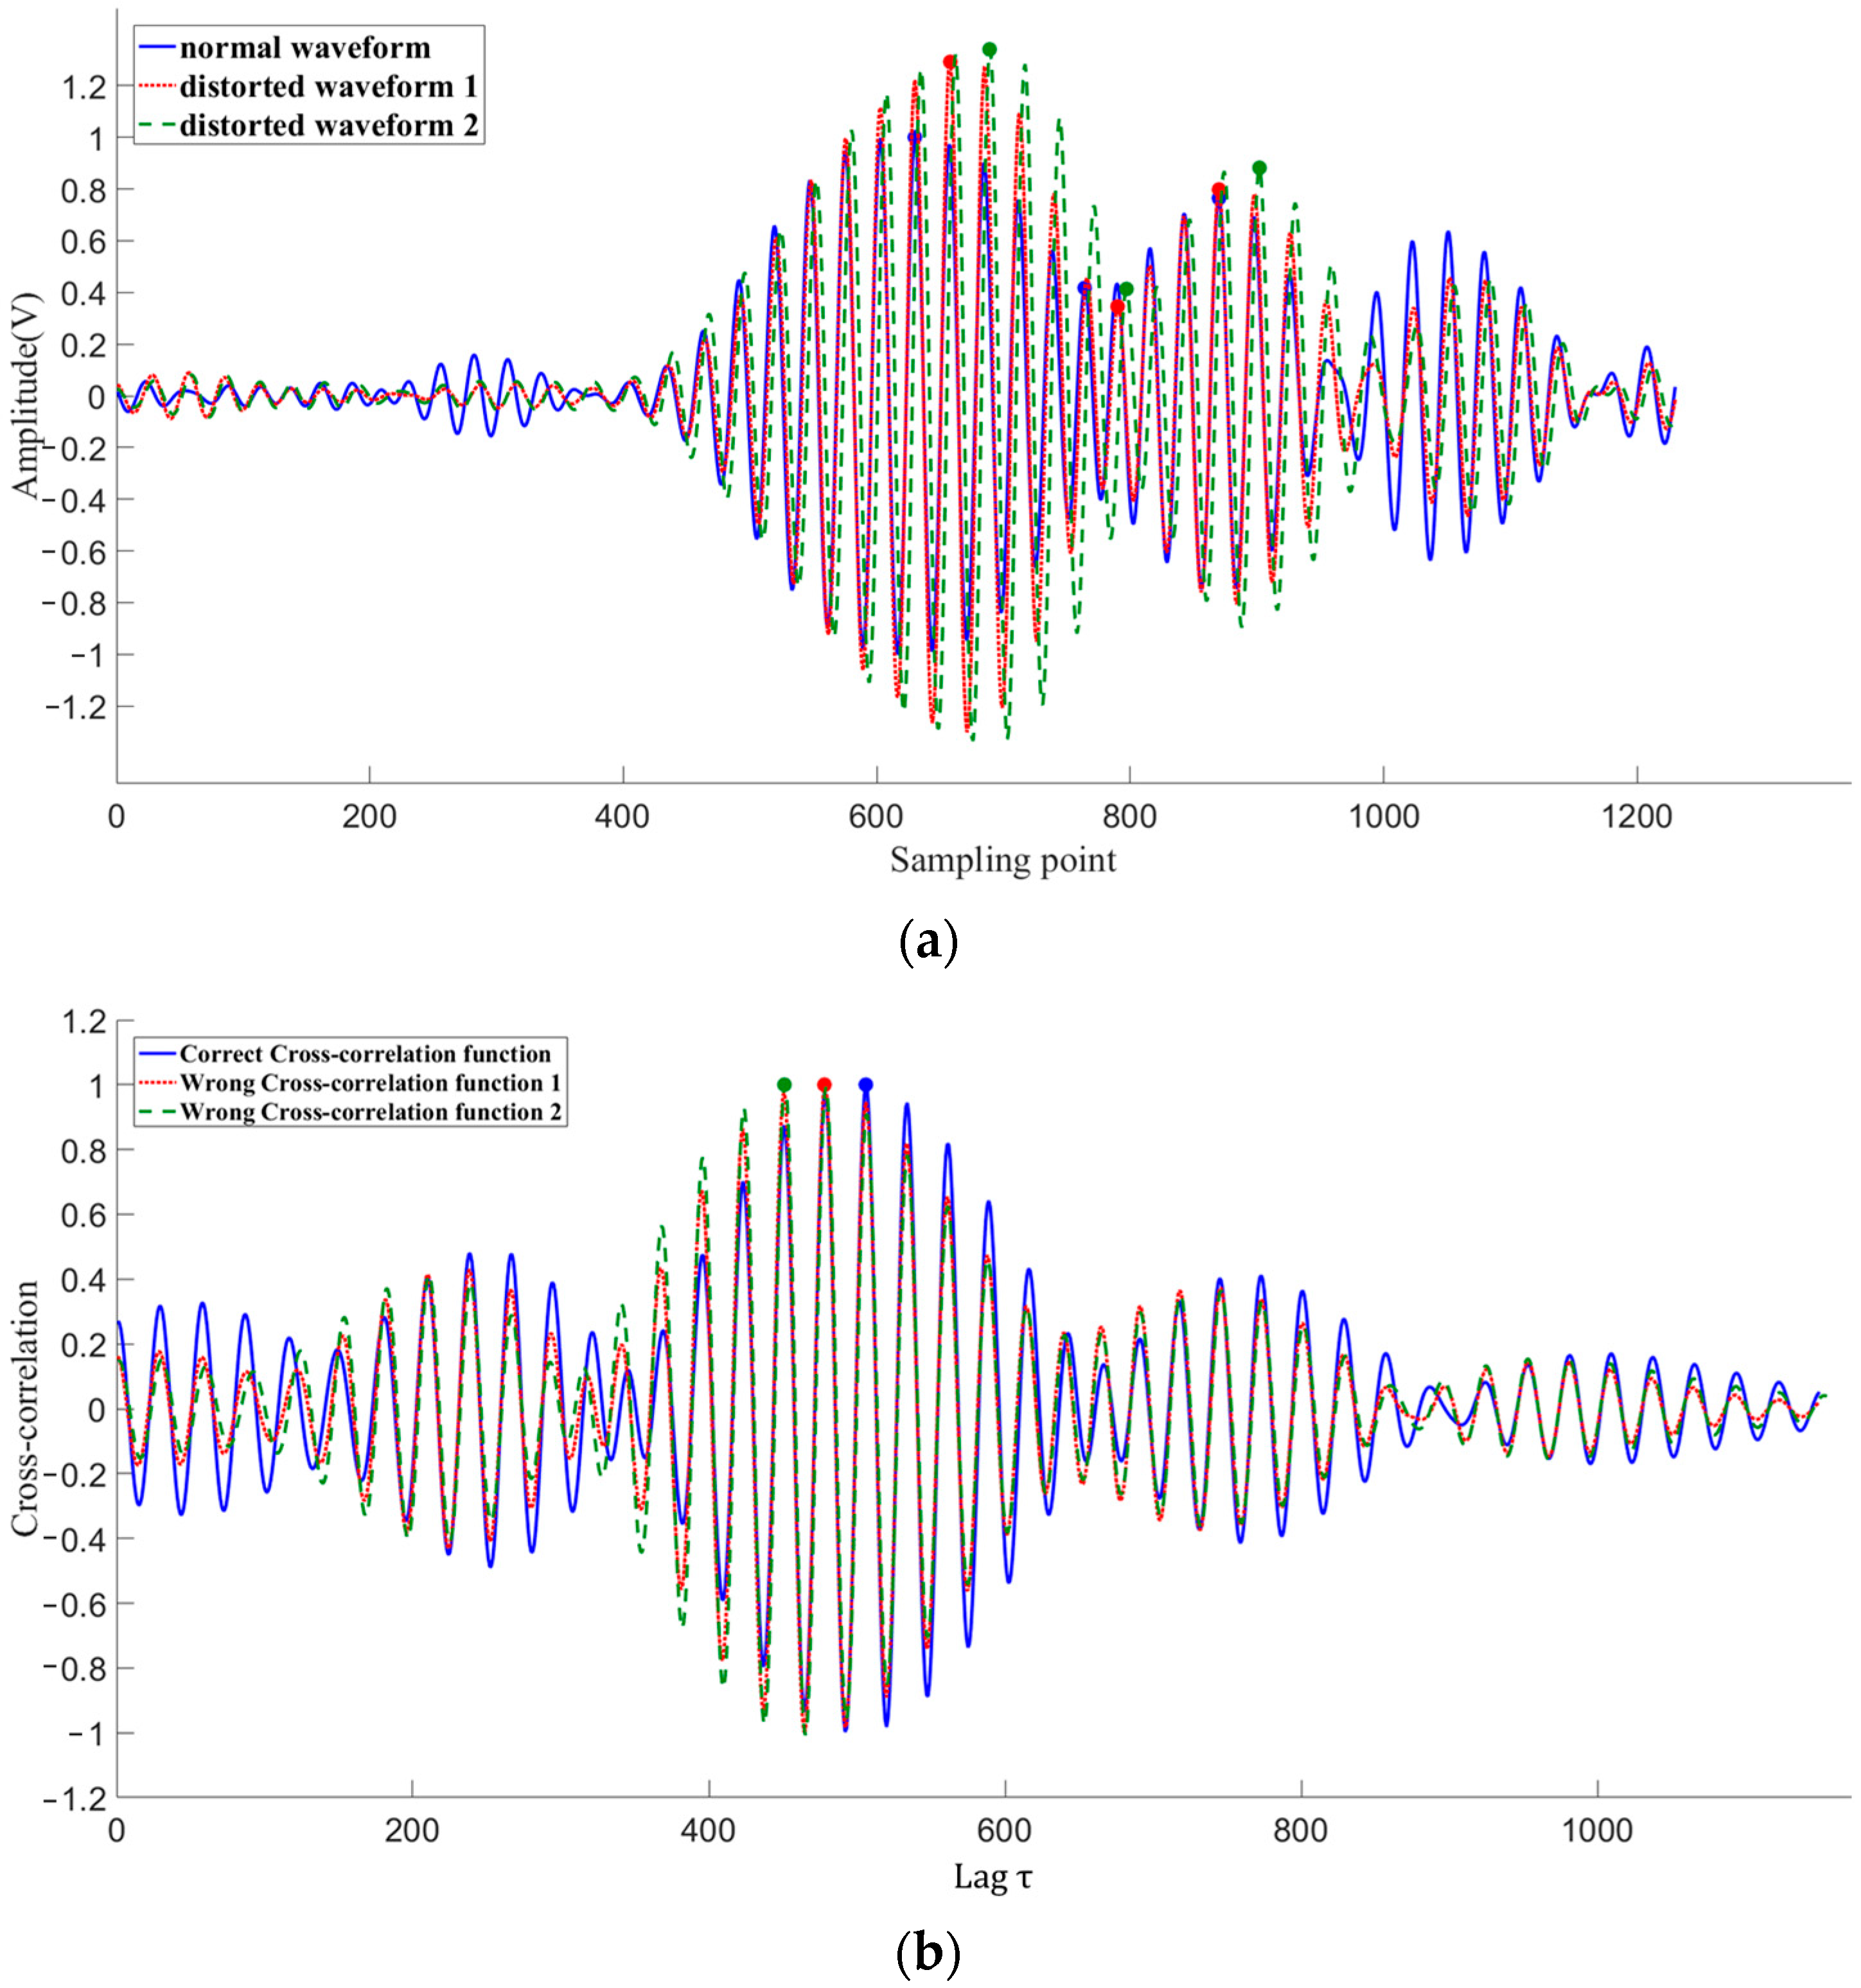
Figure 6a shows the normalized echo waveform for Path 31 at a flow rate of 563 m3/h, divided into three cases: the blue curve (normal waveform) represents the majority of the echo envelope shape at this flow rate, and the TOF obtained from the cross-correlation calculation is accurate. The red curve (distorted waveform 1) shows that in comparison to the blue curve, the position of the maximum peak of the echo signal is delayed by one period, leading to a shift of one period in the position of the maximum value of the cross-correlation function compared to the normal waveform (Figure 6b). The green curve (distorted waveform 2) has its maximum peak delayed by two periods, resulting in a two-period shift in the maximum point of the cross-correlation function. It can be directly observed from the figure that due to the abnormal distortion of the descending edge of the echo signal envelope, the maximum value point of the cross-correlation function is shifted, resulting in a corresponding integer-period deviation in the TOF.
The conventional cross-correlation method, while effective in noise suppression, is fundamentally limited by the periodic nature of ultrasonic signals. This limitation manifests as cycle-skipping errors when the waveform becomes severely distorted at high flow rates, as the algorithm may lock onto an incorrect signal period.
To overcome this inherent drawback, a new approach is required—one that shifts the focus from correlating the entire periodic signal to identifying a stable, unique feature within the waveform that is less susceptible to distortion. Our analysis revealed that the rising edge of the first arrival wave envelope possesses such characteristics; it demonstrates remarkable temporal stability across different flow conditions because the rising edge of the first envelope, as the direct arrival of the acoustic wavefront, experiences minimal attenuation and scattering from flow turbulences.
Based on this insight, we propose a novel similarity-based algorithm. The core principle is to identify the transit time by finding the optimal match between the rising edge of a reference waveform and a segment of the received waveform, rather than by seeking a correlation peak between two periodic sequences.

2.3. Transit Time Measurement Based on Similarity-Symmetry Method

2.3.1. Transit Time Measurement Based on Similarity Method

This study employs Euclidean distance to evaluate the similarity between two waveforms segments. The transit time is determined by identifying the segment in the received waveform that exhibits maximum similarity to the reference waveform. The discrete similarity function S x y is mathematically defined as:
D x y ( τ ) = 1 N i = 1 N ( x ( i ) K ( τ ) y ( i τ ) ) 2
S x y τ = 1 D x y ( τ ) , D x y ( τ ) 0
where D x y represents the distance function between the reference waveform (x) and the target waveform segment (y), K denotes the scaling coefficient of the target waveform, N indicates the length of the target waveform, τ corresponds to the time lag, and S x y quantifies the similarity between the target and reference waveforms.
The process of transit time determination using similarity can be intuitively understood as a template matching operation. The reference waveform (x), acquired under static condition, serves as a pristine template representing the expected signal shape. The target waveform (y) is the signal received during measurement.
To find the transit time, we systematically slide the reference template along the time axis of the target waveform. At each potential time lag (τ), we calculate the similarity value, the reciprocal of the Euclidean distance between the template and the overlapping segment of the target signal. The fundamental physical assumption is that the segment of the target waveform which most closely resembles the rising edge of the reference template corresponds to the true arrival time of the ultrasonic pulse. Considering that the amplitude of the echo signal changes with the flow, a scaling coefficient K is therefore introduced.
Therefore, the time lag (τ) at which the similarity function reaches its maximum is identified as the measured transit time. This approach is more robust than the cross-correlation method because it takes advantage of the shape information of the stable rising edge of the first envelope while avoiding the impact of waveform distortion on the falling edge of the envelope.
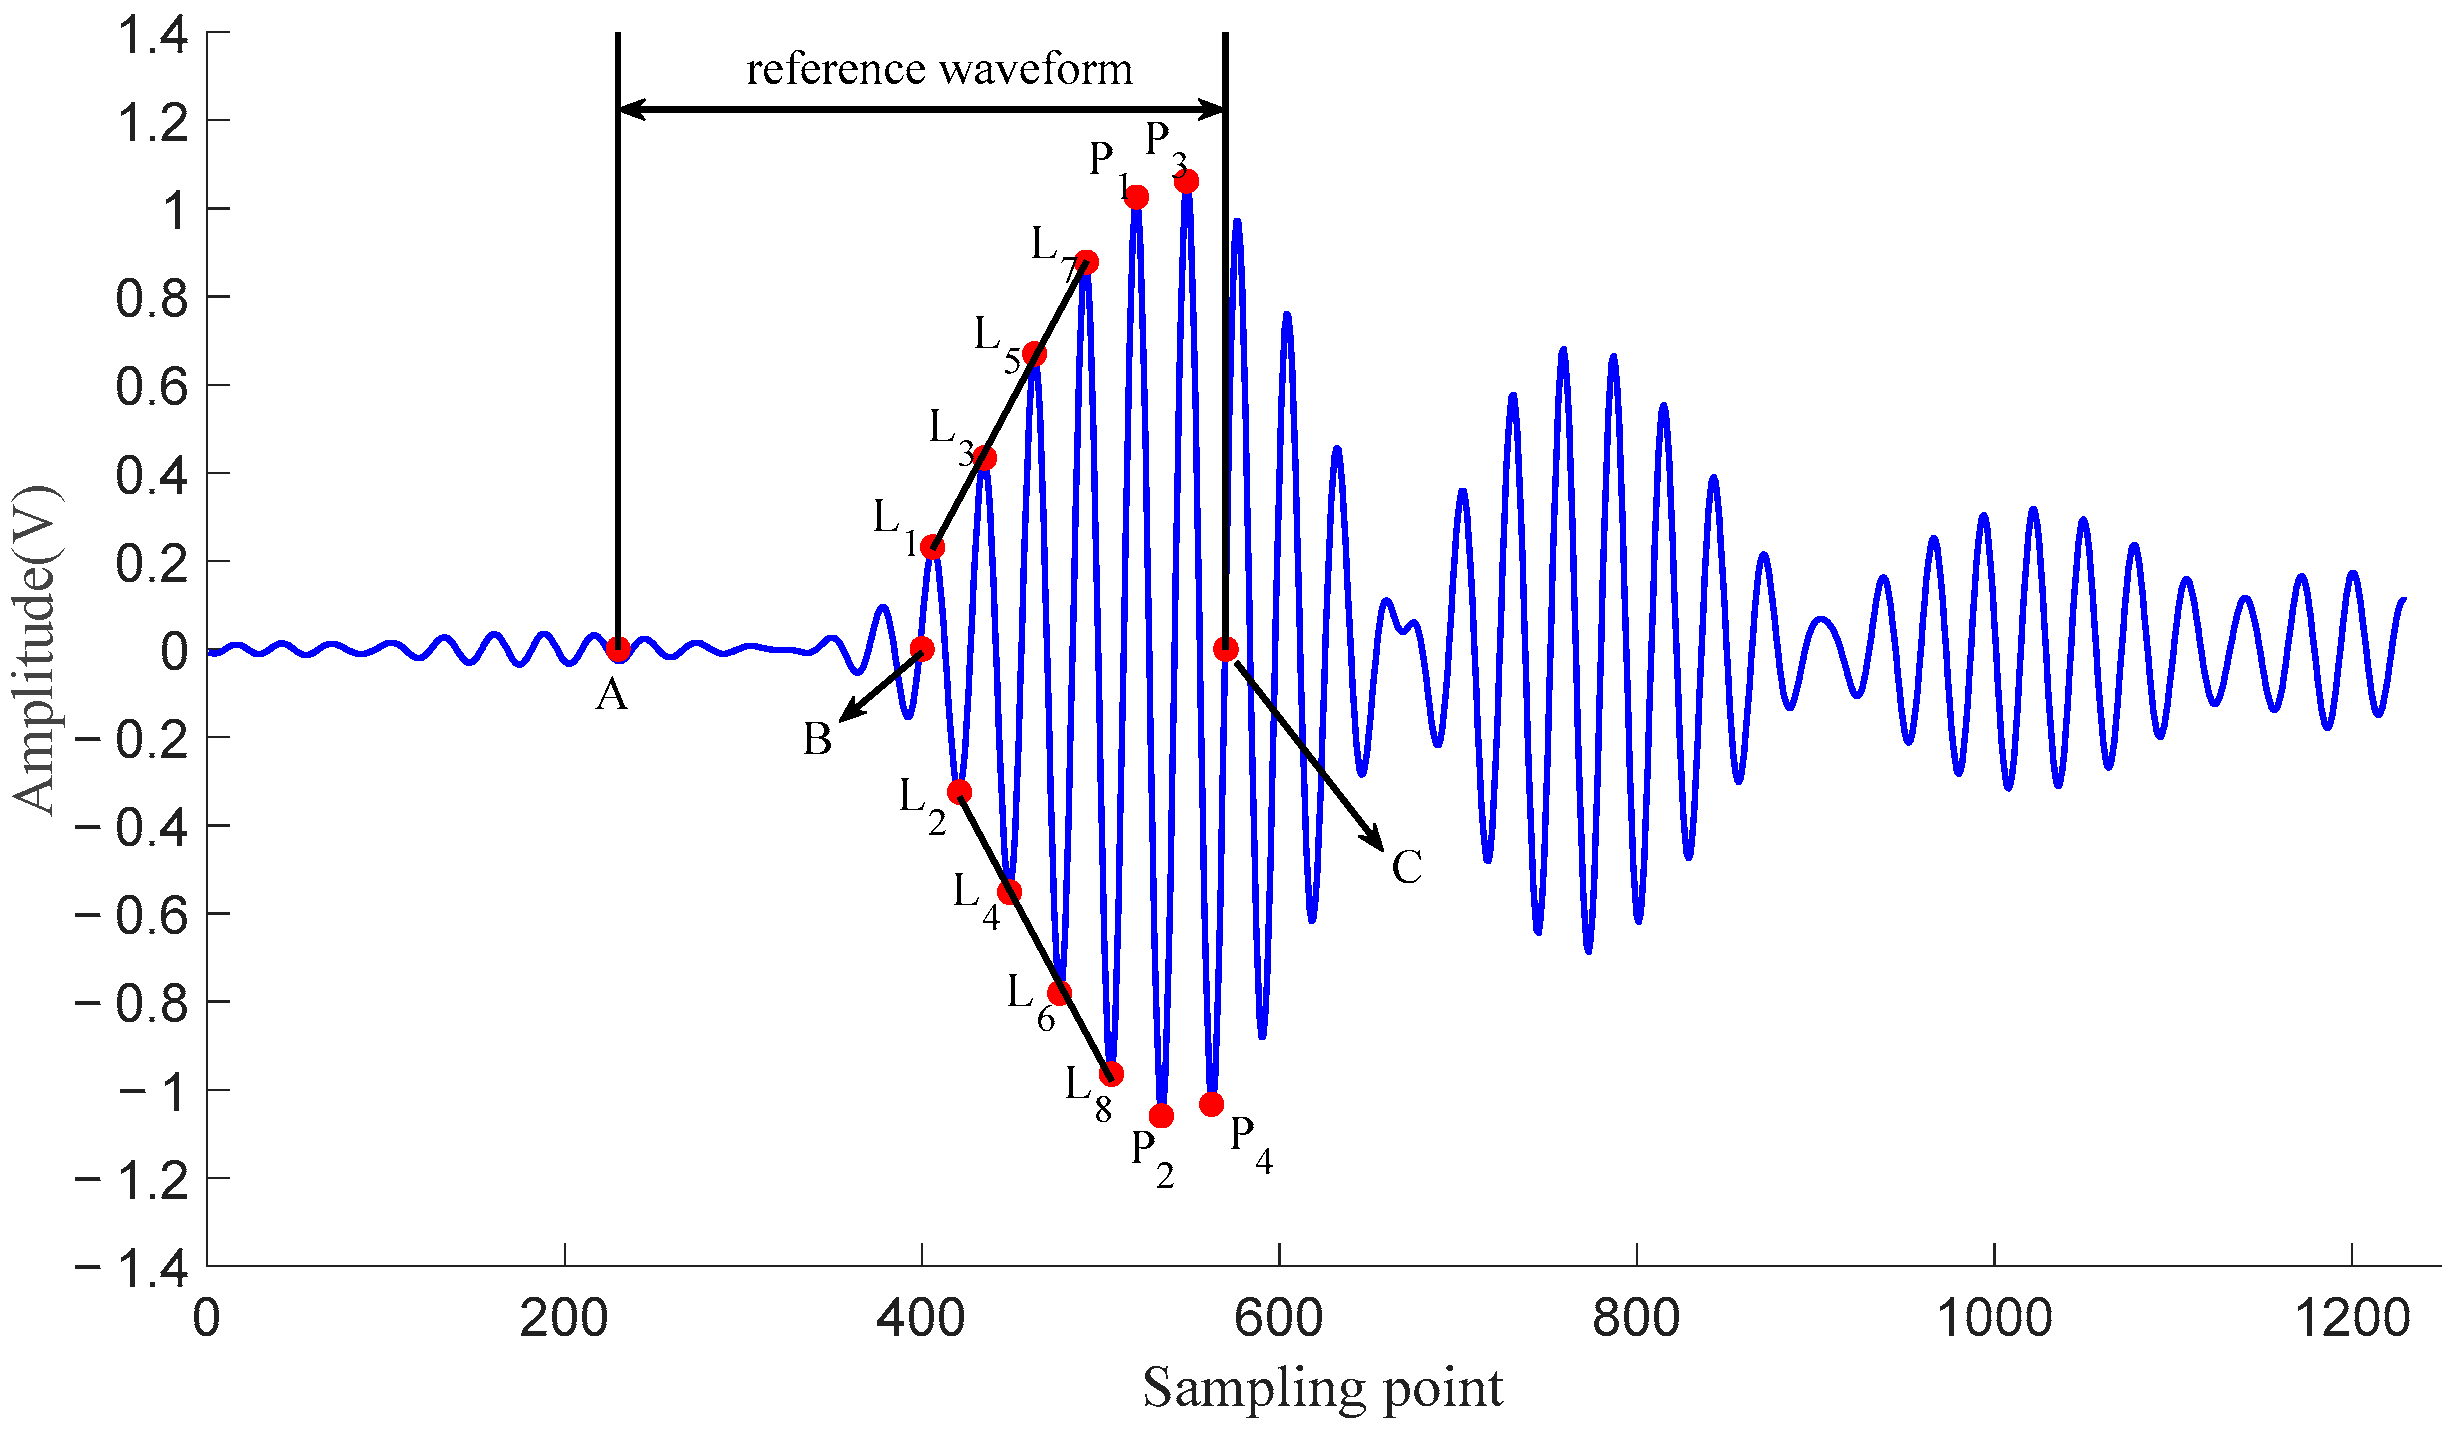
The reference waveform is crucial for accurate transit-time measurement. As shown in Figure 7, the reference waveform is extracted from the averaged static waveform of Path 32. It is composed of segment AC, which is further divided into two parts: segment BC and segment AB. Segment BC spans six complete waveform cycles, encompassing a total of 12 peak points—specifically, eight linear peaks (L1–L8) and four penalty peaks (P1–P4). Segment AB is of equal temporal length to BC.
The linear peaks are located along the approximately linear portion of the first envelope’s rising edge. These points exhibit a stable relative amplitude profile under varying flow conditions, showing minimal sensitivity to flow disturbances and noise. This consistency makes the rising edge a robust feature for similarity analysis. In contrast, the penalty peaks belong to the two waveform cycles immediately following the linear region and, under static conditions, include the maximum and sub-maximum peaks of the first envelope. Situated near the envelope’s falling edge, these peaks are more susceptible to amplitude anomalies at high flow rates.
To mitigate the impact of target waveform amplitude variations on similarity assessment, a scaling coefficient is introduced. The common way of waveform scaling is normalization. However, this method proves inadequate as the peak amplitude of received waveforms exhibits significant flow-rate dependency. Such dependency creates substantial amplitude discrepancies between the reference waveform and corresponding segments of normalized received waveforms. To address this limitation, we propose an alternative scaling coefficient determination method with the following implementation:
Find the points in the target waveform corresponding to the linear peak points of the reference waveform and record their amplitudes as L i , i = 1 ~ 8 , and P j , j = 1 ~ 4 , respectively. The scaling coefficient of the target waveform is calculated using the following expression:
K ( τ ) = 1 2 ( 1 8 i = 1 8 L i L i + 1 4 j = 1 4 P j P j )
where L i is the amplitude of the linear peak point of reference waveform, and L i is the amplitude of the corresponding point in the target waveform, P j is the amplitude of the penalty peak point of the reference waveform and P j is the amplitude of the corresponding point in the target waveform. The proposed multi-peak amplitude approach for scaling coefficient determination effectively mitigates the impact of waveform amplitude fluctuations on scaling stability.
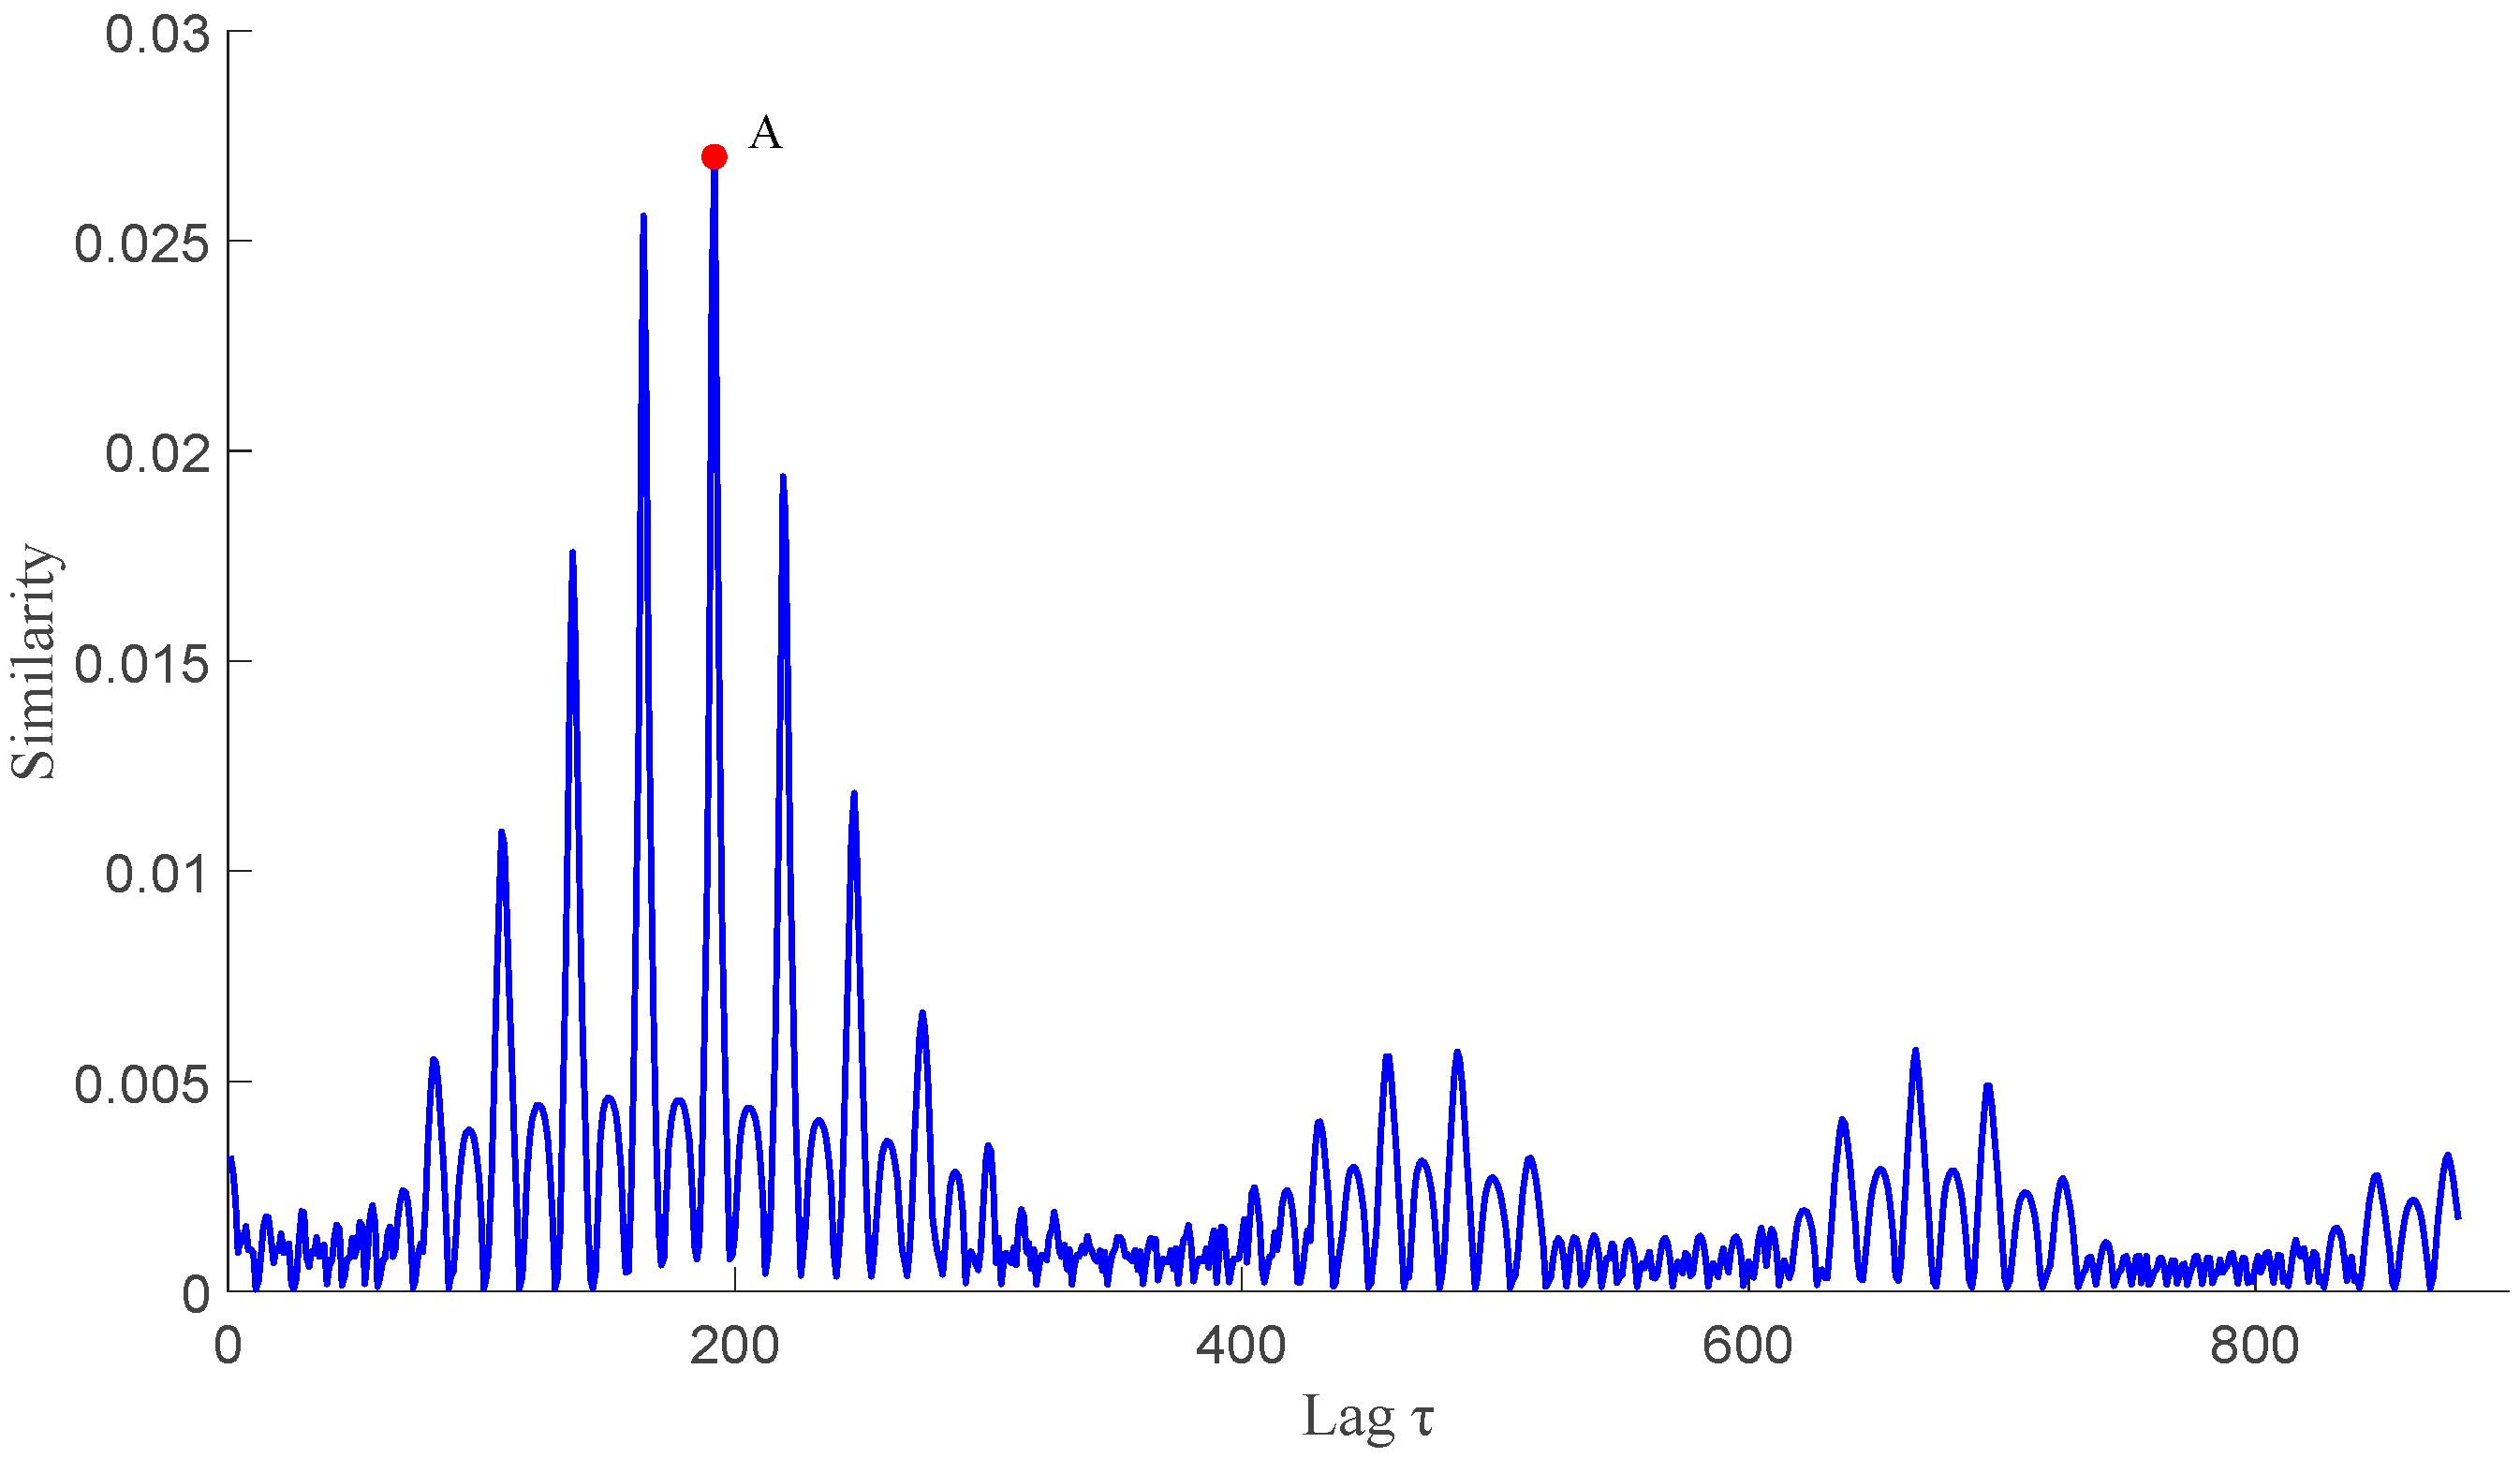
The robustness of the similarity method against cycle-skipping is quantitatively demonstrated in Figure 8, which plots the similarity coefficient as a function of the time lag (τ). The key observation is the presence of a single, sharp peak (Point A) in the similarity curve. This indicates that there is one unique, optimal alignment position for the waveform segments. In contrast, if cycle-skipping were to occur, one would expect to see multiple, competing peaks of similar magnitude in the similarity function, as the algorithm would struggle to distinguish between the correct period and adjacent ones. The distinctiveness of Point A confirms that the similarity method, by focusing on the unique shape of the rising edge, effectively avoids the ambiguity that leads to cycle-skipping errors.
The selection of ‘8 linear peaks + 4 penalty peaks’ is based on physical characteristics and was further validated by a systematic sensitivity analysis. Table 2 presents a comparative analysis of the cycle-skipping probability of the algorithm under different peak configurations (e.g., 6 + 3, 8 + 4, 10 + 5) across our flow range. The results confirmed that the (8, 4) configuration represents a robust performance plateau, effectively minimizing cycle-skipping errors. Configurations with fewer peaks showed increased instability, while those with more peaks provided no performance benefit and even increased computational cost and the risk of incorporating noisy signal segments.

2.3.2. Symmetry of Transit Times

According to the operating principle of transit-time ultrasonic flowmeter, the transit times of upstream and downstream flow can be described as follows:
t u p = L c v cos θ
t d o w n = L c + v cos θ
where t u p and t d o w n are the TOFs in upstream and downstream directions, respectively, L is the acoustic path length between two transducers, c is the speed of ultrasound in the gas medium, v is the average flow velocity along the acoustic path, θ is the angle between the acoustic path and the pipeline axis. Since c is much bigger than v in normal conditions (e.g., in natural gas or air), the above equations can be approximately transformed as:
t u p L c + L v cos θ c 2
t d o w n L c L v cos θ c 2
where term L / c represents the static (zero-flow) transit time. It can be seen that t u p and t d o w n exhibit linear dependence on mean flow velocity, and are basically symmetrical with respect to the static transit time at any flow rate. In multipath UFM, this symmetry holds for each individual acoustic path. The cross-correlation method’s susceptibility to cycle-skipping errors can be mitigated by exploiting this inherent symmetry property. By verifying that calculated upstream and downstream transit times maintain proper symmetric relationships with respect to the static transit time, erroneous measurements can be effectively identified and rejected.

2.4. Symmetry-Based Transit Time Correction

To enhance the robustness of transit time measurement against cycle-skipping errors, a symmetry-based correction mechanism is implemented. The underlying physical principle is that in a stable flow field, the difference in upstream and downstream transit times for a given acoustic path should exhibit a consistent relationship governed by the flow velocity, and any significant deviation from the expected symmetry indicates a potential cycle-skipping event.
The correction procedure, executed for each acoustic path, is as follows:
(1)
Data Acquisition and Preprocessing: During flow measurement, a sequence of n ≥ 50 downstream and upstream echo signals is continuously acquired. The transit times in both directions are calculated using the similarity method. Outliers in the raw data are first removed according to the 3σ criterion to eliminate gross errors.
(2)
Cluster Analysis: The Density-Based Spatial Clustering of Applications with Noise (DBSCAN) algorithm is employed to cluster the remaining downstream and upstream transit times, identifying the dominant measurement modes and their respective cluster centers. For instance, under normal conditions, a path might yield one downstream cluster center, XD, and one upstream cluster center, XU. However, in the presence of cycle-skipping, an additional cluster may appear (e.g., XU2).
(3)
Cycle-Skip Detection: Let X0 be the static (zero-flow) transit time for the path. A cycle-skip is detected for a cluster with center XUi if the following symmetry condition is violated:
X U i X 0 X 0 X D > 4   μ s
This threshold (4 μs) is derived from experimental statistics (T = 5 μs is the oscillation period of 200 kHz ultrasonic transducer) and represents a significant deviation from the expected physical symmetry, far exceeding normal measurement fluctuations.
(4)
Deviation Period Calculation: For a cluster identified as erroneous, the number of deviated periods, n, is calculated as:
n = R o u n d ( X w r o n g X c o r r e c t T )
here Xwrong is the centroid of the erroneous cluster (e.g., XU2), Xcorrect is the centroid of the correct cluster, and T = 5 μs is the oscillation period of a 200 kHz ultrasonic transducer. The round function ensures n is an integer, representing the number of full periods skipped.
(5)
Data Correction: All transit time values, twrong, within the erroneous cluster are corrected using the formula:
t w r o n g = t c o r r e c t n × T
This operation effectively realigns the erroneous measurements with the correct signal period.
This automated correction mechanism ensures that the final flow rate calculation is based on robust, cycle-skip-free transit time data, significantly enhancing measurement reliability, particularly at high flow rates where this phenomenon is most prevalent.

3. Experimental Results

3.1. Measurements of Transit Time

The flow rate range of 6.63 to 704.5 m3/h was selected for experimentation to comprehensively evaluate the similarity-symmetry method’s performance. This range corresponds to flow velocities from approximately 0.2 m/s to 25 m/s, thereby covering the critical transition from very low flows (where measurement sensitivity is challenged) to high flows (where cycle-skipping errors are prevalent), which represents the typical operational envelope of such flowmeters in industrial applications. The entire experiment includes 11 flow rates. To ensure statistical significance, the entire measurement process at each flow rate was repeated 150 times independently. The statistical values (e.g., mean, standard deviation) reported in the following sections are derived from these 150 samples. The analysis encompasses three methodological approaches: (i) conventional cross-correlation, (ii) similarity-based, and (iii) the proposed similarity-symmetry hybrid method.
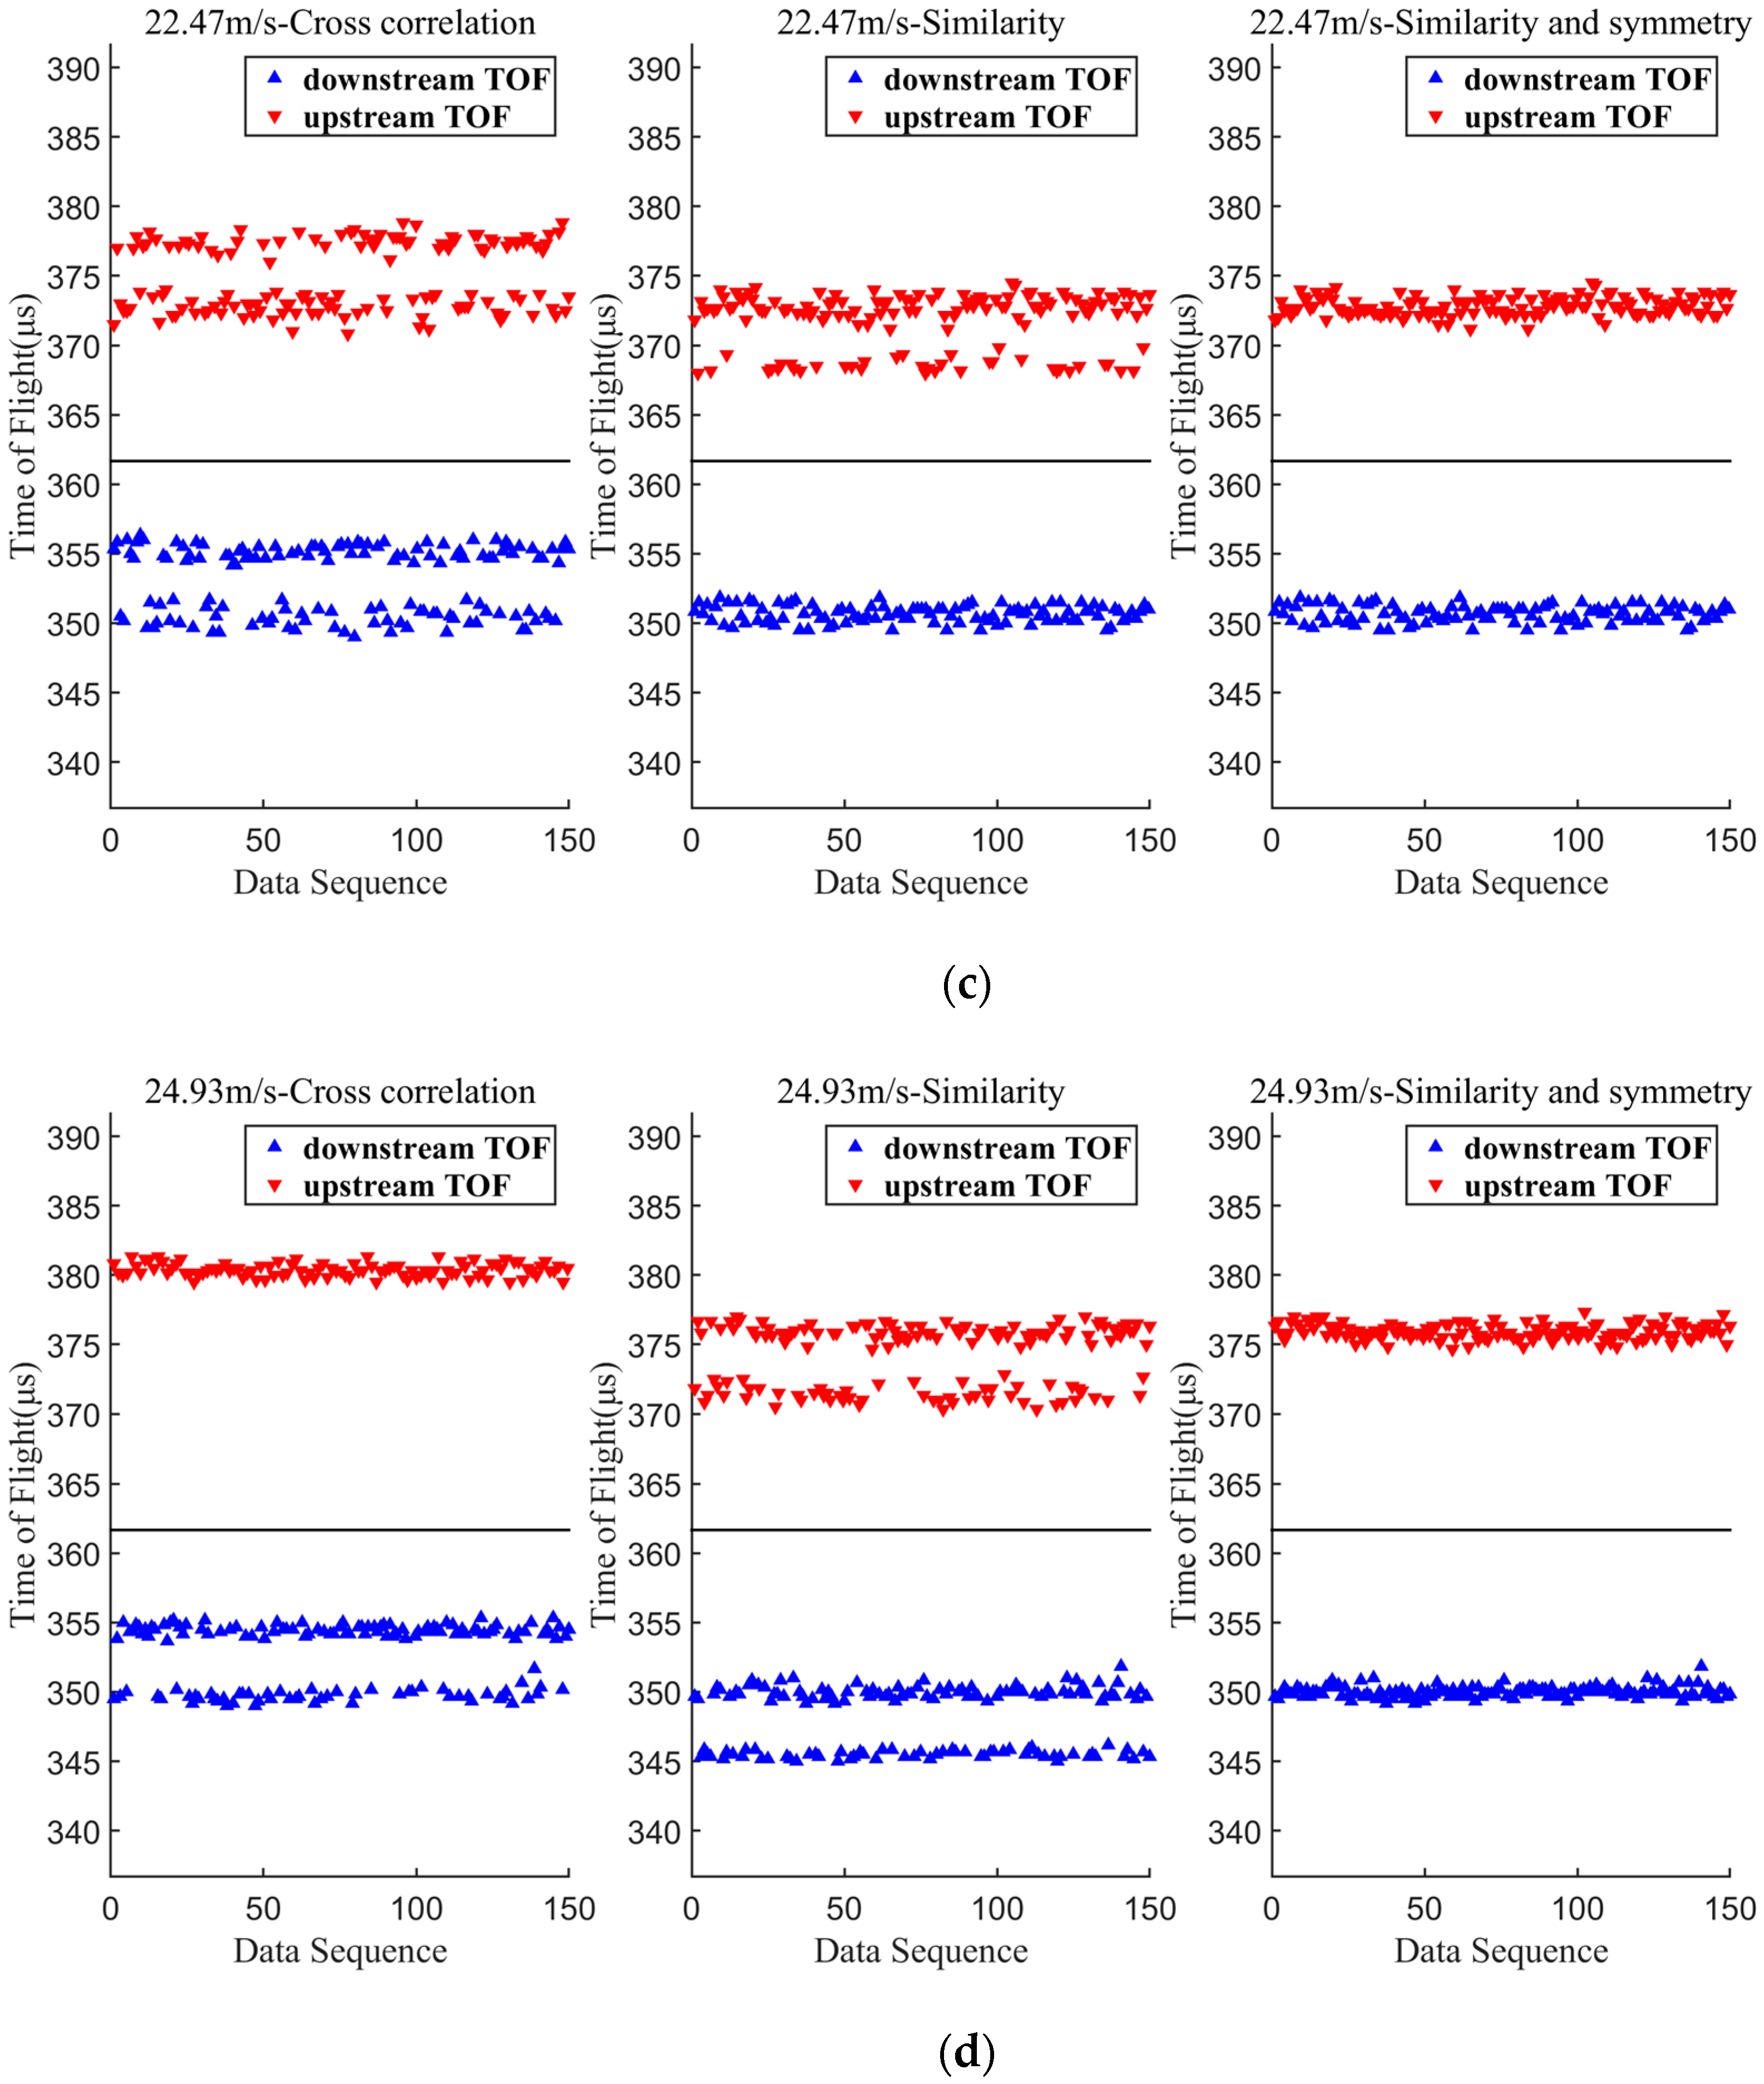
Figure 9 presents a comparative evaluation of transit time measurement methods for acoustic Path 32 under varying flow conditions. Experiment results show that cross-correlation method demonstrates stable performance at low flow rates (<425.6 m3/h; 15 m/s) and exhibits significant measurement stratification at higher flow rates (>562.8 m3/h; 20 m/s). Similarity method partially mitigates the stratification effects, but fails to maintain accuracy at extreme flow conditions (>600 m3/h). In contrast, the similarity-symmetry method achieves effective suppression of cycle-skipping and maintains measurement consistency across the tested flow range.
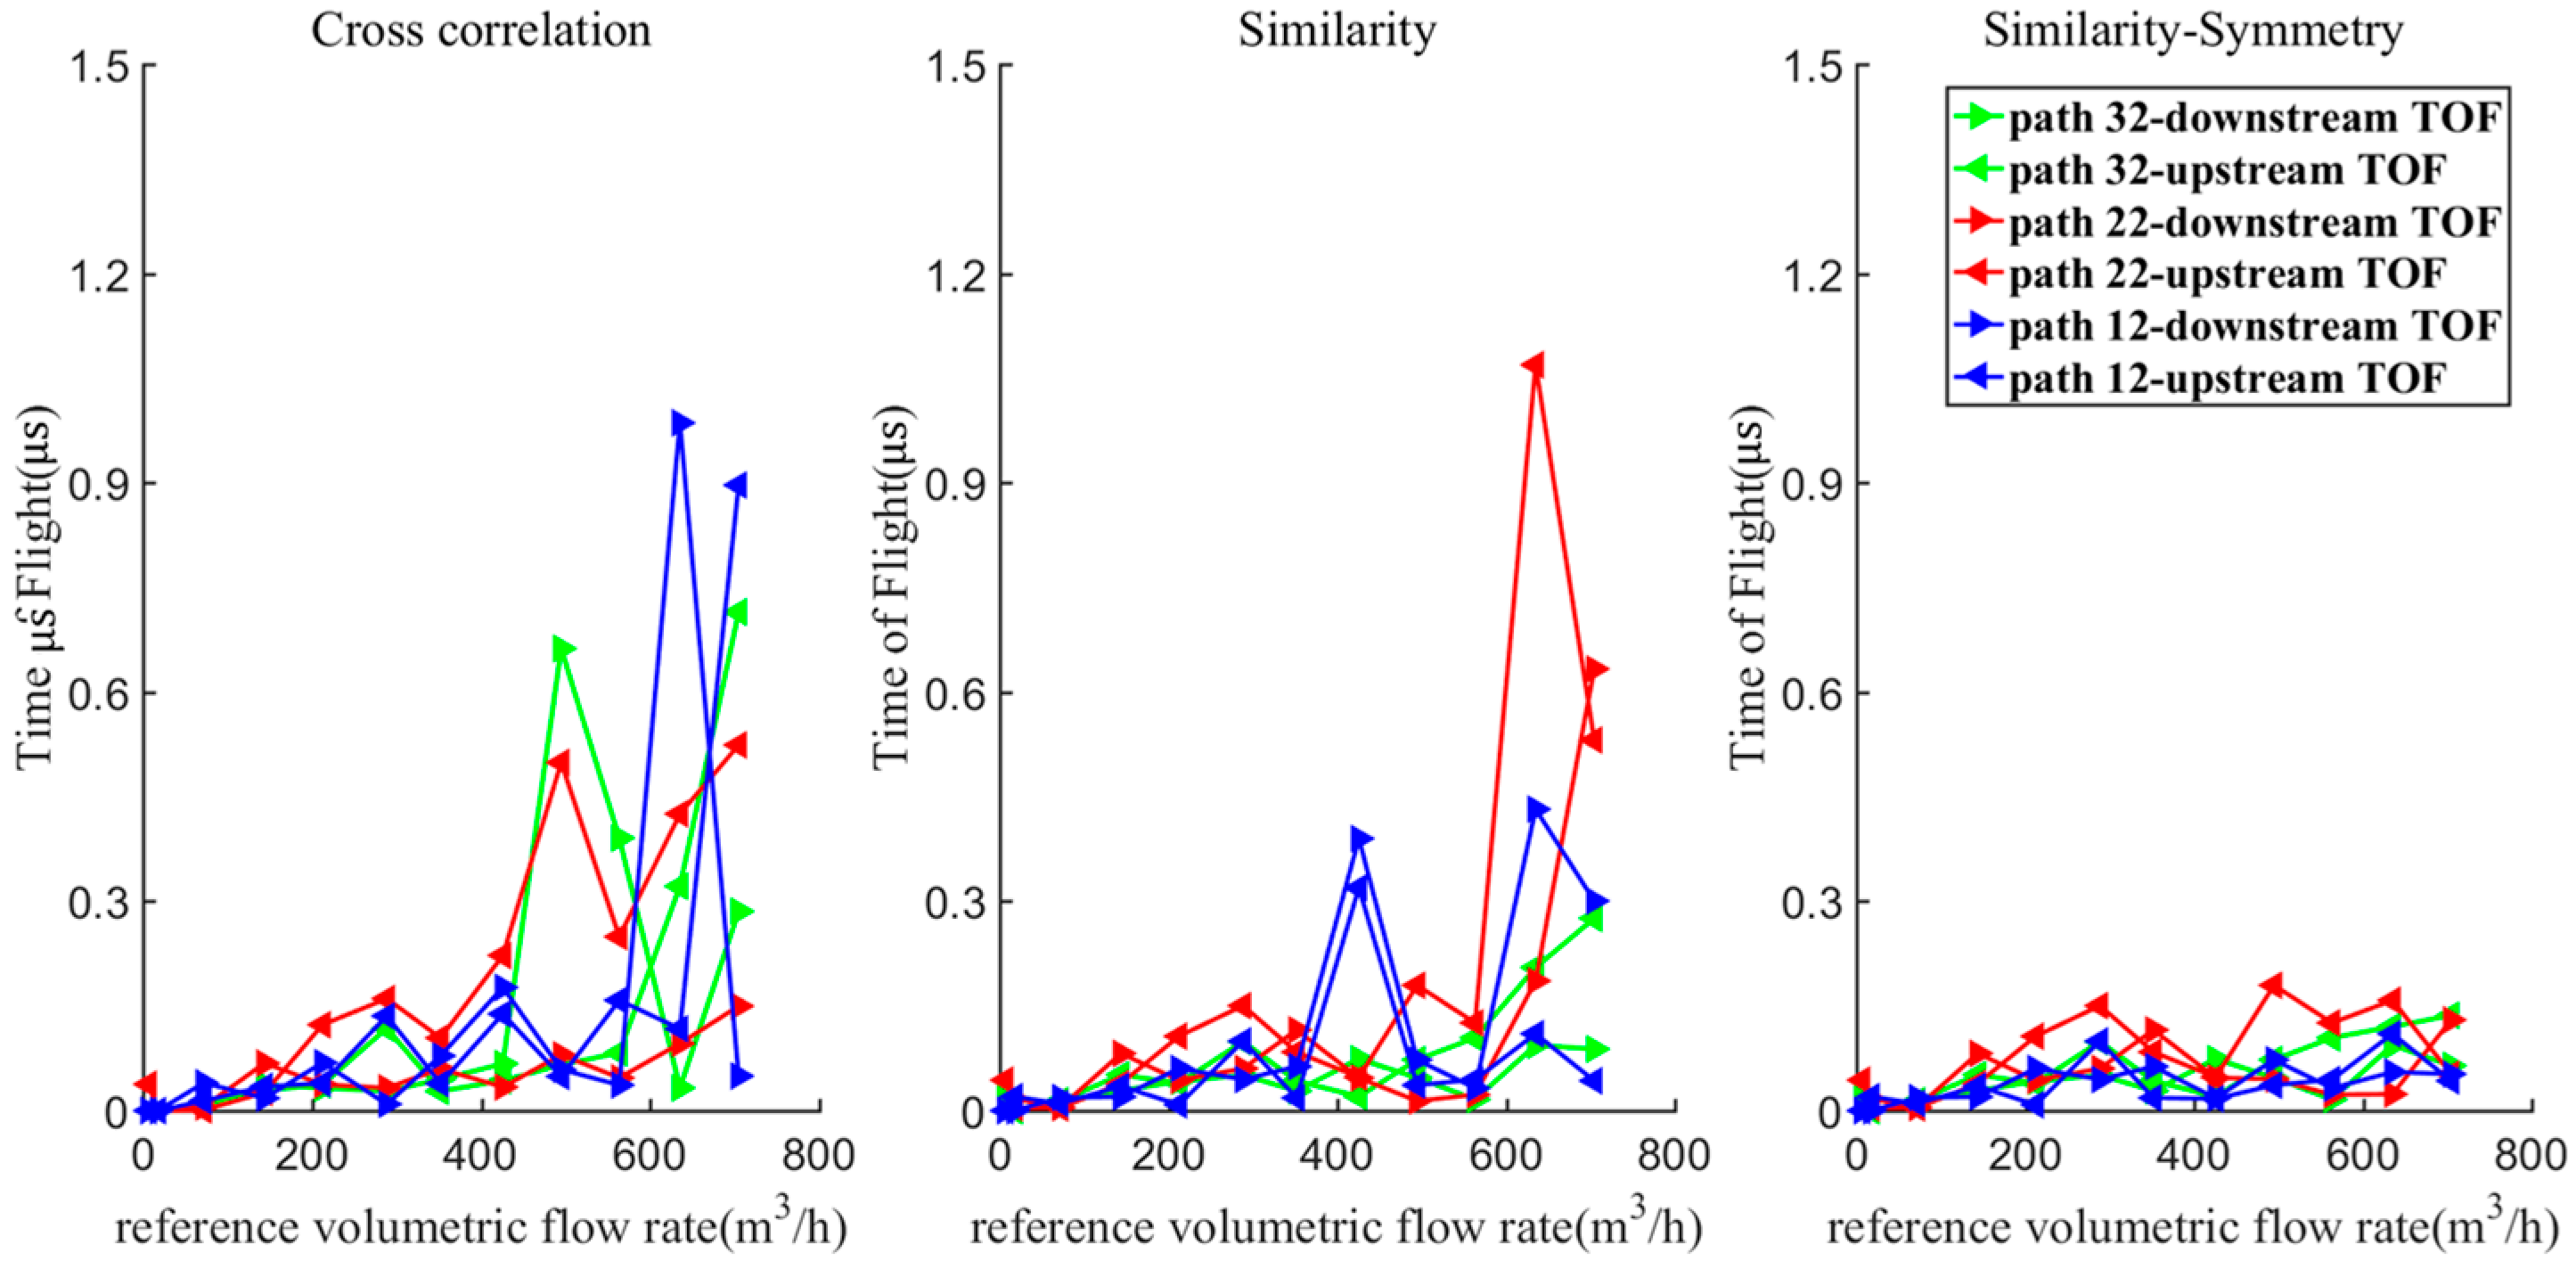
Figure 10 compares the measurement stability of three transit time determination methods across multiple acoustic paths, as reflected in the standard deviations of downstream and upstream transit times. The standard deviation is calculated as the sample standard deviation:
σ = 1 ( 150 1 ) i = 1 150 x i x ¯ 2
where σ is the sample standard deviation, x i denotes the i-th measurement value, x ¯ represents the mean. Both cross-correlation and similarity methods show progressively increasing measurement variability with higher flow rates. While cross-correlation exhibits marginally better consistency at certain flow rates, this apparent advantage masks underlying accuracy issues. The cross-correlation method’s temporal stability comes at the cost of undetected full-cycle errors, as visually demonstrated in Figure 9d. Such errors compromise the practical utility of the measured standard deviation metrics. The similarity-symmetry hybrid maintains superior stability across the entire operational range, demonstrates consistently lower variability compared to conventional approaches, and achieves reliable performance without sacrificing measurement accuracy.
The sustained low variability of the similarity-symmetry method confirms its effectiveness in resisting flow-induced measurement disturbances. This robustness originates from the method’s dual compensation mechanism that simultaneously addresses: (a) amplitude-related distortions through similarity analysis, and (b) temporal errors via path symmetry verification.

3.2. Flow Rate Measurements Based on Similarity-Symmetry

Table 3 presents a comparative analysis of measurement performance across three transit time determination methods: cross-correlation, similarity-based, and similarity-symmetry approach. The evaluation metrics include measured gas flow rates and corresponding relative errors. Experimental results reveal that both cross-correlation and similarity methods exhibit elevated relative errors, attributable to transit time stratification phenomena. The similarity-symmetry hybrid demonstrates superior accuracy compared to the other two methods. All methods show increased relative errors at lower flow rates. This performance limitation primarily stems from temporal resolution constraints imposed by the current sampling frequency. The observed performance patterns suggest two critical considerations for ultrasonic flow measurement: The similarity-symmetry method’s enhanced accuracy confirms the effectiveness of its dual compensation mechanism; The fundamental limitation at low flow rates highlights the need for either increased sampling frequency or alternative resolution enhancement techniques.

4. Discussion

4.1. Effect of Waveform Distortion

The morphology of received ultrasonic waveforms significantly influences transit time measurement accuracy in both cross-correlation and similarity-based methods. Two primary waveform alterations occur with increasing flow rates: (a) abnormal amplification of the falling edge amplitude, and (b) progressive overlap between the first and second waveform envelopes. In the six-path ultrasonic flow meter (UFM) prototype, substantial inter-path waveform variability was observed, with certain paths exhibiting severe distortion. Potential distortion mechanisms include:
(1)
Flow field effects. High-velocity flow conditions generate complex turbulent patterns that disrupt ultrasonic wave propagation. These disturbances become more pronounced at elevated flow rates, causing measurable waveform alterations.
(2)
Probe insertion variability. Installation inconsistencies lead to differential probe penetration depths across measurement paths. This variability creates non-uniform flow field disturbances that contribute to path-specific waveform distortion.
(3)
Multipath propagation. Three contributing factors merit consideration: natural beam divergence from finite probe aperture sizes, acoustic path deflection by fluid momentum transfer, and secondary signal reception from wall-reflected wavefronts. The superposition of these propagation modes produces composite waveform distortion.
(4)
Transducer performance characteristics. Manufacturing tolerances introduce inter-probe variability in frequency response characteristics, beam pattern consistency, and sensitivity thresholds. Pre-experimental probe pairing and calibration can mitigate these effects.
The observed stability of the rising edge of the first envelope can be attributed to its physical nature as the direct arrival of the acoustic wavefront. As the initial energy packet traveling the shortest path, it experiences minimal attenuation and scattering from flow turbulences compared to later portions of the waveform or subsequent echoes. The flow disturbances, which have finite spatial and temporal scales, have less time to significantly distort this initial wavefront. In contrast, the falling edge and subsequent oscillations are more susceptible to interference from multi-path reflections and complex interactions with the turbulent flow field, leading to greater variability.
The observed waveform alterations underscore the importance of advanced signal processing techniques to compensate for flow-induced distortions, precision installation protocols to minimize mechanical variability, and comprehensive probe characterization test during system configuration.

4.2. Measurement Accuracy at Low Flow Rate

As evidenced by Table 3, significant relative errors occur at low flow conditions (e.g., 6.5 m3/h [0.23 m/s]). This phenomenon primarily stems from system resolution limitations. The acquisition of the received waveform and the calculation of the transit time are all performed in the DSP. The maximum sampling frequency of the DSP in the prototype is 6 MHz. With a sampling frequency of 6 MHz, the theoretical time resolution T_s is limited to 1/6 MHz ≈ 0.167 μs. At a low flow rate of 6.50 m3/h (equivalent to a velocity of approximately 0.23 m/s), the ideal transit time difference (ΔT) between upstream and downstream is calculated to be 0.29 μs (Path 32). A deviation of just one sampling period (T_s) represents an absolute error of 0.167 μs. The relative error introduced is therefore T_s/ΔT ≈ 57.6%, which is very significant. In contrast, at a high flow rate of 20 m/s, ΔT is larger (~20.35 μs), and the same absolute error of T_s results in a much smaller relative error of ~0.8%. This fundamentally expins the observed trend and establishes the sampling limitation as the primary contributing factor at low flow rates. In theory, the higher the sampling frequency, the higher the resolution of transit time. However, the sampling frequency is limited by hardware configuration. The DSP in the prototype undertakes multiple tasks: waveform acquisition, signal processing, and transit-time calculation, all of which constrain achievable sampling frequency enhancement. Certainly, hardware platforms with a higher operating frequency and expanded memory resources are beneficial for improving the transit-time resolution.
Beyond sampling limitations, other challenges exist at low flow rates. The signal-to-noise ratio (SNR) of the received ultrasonic waveform may decrease due to diminished flow-induced modulation, potentially affecting the precision of the similarity calculation. Furthermore, the symmetry between upstream and downstream paths, which is central to our error detection, assumes an ideal flow field. At near-static conditions, minor inherent asymmetries in transducer characteristics or minute temperature gradients may become non-negligible, potentially influencing the correction logic. While our analysis indicates sampling error is dominant, these factors may contribute to the baseline error margin.

4.3. Cycle-Skip in Both Downstream and Upstream

In rare cases, cycle-skipping may occur simultaneously in both downstream and upstream transit times while maintaining symmetrical distribution, rendering symmetry-based detection ineffective. However, the inherent redundancy of multipath ultrasonic flowmeters (UFMs) provides a potential solution. If one or more paths fail, the remaining functional paths can still provide reliable average cross-sectional velocity estimation. The differential transit times from operational paths allow for accurate flow velocity approximation. A monotonic functional relationship exists between the average cross-sectional velocity and the path-specific velocities. This relationship, combined with Equations (6) and (7), enables estimation of the valid transit time range for the affected path. By leveraging the velocity correlation across paths, it is possible to estimate the expected transit time bounds for the faulty path and detect simultaneous cycle-skipping in both directions if the measured transit times fall outside the predicted range.
While this approach demonstrates theoretical feasibility, its detailed implementation and validation extend beyond the focus of the current study.

4.4. Applicability and Limitations

The findings of this study address the critical challenge of cycle-skipping in ultrasonic gas flowmeters (UGFMs), which causes significant errors under high-flow-rate conditions. It is important to clarify that the proposed method does not question the general usability of UGFMs, well-established instruments within their specified design envelope, but aims to extend their reliable operational range.
The occurrence of cycle-skipping errors, as investigated in this work, typically arises at the upper end of the flow range or in non-ideal flow conditions. Therefore, the proposed similarity-symmetry method enhances the robustness of ultrasonic flowmeters, making them more suitable for:
(1)
High-capacity gas pipelines where flow rates frequently approach the meter’s maximum capacity.
(2)
Applications requiring high accuracy across an extended dynamic range, minimizing the need for frequent calibration or redundancy.
Experimental results demonstrate that the similarity-symmetry method achieves a maximum relative error within ±1% over a wide flow range (71.78–425 m3/h) and within ±0.5% for flow rates above 425 m3/h. Table 4 provides a comprehensive comparison between the proposed method and established baseline techniques. A thorough review of the literature from 2023 to 2024 reveals that while there are advancements in ultrasonic flow measurement, the development of directly comparable hybrid methods combining similarity and symmetry principles for cycle-skip suppression remains an open area of research. The most relevant contemporary studies often focus on single-principle improvements (e.g., advanced denoising) or measurements with water as the medium, which are not directly analogous to the core contribution of this work.
Therefore, the most meaningful comparison is against the well-established and widely used benchmarks shown in Table 4. This comparison unequivocally demonstrates that the proposed similarity-symmetry method achieves a paradigm shift in robustness by effectively eliminating cycle-skipping, a fundamental limitation that continues to plague traditional methods. This unique advantage, combined with high accuracy and manageable computational cost, clearly establishes the innovation and practical value of the proposed approach.
To contextualize this performance, we reference industrial standards. For fiscal or custody transfer of natural gas, which represents the highest accuracy requirement, standards such as AGA Report No. 9 [27] often stipulate an error limit of ±0.5% over a specified flow range. Therefore, while our method meets the ±0.5% threshold at higher flow rates, there remains a performance gap at intermediate flows. However, many industrial applications, including process control, allocation metering, and emissions monitoring, have accuracy requirements typically ranging from ±1% to ±2%. Our method, being well within ±1% across vast majority of its operational range, is therefore fully sufficient and highly competitive for these significant applications.
More importantly, this work solves the critical cycle-skipping problem that can cause errors far exceeding these limits in traditional methods. The results provide a solid foundation for future work aimed at further optimizing low-flow performance to fully meet the most stringent custody transfer standards.

5. Conclusions

This study developed a novel similarity-symmetry hybrid method to tackle the critical challenge of cycle-skipping in ultrasonic gas flowmeters. The core innovation lies in the synergistic combination of a similarity-based estimator and a symmetry-based physical constraint. In this framework, the similarity method, leveraging the stable rising edge of the ultrasonic waveform, serves as the primary mechanism for robust transit-time estimation. The symmetry principle then acts as a watchdog, detecting and correcting residual cycle-skip errors that may escape the similarity analysis, thereby enhancing overall reliability.
Experimental validation demonstrated that the proposed method reduces the average flow rate error by 75% compared to the standard cross-correlation method and maintains the maximum relative error below 1% for flow rates above 71.78 m3/h, effectively suppressing the cycle-skipping phenomenon that plagues traditional methods at high flow rates.
This work provides a robust and accurate solution for high-precision flow measurement, with immediate practical significance for applications such as natural gas custody transfer and emission monitoring, where accuracy under varying conditions is critical for fiscal and regulatory compliance.
Future work will explore potential improvements, including implementing higher sampling frequencies to enhance low-flow performance, integrating the method with advanced signal-processing techniques, and applying it to more complex flow regimes, such as multiphase or highly turbulent flows.

Author Contributions

Conceptualization, H.Z. and Y.L.; methodology, H.Z. and Y.L.; software, Y.L.; validation, Y.L. and Y.W.; formal analysis, Y.L.; investigation, Y.L.; resources, Y.L.; data curation, Y.W.; writing—original draft preparation, Y.L.; writing—review and editing, H.Z. and Y.L.; visualization, Y.W.; supervision, H.Z.; project administration, H.Z.; funding acquisition, H.Z. All authors have read and agreed to the published version of the manuscript.

Funding

This research was funded by the State Key Laboratory of Industrial Control Technology, China, grant number ICT2025A04.

Data Availability Statement

The original contributions presented in this study are included in the article. Further inquiries can be directed to the corresponding author.

Conflicts of Interest

The authors declare no conflicts of interest.

Abbreviations

The following abbreviations are used in this manuscript:
UFMUltrasonic Flowmeter
UGFMUltrasonic Gas Flowmeter
TOFTime-of-flight
PCPersonal Computer
DSPDigital Signal Processor

References

  1. Lynnworth, L.C.; Liu, Y. Ultrasonic flowmeters: Half-century progress report, 1955–2005. Ultrasonics 2006, 44, 1371–1378. [Google Scholar] [CrossRef] [PubMed]
  2. Dell’Isola, M.; Cannizzo, M.; Diritti, M. Measurement of high-pressure natural gas flow using ultrasonic flowmeters. Measurement 1997, 20, 75–89. [Google Scholar] [CrossRef]
  3. Takeda, Y. Ultrasonic Doppler Velocity Profiler for Fluid Flow; Springer: Tokyo, Japan, 2012; pp. 71–103. [Google Scholar]
  4. Tabin, J. Theoretical analysis of the ultrasonic Doppler flowmeter for measurements of high flow velocities. IEEE Trans. Ultrason. Ferroelectr. Freq. Control 1987, 34, 467–471. [Google Scholar] [CrossRef] [PubMed]
  5. Kupnik, M.; Schroder, A.; O’Leary, P.; Benes, E.; Groschl, M. Adaptive pulse repetition frequency technique for an ultrasonic transit-time gas flowmeter for hot pulsating gases. IEEE Sens. J. 2006, 6, 906–915. [Google Scholar] [CrossRef]
  6. Mahadeva, D.V.; Baker, R.C.; Woodhouse, J. Further studies of the accuracy of clamp-on transit-time ultrasonic flowmeters for liquids. IEEE Trans. Instrum. Meas. 2009, 58, 1602–1609. [Google Scholar] [CrossRef]
  7. Grzelak, S.; Kowalski, M.; Czoków, J.; Zielinski, M. High resolution time-interval measurement systems applied to flow measurement. Metrol. Meas. Syst. 2014, 21, 77–84. [Google Scholar] [CrossRef]
  8. Zhu, R.Z.; Wang, S.Q.; Tang, Z.; Lu, Z.H.; Lin, L.; Yu, X.P. A two-step time-to-digital converter with 5.6-ps resolution and 1-4255-μs measurement range. IEEE Trans. Circuits Syst. II-Express Briefs 2024, 71, 552–556. [Google Scholar] [CrossRef]
  9. Kobayashi, T.; Shigeta, K.; Fujii, T. Transit-Time Difference Type Ultrasonic Flowmeter. U.S. Patent 6,647,805, 18 November 2003. [Google Scholar]
  10. Li, W.; Chen, Q.; Wu, J. Double threshold ultrasonic distance measurement technique and its application. Rev. Sci. Instrum. 2014, 85, 044905. [Google Scholar] [CrossRef]
  11. Lang, T. Zero Crossing Detection of an Ultrasonic Signal with Variable Threshold Value. U.S. Patent 7,543,508 B2, 9 June 2009. [Google Scholar]
  12. Zhu, W.; Xu, K.; Fang, M.; Shen, Z.; Tian, L. Variable ratio threshold and zero-crossing detection based signal processing method for ultrasonic gas flow meter. Measurement 2017, 103, 343–352. [Google Scholar] [CrossRef]
  13. Sabatini, A.M. Correlation receivers using Laguerre filter banks for modelling narrowband ultrasonic echoes and estimating their time-of-flights. IEEE Trans. Ultrason. Ferroelectr. Freq. Control 1997, 44, 1253–1263. [Google Scholar] [CrossRef]
  14. Demirli, R.; Saniie, J. Model-based estimation of ultrasonic echoes part I: Analysis and algorithms. IEEE Trans. Ultrason. Ferroelectr. Freq. Control 2001, 48, 787–802. [Google Scholar] [CrossRef]
  15. Jiang, Y.; Wang, B.; Li, X.; Liu, D.; Wang, Y.; Huang, Z. A model-based hybrid ultrasonic gas flowmeter. IEEE Sens. J. 2018, 18, 4443–4452. [Google Scholar] [CrossRef]
  16. Zhou, H.; Ji, T.; Wang, R.; Ge, X.; Tang, X.; Tang, S. Multipath ultrasonic gas flowmeter based on multiple reference waves. Ultrasonics 2018, 82, 145–152. [Google Scholar] [CrossRef] [PubMed]
  17. Oya, J.; Fort, E.H.; Miguel, D.N.; Rojas, A.S.; Carvajal, R.G.; Chavero, F.M. Cross correlation-based ultrasonic gas flow sensor with temperature compensation. IEEE Trans. Instrum. Meas. 2023, 72, 9509304. [Google Scholar] [CrossRef]
  18. Kong, L.C.; Zhang, L.; Zhao, N.; Xu, X.H. Time delay study of ultrasonic gas flowmeters based on VMD-Hilbert spectrum and cross-correlation. Sensors 2024, 24, 1462. [Google Scholar] [CrossRef]
  19. Fang, Z.; Hu, L.; Mao, K.; Chen, W.Y.; Fu, X. Similarity judgment-based double-threshold method for time-of-flight determination in an ultrasonic gas flowmeter. IEEE Trans. Instrum. Meas. 2018, 67, 24–32. [Google Scholar] [CrossRef]
  20. Liang, L.; Zheng, D.; Wang, M.S.; Liu, H.C.; Mei, J.Q. Research and implementation of automatic gain control method for time-difference ultrasonic gas meter. In Proceedings of the 2024 IEEE International Instrumentation and Measurement Technology Conference, Glasgow, UK, 20–23 May 2024. [Google Scholar]
  21. Liu, C.; Fang, Z.; Liu, W. A method to avoid the cycle-skip phenomenon in time-of-flight determination for ultrasonic flow measurement. J. Zhejiang Univ.-Sci. A 2021, 22, 695–706. [Google Scholar] [CrossRef]
  22. Bai, S.Z.; Zhang, J.Y.; Wang, X.; Li, T. A method to solve the periodic deviation in cross correlation measurement of ultrasonic echo signals. In Proceedings of the 2nd International Conference on Frontiers of Sensors Technologies, Shenzhen, China, 14–16 April 2017; pp. 358–362. [Google Scholar]
  23. Zhao, H.; Peng, L.; Takahashi, T.; Hayashi, T.; Shimizu, K.; Yomamoto, T. ANN based data integration for multi-path ultrasonic flowmeter. IEEE Sens. J. 2014, 14, 362–370. [Google Scholar] [CrossRef]
  24. Tang, X.; Xie, X.; Zhang, H.; Zhou, H. Data integration for multi-path ultrasonic flowmeter based on Levenberg–Marquardt algorithm. IET Sci. Meas. Technol. 2015, 9, 909–920. [Google Scholar] [CrossRef]
  25. de Aquino, G.S.; Martins, R.S.; Martins, M.F.; Ramos, R. An overview of computational fluid dynamics as a tool to support ultrasonic flow measurements. Metrology 2025, 5, 11. [Google Scholar] [CrossRef]
  26. Chen, Q.; Li, W.; Wu, J. Realization of a multipath ultrasonic gas flowmeter based on transit-time technique. Ultrasonics 2014, 54, 285–290. [Google Scholar] [CrossRef] [PubMed]
  27. AGA Report No. 9: Measurement of Gas by Multipath Ultrasonic Meters, 2nd ed.; American Gas Association: Washington, DC, USA, 2007.
Figure 1. Experiment system. (a) Diagram of experimental system; (b) Experimental platform.
Metrology 05 00071 g001
Figure 2. Arrangement of acoustic channels in six-channel UGFM.
Metrology 05 00071 g002
Figure 3. Distribution of transit time in Path 32 at multiple flow rates: (a) 6.63 m3/h; (b) 425.6 m3/h; (c) 563 m3/h; (d) 704.5 m3/h.
Metrology 05 00071 g003
Figure 4. Received waveform of Path 32 at static status.
Metrology 05 00071 g004
Figure 5. Received waveforms and cross-correlation function of Path 32 at 563 m3/h. (a) Received waveform; (b) Cross-correlation function.
Metrology 05 00071 g005
Figure 6. Received waveforms and cross-correlation function of Path 31 at 563 m3/h. (a) Received waveform; (b) Cross-correlation function.
Metrology 05 00071 g006
Figure 7. Averaged static waveform of Path 32 and reference waveform for similarity calculation.
Metrology 05 00071 g007
Figure 8. Similarity coefficient of Path 32 at 20 m/s. The maximum peak of the similarity curve indicates the most probable transit time.
Metrology 05 00071 g008
Figure 9. Distribution of transit time calculated by different methods in Path 32. (a) 425.6 m3/h; (b) 562.8 m3/h; (c) 635 m3/h; (d) 704.5 m3/h.
Metrology 05 00071 g009aMetrology 05 00071 g009b
Figure 10. Comparison of standard deviation of TOF based on different method. Standard deviation refers to sample standard deviation from 150 independent repeated measurements at each flow rate point.
Metrology 05 00071 g010
Table 1. Core parameters for each acoustic channel in six-channel UGFM.
Path No.323122211211
Position000.77R0.77R−0.77R−0.77R
Path Length/mm122.37123.189.3890.7189.3790.75
Table 2. Comparison of cycle-skipping probability of Path 32 under different peak configurations.
V (m/s)Peaks (6, 3)Peaks (10, 5)Peaks (8, 4) (Proposed)
DownstreamUpstreamDownstreamUpstreamDownstream Upstream
0000000
0.6000000
2.5000000
5000000
7.5000000
10000000
12.5000000
15000000
17.58.67%32.67%10%30%032.67%
204.67%38.0%033.33%00
22.53.59%69.34%70%82.67%025.33%
2580%76.67%74.67%26.67%40.0%37.33%
Table 3. Flow rate test results. Qr: Reference flow rate; Qm: Measured flow rate; Er: Relative error.
Qr (m3/h)Cross-CorrelationSimilaritySimilarity-Symmetry
Qm (m3/h)Er (%)Qm (m3/h)Er (%)Qm (m3/h)Er (%)
6.5011.5978.2614.70126.097.3513.04
17.8018.936.3512.15−31.7516.39−7.94
71.7873.762.7684.5017.7272.060.39
143.84144.410.39138.47−3.73143.840.00
212.52219.583.32209.41−1.46211.10−0.66
288.25296.162.75291.080.98287.12−0.39
351.84323.58−8.03355.511.04354.380.72
425.60414.29−2.66409.49−3.78425.600.00
494.55514.053.94490.59−0.80497.090.51
562.94546.55−2.91562.09−0.15561.24−0.30
635.00640.940.93622.00−2.05632.18−0.45
704.52711.300.96725.723.01706.220.24
Table 4. Comparative Analysis of Key Performance Indicators for Different Transit Time Methods.
MethodMaximum Error (%)Average Error (%)Computational ComplexityRobustness to Cycle-SkippingKey Application Scenario
Proposed Similarity-Symmetry Method<1.0 (>71.78 m3/h)
<0.5 (f > 425 m3/h)
0.37 (>71.78 m3/h)LowExcellentHigh-precision, Wide-range, Noisy conditions
Standard Cross-Correlation [16]1.50.59LowPoorStable, low-noise flow
VMD–Hilbert spectrum and cross-correlation [18]<1.0 (<121 m3/h)
<0.5 (>121 m3/h)
0.40 (>90.91 m3/h)HighMediumHigh-precision, stable, Noisy conditions
Variable-ratio threshold Detection [12]0.350.28Very lowPoorLow-cost, stable, low-noise flow
Disclaimer/Publisher’s Note: The statements, opinions and data contained in all publications are solely those of the individual author(s) and contributor(s) and not of MDPI and/or the editor(s). MDPI and/or the editor(s) disclaim responsibility for any injury to people or property resulting from any ideas, methods, instructions or products referred to in the content.