Article

Establishment of a Real-Time Monitoring System for the Flow Rate and Concentration of Process Gases for Calculating Tier 4 Emissions in the Semiconductor/Display Industry

by
Bong Gyu Jeong
,
Sang-Hoon Park
,
Deuk-Hoon Goh
and
Bong-Jae Lee
*
Climate Energy Center, Korea Testing & Research Institute, Gwacheon 13810, Republic of Korea
*
Author to whom correspondence should be addressed.
These authors contributed equally to this work.
Metrology 2025, 5(4), 60; https://doi.org/10.3390/metrology5040060
Submission received: 15 April 2025 / Revised: 3 September 2025 / Accepted: 12 September 2025 / Published: 1 October 2025

Abstract

In this study, we propose a simple and effective method for gas analysis by establishing a correlation between residual gas analyzer (RGA) intensity and gas concentration. To achieve this, we focused on CF4 and NF3, two high-global warming potential (GWP) gases commonly used in industrial applications. The experiment was conducted in four key steps: identifying gas species using optical emission spectroscopy (OES), calibrating RGA with a quadrupole mass spectrometer (QMS), constructing a five-point calibration graph to correlate RGA and Fourier-transform infrared spectroscopy (FT-IR) data, and estimating the concentration of unknown samples using the calibration graph. The results under plasma-on conditions demonstrated correlation and accuracy, confirming the reliability of our approach. In other words, the method effectively captured the relationship between RGA intensity and gas concentration, providing valuable insights into concentration trends. Thus, our approach serves as a useful tool for estimating gas concentrations and understanding the correlation between RGA intensity and gas composition.

1. Introduction

In the contemporary world, the pressing issue of global warming has taken center stage, emerging as a paramount concern. This alarming trend is predominantly a consequence of the increasing concentration of greenhouse gases (GHGs) in our atmosphere. Consequently, the precise measurement of GHGs has assumed significant importance in contemporary times. Therefore, understanding how these gases contribute to global warming has become an imperative subject for this century [1,2,3,4,5,6,7,8,9,10,11,12,13,14].
Connected to this issue, the concept of global warming potential (GWP) has been developed for the measurement of GHGs [11,15,16,17]. The core idea behind GWP is that the concentration of GHGs decreases over time per their atmospheric lifetime, leading to a reduction in thermal energy flux. By integrating radiative forcing over a specific time horizon, the GWP can be derived. The GWP was created to facilitate the comparison of the relative integrated impact of various GHGs on climate by effect relative to that of CO2 over the same time frame. Therefore, GWP has been defined as the ratio of the time-integrated radiative forcing from the instantaneous release of a trace substance GHG relative to that of CO2. In other words, GWP is described by radiative forcing and atmospheric lifetime, and it quantifies the GHG effect [9,11,12,13,14].
Due to the rise in environmental problems caused by global warming, numerous countries recognize the importance of measuring GWP. Consequently, they have joined forces to establish the “Intergovernmental Panel on Climate Change (IPCC)”, tasked with the crucial responsibility of monitoring and reporting on the impact of GWP. Nevertheless, it is essential to acknowledge that while IPCC reports are valuable, they require several complementary measures. The reports describe GWP values well, but these values exhibit fluctuations over the reported years [15,18,19,20,21,22]. Furthermore, these reports often lack critical information regarding the atmospheric lifetime of GHGs and the intricate chemistry and dynamics within our atmosphere. Therefore, these valuable reports need to establish traceability measurement and enhance precision, ultimately improving the accuracy. Moreover, the industrial sector urgently needs to reduce GWP gases, making it crucial to accurately measure their concentrations and quantities.
In Korea, emission certification standards for the semiconductor and display industries are defined by KS I 0587 and KS I 0588, which are based on protocols established by the U.S. Environmental Protection Agency (EPA). These standards outline the methods for quantifying GHG emissions in the electronics industry, focusing on flow rate and concentration measurements. Specifically, flow rate assessments are conducted using a quadrupole mass spectrometer (QMS) with Kr gas as a reference, while individual chemical species within process gases are quantified using Fourier-transform infrared spectroscopy (FT-IR). The total emission quantity is then calculated based on these measurements [23,24].
In alignment with the goal of the Korean government to achieve carbon neutrality by 2050, the Korean Ministry of Environment has announced plans to develop and implement a Tier 4 methodology. This approach involves real-time monitoring of GHG emissions using advanced sensor technologies, such as residual gas analyzers (RGA) and optical emission spectroscopy (OES), which are already employed for process diagnostics in semiconductor and display manufacturing. Given the frequent fluctuations in emissions within these industries, accurate and real-time monitoring is essential for effective environmental management.
In this study, we developed and proposed analytical methods to estimate GWP gases. Specifically, we focused on CF4 and NF3, which play significant roles in the etching and cleaning processes of semiconductor and display manufacturing. We believe our method could provide valuable support for accurate measurement in industrial applications, particularly for gases with unknown concentrations.

2. Materials and Methods

This study aimed to establish a reliable method for measuring gas concentrations and analyzing their behavior under plasma-on and plasma-off conditions using combination of mass spectrometry, infrared absorption spectroscopy, and OES. The experimental setup was designed to facilitate the precise detection and quantification of gas species relevant to industrial applications, particularly in semiconductor processing environments.
The details of the experimental setup have been described elsewhere [25], with only the essential aspects outlined in this paper. The detection system was primarily divided into two sections, each designed to facilitate the analysis of gas composition and concentration.
The first section consisted of 300 mm reactive ion etching (RIE) chamber, RGA (QL-SG02-100-1A, Horiba (Kyoto, Japan)) connected to turbomolecular pump (TP, TMH-260, Pfeiffer Vacuum (Aßlar, Germany)), UV/visible spectrometer with charge-coupled device array detector (CCD, HR4000, Ocean Optics (Orlando, FL, USA)) for optical emission analysis, and TP (STP ixA3305CPV, Edward Vacuum (Burgess Hill, UK)) to maintain a stable vacuum environment for RIE chamber.
The second section included a dry mechanical pump (DMP, iH1000, Edward Vacuum) for gas evacuation, QMS (PrismaPro, Pfeiffer Vacuum) for mass analysis, and FT-IR (DX4000, Gasmet (Vantaa, Finland)) for qualitative and quantitative gas measurements.
The system was designed to introduce and analyze multiple gas species relevant to industrial applications. CF4 (99.999%) and NF3 (99.999%) were selected as representative industrial gases commonly used in semiconductor processing, while N2 (99.999%) and Kr (99.999%) were used for flow rate calibration and reference measurements. Accordingly, CF4/N2/Kr and NF3/N2/Kr gas mixtures were adopted. The input gases were first introduced into the RIE chamber, where plasma-induced dissociation could occur, and then directed towards the TP, DMP, QMS, and FT-IR for comprehensive analysis.
Before the analysis using FT-IR, the FT-IR must be calibrated because the intensities in FT-IR are converted to concentrations. In detail, FT-IR, which has resolution of 8 cm−1 and cell length of 5 m, was used to measure the concentration of CF4 and NF3 gases. To convert the absorbance measured by FT-IR into concentration, calibration curves for each gas were established using certified reference materials (CRMs). For CF4, peaks were observed in the 1236–1292 cm−1 range based on HITRAN databases and previous studies [26,27,28]. Accordingly, the special range of 1200–1330 cm−1, which includes this peak region, was selected for CF4 detection. To cover both low and high concentration ranges, a five-point calibration was conducted by diluting 20,100 mol CF4 CRM gas with N2 gas, yielding calibration points at 4020, 8040, 12,060, 16,080, and 20,100 μmol/mol. The example of calibration range is shown in Figure 1 and Figure 2. Similarly, for NF3, characteristic peaks were observed in the 850–1032 cm−1 range, and the broader range of 805–1100 cm−1 was selected for NF3 detection [29,30]. A ten-point calibration was also performed by diluting 20,000 μmol/mol NF3 CRM gas with N2 gas, with calibration points at 2000, 4000, 6000, 8000, 10,000, 12,000, 14,000, 16,000, 18,000, and 20,000 μmol/mol. Unlike CF4, ten-point calibration was adopted for NF3 because it tends to dissociate more readily than CF4. Thus, even under identical plasma conditions, the measured NF3 concentrations were expected to be lower. To ensure an extended calibration range and maintain accuracy, a denser calibration set was employed.
Following the setup described above, concentration data for CF4 and NF3 were collected using FT-IR under identical experimental conditions, while the intensities of various dissociated chemical species were measured using RGA. As the flow rate of process gases injected into the chamber increased, both gas concentration and RGA intensity were expected to rise accordingly. Therefore, data were collected across range of flow rates, and linear fitting was performed to evaluate the relationship between concentration and intensity. Using the resulting linear model, we aimed to estimate the concentrations of process gases under interpolated conditions based on the RGA intensity data.
This experimental setup allowed for an integrated approach to gas measurement, combining multiple detection methods to enhance accuracy and reliability. By systematically analyzing the behavior of CF4 and NF3 under plasma-on and plasma-off conditions, we aimed to develop a robust methodology for gas concentration estimation and characterization. The synergy between mass spectrometry, infrared spectroscopy, and optical emission techniques provided a comprehensive understanding of gas phase reactions, offering insights into the correlation between different analytical techniques. This approach not only improves the precision of gas concentration measurements but also provides a versatile framework for studying plasma-assisted processes in industrial applications.

3. Results and Discussion

3.1. OES Spectra for Analysis

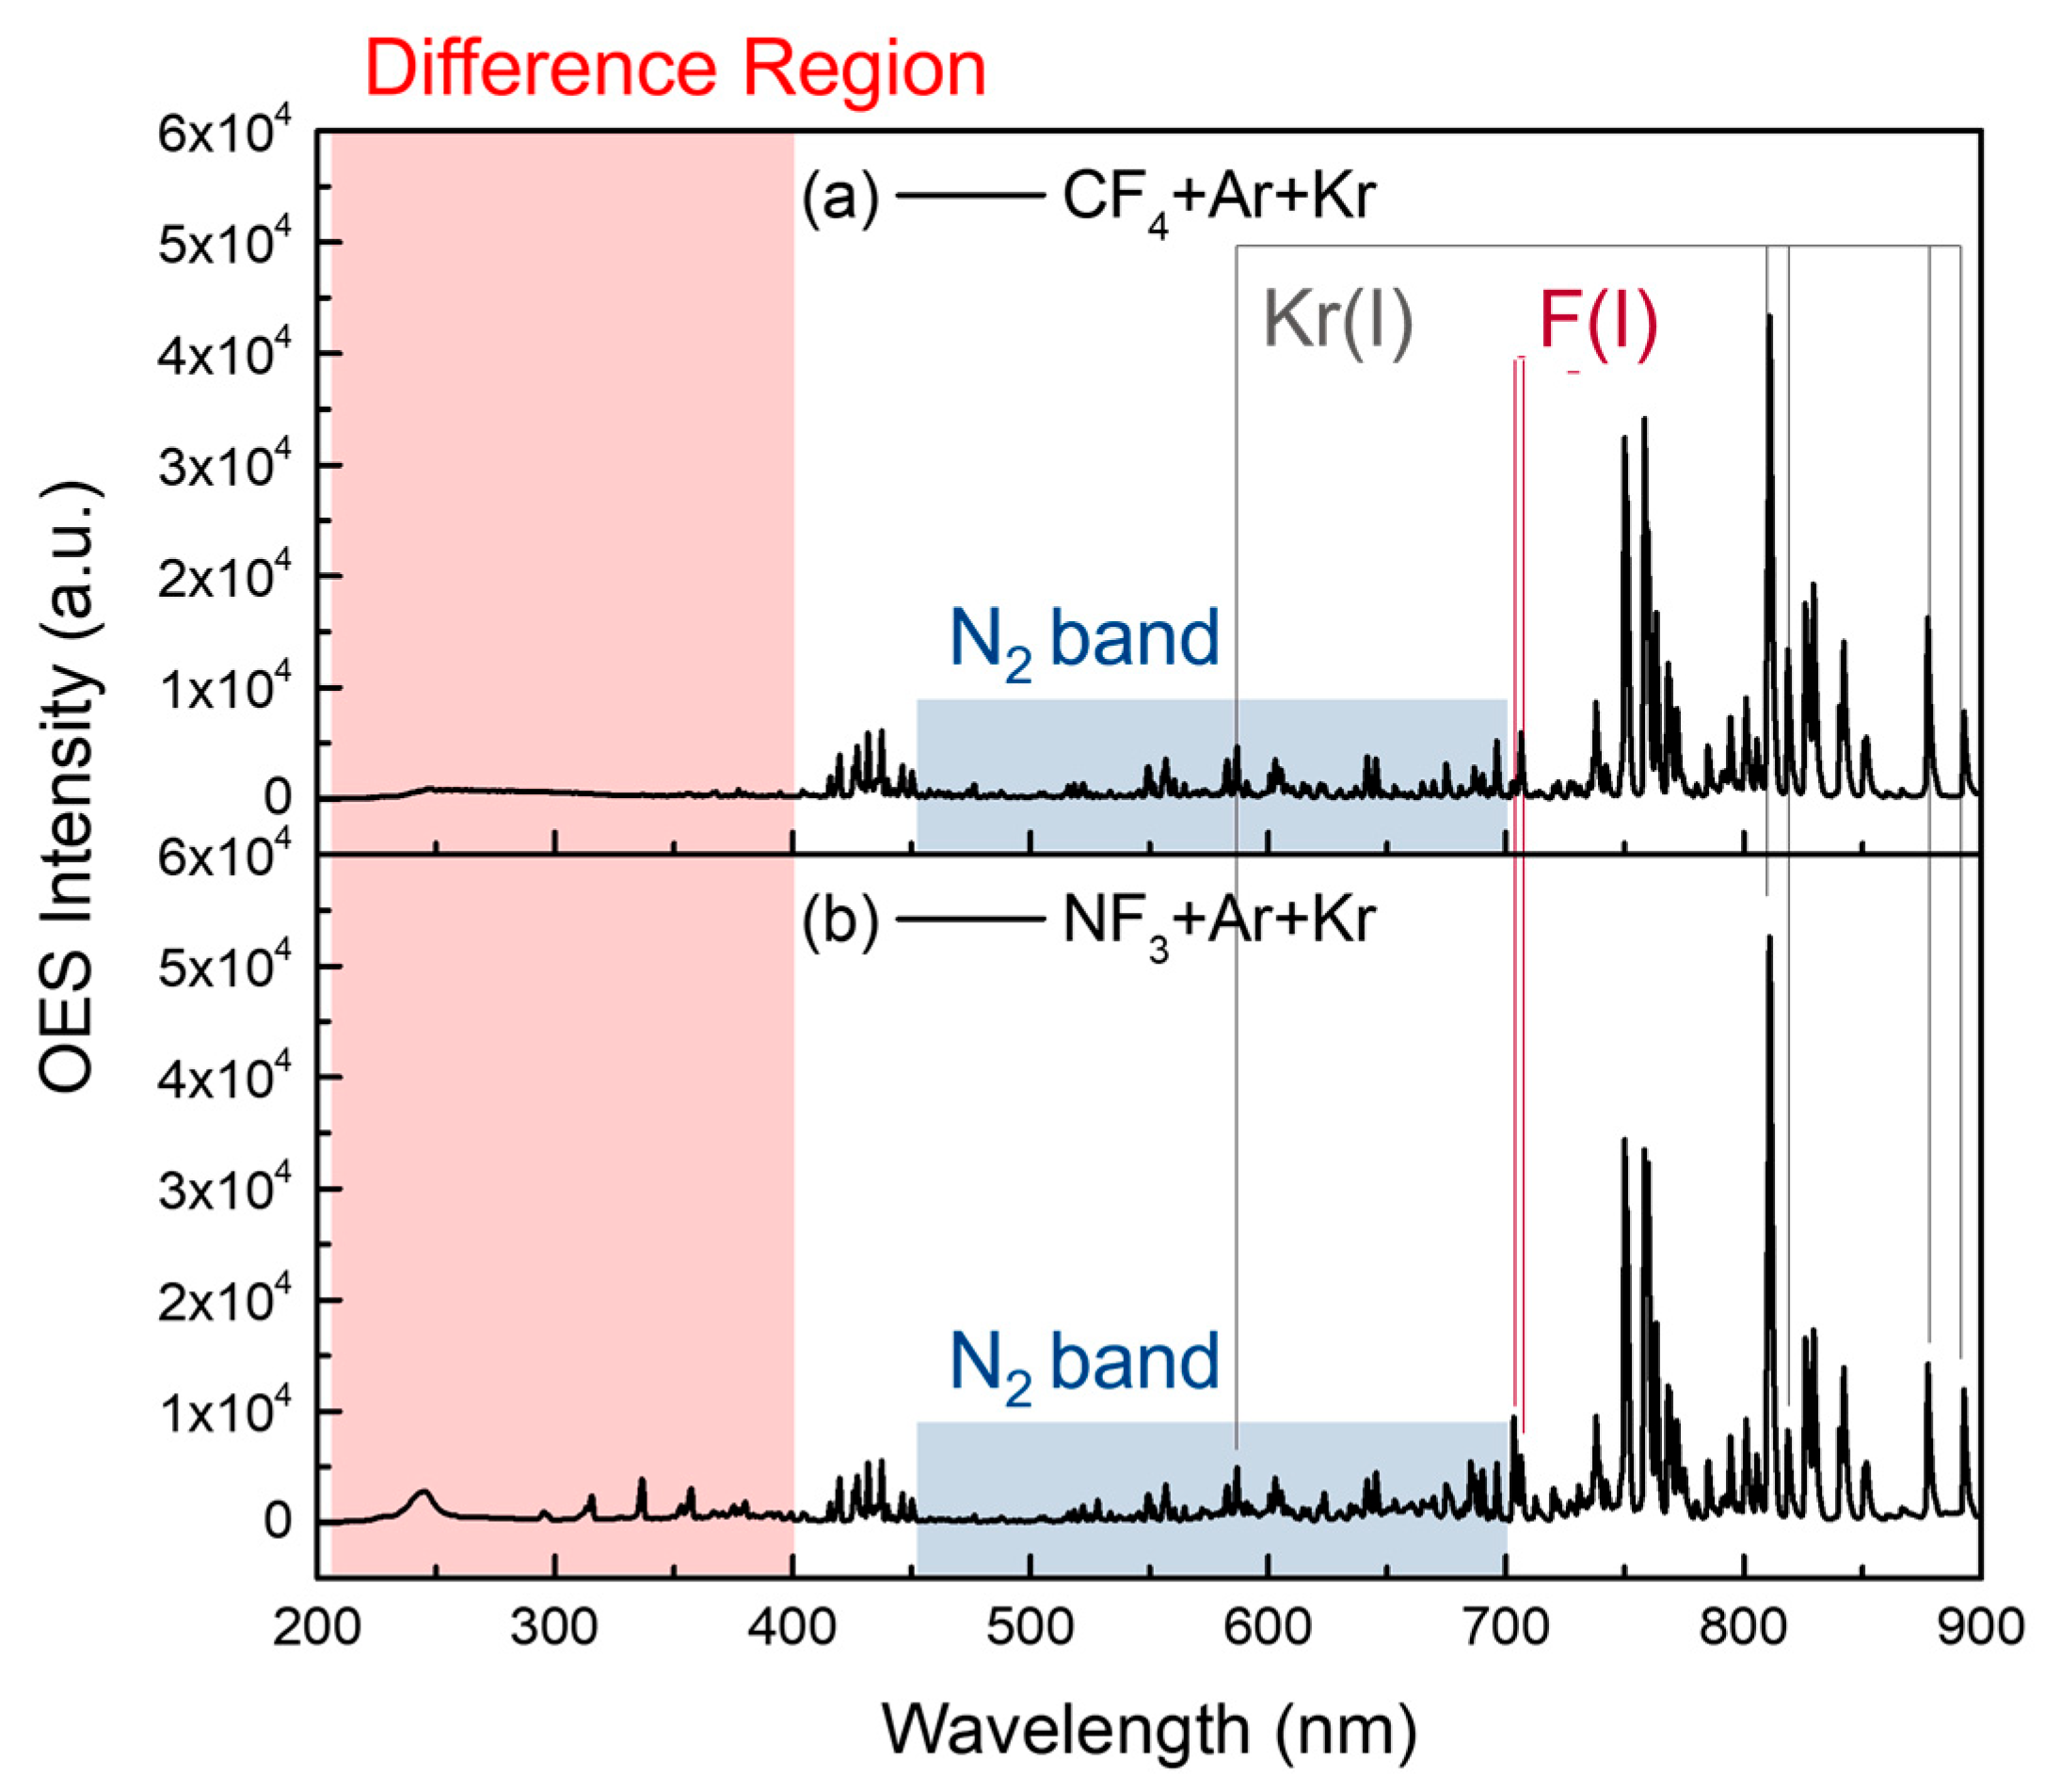
Before conducting the measurement, we identified the ionized species present in the chamber system using OES. The typical OES spectra are shown in Figure 3, where Figure 3a presents the OES spectrum for a mixture of CF4, Ar, and Kr gases, while Figure 3b shows the spectrum for a mixture of NF3, Ar, and Kr gases. These spectra provide insights into the species present in the system, with Kr gas serving as our primary reference for analysis. These bands confirm the stability and reliability of the measurement system.
Both spectra in Figure 3a,b exhibit peaks at the same wavelengths, specifically at 586, 810, 818, 877, and 892 nm, corresponding to Kr (I) bands [31]. However, distinct spectral differences appear in the 200–400 nm range, which corresponds to the emission features of CF4, and NF3 [27,28,29,30,31].
The presence of these peaks confirms the existence of dissociation products from CF4 and NF3 under plasma conditions. Fluorine containing species, such as CF3, CF2, CF, and F, are likely formed from CF4, whereas NF2, NF, and F arise from NF3 decomposition. The emission intensity of these fragments provides insight into the extent of gas dissociation and reaction dynamics within the plasma environment.
These results validate the feasibility of using OES spectra to monitor gas composition and dissociation behavior in the RIE chamber. By correlating these spectral features with RGA and FT-IR data, a more comprehensive understanding of plasma-induced decomposition mechanisms can be achieved.

3.2. Calibration of QMS and RGA

Before performing measurements using RIE with QMS, RGA, and FT-IR, it was necessary to calibrate QMS and RGA to ensure accuracy. Due to differences in detector positioning and response characteristics, calibration was required to correct for potential discrepancies and standardize measurement conditions. The calibration process focused on flow rate measurements, utilizing Kr and N2 gases as references. The initial chamber pressure was approximately 10−7 Torr before gas introduction and increased to around 10−5 Torr after introducing the gases.
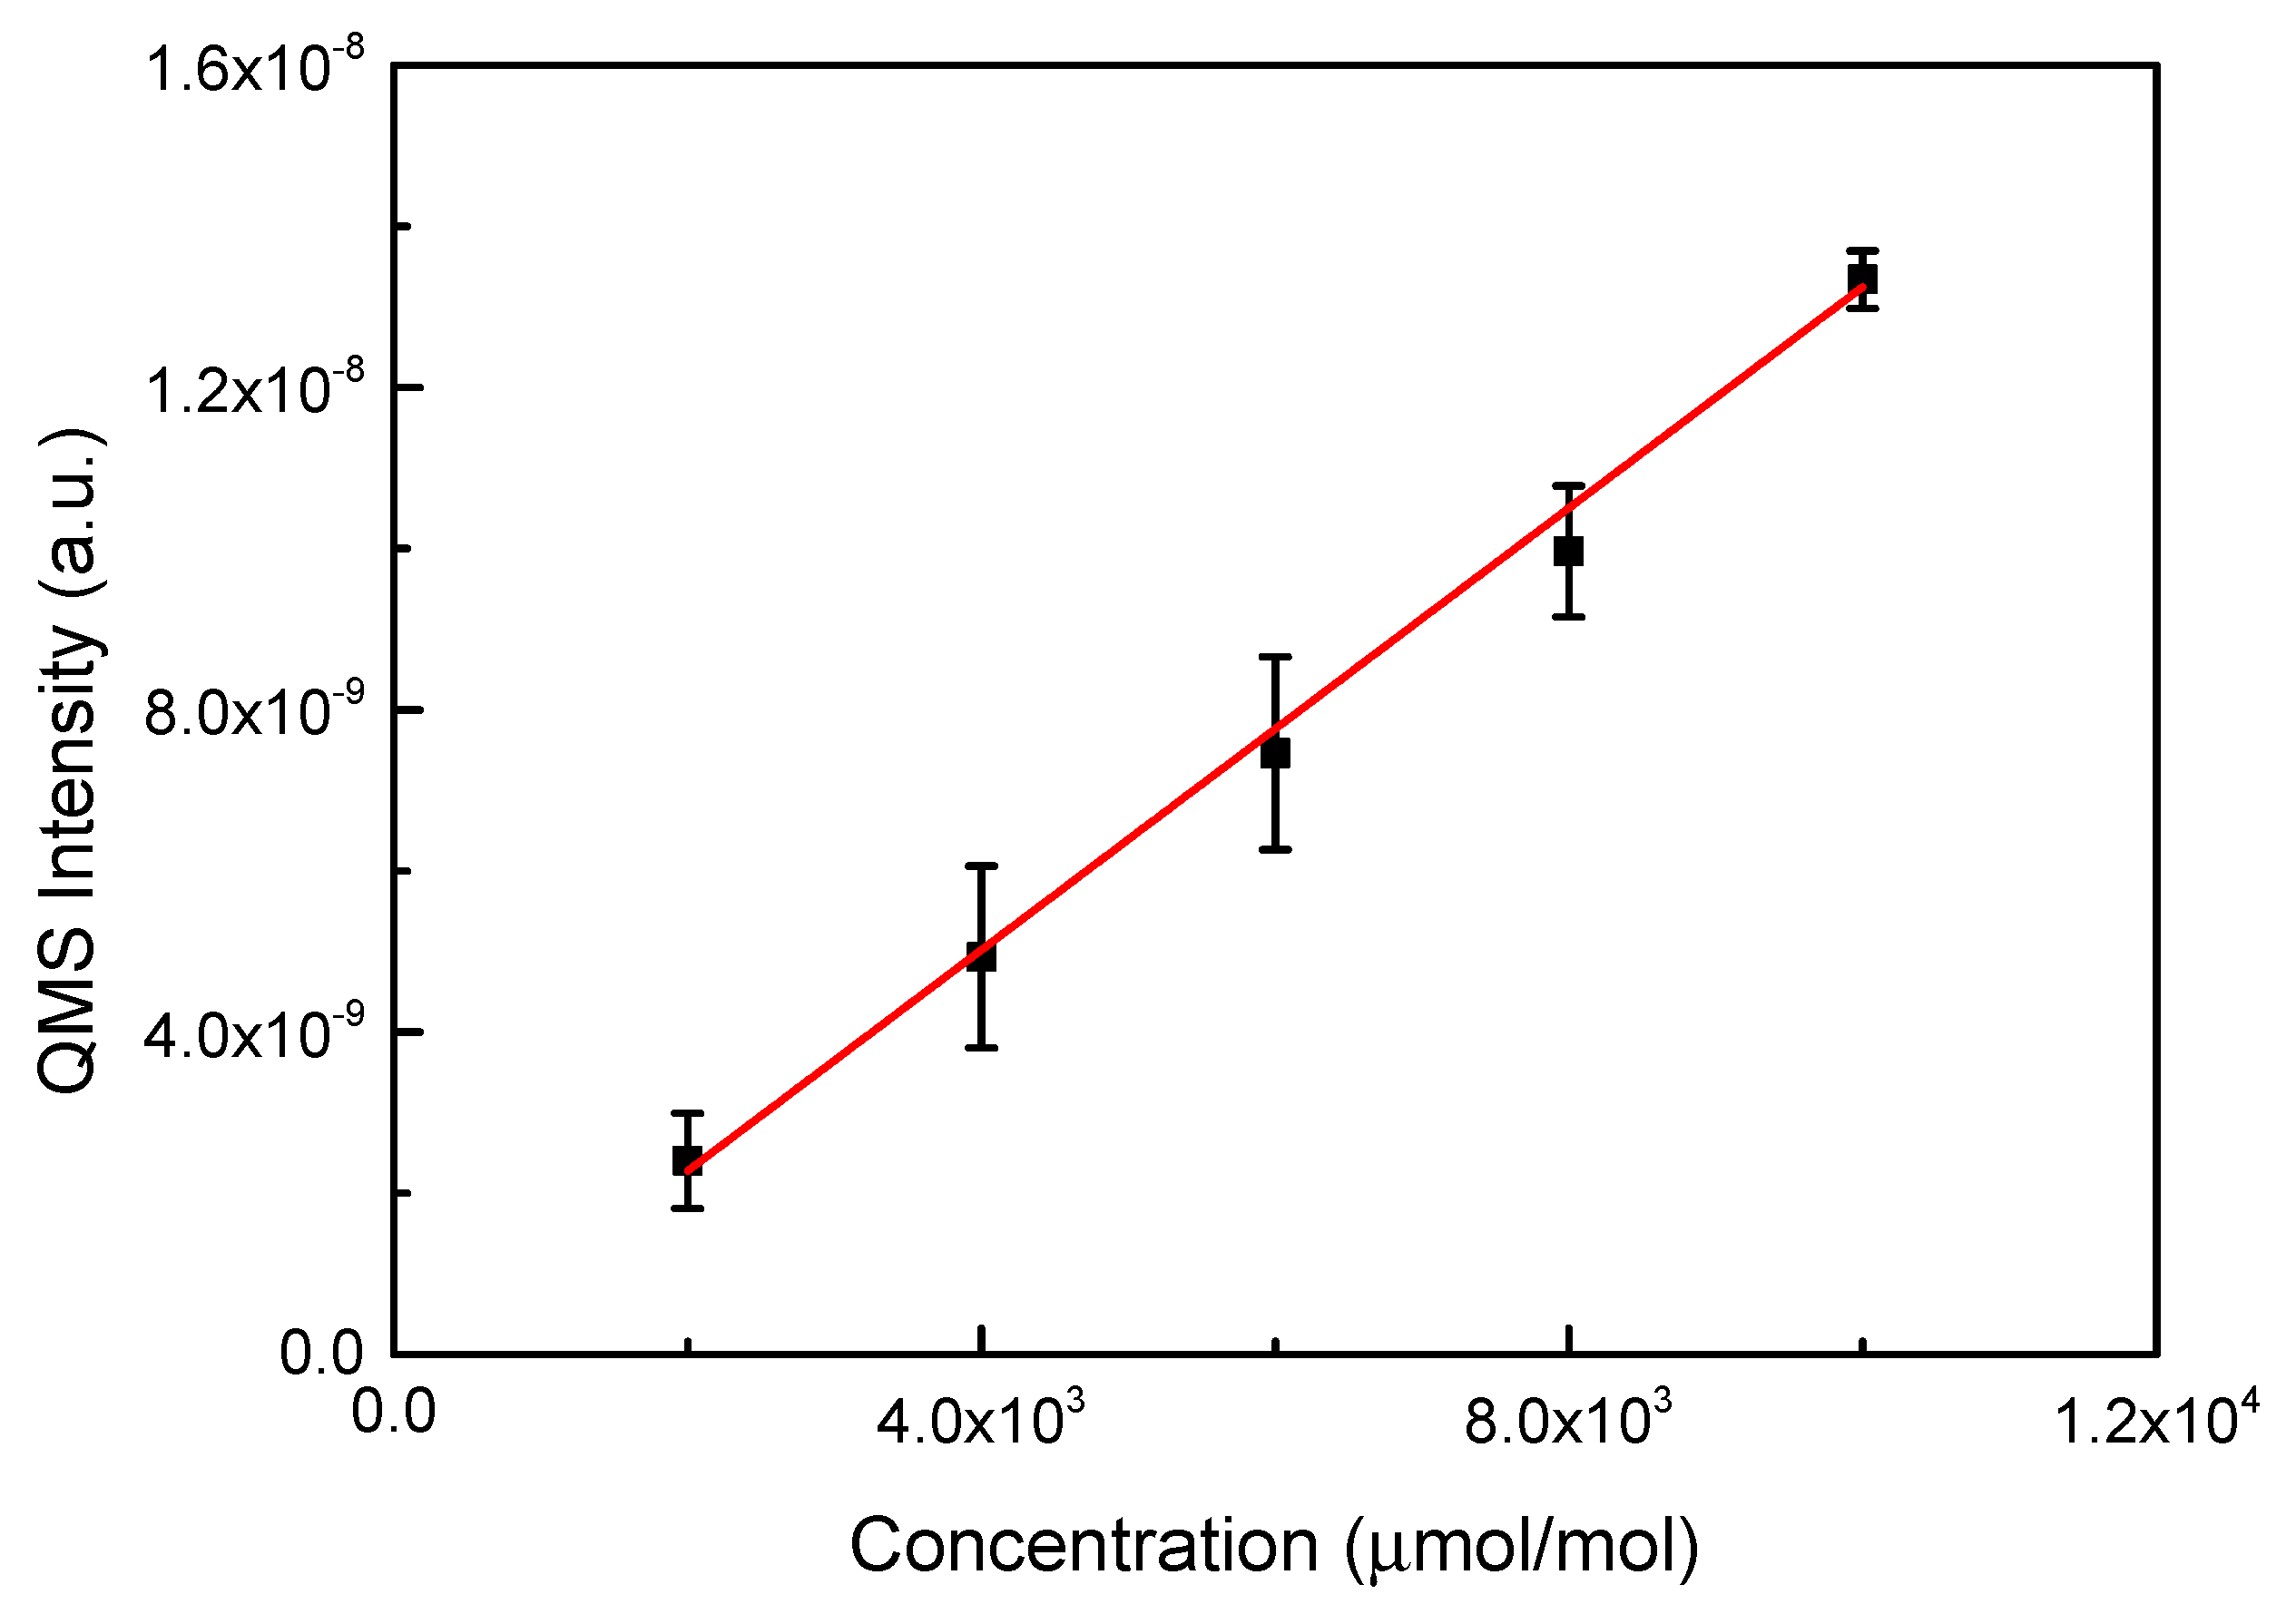
QMS calibration was conducted using Kr diluted in N2 at concentrations of 0.2, 0.4, 0.6, 0.8, and 1 × 10⁴ μmol/mol, as shown in Figure 4, yielding an R2 value of 0.99, indicating a strong correlation. Similarly, RGA calibration followed the same procedure, with calibration points at 2, 3, 5, 7, and 8 × 10⁵ μmol/mol, as illustrated in Figure 5, resulting in an R2 value of 0.97, confirming reliable calibration. These five-point calibration values were deemed acceptable for subsequent measurements.
The calibration process involved determining the relationship between RGA intensity and flow rate. The RGA intensities were measured and converted into concentrations using the calibration graph in Figure 5, with the corresponding values presented in Table 1. These concentration values were then used to estimate the flow rate through a proportional method. Given a pure Kr gas flow rate of 0.988 standard liters per minute (slm), the flow rate at a specific concentration (μmol/mol) was determined proportionally. For example, for 4 × 10⁵ μmol/mol, the flow rate was calculated as 0.988 × 0.4, resulting in 0.395 slm.
The total flow rate was influenced by both RGA and the DMP. The primary contributors to the total flow rate were these two components, making it essential to account for their combined effects. The total flow rate values, summarized in Table 1, were compared with those estimated QMS measurements. Since the QMS flow rate estimation followed the same approach as RGA, the corresponding values were also listed in Table 1. The results showed that the flow rate values obtained from RGA and QMS were nearly identical, indicating that detector positioning did not significantly impact the measurements. Furthermore, the error margins between RGA and QMS were quite small. This validation confirms the effectiveness of our calibration method, ensuring that subsequent gas concentration analyses would be reliable and reproducible.

3.3. Analysis of CF4

Upon introducing CF4 into the RIE chamber, it was decomposed by plasma [27,28,29,30,31], leading to the formation of various fragment species such as CF3, CF2, CF, and F, which were subsequently detected.
The primary objective of this study is to establish a correlation between RGA intensity and FT-IR measurements, specifically linking the gas concentration obtained from FT-IR with the corresponding RGA intensity. Establishing this correlation is essential for ensuring the accuracy and reliability of gas quantification in plasma processing environments.
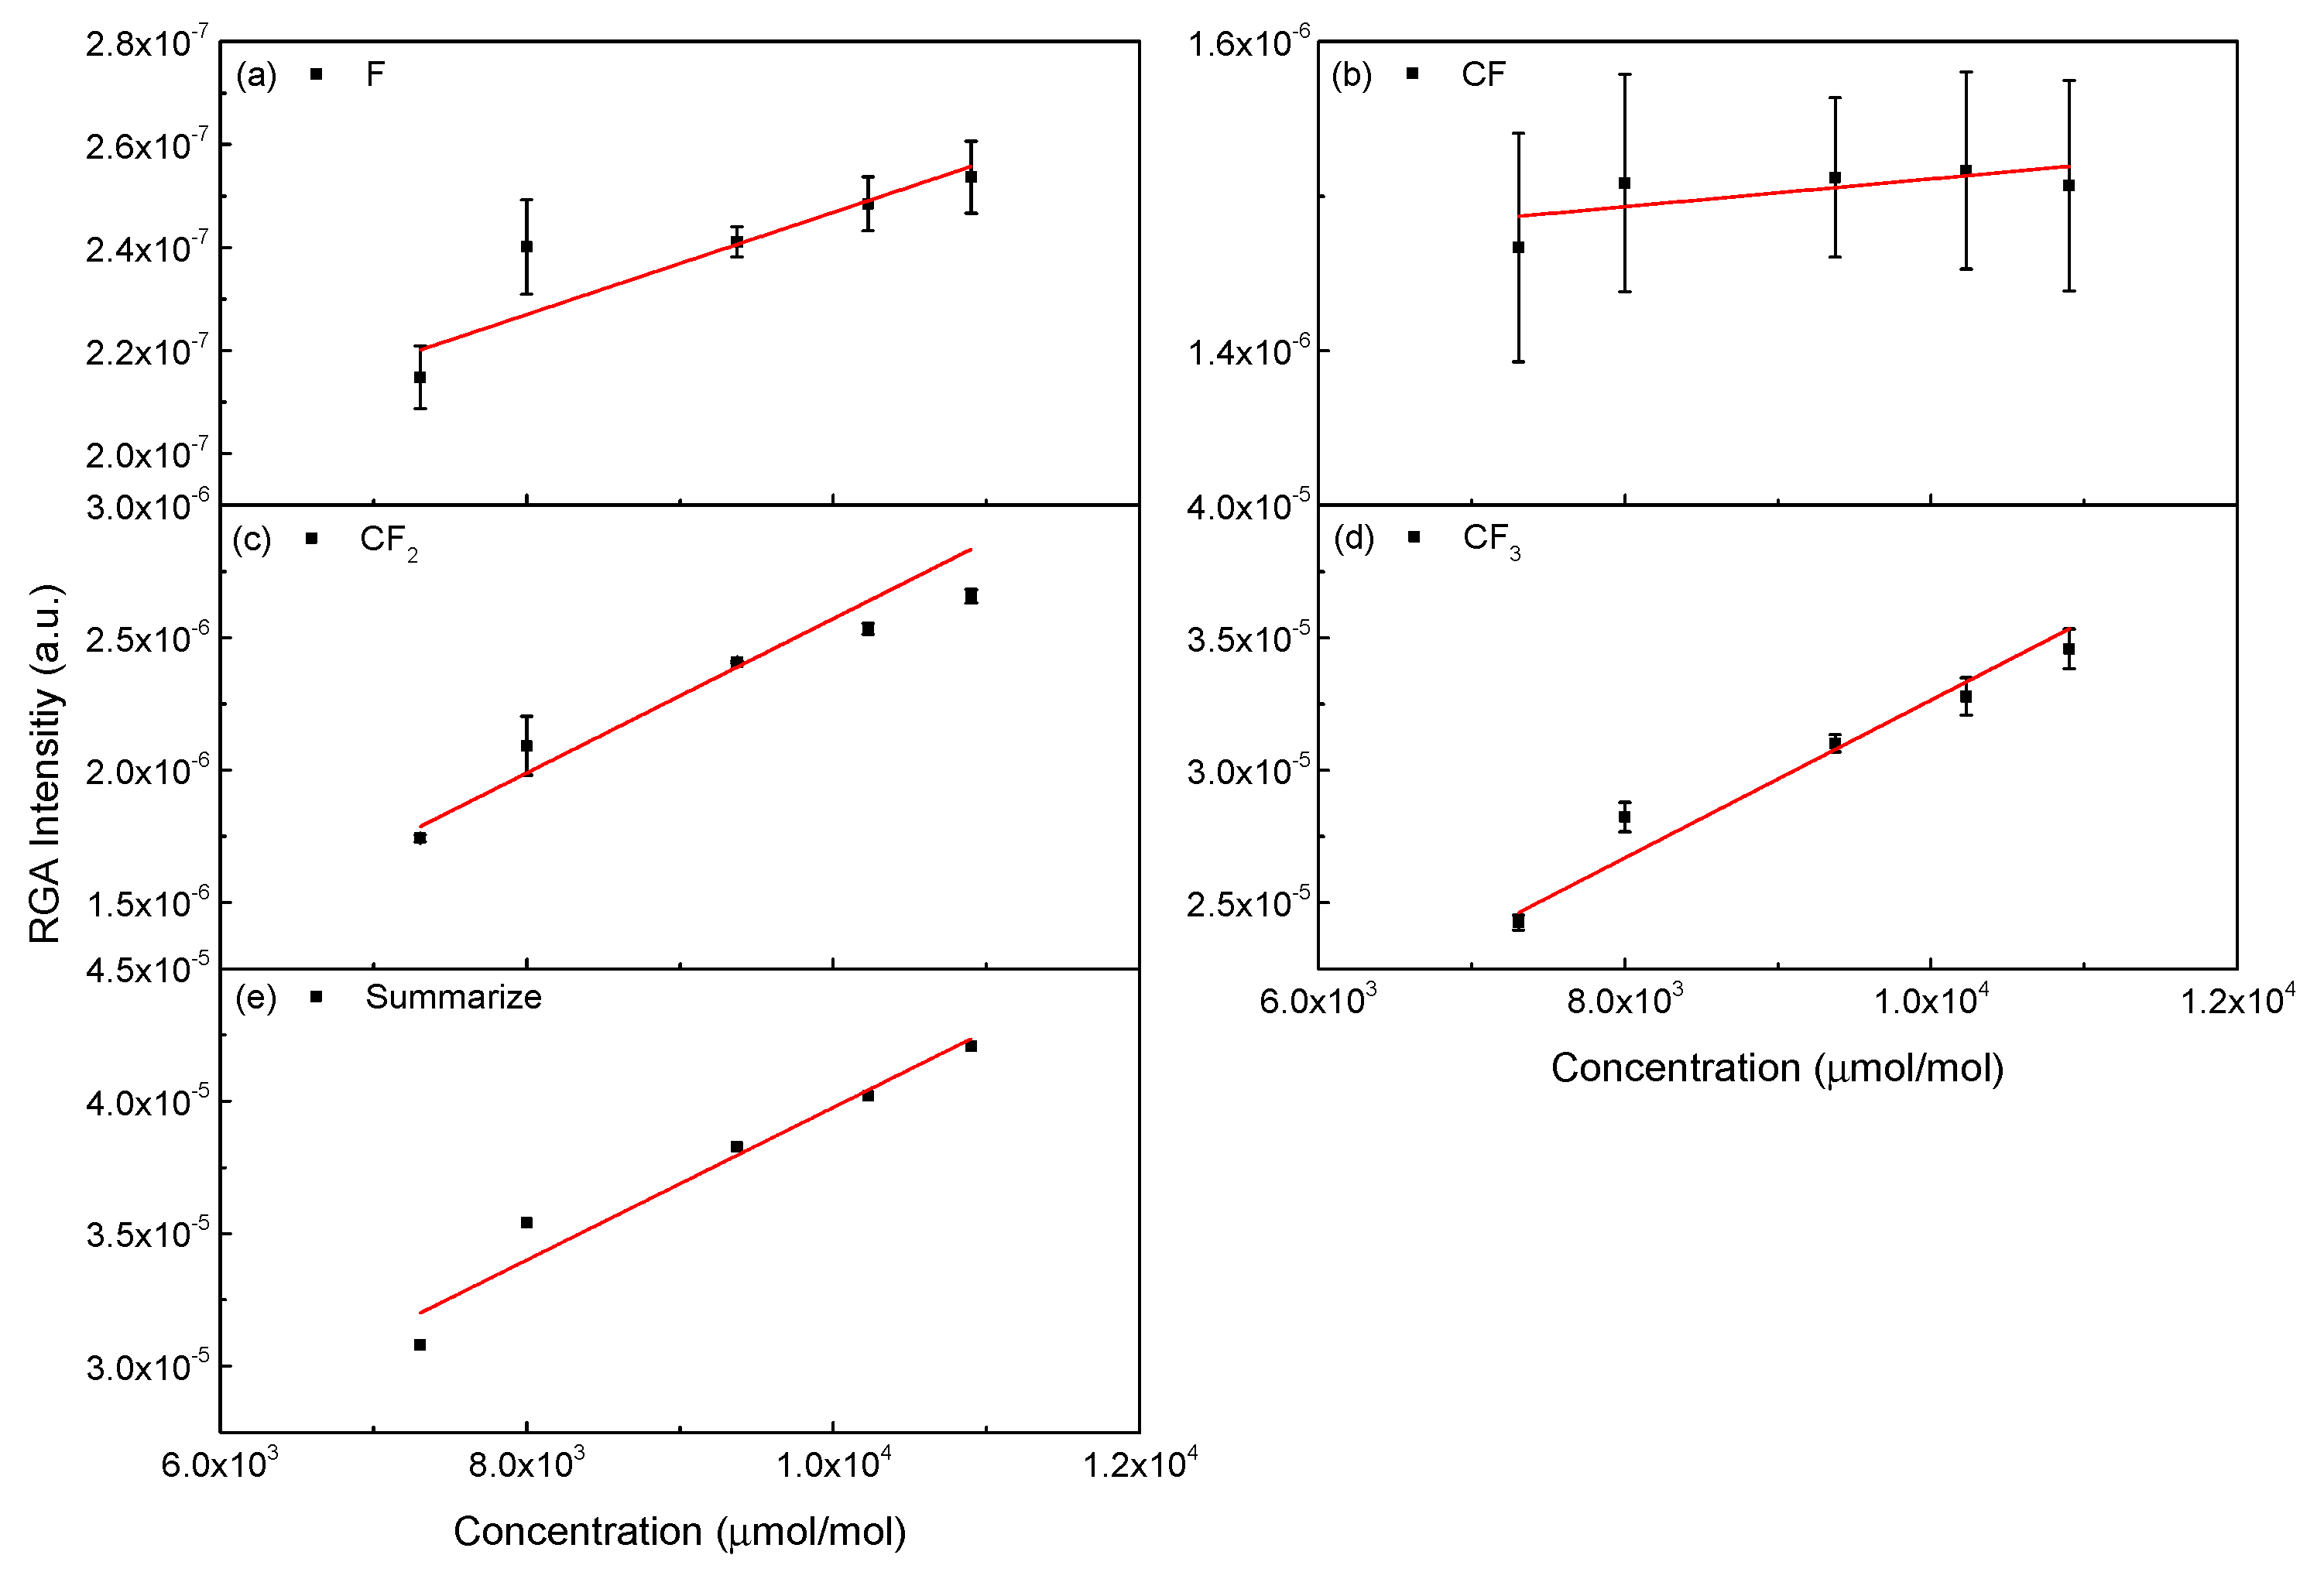
The fragment components of CF4, including CF3, CF2, CF, and F, under plasma-on conditions, are presented in Figure 6a–d, while Figure 6e illustrates the total contribution of all detected species. The graphs in Figure 6 exhibit a consistent trend. The obtained R2 values for all fragment species exceed 0.9, indicating a strong correlation and reliability of the measurement data. However, the deviation observed in the CF4 component suggests that its decomposition rate may be influenced by factors such as concentration, plasma power, or reaction kinetics. A higher CF4 concentration may result in a greater extent of dissociation, leading to non-linear behavior in its fragment component detection.
Similarly, Figure 7a–d presents the fragment components under plasma-off conditions, with Figure 7e illustrating the total sum of all detected components. Unlike the plasma-on condition, the trends and R2 values in the plasma-off state show noticeable differences. This discrepancy is likely due to the absence of plasma-induced dissociation, meaning that CF4 remains mostly intact without breaking into its fragment species. Despite these differences, the summation data in Figure 7 demonstrates a proportional increase in RGA intensity with increasing gas concentration. The R2 values for most components remain above 0.9, reinforcing the validity of our measurements even in the absence of plasma.
The five-point calibration method used in this study allows for a quantitative assessment of gas concentration based on RGA intensity. The obtained calibration curves provide a reliable framework for estimating unknown gas concentrations in the system. The strong correlation observed under plasma-on conditions suggests that our method effectively captures the dissociation and detection dynamics of CF4 and its fragments. While some discrepancies exist under plasma-off conditions, particularly for CF4 itself, our method still provides valuable insight into the relationship between RGA intensity and FT-IR-derived concentrations.
We attribute the large error to three factors. First, the calibration for the CF fragment is weak under plasma-off: in Figure 7b the regression gives R2 = 0.28, and the CF signal is relatively low compared with CF2 or CF3, so the CF fragment does not reliably track. Second, the RGA uses 70 eV electron impact ionization, which can dissociate CF4 in the ion source even without plasma, Thus, the CF channel includes in-source fragments. Third, the RGA and FT-IR sample at different positions, so spatial sampling differences can further contribute to the discrepancy.
The results indicate that our approach can be applied to monitoring and analyzing gas phase species in plasma-enhanced processes. The consistency of the calibration curves and high R2 values demonstrate the robustness of this method for industrial applications where precise gas quantification is required. Future studies may focus on optimizing the calibration process by incorporating additional correction factors for non-linear dissociation effects, improving the accuracy of CF4 detection under varying plasma conditions.

3.4. Analysis of NF3

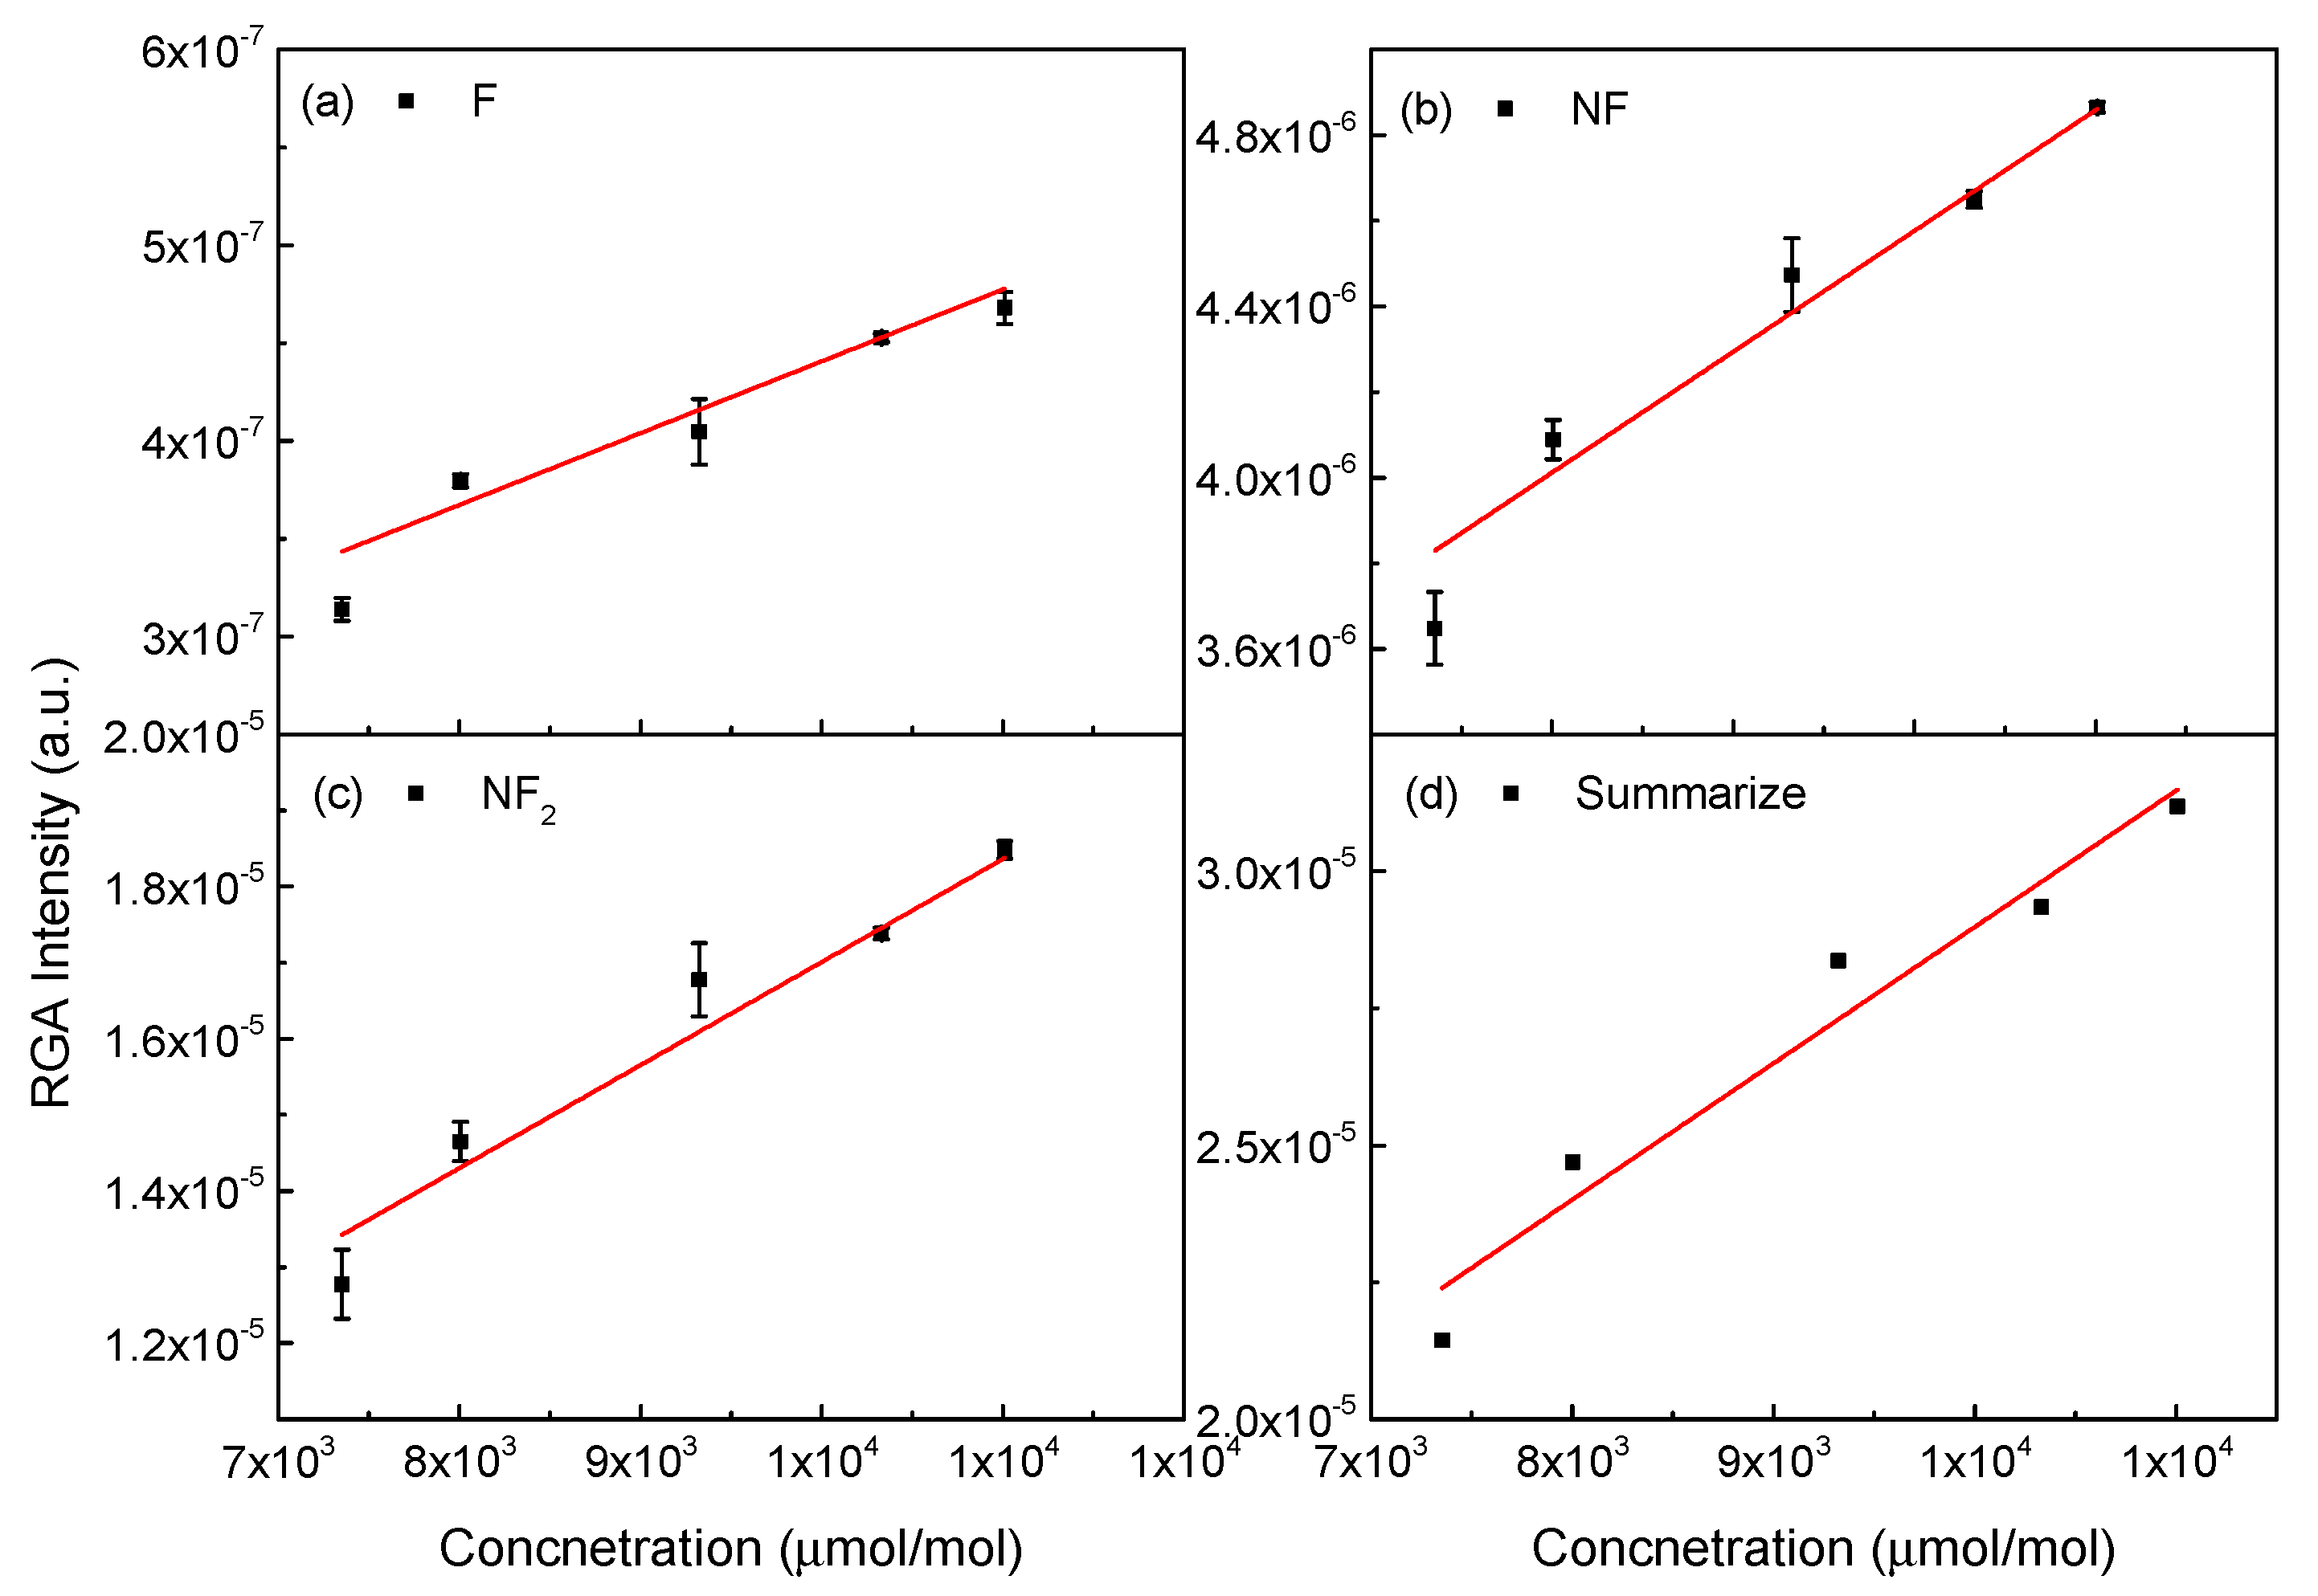
The analysis of NF3 followed the same procedure as that of CF4, with the goal of establishing a correlation between RGA intensity and FT-IR measurements to quantify gas concentration accurately. The fragment components of NF3, including NF2, NF, and F, under plasma-on conditions, are shown in Figure 8a–c, with Figure 8d presenting the total summation of all components derived from NF3. The data exhibit a consistent trend where an increase in NF3 concentration corresponds to an increase in RGA intensity. The obtained R2 values for all fragment species exceed 0.9, except for Figure 8a, further confirming the reliability of the measurement data. Moreover, Figure 8a also represents almost 0.9 of R2 value. This result suggests that our method effectively captures the dissociation behavior of NF3 and the corresponding detection of its fragment species.
The decomposition of NF3 under plasma conditions follows a well-known pathway where it breaks down into NF2, NF, and F radicals, which are then detected by RGA and FT-IR. The high correlation between FT-IR and RGA measurements indicates that our calibration process was successful in quantifying NF3 dissociation and its resulting species.
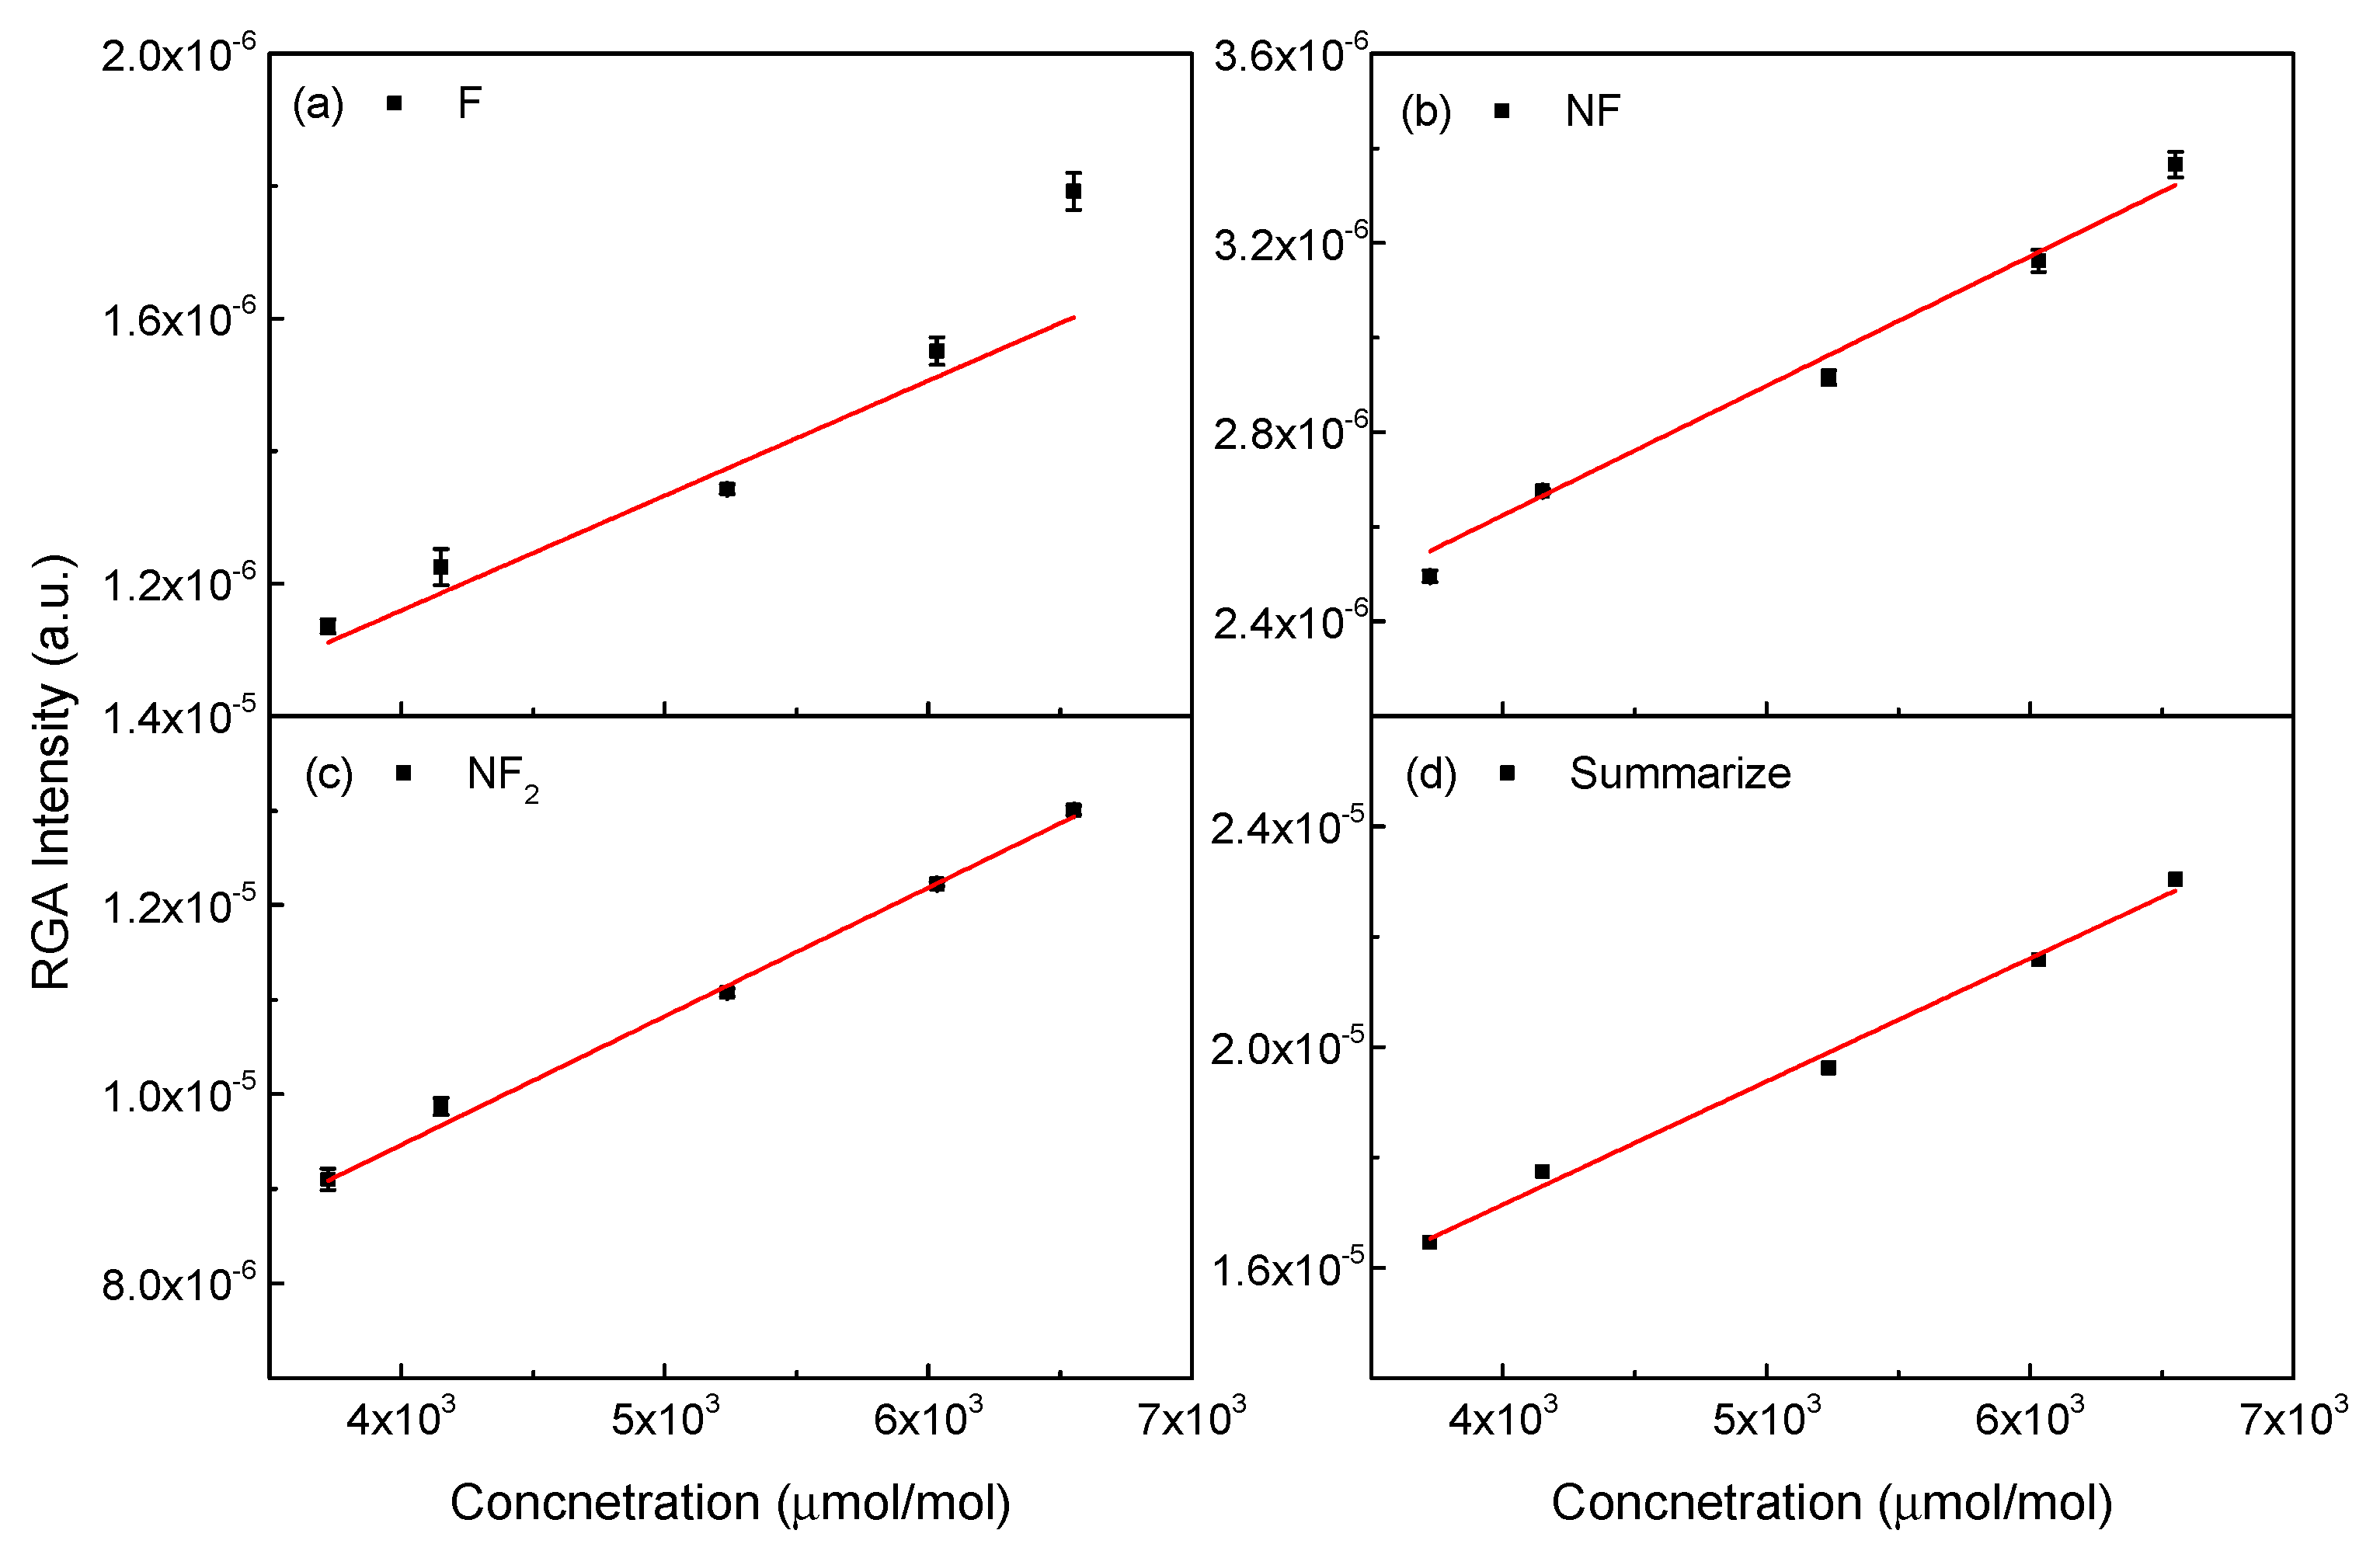
Additionally, the five-point calibration graphs under plasma-off conditions, presented in Figure 9, display a similar trend where increasing NF3 concentration results in higher RGA intensity. The consistency between the plasma-on and plasma-off conditions suggests that NF3 remains relatively stable in the absence of plasma, unlike CF4, which exhibited greater discrepancies in its undissociated state. This finding reinforces the applicability of our method for quantifying NF3 under varying conditions.
The results confirm that NF3 analysis using this method is valid and reliable, demonstrating that our approach can be used to monitor NF3 concentration with high accuracy. The high R2 values obtained across multiple conditions highlight the robustness of the calibration model. Future improvements may focus on refining the calibration process to minimize deviations in summation data and investigating potential secondary reactions that could influence NF3 fragmentation patterns. Nonetheless, the current methodology offers a practical and effective means for analyzing NF3 decomposition and concentration estimation in plasma environments.

3.5. Estimate Method for Concentraion

The calibration graphs presented in Figure 6, Figure 7, Figure 8 and Figure 9 were utilized to estimate gas concentrations by applying RGA intensities to the calibration curves. The estimated concentrations derived from this method were then compared with the measured FT-IR values to evaluate the accuracy of the approach. The estimated concentrations for CF4 under plasma-on conditions are summarized in Table 2, Table 3, Table 4 and Table 5. The majority of values fall within an acceptable range, with errors remaining below 10%, which validates the reliability of the method. Despite its simplicity, this approach provides a reasonable approximation of gas concentrations in plasma environments.
For CF4 under plasma-off conditions, the estimated concentrations are listed in Table 6, Table 7, Table 8 and Table 9. In this case, the error margin is larger than that observed in the plasma-on condition, likely due to the absence of plasma-induced dissociation, leading to lower signal consistency. However, while the absolute values may exhibit discrepancies, the general trend remains consistent, indicating that this approach still provides meaningful insights into the concentration dynamics of CF4 in non-plasma environments.
To further assess the applicability of this method, Table 10, Table 11 and Table 12 presents the estimated concentrations for NF3 under plasma-on conditions. Similarly to CF4, most values exhibit errors below 10%, reinforcing the validity of the approach for NF3 concentration estimation. The strong correlation between the estimated and measured values suggests that the RGA-based estimation method remains reliable when plasma-driven dissociation occurs.
The estimated concentrations for NF3 under plasma-off conditions, presented in Table 13, Table 14 and Table 15, also demonstrate errors below 10%, further supporting the robustness of this technique. The high consistency between estimated and measured values under both plasma-on and plasma-off conditions for NF3 suggests that the gas remains relatively stable compared to CF4, which exhibited larger deviations in its undissociated state.
Overall, our estimation method effectively captures the general trend of gas concentration variations and provides a practical means of estimating gas levels without requiring additional complex measurement techniques. While this method is relatively crude and may not achieve absolute precision, it offers a straightforward and efficient approach for obtaining concentration estimates. By validating this approach against FT-IR measurements, we confirm its suitability for both qualitative and quantitative analysis, demonstrating its potential utility in industrial applications where real-time gas monitoring is essential. Future refinements, such as optimizing calibration accuracy and accounting for secondary gas phase reactions, may further enhance the precision and applicability of this method.

4. Conclusions

In this study, we proposed a simple yet effective method for analyzing plasma gases, focusing on CF4 and NF3, which are widely used in industrial applications and contribute significantly to GWP. Our goal was to establish a straightforward approach that provides reliable and practical results for gas analysis. Accordingly, the method shows acceptable precision for NF3 under both plasma-on and plasma-off conditions and for CF4 under plasma-on conditions. CF4 under plasma-off conditions shows poor agreement and is outside the current applicability domain.
To validate our approach, we conducted four key steps. First, we identified the species present in the plasma using OES. The OES spectra confirmed the presence of NF3 and CF4, along with Ar and Kr from the gas mixtures. Among these, Kr played a crucial role in our system as it was used for flow rate calibration.
Second, we performed calibration of both flow rate and signal intensity to account for positional differences between the RGA and FT-IR detectors. This step was essential to ensure an accurate correlation between the two measurement techniques.
Third, we conducted experimental analyses of CF4 and NF3 using RGA and FT-IR, where five-point calibration graphs were used to establish a relationship between RGA intensity and FT-IR measurements. This allowed us to quantify the concentration of gases based on RGA intensity.
Finally, we applied the five-point calibration method to determine the concentration of unknown gas samples. The estimated concentrations were compared with FT-IR measurements, showing good agreement under plasma-on conditions, which confirmed the validity of our approach. However, for CF4 under plasma-off conditions, significant discrepancies were observed, suggesting that further refinement may be necessary.
Our study also confirmed that the emission quantities of process gases calculated using the existing RGA and OES system were in close agreement with values obtained through direct measurement equipment. However, the current monitoring system predicts CF4 concentration based on the intensity of decomposed fragments such as CF3, CF2, CF, and F. This approach is more suitable for single-component gas monitoring and poses challenges when applied to mixed gas environments. Therefore, for future applications in the semiconductor and display industries, the development of an infrared-based sensor system may be necessary to improve the monitoring of complex gas mixtures.
While our method is relatively simple, it provides a practical, efficient, and accessible approach for plasma gas analysis. The results under plasma-on conditions demonstrated strong accuracy, whereas the discrepancies observed in CF4 under plasma-off conditions highlight areas for potential improvement. Nevertheless, this method serves as a valuable tool for estimating gas concentrations and understanding the correlation between RGA intensity and gas composition, contributing to the advancement of real-time gas monitoring in industrial applications.

Author Contributions

Conceptualization, S.-H.P., D.-H.G. and B.-J.L.; Data curation, B.G.J.; Formal analysis, S.-H.P. and D.-H.G.; Data acquisition, S.-H.P. and D.-H.G.; Writing—original draft, B.G.J.; Supervision, B.-J.L. All authors have read and agreed to the published version of the manuscript.

Funding

This research was supported by the Carbon Neutrality Core Technology Development Program (2410010398) and the Materials and Components Technology Development Program (2410011150) funded by the Ministry of Trade, Industry & Energy (MOTIE, Korea).

Data Availability Statement

The data presented in this study are available on request from the corresponding author.

Acknowledgments

Special thanks to Gi-Chung Kwon at Kwangwoon University for providing us with the time to use the chamber system.

Conflicts of Interest

The authors declare no conflicts of interest.

Abbreviations

The following abbreviations are used in this manuscript:
GWPGlobal Warming Potential
RGAResidual Gas Analyzer
OESOptical Emission Spectroscopy
QMSQuadrupole Mass Spectrometer
FT-IRFourier-Transform Infrared spectroscopy
EPAU.S. Environmental Protection Agency
IPCCIntergovernmental Panel on Climate Change
GHGGreenhouse Gases
RIEReactive Ion Etching
TPTurbomolecular Pump
CCDCharge-Coupled Device Array Detector
DMPDry Mechanical Pump

References

  1. Dorn, H.P.; Brandenburger, U.; Brauers, T.; Hausmann, M.; Ehhalt, D.H. In-Situ Detection of Tropospheric OH Radicals by Folded Long-Path Laser Absorption. Results from the POPCORN Field Campaign in August 1994. Geophys. Res. Lett. 1996, 23, 2537–2540. [Google Scholar] [CrossRef]
  2. Heard, D.E.; Pilling, M.J. Measurement of OH and HO2 in the Troposphere. Chem. Rev. 2003, 103, 5163–5198. [Google Scholar] [CrossRef]
  3. Holland, F.; Hessling, M.; Hofzumahaus, A. In Situ Measurement of Tropospheric OH Radicals by Laser-Induced Fluorescence. J. Atmos. Sci. 1995, 52, 3393–3401. [Google Scholar] [CrossRef]
  4. Rigby, M.; Prinn, R.G.; O’doherty, S.; Montzka, S.A.; Mcculloch, A.; Harth, C.M.; Uhle, J.M.; Salameh, P.K.; Weiss, R.F.; Young, D.; et al. Re-Evaluation of the Lifetimes of the Major CFCs and CH3CCl3 Using Atmospheric Trends. Atmos. Chem. Phys. 2013, 13, 2691–2702. [Google Scholar] [CrossRef]
  5. Takahashi, K.; Matsumi, Y.; Wallington, T.J.; Hurley, M.D.; Takahashi, C.; Matsumi, Y.; Wallington, T.J.; Hurley, M.D. Atmospheric Chemistry of CF3CFHOCF3: Reaction with OH Radicals, Atmospheric Lifetime, and Global Warming Potential. J. Geophys. Res. Atmos. 2002, 107, 4574. [Google Scholar] [CrossRef]
  6. Kiefer, J.; Zhou, B.; Zetterberg, J.; Li, Z.; Alden, M. Laser-Induced Fluorescence Detection of Hot Molecular Oxygen in Flames Using an Alexandrite Laser. Appl. Spectrosc. 2014, 68, 1266–1273. [Google Scholar] [CrossRef]
  7. Orkin, V.L.; Huie, R.E.; Kurylo, M.J. Atmospheric Lifetimes of Hfc-143a and Hfc-245fa: Flash Photolysis Resonance Fluorescence Measurements of the Oh Reaction Rate Constants. J. Phys. Chem. 1996, 100, 8907–8912. [Google Scholar] [CrossRef]
  8. Prinn, R.G.; Rasmussen, R.A.; Simmonds, P.G.; Alyea, F.N.; Cunnold, D.M.; Lane, B.C.; Cardelino, C.A.; Crawford, A.J. The Atmospheric Lifetime Experiment: 5. Results for CH3CCl3 Based on Three Years of Data. J. Geophys. Res. Ocean. 1983, 88, 8415–8426. [Google Scholar] [CrossRef]
  9. Kurylo, M.J.; Orkin, V.L. Determination of Atmospheric Lifetimes via the Measurement of OH Radical Kinetics. Chem. Rev. 2003, 103, 5049–5076. [Google Scholar] [CrossRef]
  10. Vaghjiani, G.L.; Ravishankara, A.R. Kinetics and Mechanism of OH Reaction with CH3OOH. J. Phys. Chem. 1989, 93, 1948–1959. [Google Scholar] [CrossRef]
  11. Fisher, D.A.; Hales, C.H.; Wang, W.C.; Ko, M.K.W.; Sze, N.D. Model Calculations of the Relative Effects of CFCs and Their Replacements on Global Warming. Nature 1990, 344, 513–516. [Google Scholar] [CrossRef]
  12. Roehl, C.M.; Boglu, D.; Brühl, C.; Moortgat, G.K. Infrared Band Intensities and Global Warming Potentials of CF4, C2F6, C3F8, C4F10, C5F12, and C6F14. Geophys. Res. Lett. 1995, 22, 815–818. [Google Scholar] [CrossRef]
  13. Wallington, T.J.; Schneider, W.F.; Sehested, J.; Bilde, M.; Platz, J.; Nielsen, O.J.; Christensen, L.K.; Molina, M.J.; Molina, L.T.; Wooldridge, P.W. Atmospheric Chemistry of HFE-7100 (C4F9OCH3): Reaction with OH Radicals, UV Spectra and Kinetic Data for C4F9OCH2 and C4F9OCH2O2 Radicals, and the Atmospheric Fate of C4F9OCH2O Radicals. J. Phys. Chem. A 1997, 101, 8264–8274. [Google Scholar] [CrossRef]
  14. Orkin, V.L.; Guschin, A.G.; Larin, I.K.; Huie, R.E.; Kurylo, M.J. Measurements of the Infrared Absorption Cross-Sections of Haloalkanes and Their Use in a Simplified Calculational Approach for Estimating Direct Global Warming Potentials. J. Photochem. Photobiol. A Chem. 2003, 157, 211–222. [Google Scholar] [CrossRef]
  15. Climate Change: The IPCC 1990 and 1992 Assessments—IPCC. Available online: https://www.ipcc.ch/report/climate-change-the-ipcc-1990-and-1992-assessments/ (accessed on 24 January 2025).
  16. Godal, O.; Fuglestvedt, J. Testing 100-Year Global Warming Potentials: Impacts on Compliance Costs and Abatement Profile. Clim. Change 2002, 52, 93–127. [Google Scholar] [CrossRef]
  17. Prather, M.J. Time Scales in Atmospheric Chemistry: Theory, GWPs for CH4 and CO, and Runaway Growth. Geophys. Res. Lett. 1996, 23, 2597–2600. [Google Scholar] [CrossRef]
  18. SAR Climate Change 1995: Synthesis Report—IPCC. Available online: https://www.ipcc.ch/report/ar2/syr/ (accessed on 24 January 2025).
  19. TAR Climate Change 2001: Synthesis Report—IPCC. Available online: https://www.ipcc.ch/report/ar3/syr/ (accessed on 24 January 2025).
  20. AR4 Climate Change 2007: Synthesis Report—IPCC. Available online: https://www.ipcc.ch/report/ar4/syr/ (accessed on 24 January 2025).
  21. AR5 Synthesis Report: Climate Change 2014—IPCC. Available online: https://www.ipcc.ch/report/ar5/syr/ (accessed on 24 January 2025).
  22. AR6 Synthesis Report: Climate Change 2023—IPCC. Available online: https://www.ipcc.ch/report/sixth-assessment-report-cycle/ (accessed on 24 January 2025).
  23. Lee, B.J.; Yun, S.Y.; Jeong, I.K.; Hwang, Y.; Park, J.H.; Kim, J. Improving the Measurement of Characteristic Parameters for the Determination of GHG Emissions in the Semiconductor and Display Industries in Korea. Appl. Sci. 2023, 13, 8834. [Google Scholar] [CrossRef]
  24. Lee, B.J.; Hwang, Y.; Jo, D.K.; Jeong, J.; Li, P.; Wang, L.; Lu, J.; Lee, B.J.; Hwang, Y.; Jo, D.K.; et al. A Study on Greenhouse Gas (PFCs) Reduction in Plasma Scrubbers to Realize Carbon Neutrality of Semiconductors and Displays. Atmosphere 2023, 14, 1220. [Google Scholar] [CrossRef]
  25. Kwon, H.T.; Kim, W.J.; Shin, G.W.; Lee, H.H.; Lee, T.H.; Kang, M.H.; Kwon, G.C. Plasma Etching of Silicon at a High Flow and a High Pressure of NF3 in Reactive Ion Etching. J. Korean Phys. Soc. 2019, 74, 1135–1139. [Google Scholar] [CrossRef]
  26. Barnes, R.M.; Jacksier, T. Atomic Emission Spectra of Xenon, Krypton, and Neon: Spectra from 200 to 900 Nm by Sealed Inductively Coupled Plasma/Atomic Emission Spectroscopy. Appl. Spectrosc. 1994, 48, 65–71. [Google Scholar] [CrossRef]
  27. Shabushnig, J.G.; Demko, P.R.; Savage, R.N. Applications of optical emission spectroscopy to semiconductor processing. Mater. Res. Soc. Symp. Proc. 1985, 38, 77–84. [Google Scholar] [CrossRef]
  28. Motohashi, K.; Takahashi, T.; Takahashi, N.; Tsurubuchi, S. Emission Cross Sections in Low-Energy Collisions between He+, Ne+ Ions and CF4 Molecule. J. Phys. B At. Mol. Opt. Phys. 2005, 38, 3339–3348. [Google Scholar] [CrossRef]
  29. Jin, H.; Tang, C.; Zheng, N.; Den, W.; Chen, X. Investigation of the Chemical Composition and Atomic Emission Spectroscopy of Fused Silica in CF4 Plasma Processing. In Selected Papers of the Chinese Society for Optical Engineering; SPIE: Bellingham, WA, USA, 2017; Volume 10255, p. 102551. [Google Scholar] [CrossRef]
  30. Liu, W.; Zhu, A.; Li, X.; Zhao, G.; Lu, W.; Xu, Y.; Wang, Y. Determination of Plasma Parameters in a Dual-Frequency Capacitively Coupled Cf4 Plasma Using Optical Emission Spectroscopy. Plasma Sci. Technol. 2013, 15, 885–890. [Google Scholar] [CrossRef]
  31. An, S.; Hong, S.J. Spectroscopic Analysis of NF3 Plasmas with Oxygen Additive for PECVD Chamber Cleaning. Coatings 2023, 13, 91. [Google Scholar] [CrossRef]
Figure 1. The example FT-IR spectra of CF4.
Metrology 05 00060 g001
Figure 2. The CF4 calibration graph measured at five points: 4020, 8040, 12,060, 16,080, and 20,100 μmol/mol. The R2 value is 0.99. The black dot describes the point of data, blue line describes the error bar, and red line describes the linear fit graph.
Metrology 05 00060 g002
Figure 3. The OES spectra of gas mixtures: (a) CF4/Ar/Kr mixture (b) NF3/Ar/Kr mixture. The red region describes the difference between two gas mixtures, whereas the blue region describes the N2 band.
Metrology 05 00060 g003
Figure 4. The QMS calibration graph measured at five points: 0.2, 0.4, 0.6, 0.8, and 1 × 10⁴ μmol/mol. The R2 value is 0.99.
Metrology 05 00060 g004
Figure 5. The RGA calibration graph measured at five points: 2, 3, 5, 7, and 8 × 10⁵ μmol/mol. The R2 value is 0.97.
Metrology 05 00060 g005
Figure 6. The correlation between RGA and FT-IR measurements for CF4 components under plasma-on condition is illustrated in the graphs. (a) represents F component with R2 value of 0.91. (b) represents CF component with R2 value of 0.99. (c) represents CF2 component with R2 value of 0.99. (d) represents CF3 component with R2 value of 0.98. (e) represents summation of all components with R2 value of 0.99.
Metrology 05 00060 g006
Figure 7. The correlation between RGA and FT-IR measurements for CF4 components under plasma-off condition is illustrated in the graphs. (a) represents F component with R2 value of 0.83. (b) represents CF component with R2 value of 0.28. (c) represents CF2 component with R2 value of 0.95. (d) represents CF3 component with R2 value of 0.96. (e) represents summation of all components with R2 value of 0.94.
Metrology 05 00060 g007
Figure 8. The correlation between RGA and FT-IR measurements for NF3 components under plasma-on condition is illustrated in the graphs. (a) represents F component with R2 value of 0.86. (b) represents NF component with R2 value of 0.97. (c) represents NF2 component with R2 value of 0.99. (d) represents summation of all components with R2 value of 0.99.
Metrology 05 00060 g008
Figure 9. The correlation between RGA and FT-IR measurements for NF3 components under plasma-off condition is illustrated in the graphs. (a) represents F component with R2 value of 0.93. (b) represents NF component with R2 value of 0.97. (c) represents NF2 component with R2 value of 0.97. (d) represents summation of all components with R2 value of 0.94.
Metrology 05 00060 g009
Table 1. RGA intensities and converted flow rate results. These results are compared with QMS flow rates.
RGA
Intensity (a.u.)
Estimated Concentration
(μmol/mol)
Calculated Flow Rate (slm)DMP
Flow Rate (slm)
Total
Flow Rate (slm)
QMS
Flow Rate (slm)
Error
(%)
3.00 × 10−53.9 × 1050.41525.425.825.60.78
3.13 × 10−54.0 × 1050.39525.425.826.00.77
3.02 × 10−53.9 × 1050.41225.425.826.63.00
2.94 × 10−53.8 × 1050.42425.325.725.70.00
2.83 × 10−53.6 × 1050.44325.325.727.46.20
2.79 × 10−53.6 × 1050.45025.325.826.11.10
Table 2. RGA intensities and converted concentration results for F from CF4 plasma-on condition. These results compared with FT-IR concentration results.
RGA
Intensity (a.u.)
Calculated Concentration (μmol/mol)Measured Calculation (μmol/mol)Error
(%)
3.49 × 10−79.36 × 1038.42 × 10310.0
3.44 × 10−78.99 × 1038.43 × 1036.37
3.41 × 10−78.80 × 1038.43 × 1034.26
3.39 × 10−78.69 × 1038.43 × 1032.95
3.38 × 10−78.63 × 1038.43 × 1032.29
Table 3. RGA intensities and converted concentration results for CF from CF4 plasma-on condition. These results compared with FT-IR concentration results.
RGA
Intensity (a.u.)
Calculated Concentration (μmol/mol)Measured Calculation (μmol/mol)Error
(%)
8.12 × 10−78.84 × 1038.42 × 1034.72
7.97 × 10−78.59 × 1038.43 × 1031.86
7.91 × 10−78.48 × 1038.43 × 1030.63
7.79 × 10−78.29 × 1038.43 × 1031.76
7.77 × 10−78.24 × 1038.43 × 1032.25
Table 4. RGA intensities and converted concentration results for CF2 from CF4 plasma-on condition. These results compared with FT-IR concentration results.
RGA
Intensity (a.u.)
Calculated Concentration (μmol/mol)Measured Calculation (μmol/mol)Error
(%)
2.77 × 10−78.52 × 1038.42 × 1031.21
2.77 × 10−78.47 × 1038.43 × 1030.54
2.77 × 10−78.51 × 1038.43 × 1030.97
2.77 × 10−78.52 × 1038.43 × 1030.98
2.78 × 10−78.56 × 1038.43 × 1031.50
Table 5. RGA intensities and converted concentration results for CF3 from CF4 plasma-on condition. These results compared with FT-IR concentration results.
RGA
Intensity (a.u.)
Calculated Concentration (μmol/mol)Measured Calculation (μmol/mol)Error
(%)
3.41 × 10−78.43 × 1038.42 × 1030.09
3.44 × 10−78.51 × 1038.43 × 1030.94
3.42 × 10−78.46 × 1038.43 × 1030.37
3.41 × 10−78.44 × 1038.43 × 1030.09
3.41 × 10−78.43 × 1038.43 × 1030.02
Table 6. RGA intensities and converted concentration results for F from CF4 plasma-off condition. These results compared with FT-IR concentration results.
RGA
Intensity (a.u.)
Calculated Concentration (μmol/mol)Measured Calculation (μmol/mol)Error
(%)
2.47 × 10−71.01 × 1048.69 × 10313.5
2.43 × 10−79.58 × 1038.68 × 1039.32
2.39 × 10−79.20 × 1038.69 × 1035.60
2.39 × 10−79.19 × 1038.68 × 1035.51
2.39 × 10−79.23 × 1038.69 × 1035.92
Table 7. RGA intensities and converted concentration results for CF from CF4 plasma-off condition. These results compared with FT-IR concentration results.
RGA
Intensity (a.u.)
Calculated Concentration (μmol/mol)Measured Calculation (μmol/mol)Error
(%)
1.58 × 10−61.79 × 1048.69 × 10351.4
1.52 × 10−61.14 × 1048.68 × 10323.7
1.50 × 10−68.81 × 1038.69 × 1031.35
1.48 × 10−66.22 × 1038.68 × 10339.6
1.46 × 10−64.44 × 1038.69 × 10395.7
Table 8. RGA intensities and converted concentration results for CF2 from CF4 plasma-off condition. These results compared with FT-IR concentration results.
RGA
Intensity (a.u.)
Calculated Concentration (μmol/mol)Measured Calculation (μmol/mol)Error
(%)
2.35 × 10−69.25 × 1038.69 × 1036.04
2.32 × 10−69.14 × 1038.68 × 1034.95
2.32 × 10−69.13 × 1038.69 × 1034.84
2.32 × 10−69.13 × 1038.68 × 1034.90
2.30 × 10−69.07 × 1038.69 × 1034.20
Table 9. RGA intensities and converted concentration results for CF3 from CF4 plasma-off condition. These results compared with FT-IR concentration results.
RGA
Intensity (a.u.)
Calculated Concentration (μmol/mol)Measured Calculation (μmol/mol)Error
(%)
3.03 × 10−59.22 × 1038.69 × 1035.81
2.99 × 10−59.08 × 1038.68 × 1034.34
2.96 × 10−58.99 × 1038.69 × 1033.35
2.95 × 10−58.93 × 1038.68 × 1032.74
2.93 × 10−58.87 × 1038.69 × 1032.10
Table 10. RGA intensities and converted concentration results for F from NF3 plasma-on condition. These results compared with FT-IR concentration results.
RGA
Intensity (a.u.)
Calculated Concentration (μmol/mol)Measured Calculation (μmol/mol)Error
(%)
1.29 × 10−64.77 × 1034.57 × 1034.33
1.28 × 10−64.69 × 1034.58 × 1032.52
1.27 × 10−64.63 × 1034.59 × 1030.86
1.25 × 10−64.54 × 1034.59 × 1031.23
1.24 × 10−64.49 × 1034.63 × 1033.19
Table 11. RGA intensities and converted concentration results for NF from NF3 plasma-on condition. These results compared with FT-IR concentration results.
RGA
Intensity (a.u.)
Calculated Concentration (μmol/mol)Measured Calculation (μmol/mol)Error
(%)
2.80 × 10−64.77 × 1034.57 × 1034.33
2.79 × 10−64.69 × 1034.58 × 1032.52
2.79 × 10−64.63 × 1034.59 × 1030.86
2.79 × 10−64.54 × 1034.59 × 1031.23
2.78 × 10−64.49 × 1034.63 × 1033.19
Table 12. RGA intensities and converted concentration results for NF2 from NF3 plasma-on condition. These results compared with FT-IR concentration results.
RGA
Intensity (a.u.)
Calculated Concentration (μmol/mol)Measured Calculation (μmol/mol)Error
(%)
1.03 × 10−54.63 × 1034.57 × 1031.45
1.05 × 10−54.77 × 1034.58 × 1033.94
1.04 × 10−54.72 × 1034.59 × 1032.78
1.04 × 10−54.68 × 1034.59 × 1031.82
1.04 × 10−54.67 × 1034.63 × 1030.85
Table 13. RGA intensities and converted concentration results for F from NF3 plasma-off condition. These results compared with FT-IR concentration results.
RGA
Intensity (a.u.)
Calculated Concentration (μmol/mol)Measured Calculation (μmol/mol)Error
(%)
4.00 × 10−78.89 × 1038.67 × 1032.53
4.10 × 10−79.16 × 1038.66 × 1035.52
4.21 × 10−79.46 × 1038.66 × 1038.51
4.24 × 10−79.55 × 1038.66 × 1039.26
4.27 × 10−79.63 × 1038.67 × 1039.99
Table 14. RGA intensities and converted concentration results for NF from NF3 plasma-off condition. These results compared with FT-IR concentration results.
RGA
Intensity (a.u.)
Calculated Concentration (μmol/mol)Measured Calculation (μmol/mol)Error
(%)
4.35 × 10−69.20 × 1038.67 × 1035.54
4.33 × 10−69.13 × 1038.66 × 1034.86
4.32 × 10−69.09 × 1038.66 × 1034.43
4.34 × 10−69.16 × 1038.66 × 1035.23
4.36 × 10−69.23 × 1038.67 × 1035.92
Table 15. RGA intensities and converted concentration results for NF2 from NF3 plasma-off condition. These results compared with FT-IR concentration results.
RGA
Intensity (a.u.)
Calculated Concentration (μmol/mol)Measured Calculation (μmol/mol)Error
(%)
1.56 × 10−58.96 × 1038.67 × 1033.03
1.60 × 10−59.26 × 1038.66 × 1036.17
1.59 × 10−59.18 × 1038.66 × 1035.36
1.58 × 10−59.11 × 1038.66 × 1034.66
1.57 × 10−59.03 × 1038.67 × 1033.83
Disclaimer/Publisher’s Note: The statements, opinions and data contained in all publications are solely those of the individual author(s) and contributor(s) and not of MDPI and/or the editor(s). MDPI and/or the editor(s) disclaim responsibility for any injury to people or property resulting from any ideas, methods, instructions or products referred to in the content.