Abstract
This paper concerns the assessment of railway track surface conditions in relation to the degree of weed infestation. The paper conceptually describes the proposed method using a visual system to analyse weed infestation level. The use of image analysis software for weed detection is also proposed. This new measurement method allows for a mobile assessment of the track’s weed infestation status. Validation of the assessment method in real conditions will allow for further expansion of the system using new shades of green from the RAL palette, and will take into account a more extensive and detailed assessment of weed infestation on the track in accordance with applicable railway regulations.
1. Introduction
The growth of railway traffic and the increasing speed of moving trains require regular inspections of the current conditions of the railway infrastructure, as well as planning and conducting relevant maintenance works [1]. An important element in the maintenance of railroads and their vicinity is the elimination of unwanted vegetation [2]. For a well-maintained railway track, there should be no vegetation in the ballast. This is a very important issue, as the presence of plants in the railway track leads to the degradation of wooden sleepers with organic material, as well as ballast pollution, which makes surface drainage more difficult and damages the condition of the substructure [3,4]. Under these conditions the track is subject to rapid degradation, with the appearance of characteristic deformations, track settling, and the formation of vertical unevenness of the rails. The water collected in the ballast due to incorrect drainage forms a so-called mud slush, the track becomes unstable and the wooden sleepers, if used, are subject to accelerated rotting processes [5,6].
Therefore, all over the world, unwanted vegetation is removed from railway tracks by spraying it with herbicides or other chemicals [7,8]. Unfortunately, their use negatively affects the environment, especially areas situated in the direct vicinity of the track [9]. In most cases, chemical spraying is done periodically, in accordance with a planned cycle. This practice means that the spraying is done even when there is no need for it, from the point of view of the current weed infestation of the track. In turn, in other places, the planned cycle may include insufficiently frequent spraying, which leads to the appearance of plants and, consequently, degradation of the track superstructure. This situation is generally caused by a lack of automated and objective tools to assess the current condition of track superstructure in terms of the presence of unwanted vegetation.
Modern visual measurement methods are becoming more and more frequently used in areas related to the measurement and diagnostics of elements of rolling stock and railway infrastructure. These often include such areas as diagnostic measurements of traction network, measurements of the dynamic cooperation of current collectors with the network, and other diagnostic measurements [10,11,12,13,14,15,16,17,18]. The use of visual techniques for assessing the level of weed infestation is a novel approach, which has great potential for use in practical applications [19,20].
The article presents a method to assess the level of railway-track weed infestation based on the analysis of photographic images recorded by a video camera when the measuring flatcar travels along the railway line. The proposed method provides an opportunity for objective assessment of the presence of flora, both in qualitative terms, i.e., as two-state detection indicating whether or not flora is present, and in quantitative terms, i.e., how much flora occurs in the given area. With this information, railway track sprayings can be completed in a selective manner, additionally controlling their intensity in proportion to the weed infestation level. This approach will reduce the emission of harmful chemical compounds into the environment, as they will be used only when necessary in the amounts needed for removing plants from the track superstructure.
2. Method of Measurement
The measurement of track superstructure weed infestation levels using the visual system includes a series of actions. Firstly, an image is taken using a video camera, showing the area of the examined track superstructure. This image should be recorded in colour in one of the standard colour-coding systems, RGB for instance. Then, colour analysis of the image is performed to find areas marked green. The presence of green objects can be interpreted as the evidence of unwanted vegetation, because under normal conditions there are no green elements on the track.
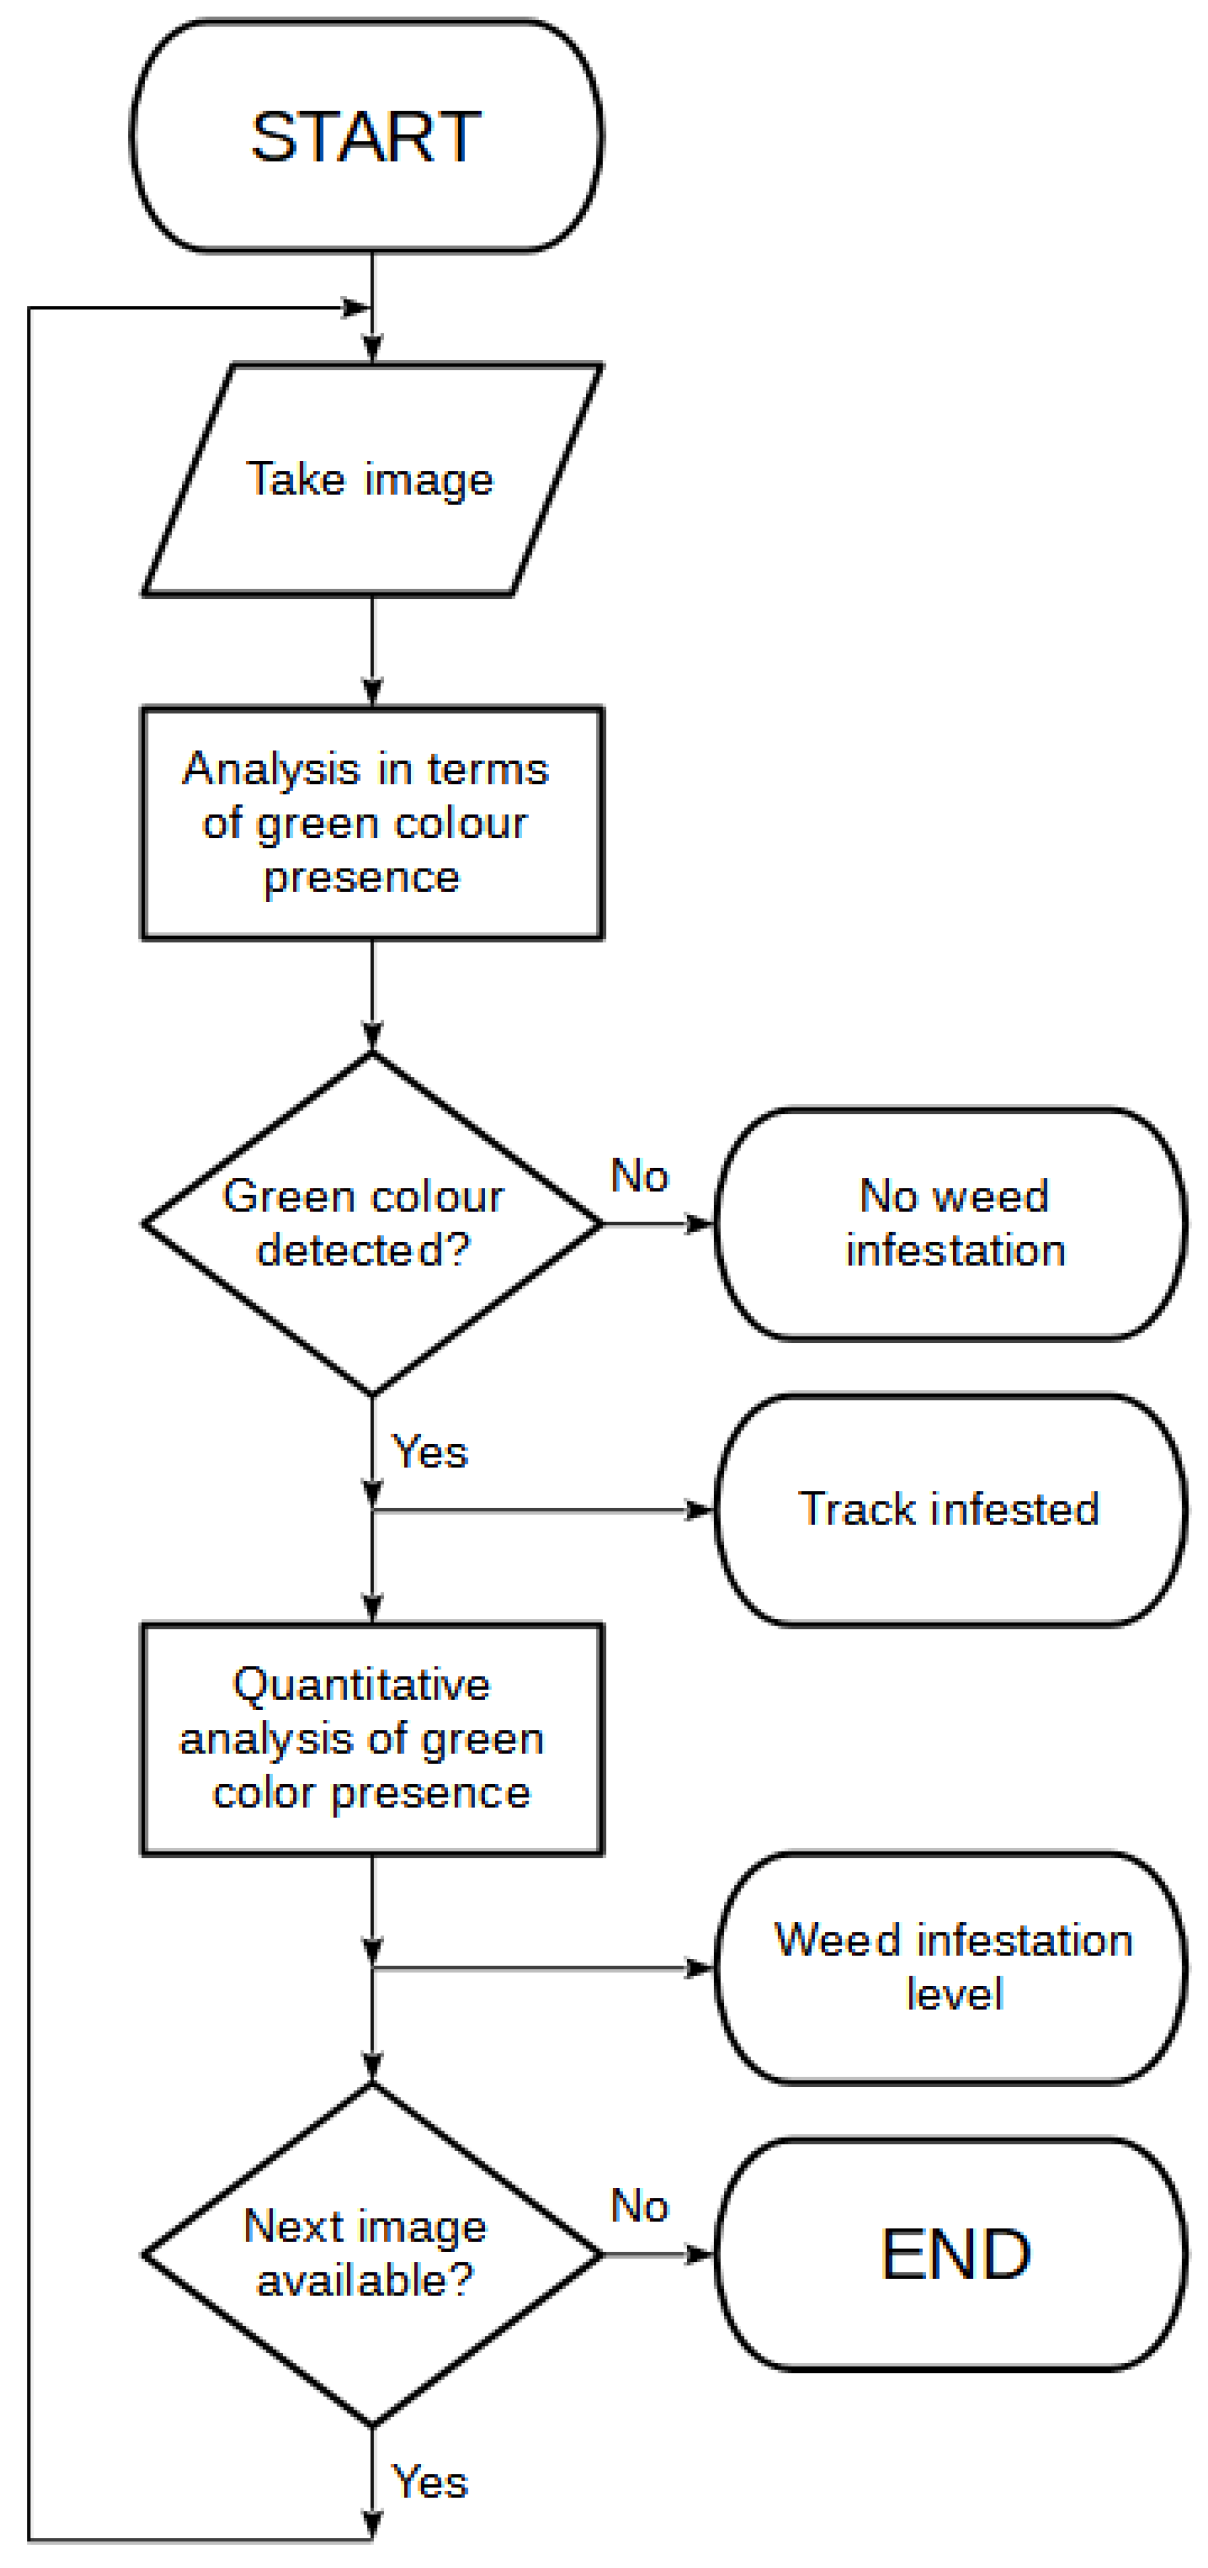
It is noteworthy that the proposed measurement method can only be applied in the plant vegetation period, i.e., between May and October in the temperate zone in the northern hemisphere. The presence of green colour is a qualitative signal of the occurrence of unwanted vegetation. Determining what percentage of the recorded image is marked green, or how many elements in the image are green, gives the quantitative assessment of the track superstructure weed infestation level. The block diagram of the measurement algorithm is shown in Figure 1.
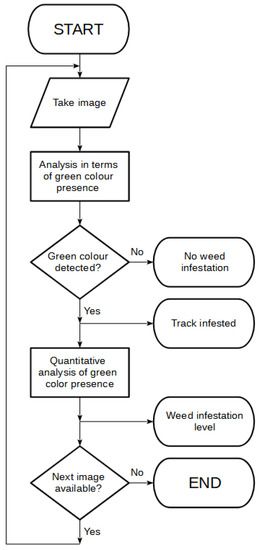
Figure 1.
Block diagram of the algorithm measuring the track superstructure weed infestation level.
At first, the recorded frame was cut so that the image contained only the surface area of the railway track. Then the photo was analysed for the presence of green colour. Since individual species of flora may differ greatly by shades of green, it is advisable to perform colour analysis for a number of basic shades. In practice, it turned out sufficient to repeat this analysis three times: for light, normal, and dark shades of green. The detection of green colour showed that weeds were present on the railway track at the place of measurement. The next step in the analysis was the quantification of weed infestation level based on the number of matches to the pattern. The results of the analysis were directly proportional to the area contaminated with undesirable vegetation. The algorithm was performed cyclically for all recorded images.
3. Practical Execution
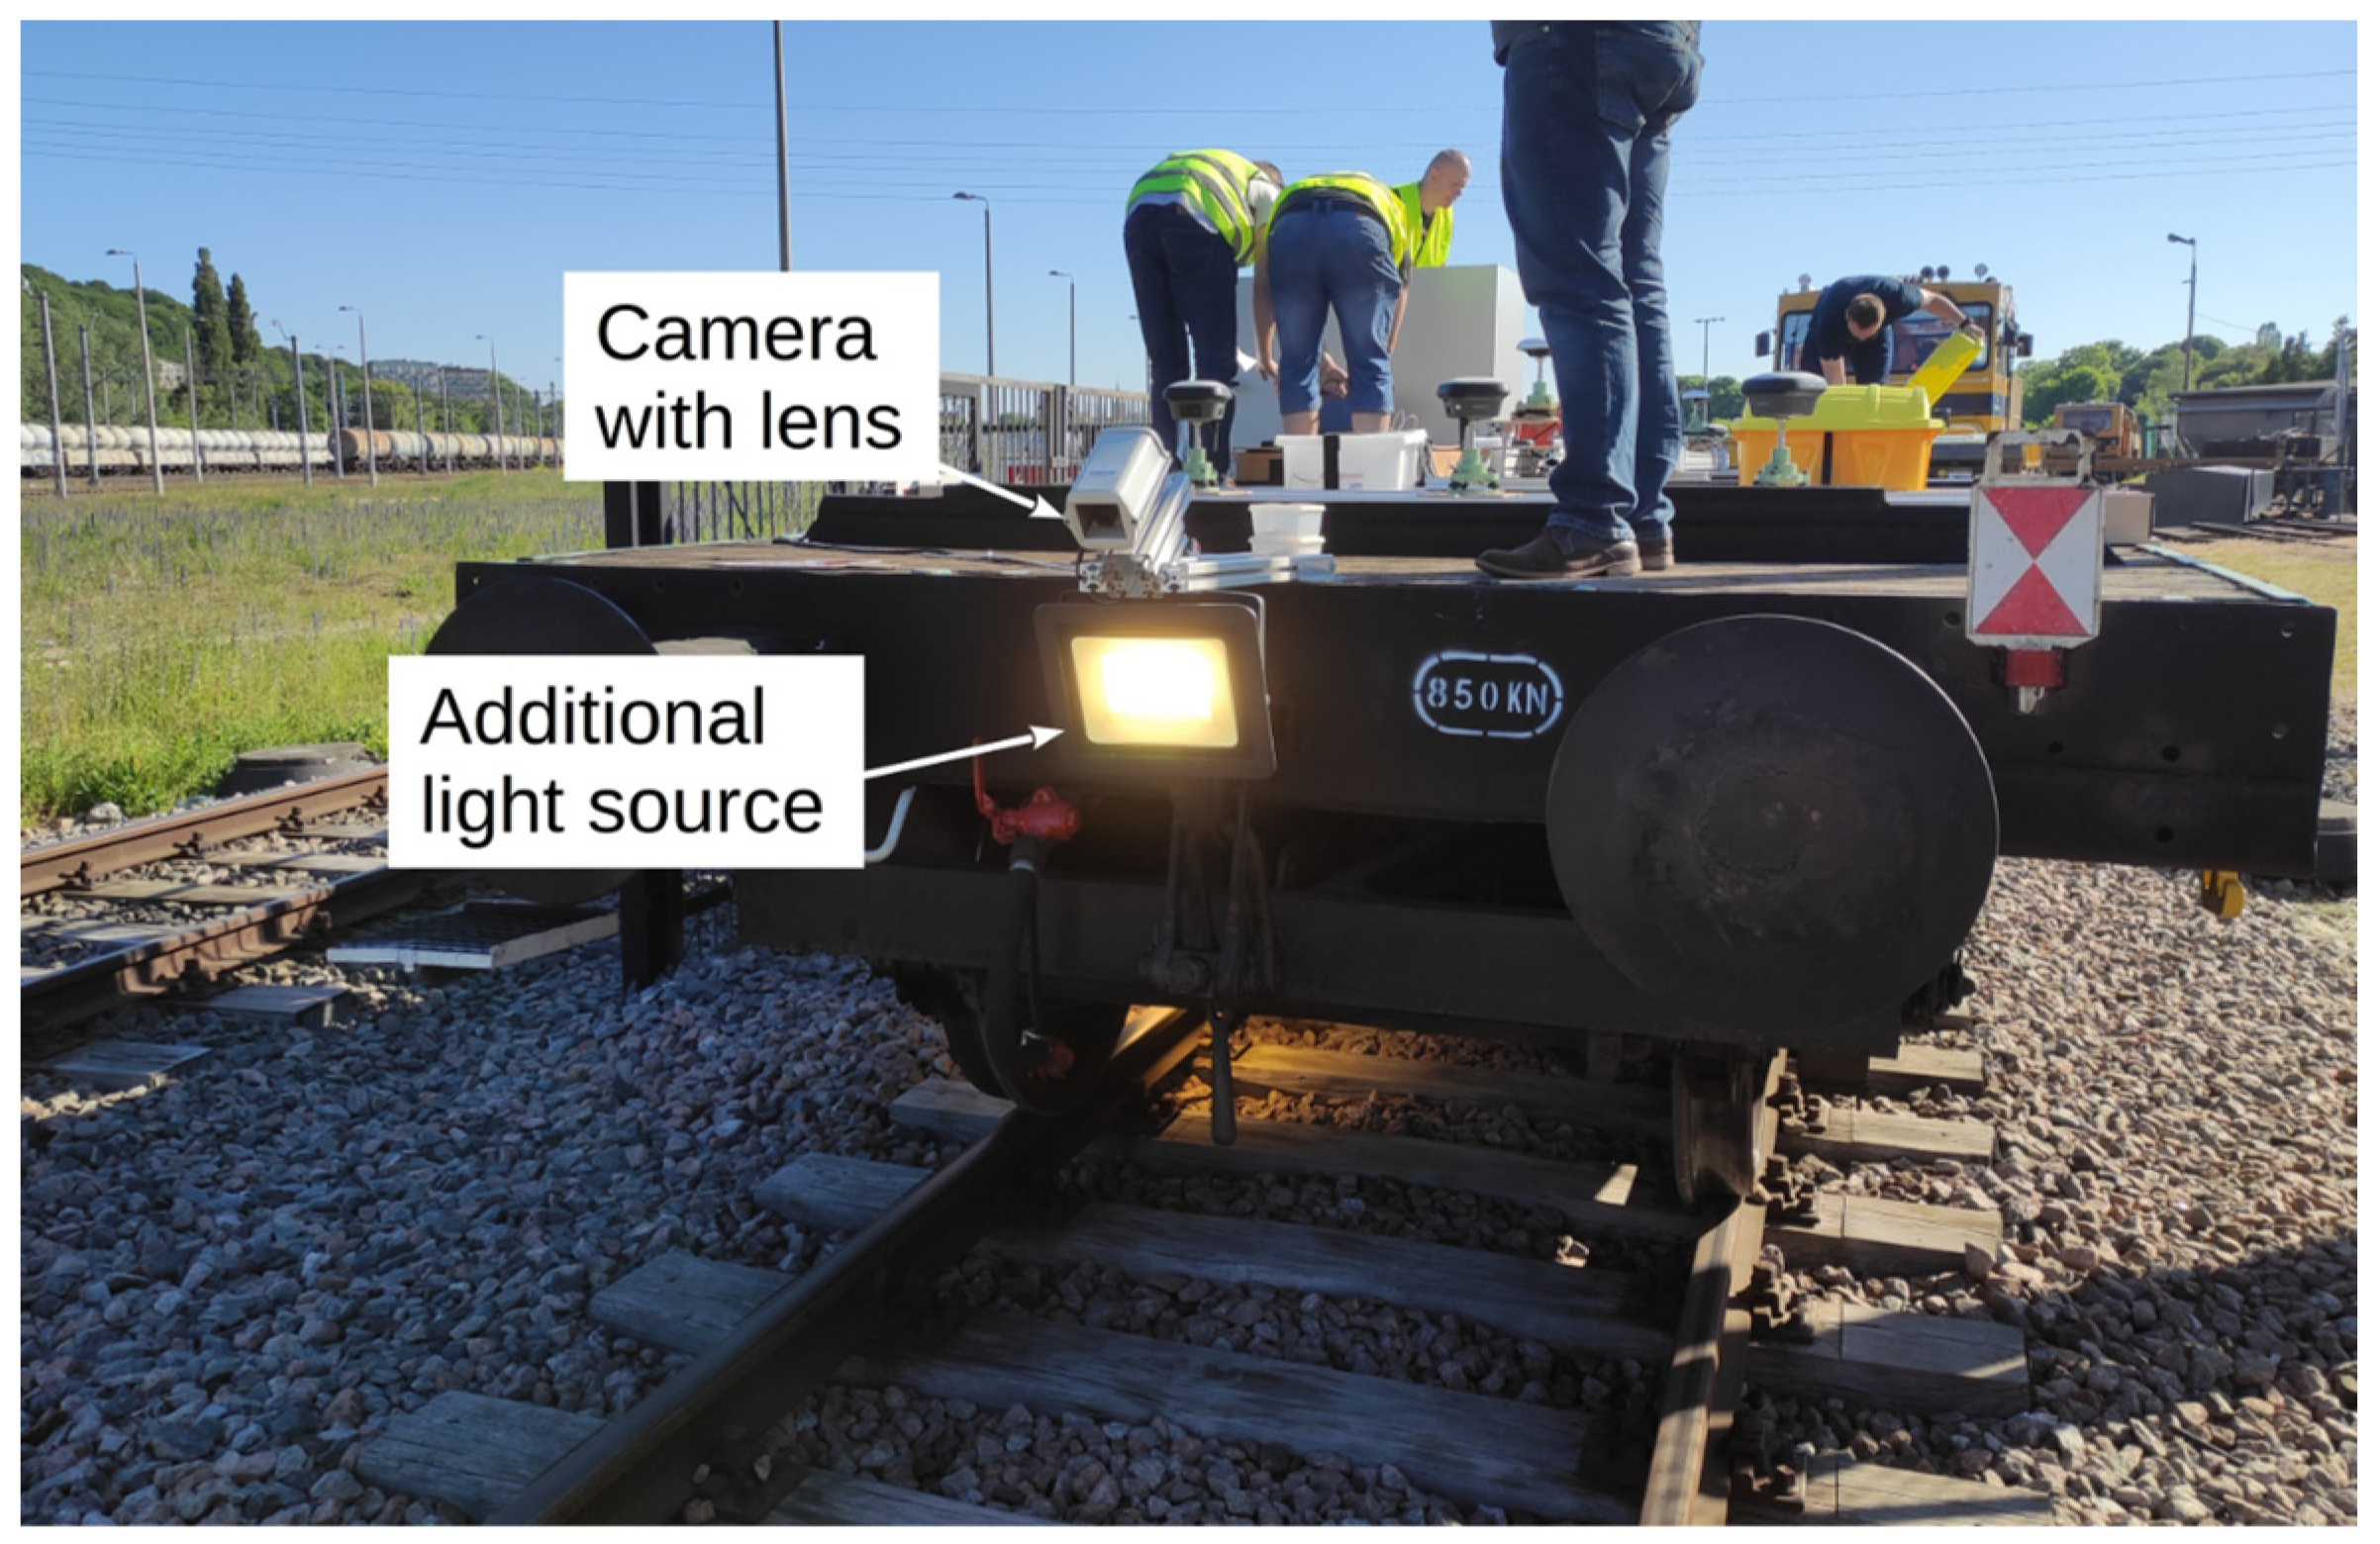
To verify the assumptions of the proposed method, measurements were taken from selected railway line segments which included fragments with different track superstructure weed infestation levels. The measurements were performed in the areas without vegetation and in those where vegetation occurred abundantly. The video camera used for image recording was mounted at the end of the flatcar so that the recorded image covered the entire area of the railway track superstructure. An additional light source was mounted next to the camera to facilitate recording images when the measuring flatcar passed through lower visibility areas, tunnels for instance. A view of the flatcar with the mounted equipment is shown in Figure 2.
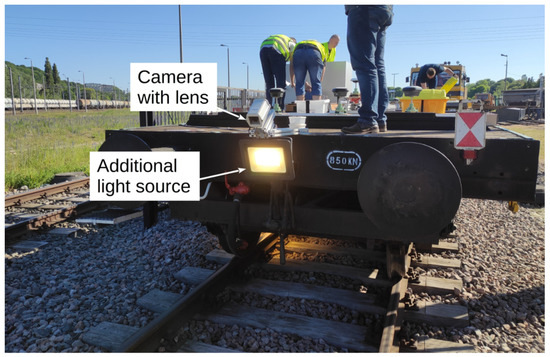
Figure 2.
Measuring equipment mounted on the flatcar (phot. J. Szmaglinski).
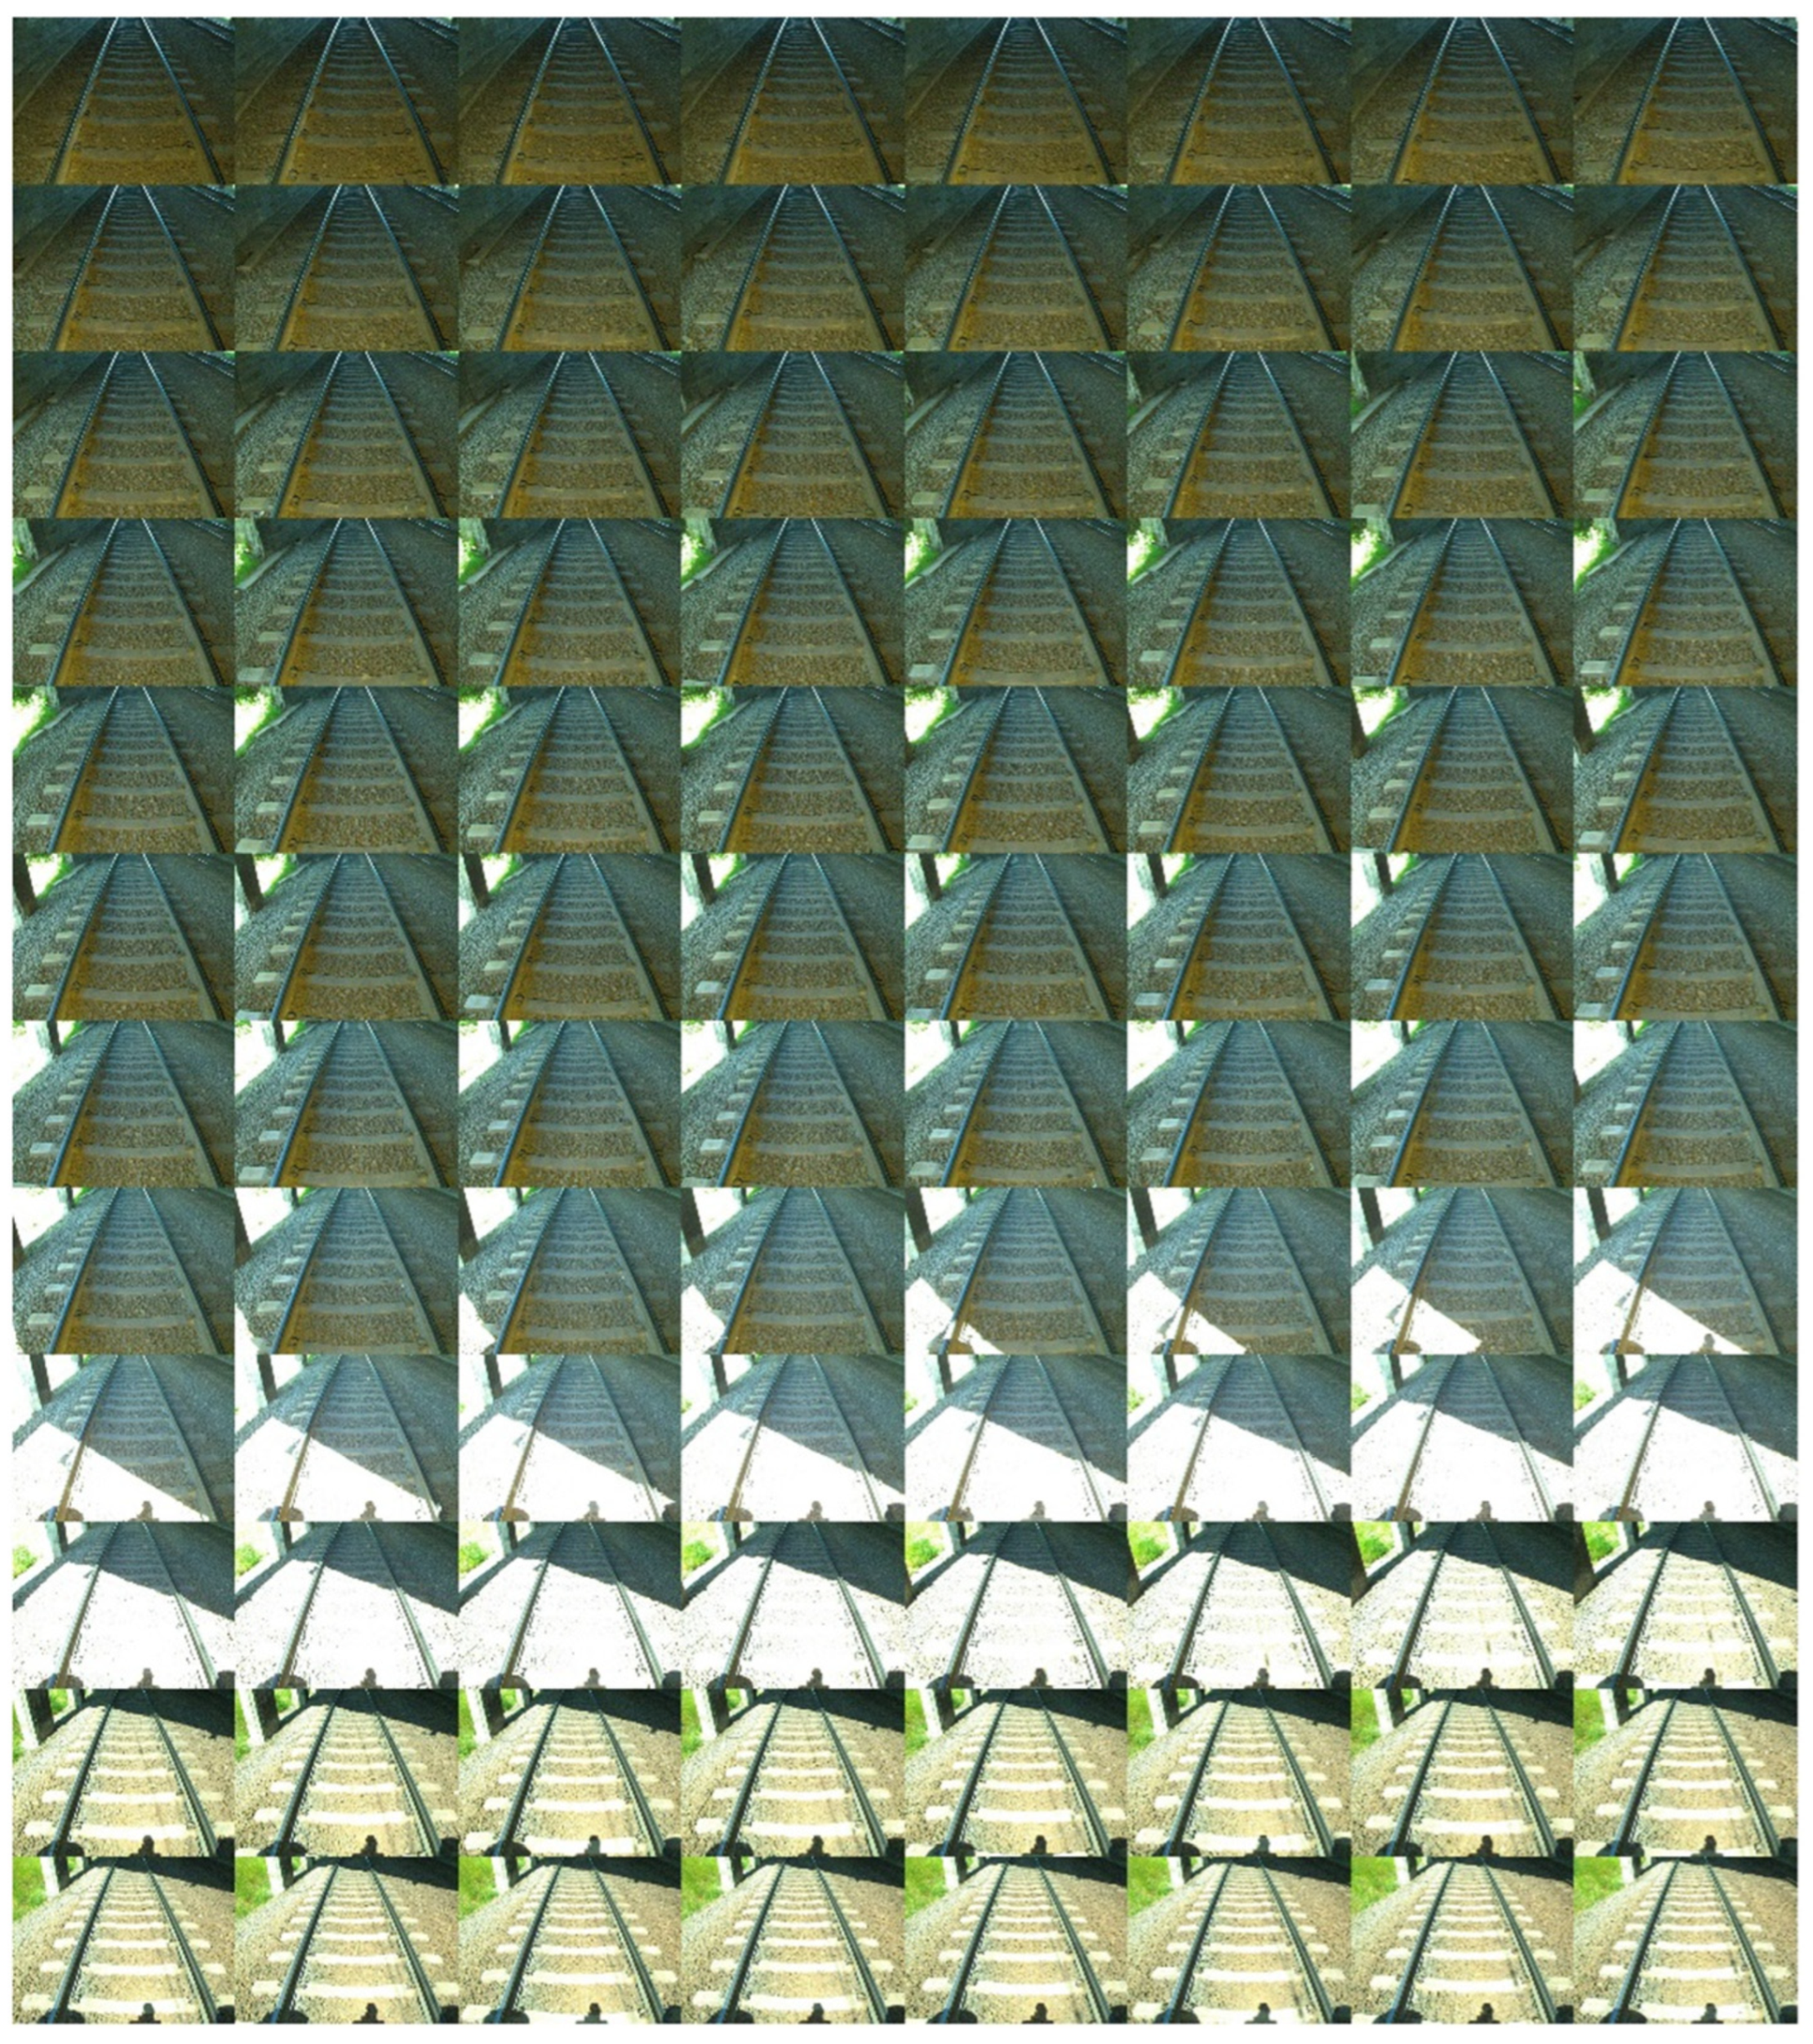
Weed is rare in tunnels, so the main purpose of using an additional light source was not to illuminate these places for measurement purposes. Additional lighting reduces the effect of camera glare when leaving a darkened area. Because the camera applies automatic selection of exposure parameters, thanks to the additional lighting less time was needed to automatically adjust the recording parameters to meet the changing lighting conditions. It also influenced the possibility of correct level of weed infestation measurement, making such measurement possible immediately after leaving a tunnel, for example. The effect of reducing camera glare is shown in Figure 3.

Figure 3.
Reducing of camera glare effect by using an additional light source.
Figure 3 shows the sequence of 96 frames (approx. 2.5 s) recorded while leaving a viaduct under full sunlight. With the use of additional lighting, camera blindness lasted only about 0.3 s (15 frames), so short that it was not a problem for the railway track weed infestation level measuring procedure.
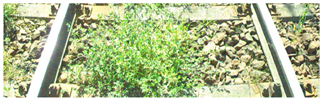
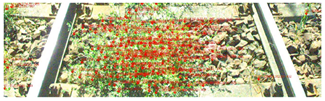
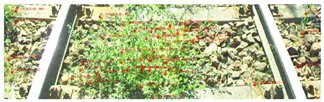
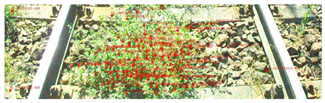
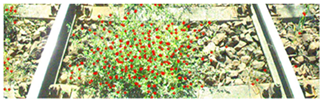
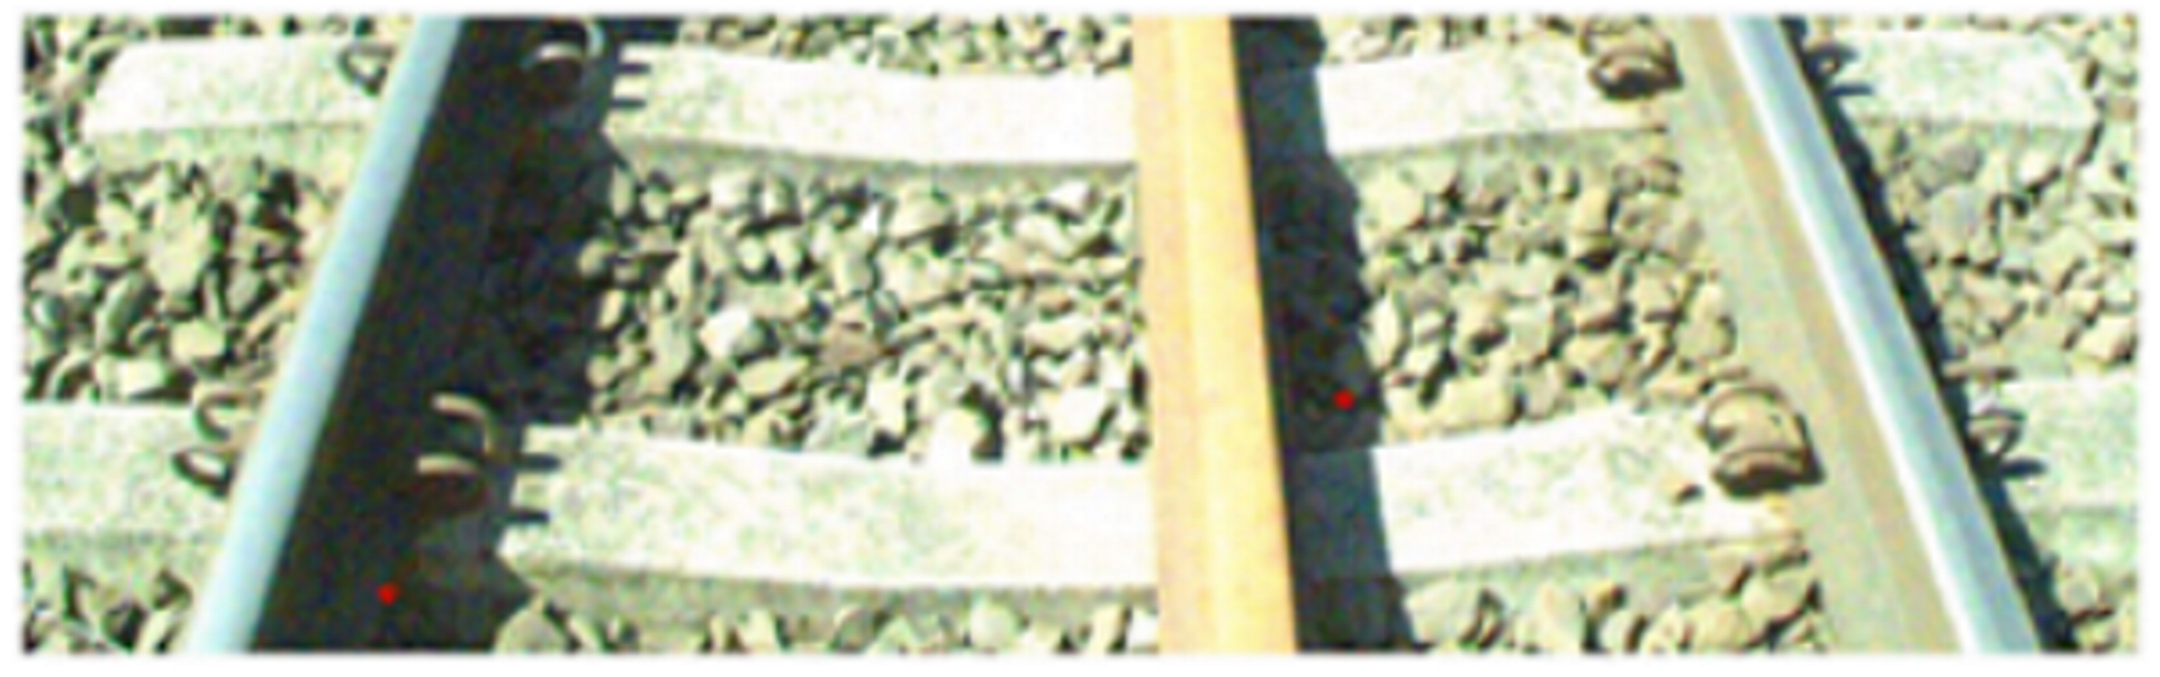
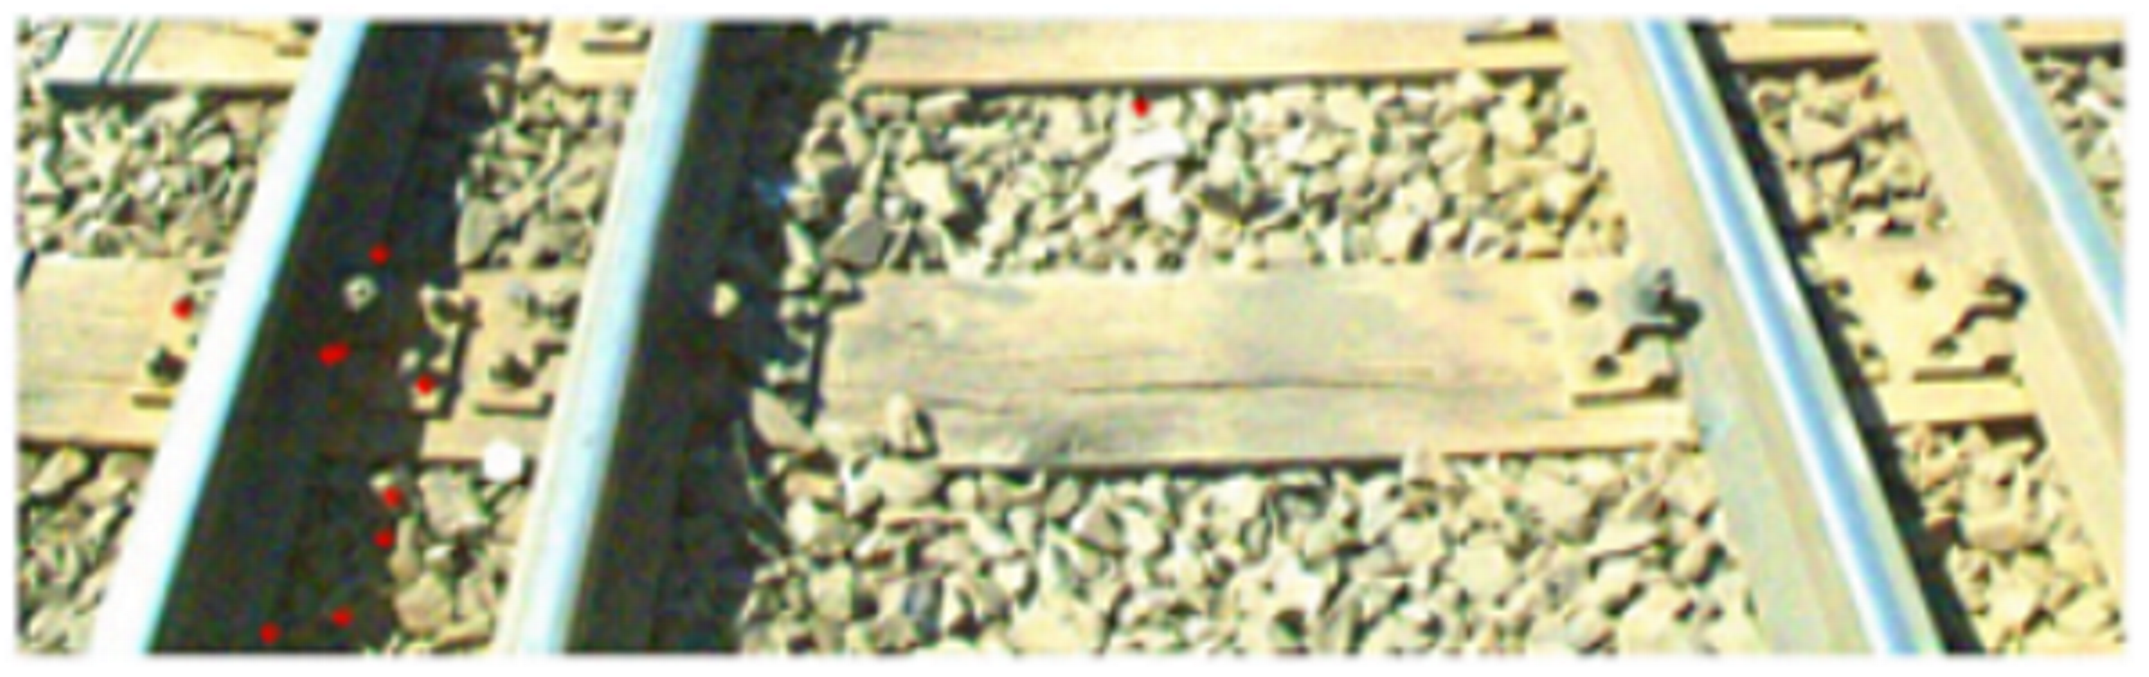
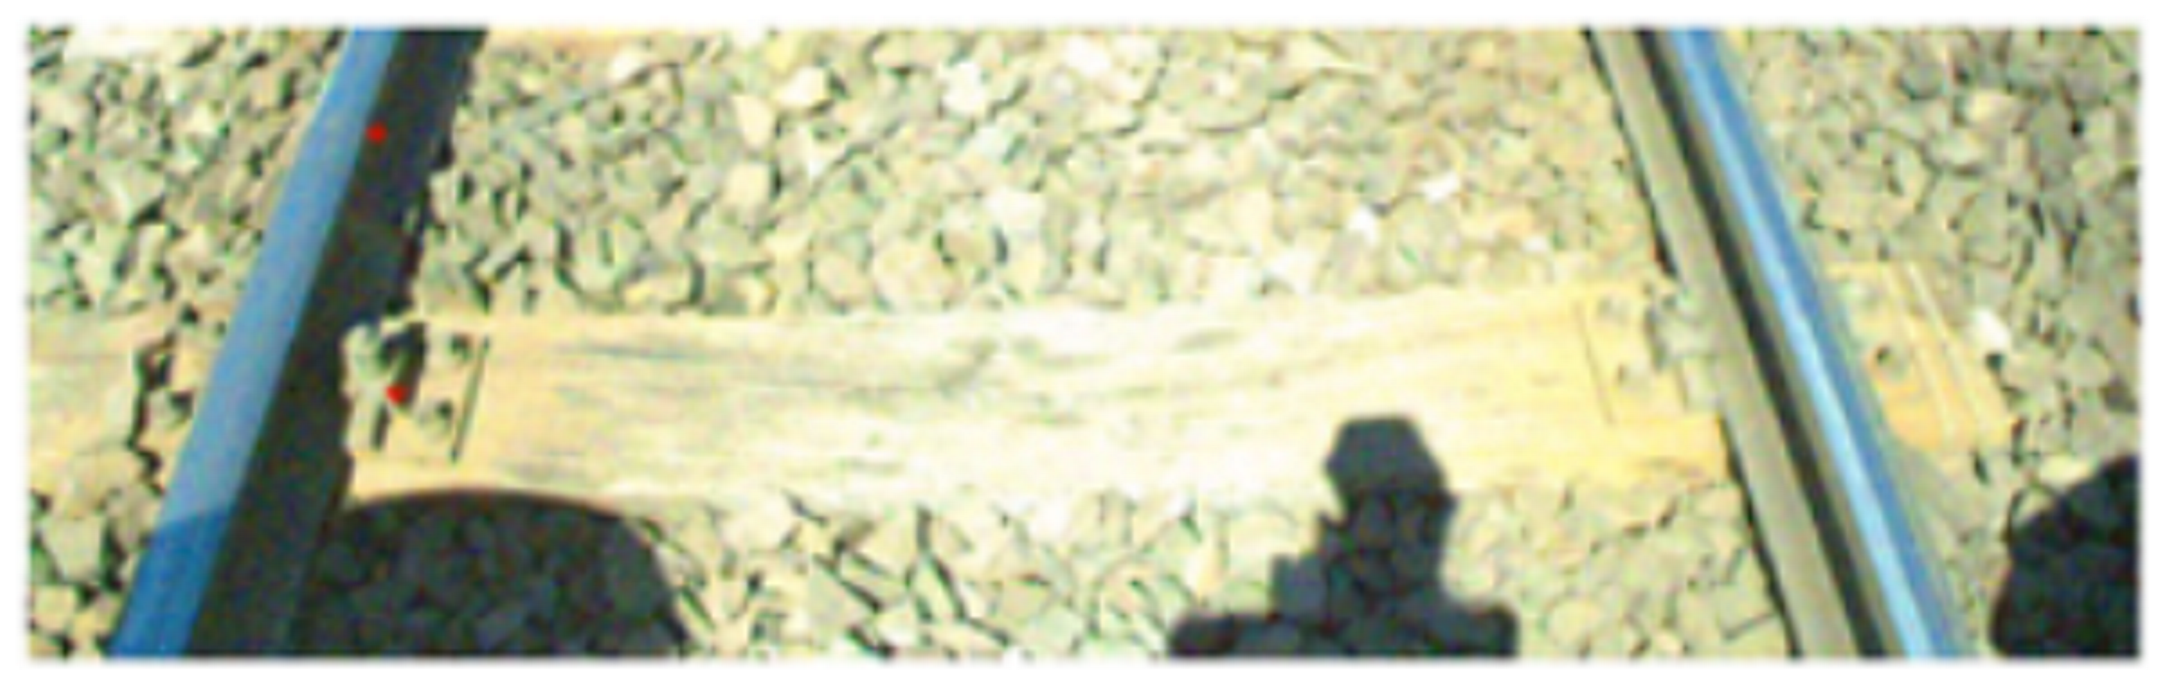
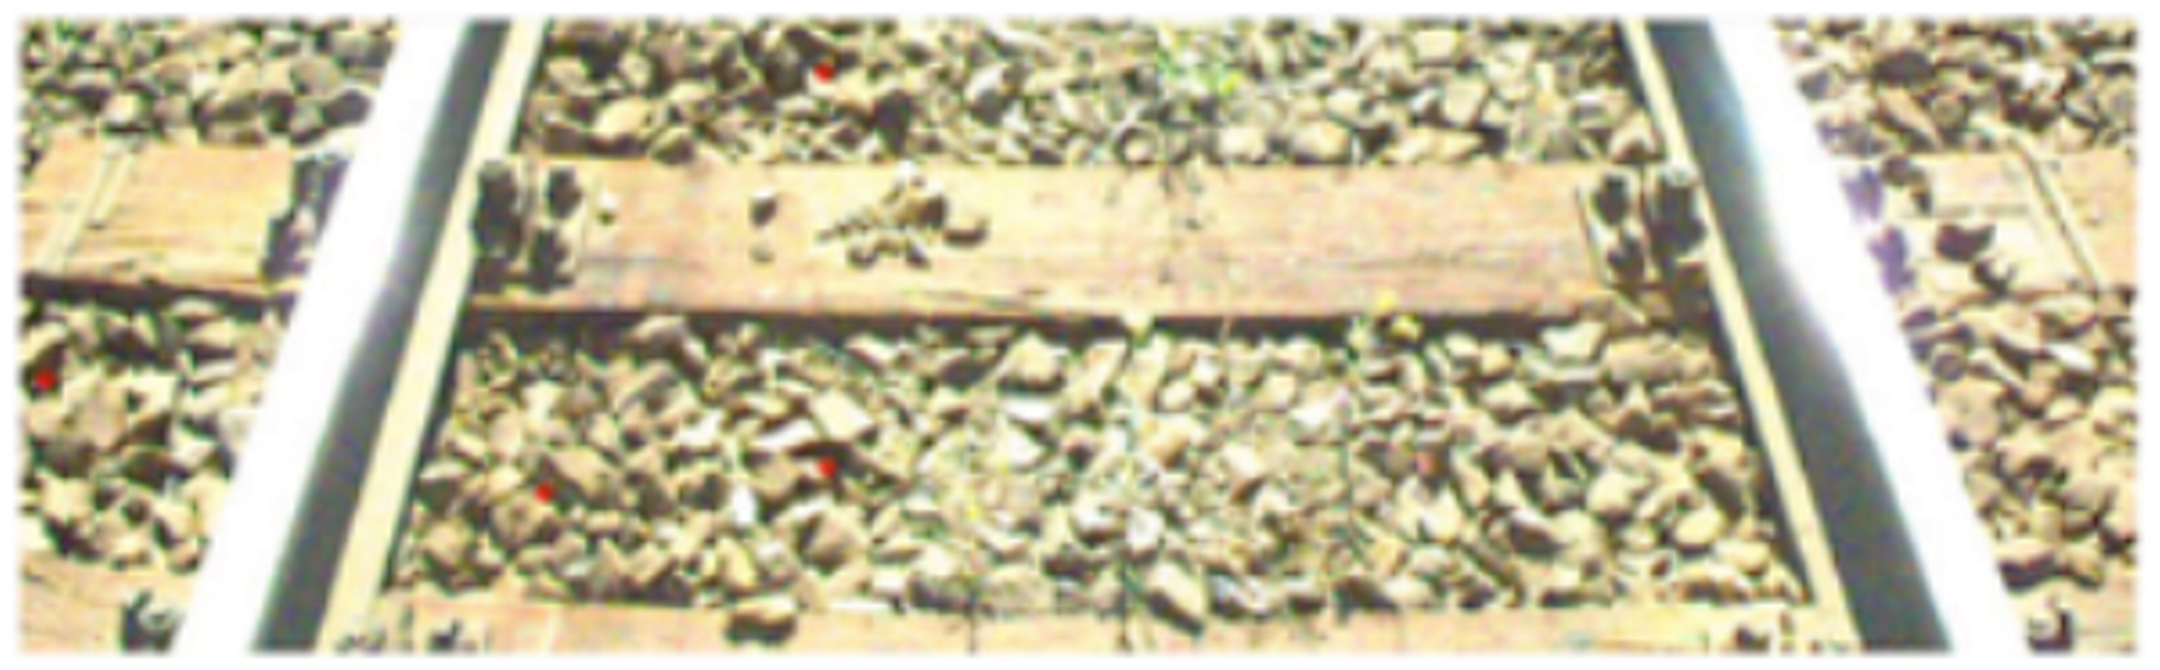
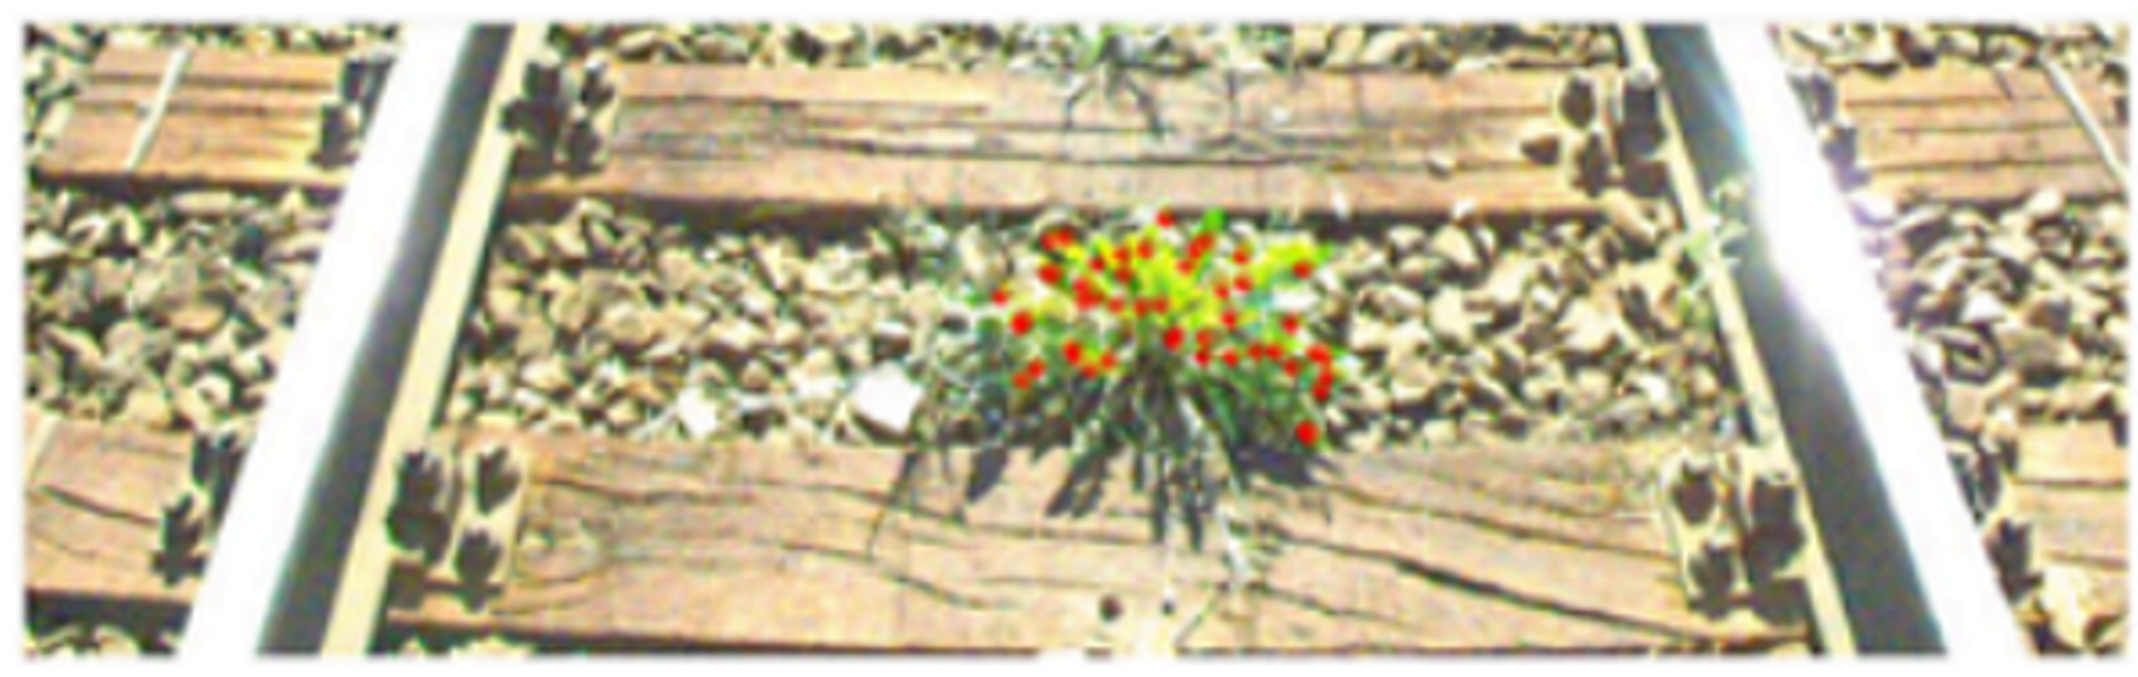
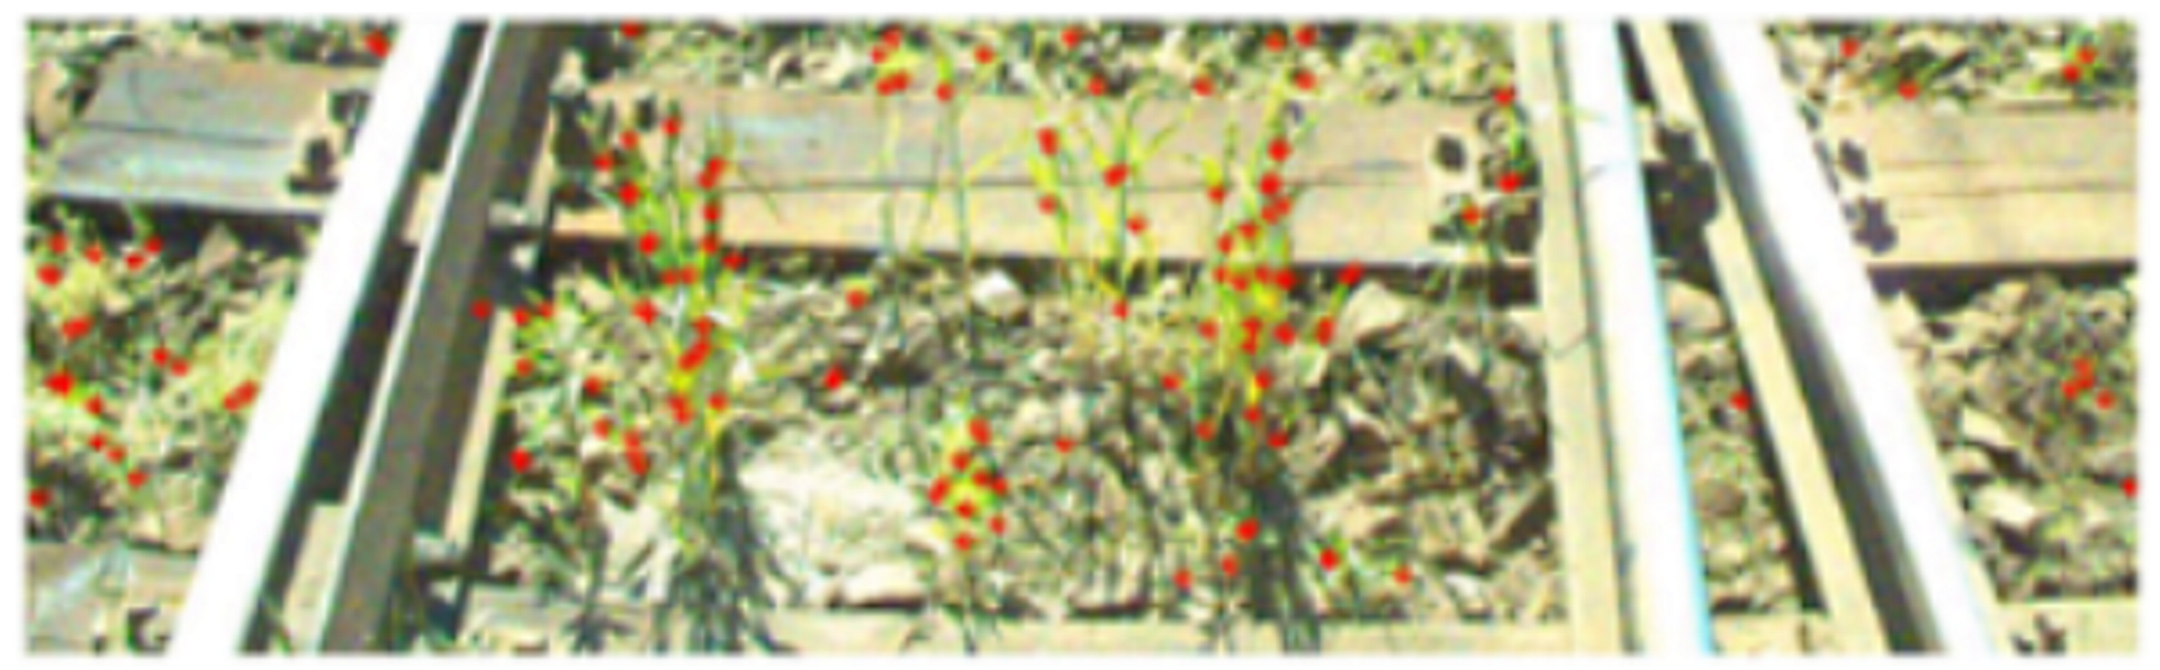
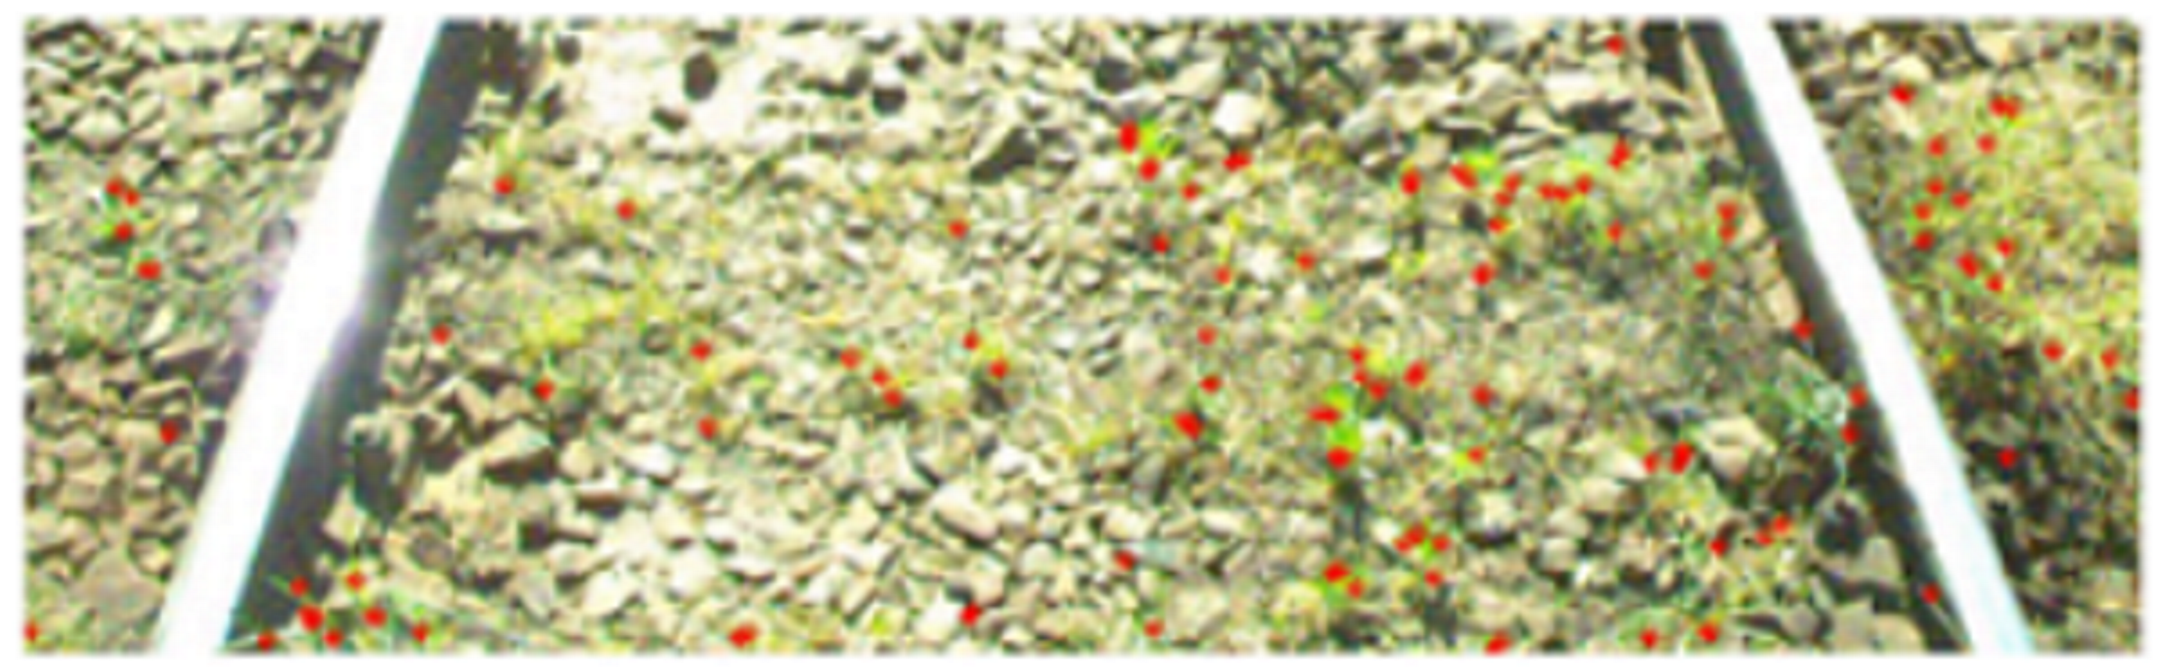
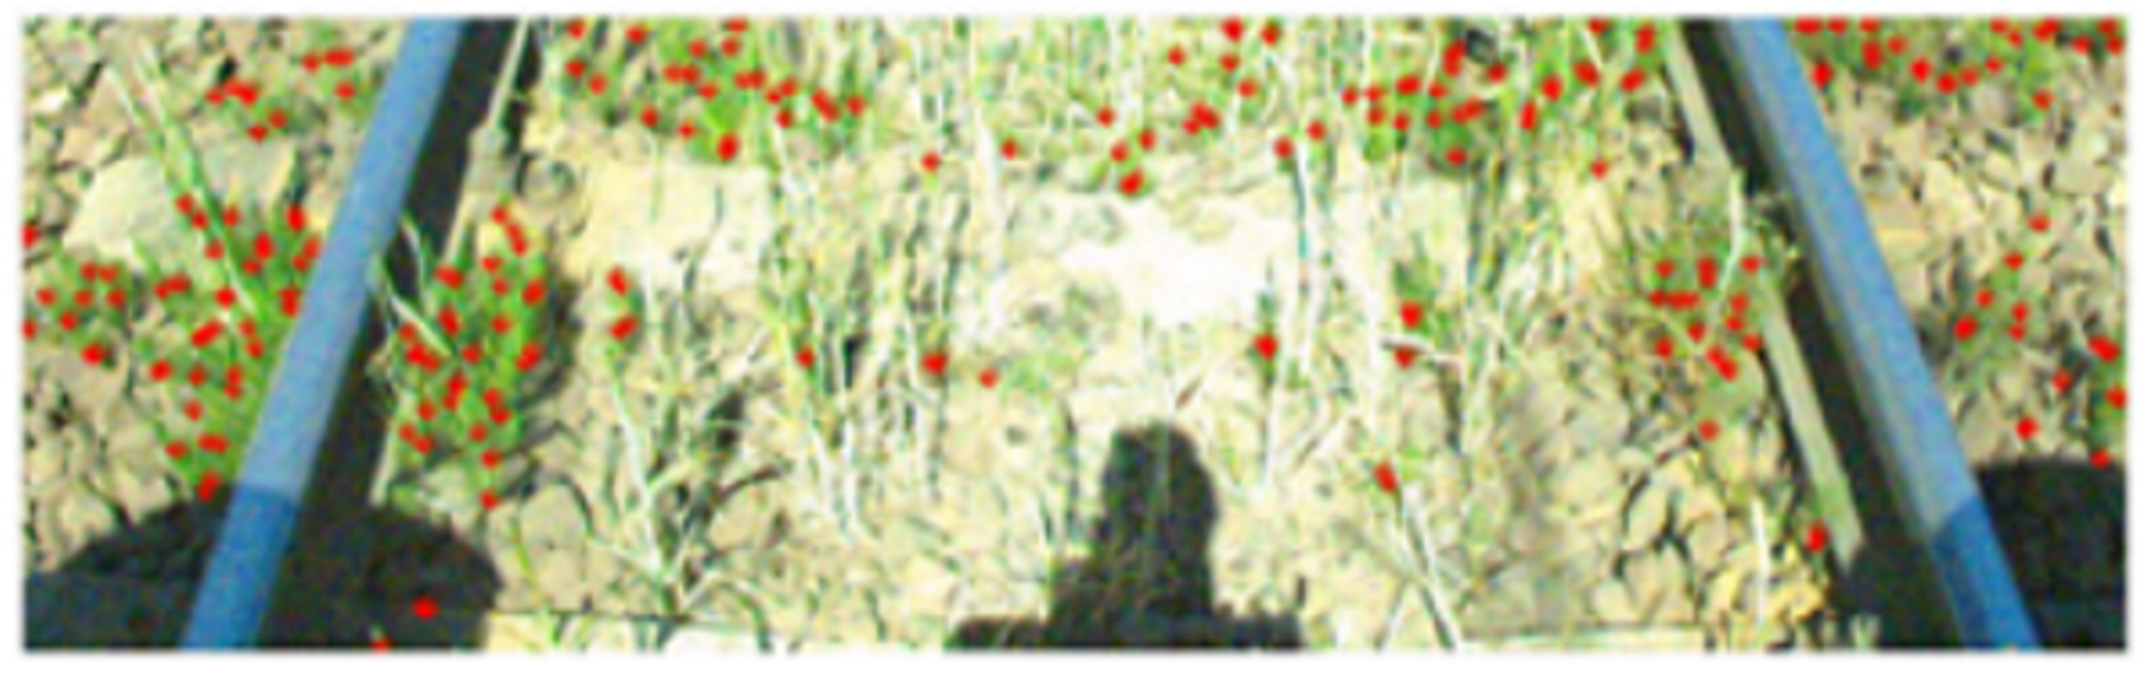
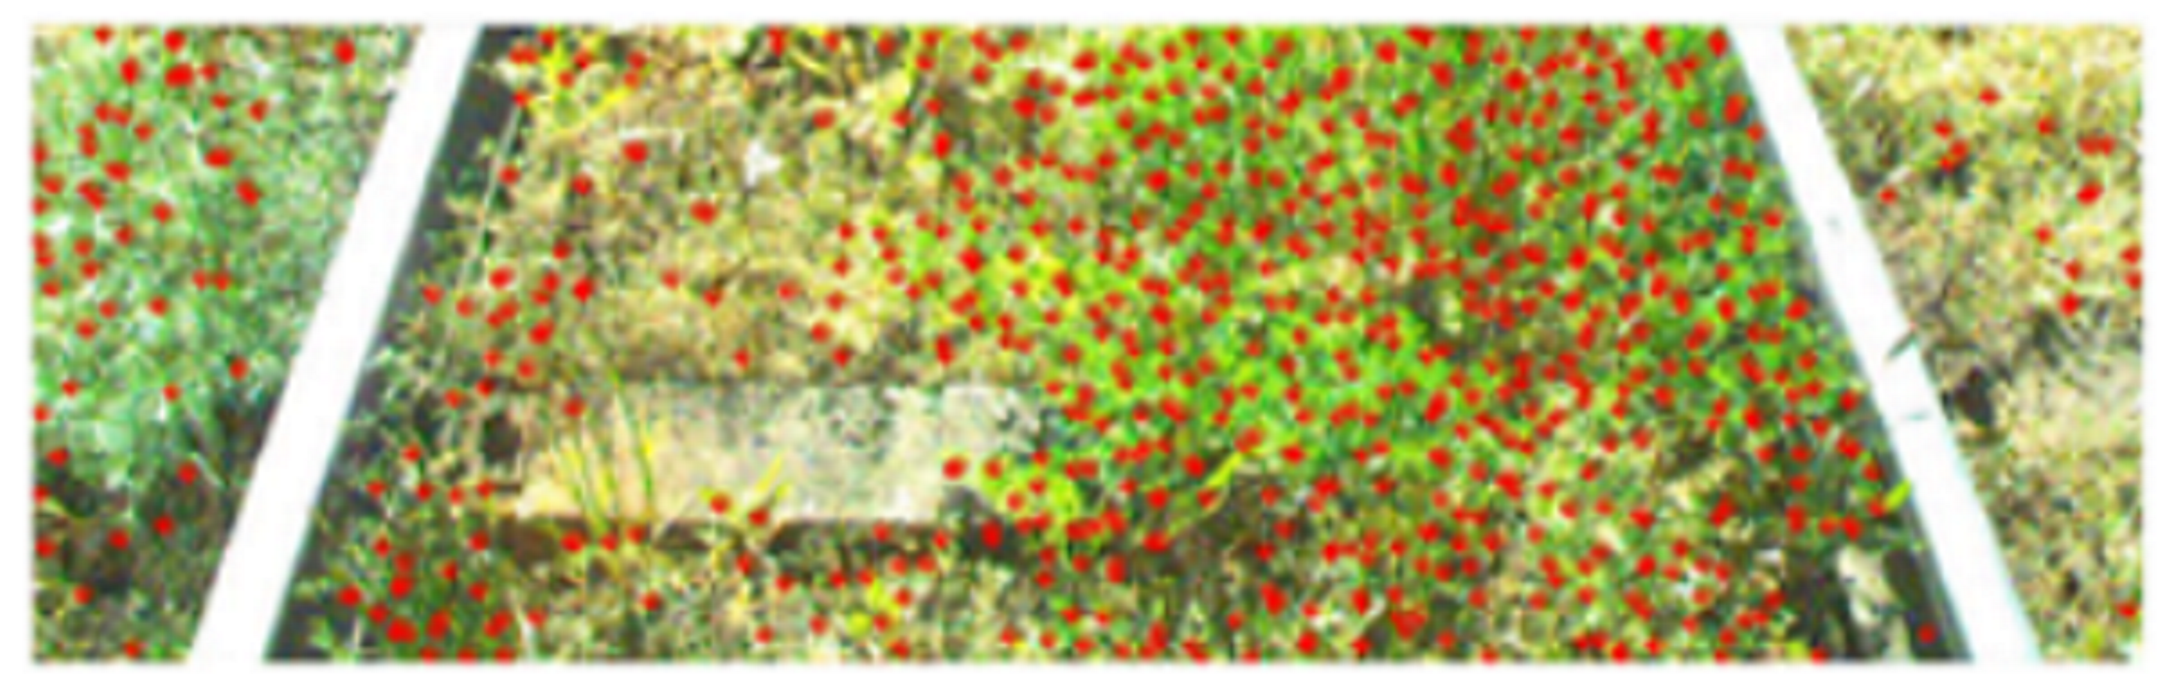
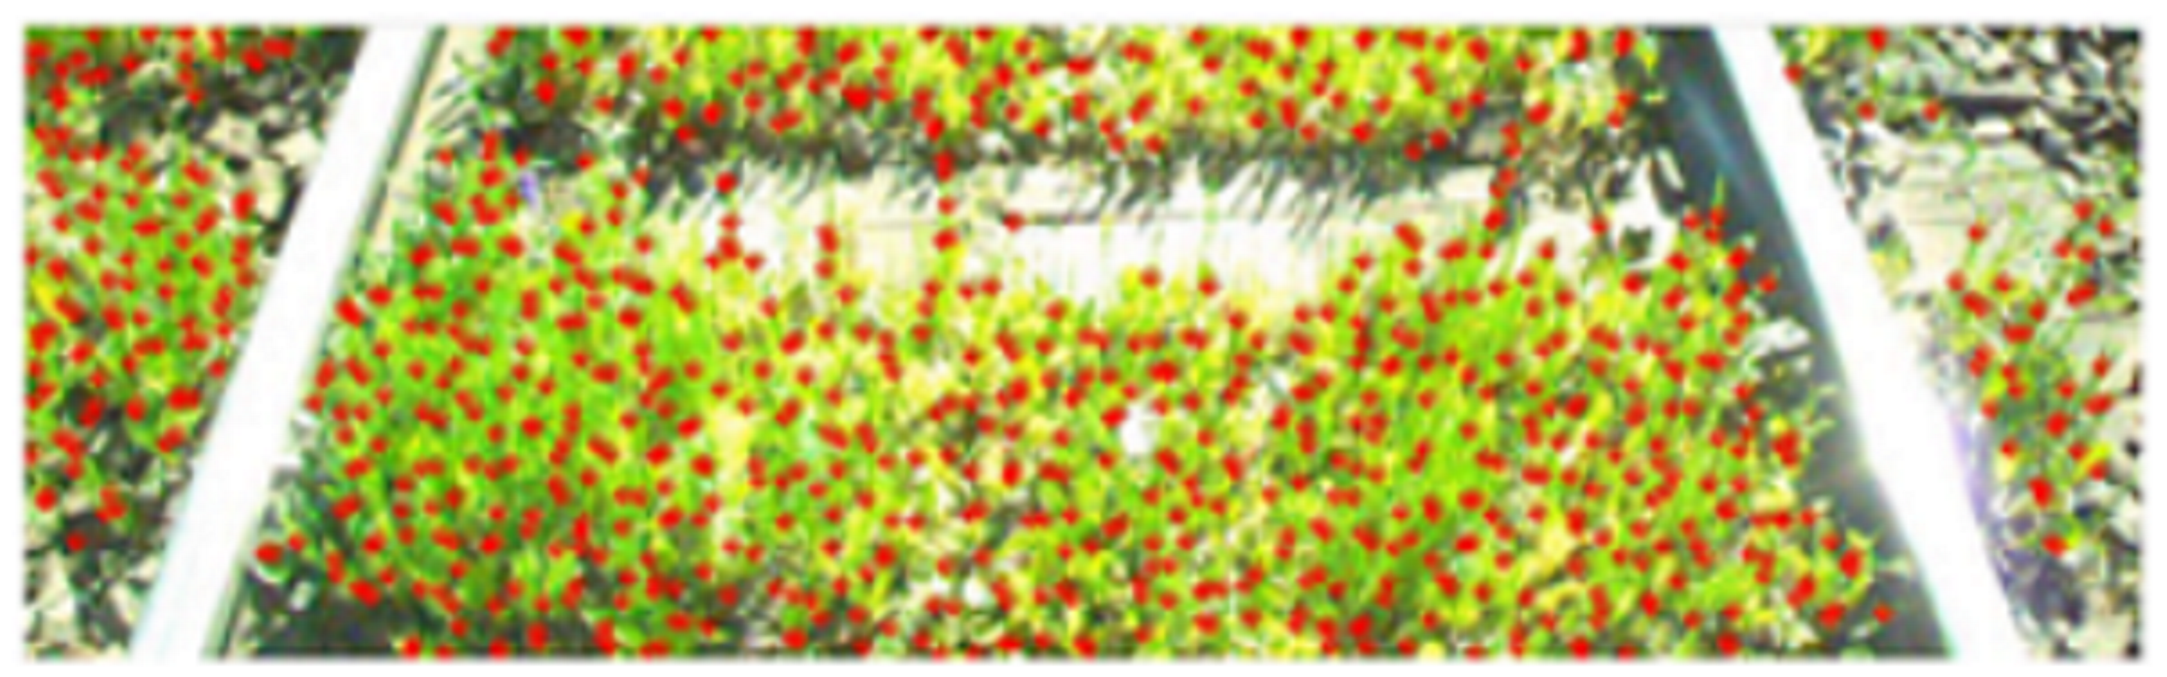
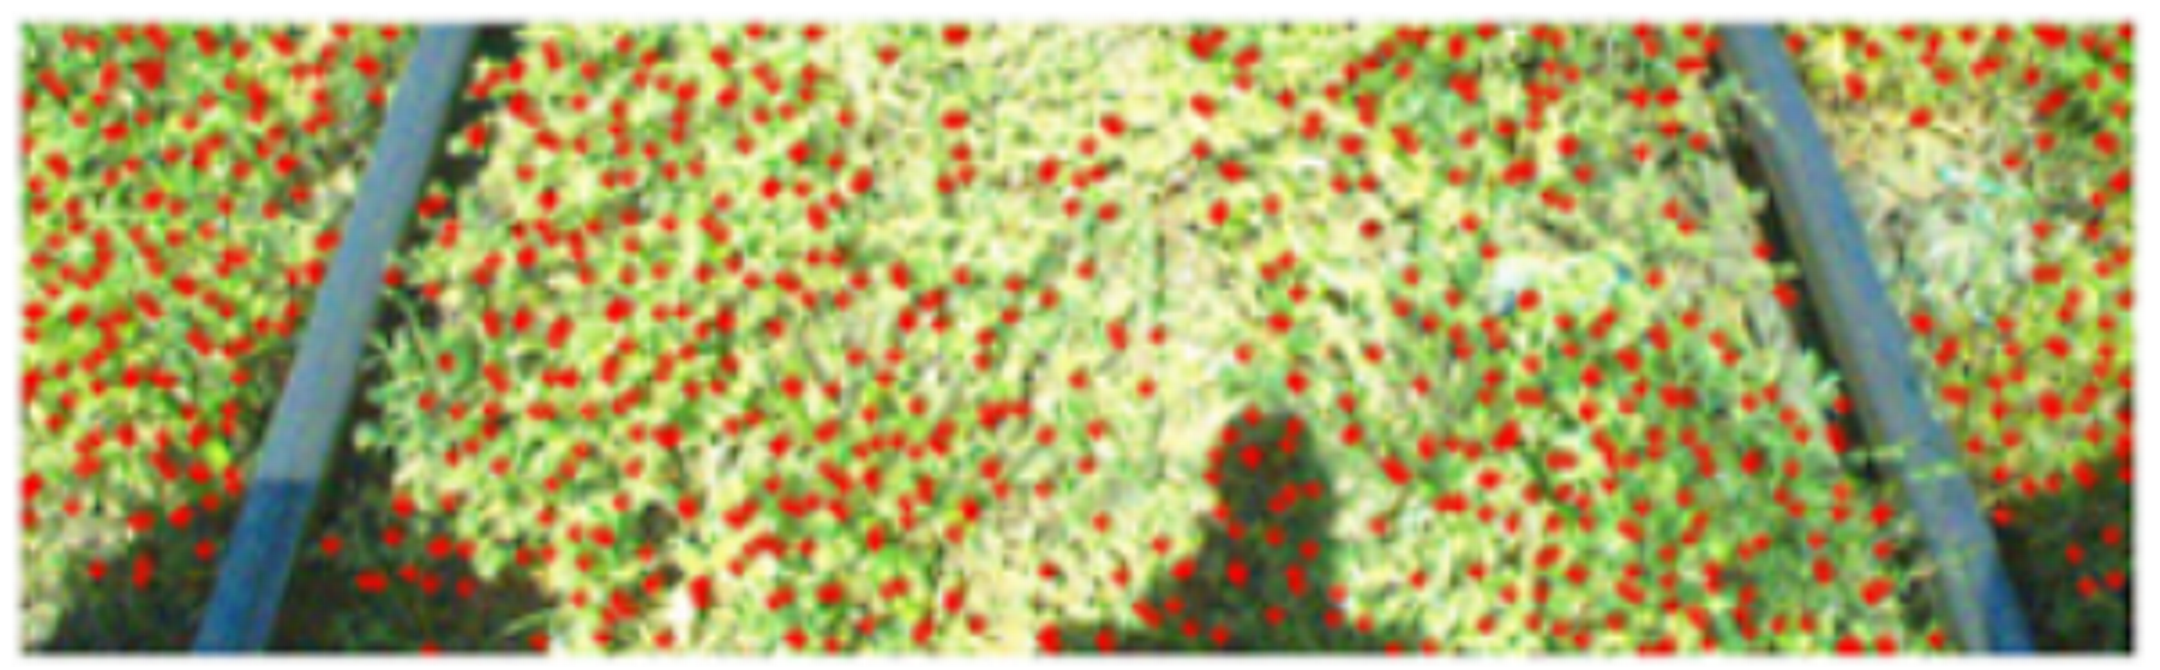
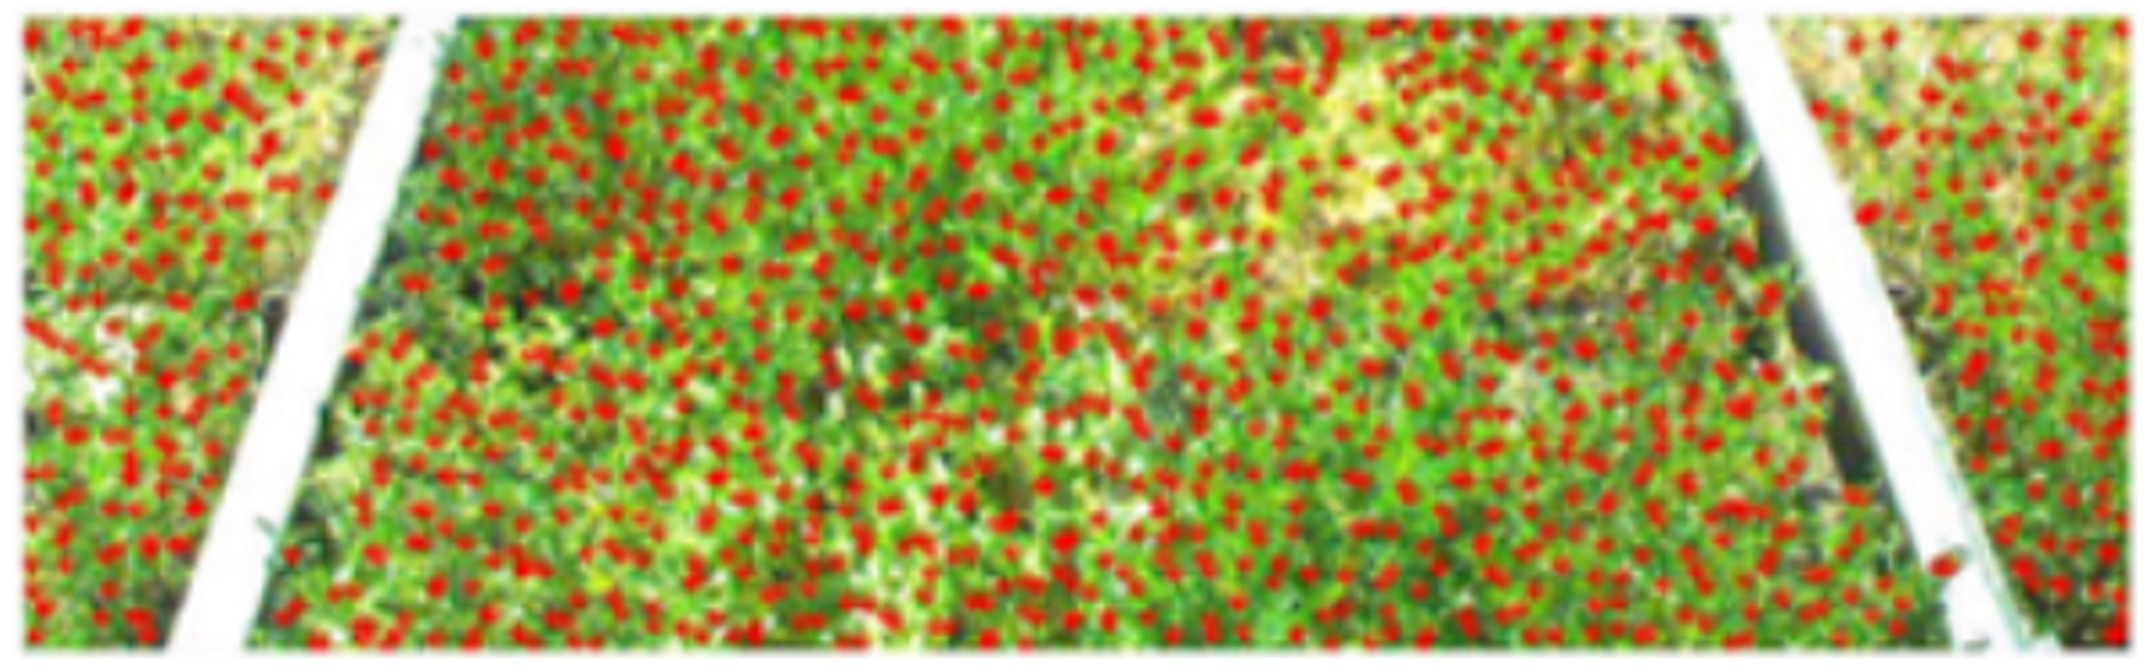
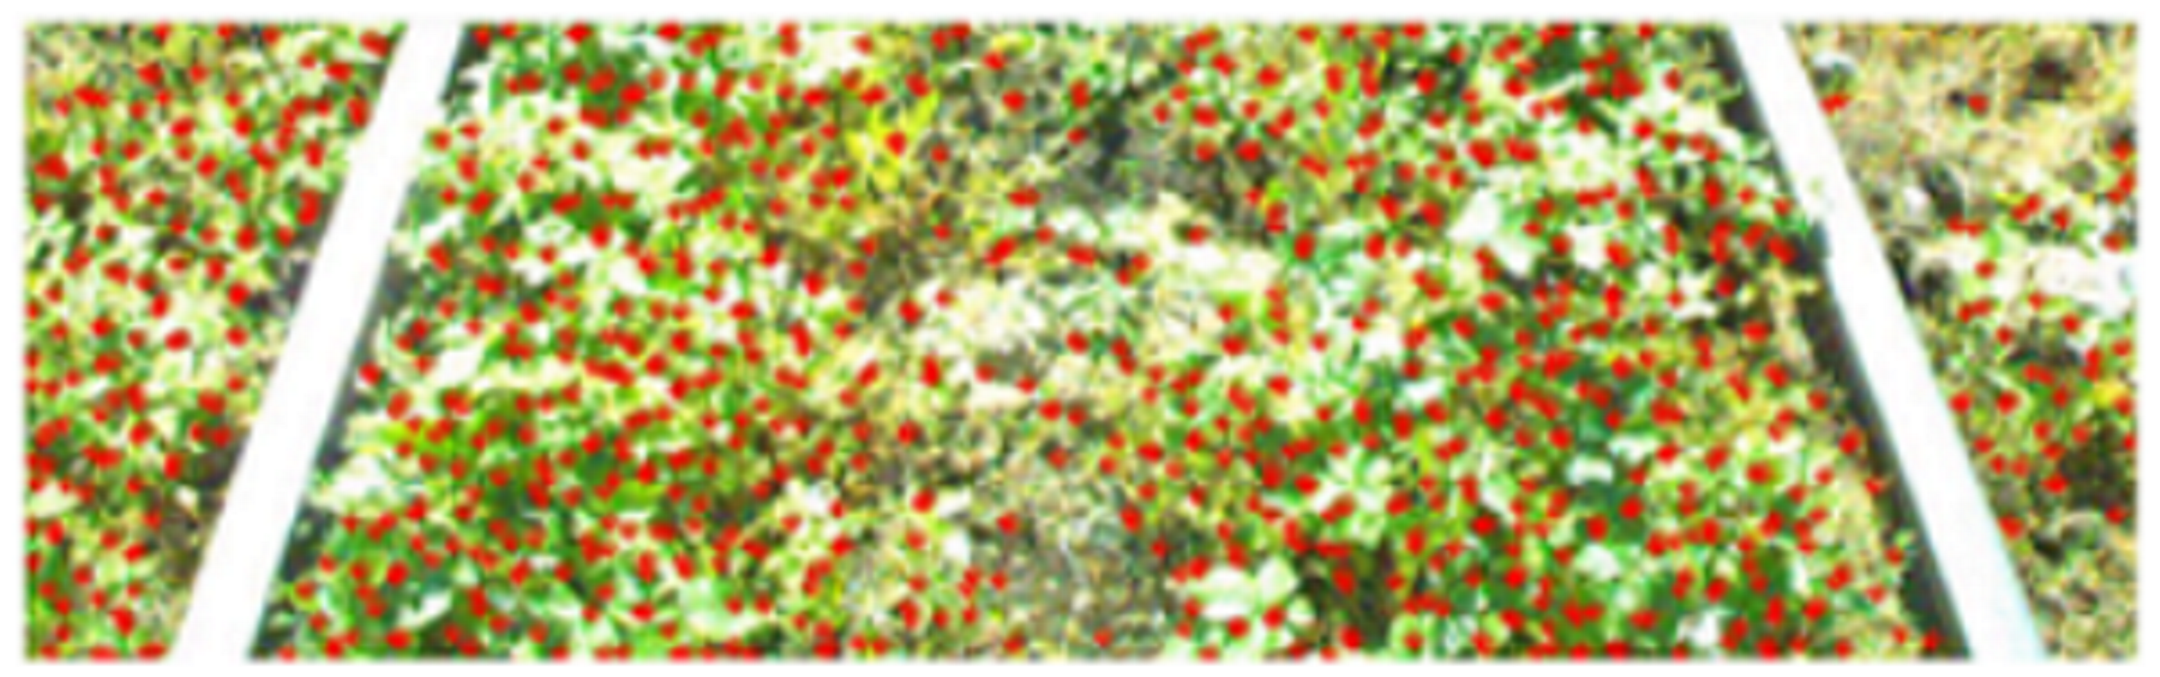
The measurements were performed using the Basler camera type acA1440-220uc with lens, the focal length of which was selected such that the camera’s view angle covered the entire track superstructure. The recording speed of the camera was 40 frames per second, which enabled recording of the examined railway line segment over its whole length. Individual images recorded in the above way were then analysed using the LabVIEW platform. The built-in colour image analysis algorithms were used to find fragments which coincided in colour with the selected standard. Three colour standards were used, having the form of images of 8 × 8 pixels in dimension, which corresponded to three shades of green occurring in the vegetation cover. Colour standards were obtained by cutting out the appropriate fragments from selected image frames. The patterns corresponded to the actual shades of green in the image. Before the analysis, each recorded frame was cut to size to remove redundant fragments situated beyond the track superstructure area. Successive stages of the image analysis are shown in Table 1.

Table 1.
Image analysis stages of unwanted vegetation detection on railway track.
As shown in Table 1, the method was successful in detecting unwanted vegetation in the area of the railway track superstructure. The infested areas were detected, and the number of matches indicates the weed infestation intensity in the track superstructure area.
4. Results of Measurements
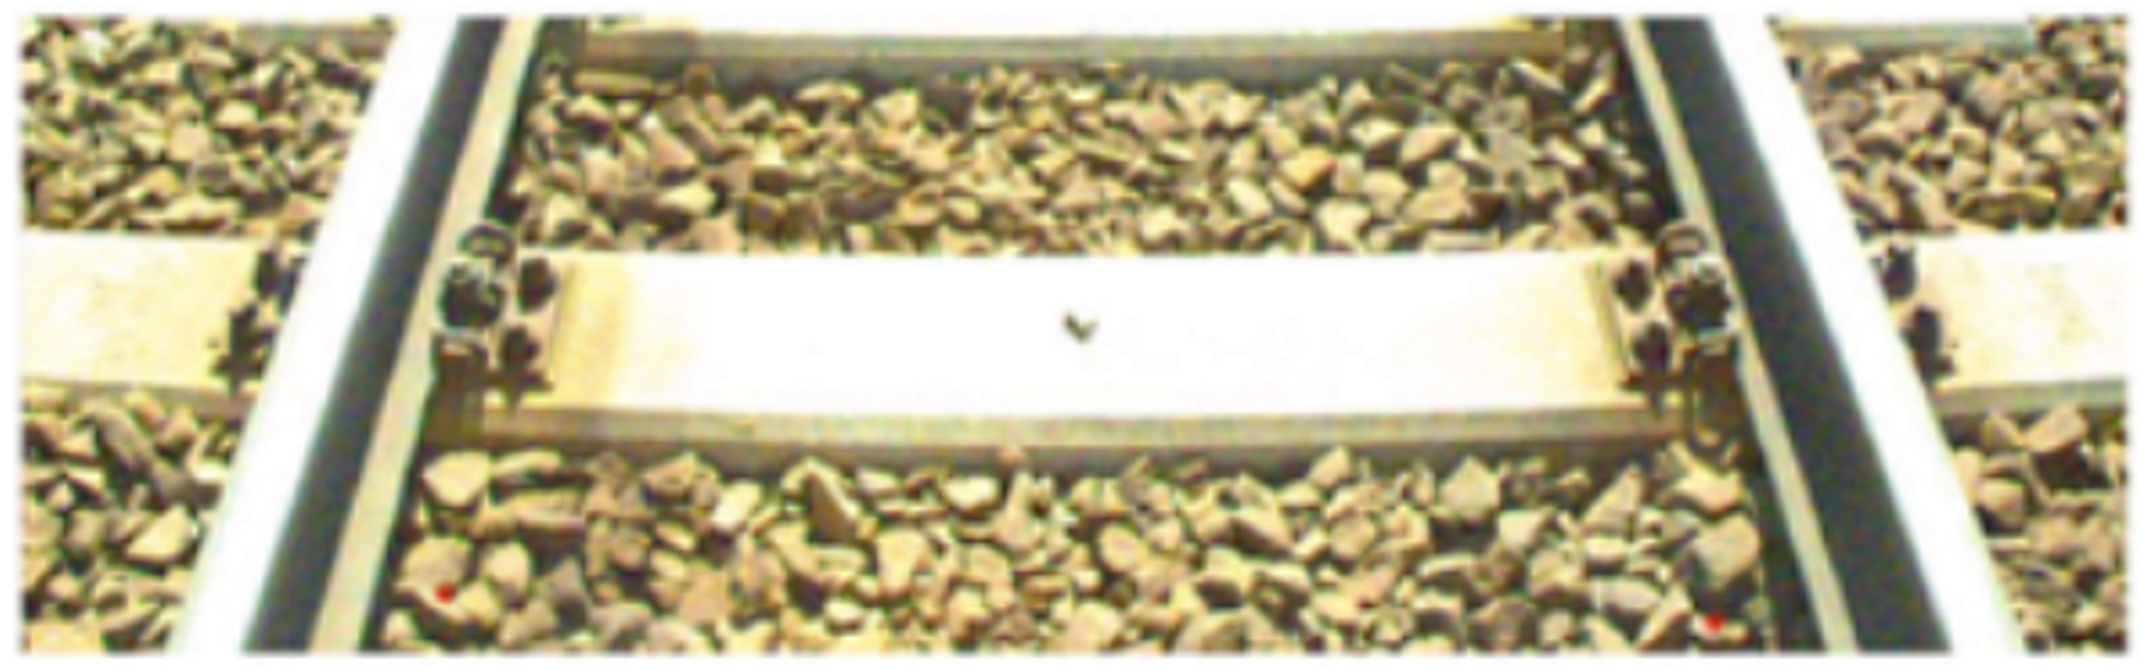
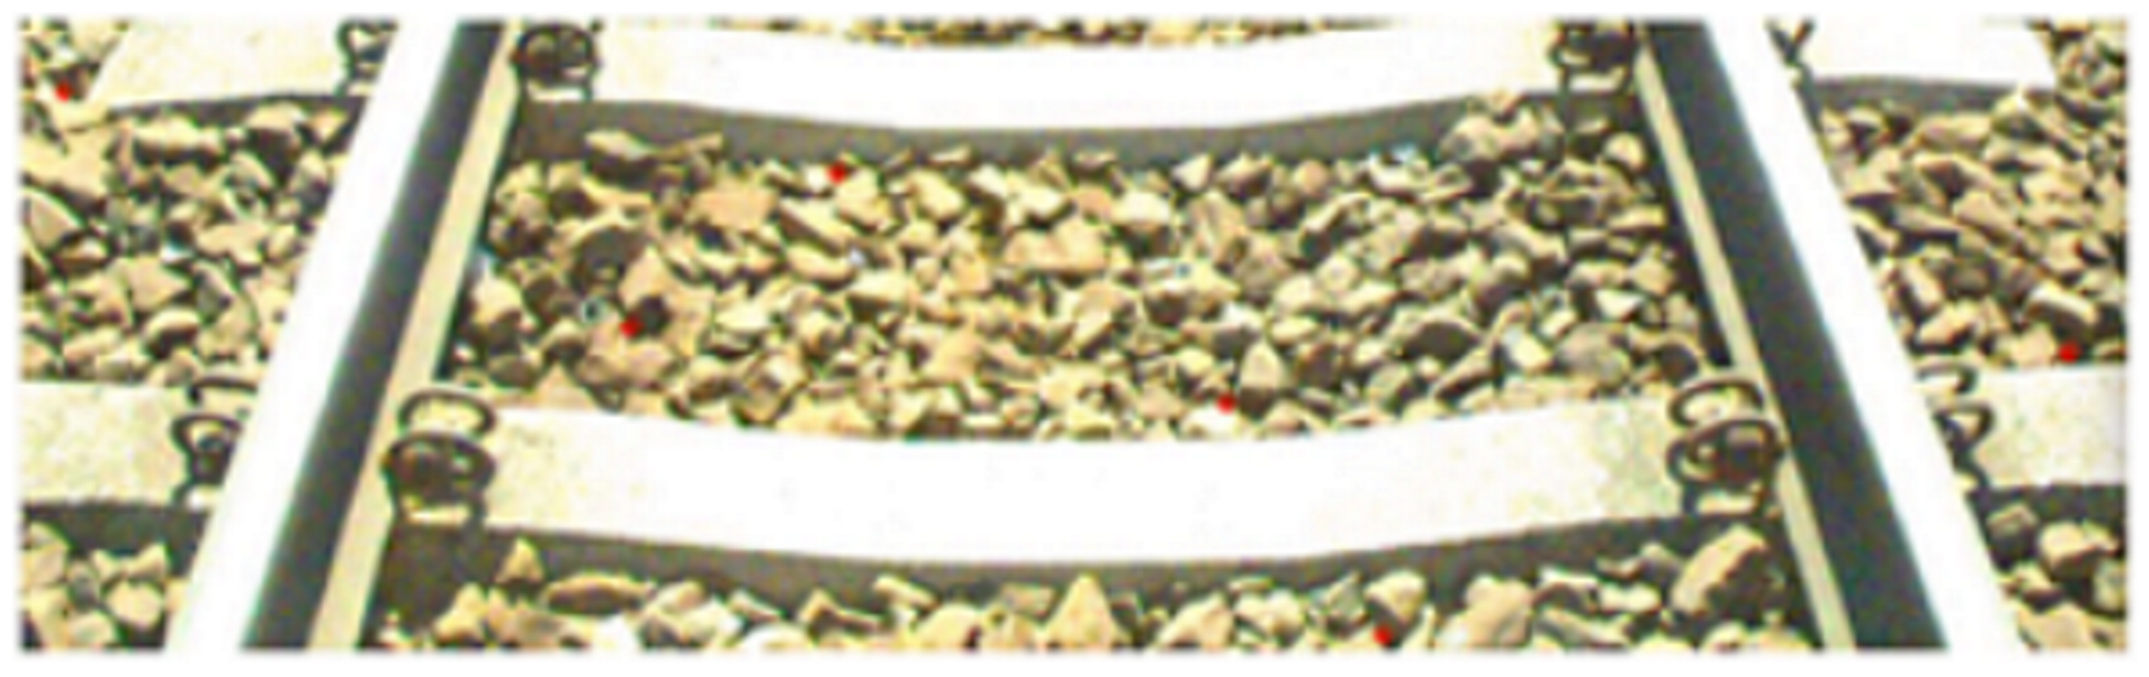
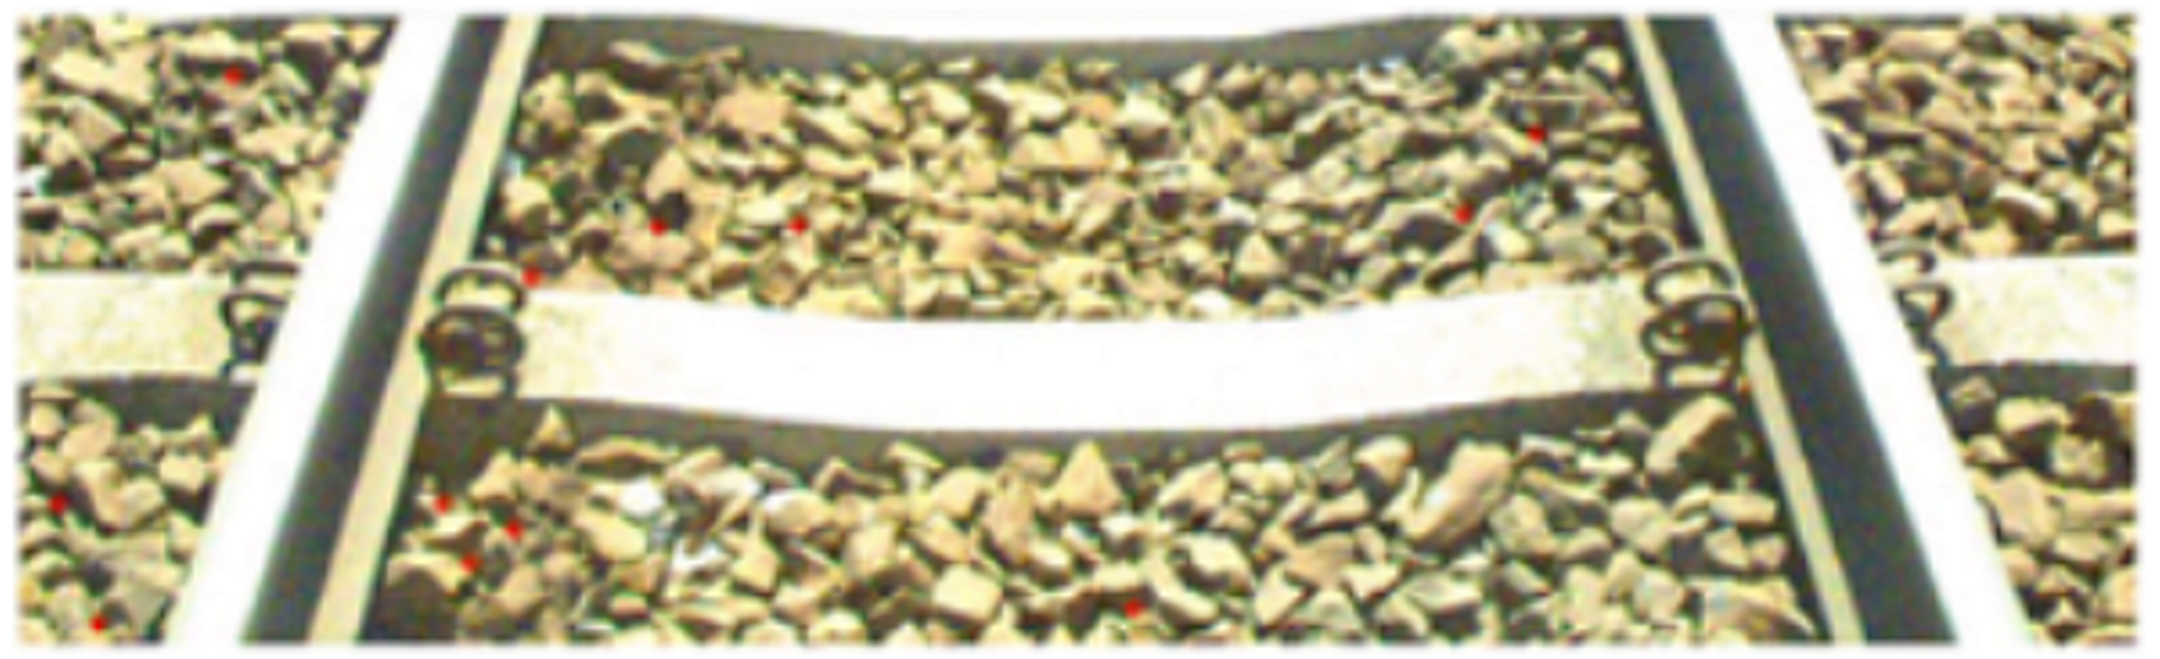
The measurements designed to verify the railway track superstructure weed infestation level assessment method were taken on a length of railway line which included sections with different degradation levels. The condition of the analysed sections varied from very good to heavily degraded. The analysis of the obtained results included the assessment of such elements as system sensitivity, reliability of detection, and sensitivity to external agents including light dimming, change of light incidence angle, etc. Selected results of measurements for different track superstructure maintenance states and varying values of remaining parameters are collated in Table 2, Table 3, Table 4 and Table 5.
Table 2.
Selected measurement results for well-maintained track.
Table 3.
Selected measurement results for the occurrence of single small plants.
Table 4.
Selected measurement results for the occurrence of vegetation cover with moderate intensity.
Table 5.
Selected measurement results for extremely infested track superstructure.
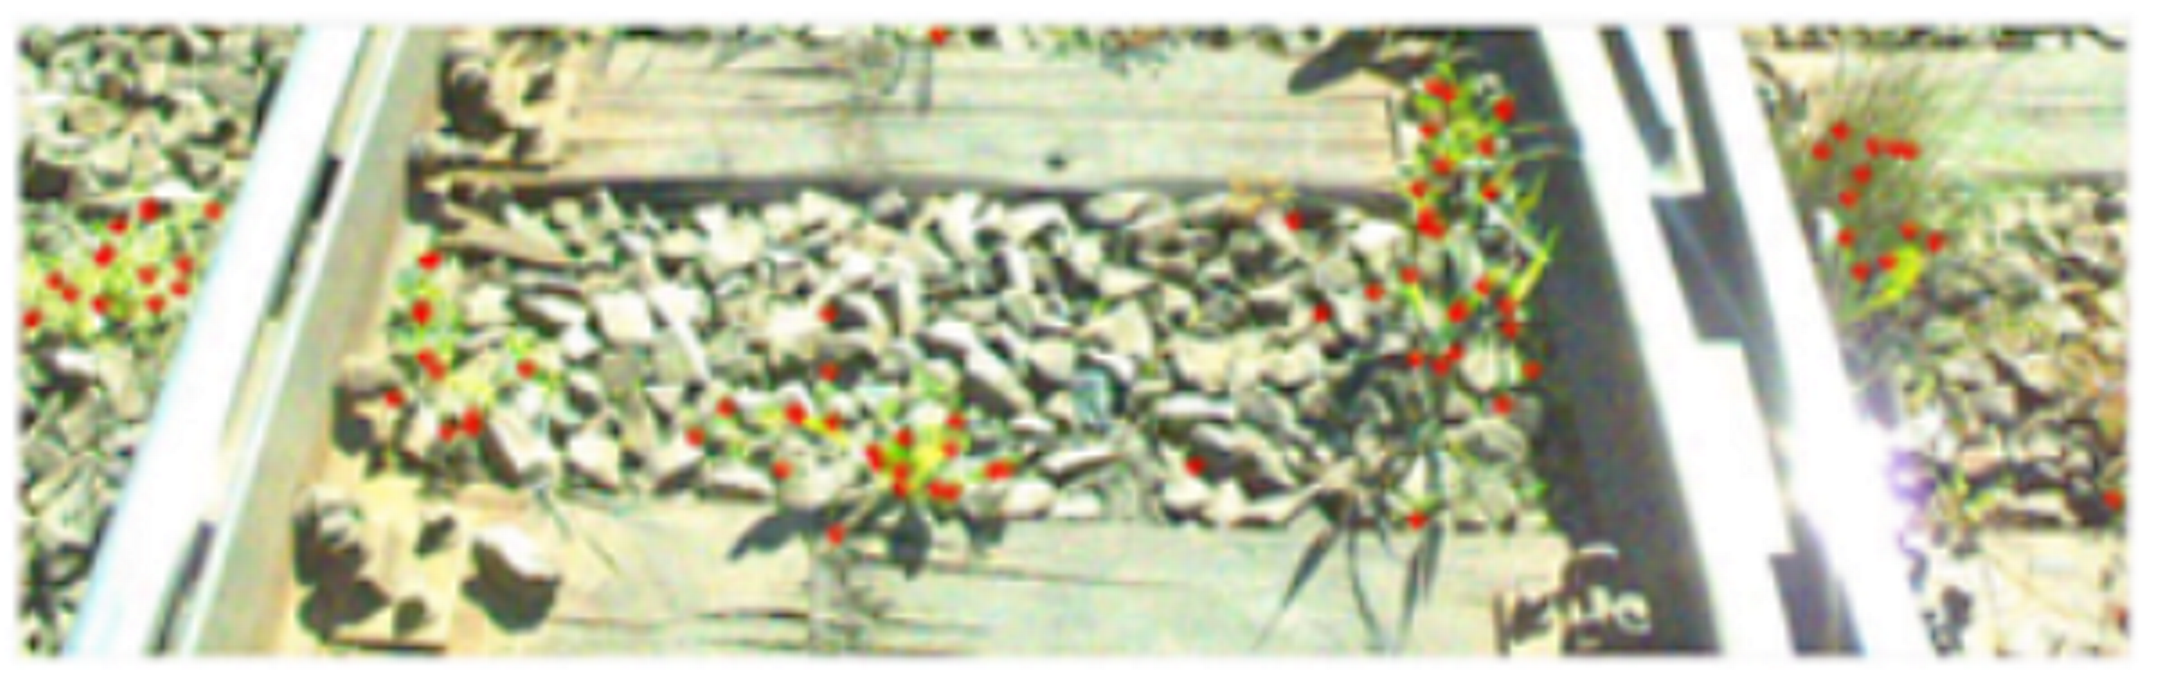
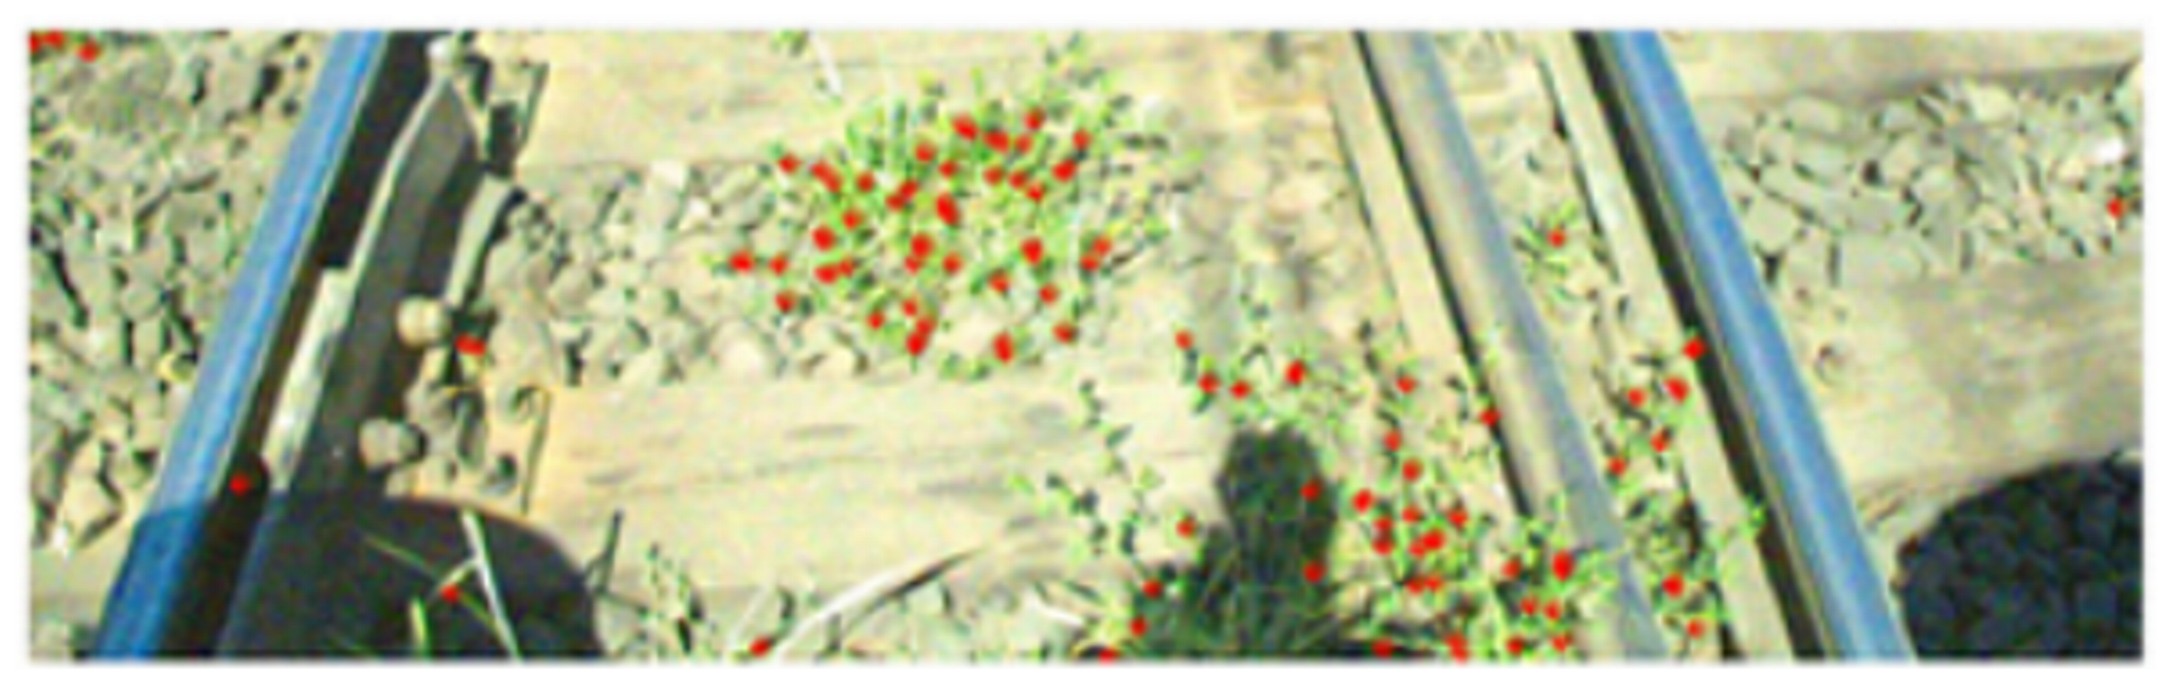
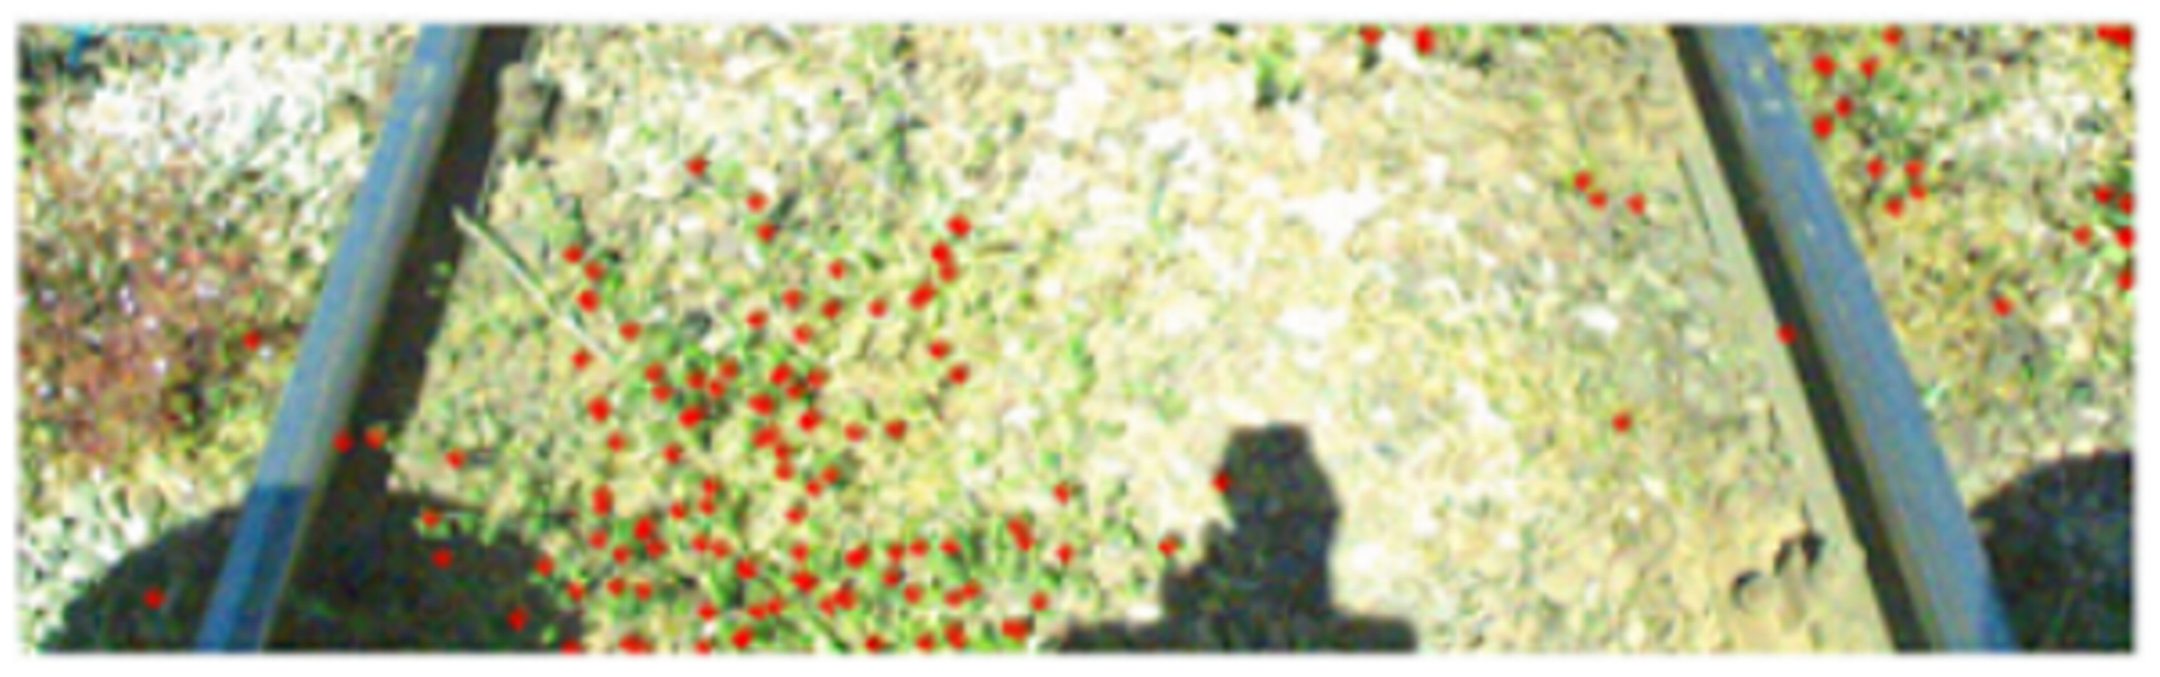
The measurement results obtained from individual images provide an opportunity to assess infested areas on which unwanted vegetation occurs. Selected results of this assessment are shown in Figure 4 and Figure 5.
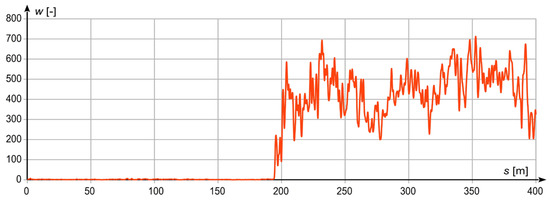
Figure 4.
Assessment of the area with unwanted vegetation—case 1.
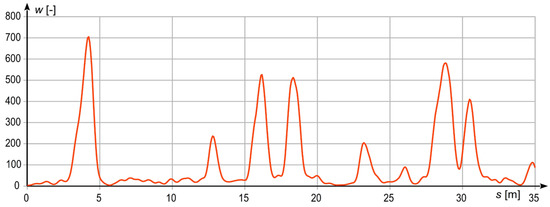
Figure 5.
Assessment of the area with unwanted vegetation—case 2.
Case 1, shown in Figure 4, illustrates the measurements taken when passing from a well-maintained section of railway to one with considerable weed infestation. When the measuring flatcar moved through the section without unwanted vegetation, the measurement signal w revealed minor oscillations about zero. After entering the infested section, the signal w increased to an average value of about 500, which testifies to a high level of railway track weed infestation.
Case 2, shown in Figure 5, represents a short railway track fragment characterised by moderate maintenance levels and the occurrence of isolated spots of high weed infestation. The signal w changed value from 20–30 up to as much as 700 in the most infested places.
5. Conclusions
The results in Table 2, Table 3, Table 4 and Table 5 and in Figure 4 and Figure 5 testify to the correctness of operation of the railway-track weed infestation level detection system in the majority of cases. Vegetation with moderate or high intensities of occurrence was detected unmistakably in all cases. Some problems appeared when detecting single small plants, because in these cases the generated measurement signal was not strong enough to be unmistakably distinguished from the measurement noise observed in the absence of vegetation. This problem cannot be solved simply by increasing the detection sensitivity, as in this case the noise level also increased, which resulted in an increasing number of false matches characteristic of well-maintained track. The planned further research will include an attempt to solve this problem by using a higher-resolution camera. The image assessment algorithms require images with minimal dimensions of 8 × 8 pixels. The use of a higher-resolution camera is expected to provide opportunities for detecting smaller objects (plants) than those presently detecable. Another planned task consists in linking the results of the weed infestation level analysis with the absolute position of the measuring flatcar, to provide an opportunity for precise detection of places in which unwanted vegetation occurs.
Despite the abovementioned minor drawback, the presented results confirm high usability of the system for assessing railway-track weed infestation level. The results shown in Figure 5, especially, reveal the system’s great potential for assessing places of unwanted vegetation occurrence in both qualitative and quantitative terms. Based on the level of signal w, the intensity of required sprayings can be assessed for a given area, which will enable control of the emission of harmful substances into the environment, decreasing application levels to the minimum required to remove unwanted vegetation from the railway track superstructure.
Author Contributions
J.D.S.: conceptualization, methodology, software, validation, formal analysis, investigation, writing—original draft preparation, R.L.: investigation, writing—review and editing. All authors have read and agreed to the published version of the manuscript.
Funding
The measurements were performed during implementation of the research project entitled “Developing an innovative method to determine the precise rail vehicle trajectory” which has been co–financed by the National Centre for Research and Development, within the framework of the Operational Programme Smart Growth (POIR.04.01.01-00-0017/17-00), and by PKP Polish Railway Lines S.A. It was carried out during the period from 28 June 2018 to 31 May 2021, as part of a joint undertaking entitled “BRIK—Research and Development in Railway Infrastructure”. The BRIK support programme was jointly operated by the National Centre for Research and Development and PKP Polish Railway Lines S.A. Project acronym: InnoSatTrack. Apart from the authors of the paper, the following persons participated in the project implementation: A. Wilk, C. Specht, W. Koc, K. Karwowski, S. Judek, J. Szmaglinski, P. Chrostowski, M. Specht, P. Dąbrowski, S. Grulkowski, M. Michna, A. Stateczny, P. Burdziakowski, O. Lewicka.
Institutional Review Board Statement
Not applicable.
Informed Consent Statement
Not applicable.
Data Availability Statement
The obtained measurement data is confidential and therefore is not on a publicly accessible server.
Acknowledgments
The authors would like to thank Polish Railway Lines in Gdynia for providing opportunities for performing the measuring campaign.
Conflicts of Interest
The authors declare no conflict of interest.
References
- PKP Polskie Linie Kolejowe S.A. Guidelines for Railway Superstructure Diagnostics ID-8; PKP Polskie Linie Kolejowe S.A: Warsaw Poland, 2005. (In Polish) [Google Scholar]
- Sedghi, M.; Kauppila, O.; Bergquist, B.; Vanhatalo, E.; Kulahci, M. A taxonomy of railway track maintenance planning and scheduling: A review and research trends. Reliab. Eng. Syst. Saf. 2021, 215, 107827. [Google Scholar] [CrossRef]
- Yella, S.; Dougherty, M.; Gupta, N.K. Condition monitoring of wooden railway sleepers. Transp. Res. Part C Emerg. Technol. 2009, 17, 38–55. [Google Scholar] [CrossRef]
- Danesh, A.; Palassi, M.; Mirghasemi, A.A. Evaluating the influence of ballast degradation on its shear behaviour. Int. J. Rail Transp. 2018, 6, 145–162. [Google Scholar] [CrossRef]
- Bałuch, M. Interpretation of Railway Superstructure Measurements and Observations; Wydawnictwo Politechnika Radomska: Radom, Poland, 2005. (In Polish) [Google Scholar]
- Bałuch, H. Combined Limit Values in Railway Track Superstructure Diagnostics. In Archiwum Instytutu Inżynierii Lądowej nr 25; Archives of Institute of Civil Engineering: Poznań, Poland, 2017. (In Polish) [Google Scholar]
- Torstensson, L. Use of herbicides on railway tracks in Sweden. Pestic. Outlook 2001, 12, 16–21. [Google Scholar] [CrossRef]
- Schweinsberg, F.; Abke, W.; Rieth, K.; Rohmann, U.; Zullei-Seibert, N. Abbreviated Journal Name Herbicide use on railway tracks for safety reasons in Germany? Toxicol. Lett. 1999, 107, 201–205. [Google Scholar] [CrossRef]
- Torstensson, L.; Cederlund, H.; Börjesson, E.; Stenström, J. Environmental problems with the use of diuron on Swedish railways. Pestic. Outlook 2002, 13, 108–111. [Google Scholar] [CrossRef]
- Castillo-Mingorance, J.M.; Sol-Sánchez, M.; Moreno-Navarro, F.; Rubio-Gámez, M.C. A Critical Review of Sensors for the Continuous Monitoring of Smart and Sustainable Railway Infrastructures. Sustainability 2020, 12, 9428. [Google Scholar] [CrossRef]
- Li, H.; Parikh, D.; He, Q.; Qian, B.; Li, Z.; Fang, D.; Hampapura, A. Improving rail network velocity: A machine learning approach to predictive maintenance. Transp. Res. Part C Emerg. Technol. 2014, 45, 17–26. [Google Scholar] [CrossRef]
- de Bruin Verbert, K.; Babuška, R. Railway Track Circuit Fault Diagnosis Using Recurrent Neural Networks. IEEE Trans. Neural Netw. Learn. Syst. 2017, 28, 523–533. [Google Scholar] [CrossRef] [PubMed]
- Zhan, D.; Jing, D.; Wu, M.; Zhang, D.; Yu, L.; Chen, T. An accurate and efficient vision measurement approach for railway catenary geometry parameters. IEEE Trans. Instrum. Meas. 2018, 67, 2841–2853. [Google Scholar] [CrossRef]
- Skibicki, J. The issue of uncertainty of visual measurement techniques for long distance measurements based on the example of applying electric traction elements in diagnostics and monitoring. Measurement 2018, 113, 10–21. [Google Scholar] [CrossRef]
- Cho, C.J.; Park, Y. New monitoring technologies for overhead contact line at 400 km·h−1. Engineering 2016, 2, 360–365. [Google Scholar] [CrossRef] [Green Version]
- Liu, Z.; Liu, W.; Han, Z. A high-precision detection approach for catenary geometry parameters of electrical railway. IEEE Trans. Instrum. Meas. 2017, 66, 1–11. [Google Scholar] [CrossRef]
- Judek, S.; Jarzebowicz, L. Wavelet transform-based approach to defect identification in railway carbon contact strips. Elektron. Ir Elektrotechnika 2015, 21, 29–33. [Google Scholar] [CrossRef] [Green Version]
- Stefano, E.D.; Ruffaldi, E.; Avizzano, C.A. Automatic 2D-3D vision based assessment of the attitude of a train pantograph, In Proceedings of the 2016 IEEE International Smart Cities Conference (ISC2). Presented at the 2016 IEEE International Smart Cities Conference (ISC2), Trento, Italy, 12–15 September 2016; pp. 1–5. [Google Scholar] [CrossRef]
- Al-Qadi, I.L.; Xie, W.; Roberts, R. Scattering analysis of ground-penetrating radar data to quantify railroad ballast contamination. NDT E Int. 2008, 41, 441–447. [Google Scholar] [CrossRef]
- Guo, Y.; Liu, G.; Jing, G.; Qu, J.; Wang, S.; Qiang, W. Ballast fouling inspection and quantification with Ground Penetrating Radar (GPR). Int. J. Rail Transp. 2022, 1–18. [Google Scholar] [CrossRef]


Publisher’s Note: MDPI stays neutral with regard to jurisdictional claims in published maps and institutional affiliations. |
© 2022 by the authors. Licensee MDPI, Basel, Switzerland. This article is an open access article distributed under the terms and conditions of the Creative Commons Attribution (CC BY) license (https://creativecommons.org/licenses/by/4.0/).