Abstract
Background. Secondary hyperparathyroidism (SHPT) is a major risk factor for cardiovascular events and all-cause mortality in hemodialysis (HD) patients. The purpose of our study was to evaluate the effects and tolerability of etelcalcetide in HD patients with SHPT. Methods. An observational study was conducted on 16 hemodialysis patients with SHPT treated with etelcalcetide. All patients were followed up for a duration of 6 months. The primary endpoints were the reduction in mean PTH ≥ 30% and ≥40% from baseline after 6 months of etelcalcetide. All patients were divided into two groups (group A versus group B) based on baseline serum PTH level prior to etelcalcetide: above and below the median serum PTH (1300 pg/mL), respectively. Results. After 6 months, a significant decrease in PTH levels was achieved by all patients receiving etelcalcetide (p = 0.015). Both primary endpoint of reduction in PTH ≥ 40% at 6 months (p = 0.01), and the secondary endpoint of reduction in median PTH values (p = 0.0001) and median percentage reduction in PTH values (p = 0.009) were significantly achieved in group A. In contrast, a greater decline of calcium (p = 0.028) and phosphorus was reached in group B than group A. Dialysis vintage ≥ 36 months, arteriovenous fistula (AVF)-based hemodialysis, post-diluition hemodiafiltration (HDF) method, and baseline values of PTH < 1300 pg/mL can positively influence the achievement of the endpoints. Furthermore, the baseline PTH < 1300 pg/mL, among these variables, was the only one showing statistically significant relevance (OR 2.28, 95% CI 1.32–3.96, p = 0.015). The history of cinacalcet use negatively correlated with the possibility to reach therapeutic targets with etelcalcetide (OR 0.47, 95% CI 0.26–0.85, p = 0.031). Treatment with etelcalcetide was well tolerated and no adverse effects were observed. Conclusions. In our study, patients with low baseline PTH levels showed a better response to etelcalcetide than patients with higher PTH levels. Consequently, the possibility to reach desirable therapeutic targets could depend on SHPT severity at the time of initiation of therapy.
1. Introduction
Secondary hyperparathyroidism (SHPT) is a common and clinically relevant complication of CKD, especially in patients undergoing dialysis treatment. It is a major risk factor of cardiovascular events and all-cause mortality in this patient population. In Italy, 80% of hemodialysis patients, equal to about 34,000 subjects, are affected by SHPT [1]. SHPT is initially an adaptive and subsequently maladaptive process, which develops in response to the progressive impairment of renal function and related biochemical alterations. The deficiency of active vitamin D, hypocalcemia, hyperphosphatemia, and the increase in fibroblast growth factor 23 (FGF-23) levels are the main culprits of SHPT.
The 2017 Kidney Disease: Improving Global Outcomes (KDIGO) guidelines recommend that PTH lowering medications should be initiated when repeated increases in PTH levels are observed in order to delay and/or contain the progression of SHPT. It is believed that the chronic and incongruous stimulation of the parathyroid glands to produce PTH leads to structural changes in the glands themselves which, over time, become progressively more insensitive to the feedback mechanisms of PTH synthesis and to medical therapy [2]. Late treatment of the SHPT could therefore affect the effectiveness of the treatment itself. Since the pathogenesis of SHPT is multifactorial, its treatment strategies are diverse and mainly aimed at maintaining serum levels of Ca, P, and vitamin D within normal ranges and, consequently, at reducing the PTH secretion and restoring normal metabolism and bone development. Many classes of drugs, including phosphorus binders and native (cholecalciferol and calcifediol) and active (calcitriol and vitamin D analogs) calcimimetics, have been developed to directly or indirectly control CKD-mineral and bone disorder (CKD-MBD) markers. The KDIGO guidelines, however, do not give priority to any drug, but suggest the use of calcimimetics, calcitriol, vitamin D analogs, or any combinations of calcimimetics with calcitriol or vitamin D analogs for patients on dialysis requiring PTH-lowering therapy [3]. Despite the indisputable role of phosphorus chelators and vitamin D supplementation, the advent of calcimimetics has profoundly changed and upgraded the SHPT therapeutic approach. These drugs allosterically modulate the calcium-sensing receptor (CaSR) and increase the sensitivity of the receptor to extracellular calcium, thus reducing the calcium set-point, and consequently inhibiting the glandular cells proliferation and PTH secretion [4]. Furthermore, calcimimetics cause a reduction in FGF-23 and serum P levels, which improves the control of homeostasis of calcium-phosphoric metabolism [5]. Currently the lack of treatment adherence is still a big obstacle rendering the SHPT management difficult to achieve the goals set by international guidelines [3].
In clinical trials, cinacalcet, the first approved calcimimetic, has shown an excellent result on dialysis patients with SHPT. Particularly its efficacy to significantly reduce serum PTH [6], P, and Ca-P product is consistent in a wide range of patients regardless of age, sex, race, dialysis vintage, or disease severity [7,8]. Unfortunately, the oral route of administration of cinacalcet, in some cases, is complicated by its conspicuous gastrointestinal side effects (nausea/vomiting), which effectively reduce the patient adherence. For this reason, it was necessary to develop an alternative therapy, so-called etelcalcetide.
Etelcalcetide, an intravenous calcimimetic agent, is a synthetic allosteric activator of the CaSR receptor. It increases the sensitivity of CaSR receptor to calcium, which reduces the PTH secretion and consequently the circulating levels of PTH. In addition, etelcalcetide was associated with greater reductions in markers of bone mineral metabolism (bone alkaline phosphatase and C-terminal peptide peptide type I collagen) and in FGF-23 compared with both placebo and cinacalcet [9,10,11,12]. Its intravenous administration could improve compliance to the treatment of patients on hemodialysis with SHPT by providing an additional therapeutic option, especially for non-adherent patients, allowing healthcare professionals to have greater control over drug administration.
In previous clinical trials, etelcalcetide has demonstrated a good safety and tolerability profile in patients with SHPT on hemodialysis [9,13].
In our study, we further evaluated the efficacy and tolerability of etelcalcetide in a selected number of patients receiving hemodialysis with SHPT of varying severity levels.
2. Materials and Methods
This observational study was conducted by retrospectively collecting demographic, clinical, and laboratory data of CKD patients complicated with SHPT who underwent tri-weekly hemodialysis treatment at the Nephrology and Dialysis Operating Units of the San Paolo Hospital and San Carlo Hospital in Milan during the period between May 2019 and June 2020. All patients provided written informed consent via an institutional review board-approved form.
Patients were eligible for this study if at the time of accruement they were 18 years old or older and diagnosed with moderate or severe SHPT during the course of conventional treatment (PTH > 500 pg/mL, PTH > 9 times the upper limits of the norm) or not treatable with conventional therapies due to its adverse effects or poor therapeutic adherence. Included patients also must have their concentration of albumin-corrected serum calcium (cCa) or ionized calcium (iCa) above the lower limit of normal. Patients were excluded if they had any ECG abnormalities such as long QT syndrome.
In order to standardize the data, all included patients, except one, received their first dose of etelcalcetide treatment within this study period and were followed up for a period of 6 months.
Patients who, at the time of recruitment, were being treated with cinacalcet underwent a 1-week wash-out period before the treatment with etelcalcetide.
Blood samples to monitor the serum levels of PTH, calcium, phosphorus, hemoglobin, and alkaline phosphatase were collected at time zero (T0), at 3 months (T3), and at 6 months (T6) from the start of the therapy. Based on baseline PTH values prior to initiation of etelcalcetide therapy, patients were divided into two groups: Group A and Group B, who had baseline PTH values above and below the median PTH of all patients.
Age, dialysis vintage, type of vascular access (AVF vs. CVC), dialysis modality (HDF vs. HD, HDF post-dilution vs. HDF pre-dilution), baseline PTH and phosphorus levels, and previous cinacalcet therapy were considered in order to identify the predictive indices of the achievement of the predetermined targets.
2.1. Endpoints
The primary endpoints were ≥30% and ≥40% reduction from baseline mean PTH concentrations at 6 months from the start of treatment with etelcalcetide. The secondary endpoints were the reduction of the mean and median values of PTH, Ca, P, ALP, median percentage changes from baseline in PTH, Ca, and P, and the influence of different factors to achieve the therapeutic target of etelcalcetide and its tolerability as well as adverse effects.
2.2. Statistical Analysis
Categorical variables were described as frequency and percentage. Continuous variables were described as mean ± standard deviation or median interquartile range appropriately based on their data distribution (normal or non-normal respectively). The distribution of the data was analyzed using the Shapiro–Wilk test. Patients’ baseline characteristics were compared between group A and group B using the Mann–Whitney U test for continuous variables and the Fisher exact test for categorical variables. Blood chemistry tests were compared between group A and group B at the start of treatment (T0) and after 3 and 6 months (T3 and T6 respectively) using the Mann–Whitney U test. In addition, in the total of patients and within each group, the changes in blood chemistry parameters between T0 and T3, T0 and T6 were analyzed using the Wilcoxon signed-rank test. The frequencies of achievement of the fixed endpoints between the two groups were compared using the Fisher exact test. The associations between different variables and endpoints were analyzed using univariate and multivariate logistic regression models and their causalities were further extrapolated based on their clinical plausibility.
The threshold for statistical significance was determined at p-value < 0.05. The R 4.0.0 software was used for the statistical analysis.
3. Results
3.1. Baseline Characteristics
Sixteen patients diagnosed with moderate-to-severe SHPT were enrolled for the study. The baseline demographics and anamnestic characteristics of all accrued patients are shown in Table 1. Nine of the sixteen patients were on cinacalcet therapy at the time of recruitment. The baseline laboratory values (T0) are shown in Table 2. The median value of PTH 1300 pg/mL allowed the subdivision of the patients into the two aforementioned groups, each consisting of eight patients (group A with baseline PTH < 1300 pg/mL and group B with baseline PTH ≥ 1300 pg/mL).

Table 1.
Characteristics of the study population. Abbreviations: HD, hemodialysis, bicarbonate dialysis; HDF pre, pre-dilution hemodiafiltration; Post HDF, post-dilution hemodiafiltration. Categorical variables are expressed in number (percent), continuous variables in mean ± standard deviation or, in case of non-Gaussian distribution, in median [interquartile range].
Table 2.
Baseline values of the biochemical parameters evaluated in the study. Abbreviations: PTH, parathyroid hormone; Ca2+, ionized calcium; cCa, total serum calcium corrected for albumin values; P, phosphorus; Hb, hemoglobin; ALP, alkaline phosphatase. Values are expressed as mean ± standard deviation or, in case of non-Gaussian distribution, as median [interquartile range].
3.2. Treatments with Etelcalcetide
Etelcalcetide was administered at the end of each hemodialysis session; it was started at 2.5 mg per hemodialysis session in 5 patients and 5 mg/session in 10 patients. Exceptionally, one patient received his initial etelcalcetide dosage of 7.5 mg/session, which was titrated during his previous hemodialysis sessions at another dialysis center. The median weekly dosage at T0 was 15 mg [7.5–15]. During the observation period, the median weekly dosage remained unchanged although the interquartile interval gradually narrowed as a result of the progressive drug titration: from 15 mg [9.4–15] at T3 to 15 mg [11.3–15] at T6. The changes in dose at T3 and T6 were: 2.5 mg/session in four patients at T3 and in three patients at T6; 5 mg/session in 10 patients at T3 and in nine patients at T6; 7.5 mg/session in two patients at T3 and in one patient at T6; 10 mg/session in only one patient at T6 and only one patient belonging to group A, at T6, discontinued the treatment due to excessive suppression of PTH values (69 pg/mL) (Figure 1).
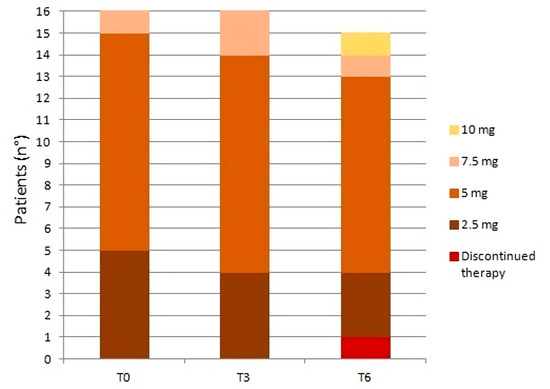
Figure 1.
Changes in etelcalcetide dosage (mg/session) at T0, T3, and T6.
3.3. Other Therapies
During time of observation, in both groups, no changes were made to the therapies with chelating agents, either calcium-based (calcium carbonate, calcium acetate/magnesium carbonate) or calcium-free (sevelamer, lanthanum carbonate, sucroferric hydroxide). There were some adjustments in the vitamin D usage in both groups between T3 and T6 (Figure 2). Specifically, in group A the number of patients receiving native vitamin D at T6 decreased from three patients (38%) to two patients (25%), while the opposite trend was observed in patients receiving active vitamin D or analogs (from three patients (38%) at T3 to five patients (63%) at T6). In group B the number of patients receiving native vitamin D remained unchanged (50%, 4 patients), while in patients receiving active vitamin D or analogs it decreased by 25% from T0 to T6 (5/8 patients at T0 and 3/8 at T6).
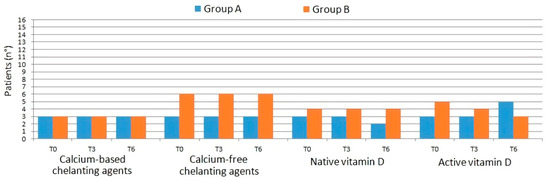
Figure 2.
Changes in concomitant therapies with chelating agents and vitamin D in the two groups.
3.4. Primary Endpoints
The reduction of 30% or more in PTH level from baseline at 6 months occurred in 66.6% of all patients. No statistically significant difference was found between the two groups (p = 0.282; respectively 75% and 50% in group A and group B). The PTH reduction ≥ 40% compared to the baseline value at 6 months was achieved in 46.6% of patients. A significant difference was found, in reaching this endpoint, between the two groups: 75% of patients in group A compared with 13% in group B (p = 0.010) (Figure 3).
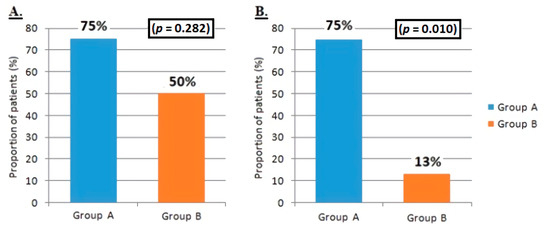
Figure 3.
Difference between group A and group B in achieving primary endpoints. (A) Reduction in the mean value of PTH ≥ 30% compared with the baseline value at 6 months from the start of treatment with etelcalcetide. (B) Reduction of the mean value of PTH ≥ 40% compared with the baseline value at 6 months from the start of treatment with etelcalcetide.
3.5. Secondary Endpoints
During the data collection period, the biochemical parameters reported in Table 3 were monitored. In addition to the reduction of the mean and median values of PTH, Ca, P, and ALP, the evaluation of the median percentage changes in PTH, Ca, P, and the assessment of the influence of different factors to achieve therapeutic target of etelcalcetide and its tolerability as well as adverse effects was also performed.
Table 3.
Mean and median changes in laboratory values at T0, T3, and T6 in all patients and in subgroups A and B. Values are expressed as mean ± standard deviation or, in case of non-Gaussian distribution, as median [interquartile range]. * difference between group A and group B; ** difference in each group between T0 and T3; *** difference in each group between T0 and T6.
3.6. PTH, Calcium and Phosphorus
In all patients, a general downward trend was seen in all the median values of PTH, Ca, and P (Figure 4). Median PTH levels of all patients dropped by 22% [−3–36] after 3 months and 35% [16–61] after 6 months (p = 0.015). A slight decrease in cCa (2% [−5–9] at T3 and 6% [−6–9] at T6) was observed in all patients, although it was not statistically significant. The analysis of phosphorus values showed slight, transient, and insignificant reductions, mainly at T3, both in the total of patients and in the two subgroups.
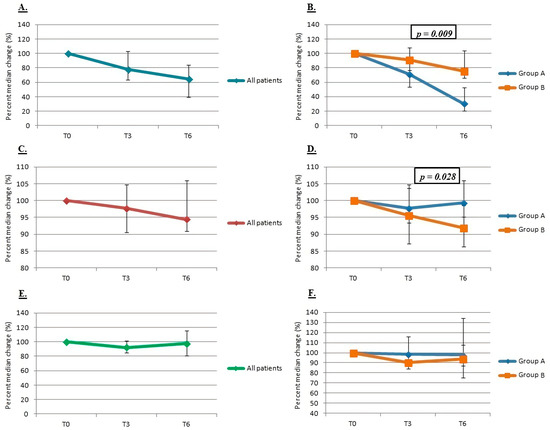
Figure 4.
Percent median change in PTH ((A) in all patients, (B) between the two groups), calcium ((C) in all patients, (D) between the two groups) and phosphorus ((E) in all patients, (F) between the two groups).
When evaluating separately (between group A vs. B), group A showed a statistically significant decrease in the median values and the median percentage changes of PTH than group B at both T3 (p = 0.010 for decreases in median values) and T6 (p = 0.0001 for decreases in median values and p = 0.009 for median percentage changes).
Group B showed a greater and statistically significant percentage median reduction in serum calcium values than group A at T3 (p = 0.028) and, within the group B, a statistically significant decline in iCa at T3 (p = 0.034). A significant reduction in the median values of phosphorus was observed in group B (10% [8–16], against only 1% [−16–9] in group A) between T3 and T0 (p = 0.020) and a similar reduction in the median percentage values at T3.
3.7. Predictive Indices of Achievement of the Desired Therapeutic Targets
The influence of different variables to reach the pre-established endpoints and, more importantly, the therapeutic targets of etelcalcetide were analyzed by using univariate and multivariate logistic regression models. The univariate analysis (Table 4) showed that dialysis vintage ≥ 36 months, AVF as type of vascular access, HDF post modality and basal values of PTH < 1300 pg/mL were the most clinically influential variables in achieving the primary endpoint of PTH reduction ≥ 30% at 6 months, but none of these associations were statistically significant. Even in multivariate regression models no statistically significant associations emerged (Table 5).
Table 4.
Univariate logistic regression to achievement of PTH reduction endpoint ≥ 30% at 6 months. OR, odds ratio; CI, confidence interval.
Table 5.
Multivariate logistic regression to achievement of PTH reduction endpoint ≥ 30% at 6 months. OR, odds ratio; CI, confidence interval.
The analysis was further deepened with the stepwise method of multivariate regression, inserting all the variables (Table 6) with evidence of a statistically significant association in a positive direction with the basal PTH value < 1300 pg/mL (OR 2.28, 95% CI 1.32–3.96, p = 0.015) and a negative direction with previous cinacalcet treatment (OR 0.47, 95% CI 0.26–0.85, p = 0.031).
Table 6.
Multivariate regression with stepwise model to achievement of PTH reduction endpoint ≥ 30% at 6 months. OR, odds ratio; CI, confidence interval.
Based on the same logistic regression models, the analyses were also carried out for the primary endpoint of PTH reduction ≥ 40% at 6 months. Both the univariate analysis (Table 7) and the multivariate analysis (Table 8) showed a statistically significant positive association between the baseline PTH < 1300 pg/mL and the achievement of the endpoint (p = 0.014 and 0.036 respectively for univariate and multivariate analysis). The multivariate analysis with the stepwise method did not select models superior to the previous analyses.
Table 7.
Univariate logistic regression to achievement of PTH reduction endpoint ≥ 40% at 6 months. OR, odds ratio; CI, confidence interval.
Table 8.
Multivariate logistic regression to achievement of PTH reduction endpoint ≥ 40% at 6 months. OR, odds ratio; CI, confidence interval.
3.8. Tolerance and Adverse Effects
Throughout the observation period there were no gastrointestinal adverse effects related to etelcalcetide and no cases of mild and/or symptomatic hypocalcemia requiring adjustments or temporary drug discontinuations. Only one patient, belonging to group A, discontinued the treatment due to excessive suppression of PTH values (69 pg/mL).
4. Discussion
Over the 6-month observation, our study allowed us to evaluate the efficacy and tolerability of etelcalcetide despite conventional therapy with calcitriol, paricalcitol, and/or cinacalcet to control SHPT complications developing in hemodialysis patients with PTH levels on average higher than those reported in previous studies [9,10,13,14,15].
At T6, while the PTH levels across all patients consistently showed a downward trend, a greater and statistically significant reduction was observed in the group of patients with lower baseline PTH.
Both the primary endpoint of reduction in PTH ≥ 40% at 6 months and the secondary endpoint of reduction in median PTH values and median percentage reduction in PTH values was significantly achieved by group A. Therapy with etelcalcetide not only reduced PTH levels but also allowed, in the short–medium term, a partial improvement in the control of the other biohumoral parameters of CKD-MBD. The serum levels of iCa and cCa remained stable throughout the observation period and no mild and/or severe hypocalcemia events were reported. The most significant Ca reduction was reported in group B compared to group A. As the severity of SHPT was a predictive factor for the reduction in calcium levels, as suggested by Cunningham et al. [16]; the stabilization of Ca levels in our study could be partly explained by the increase in the dosage of active vitamin D in group A.
A slight, but not statistically significant, decrease in phosphorus levels was observed in all patients and with a greater extent in group B, although no changes in chelating therapies were made. Down trending of phosphorus and calcium levels is probably related to a reduction in bone resorption secondary to improved SHPT due to etelcalcetide therapy, rather than to a direct action of the drug [17,18,19,20,21].
In severe SHPT, bone metabolism is more resistant to PTH action, and thus a higher PTH level than normal is required to induce the bone remodeling process [22,23,24].
This could predispose SHPT patients to adynamic bone disease and reduce calcium levels substantially in the event of reduction, even slight, in PTH values, as found in group B. In a Japanese study by Shigematsu et al., treatment with etelcalcetide resulted in the reduction of some biomarkers of bone turnover. Specifically, a significant and progressive reduction of tartrate-resistant acid phosphatase-b was already seen only after 1 month of treatment with etelcalcetide. In contrast, the level of alkaline phosphatase in the first month of therapy showed an increase and, only after 4 months of therapy, a reduction [14]. This finding could suggest that the reduction in serum PTH levels, induced by treatment with etelcalcetide, reduces bone resorption in the short term and, only subsequently, bone formation. Similar to the Japanese study, the alkaline phosphatase values from our study initially increased; additionally, by extending the observation time, it would probably have been possible to evaluate a progressive reduction.
Based on logistic regression models, our results showed that the effectiveness of etelcalcetide therapy was positively and significantly associated with baseline PTH < 1300 pg/mL and negatively correlated with previous use of cinacalcet. The conversions to intravenous calcimimetic were due to the insufficient therapeutic response or poor adherence to cinacalcet. These patients, who switch from oral to intravenous calcimimetics, are more highly to become tertiary hyperparathyroidism, in which the parathyroid glands present an uncontrolled and autonomous activation resulting in a continuous production of PTH, rendering them refractory to any medical therapy. Unlike primary hyperparathyroidism, hypercalcemia in the tertiary form is thought to be the result of resolution of secondary hyperparathyroidism rather than adenoma formation alone. Many of the mechanisms that drive the formation of tertiary hyperparathyroidism are due to outcomes of secondary hyperparathyroidism and so the tertiary from is said to be a continued progressive hyperparathyroidism.
One of the secondary endpoints was the assessment of the tolerability of etelcalcetide. With the exception of one case in which the suspension of the drug was necessary due to excessive suppression of PTH between the third and sixth month of therapy, no gastrointestinal adverse events or electrolyte disorders were found. The absence of side effects found in the study may be partly due to the under-achievement to reach the maximal treatment dosage and the flexibility in the drug titration comparing to previous clinical trials [9,13,14,16] (such as: personalizing and modifying the treatment on the basis of the biochemical parameters levels, primarily the calcemia values).
Our study has several limitations such as the small number of patients enrolled, the retrospectivity of the data collected and the short observation period, and the personalization and lower rigidity of treatment with etelcalcetide.
The median PTH value (PTH 1300 pg/mL), based on which we decided to divide the patients into two groups, allowed us to evaluate two categories of patients (group A with moderate SHPT, group B with severe SHPT) in which the extent of response to treatment with etelcalcetide was different. In consideration of the preliminary positive results obtained, our study can be considered a pilot study, but further research is necessary to establish a cut-off value to identify patients who are most likely to respond effectively to etelcalcetide therapy. Future research with a larger sample size is required to confirm the PTH cut-off value within which patients should start treatment with etelcalcetide in order to have a better control of the SHPT therapy and, more generally, of the CKD-MBD of patients undergoing hemodialysis treatment.
5. Conclusions
Calcimimetics are the first-line treatment for patients with SHPT characterized by hypercalcemia, mainly of the primary and tertiary type, or with SHPT refractory to therapy with calcitriol or vitamin D analogs [25,26].
Etelcalcetide, with its proven effectiveness and validity to control elevated PTH levels in the treatment of CKD-MBD in patients with ESRD on hemodialysis, is a therapeutic alternative to cinacalcet, especially when adverse effects and/or poor therapeutic adherence related to cinacalcet impairs patient management.
Etelcalcetide initiation at lower PTH will generate higher therapeutic efficacy as with the worsening of SHPT severity, the parathyroid glands become progressively more insensible to the control mechanisms of the synthesis of PTH and medical therapy. In addition, in patients with advanced SHPT, it is desirable to immediately start intravenous treatment with etelcalcetide after a first attempt with conventional therapies, especially in naive patients, never treated with cinacalcet before.
Author Contributions
Conceptualization, P.M. and M.C.; methodology, P.M., L.M., A.G., M.C.; software, L.M., A.G.; validation, P.M., P.C. and M.C.; formal analysis, P.M. and M.C.; investigation, P.M., E.F., M.F., C.L., H.N.P., A.S.; resources, M.C.; data curation, P.M. and M.C.; writing—original draft preparation, P.M.; writing—review and editing, M.C.; supervision, M.C. All authors have read and agreed to the published version of the manuscript.
Funding
This research received no external funding.
Institutional Review Board Statement
The study was conducted in accordance with the Declaration of Helsinki, and approved by the Ethics Committee of ASST Santi Paolo and Carlo, Milan.
Informed Consent Statement
Informed consent was obtained from all subjects involved in the study.
Data Availability Statement
Dialisys Unit ASST Santi Paolo and Carlo, Milan, Italy.
Conflicts of Interest
The authors declare no conflict of interest.
References
- Jha, V.; Garcia-Garcia, G.; Iseki, K.; Li, Z.; Naicker, S.; Plattner, B.; Saran, R.; Wang, A.Y.-M.; Yang, C.-W. Chronic kidney disease: Global dimension and perspectives. Lancet 2013, 382, 260–272. [Google Scholar] [CrossRef]
- Yamamoto, S.; Fukagawa, M. Uremic Toxicity and Bone in CKD. J. Nephrol. 2017, 30, 623–627. [Google Scholar] [CrossRef] [PubMed]
- Moe, S.M.; Drüeke, T.B.; Block, G.A.; Cannata-Andía, J.B.; Elder, G.J.; Fukagawa, M.; Jorgetti, V.; Ketteler, M.; Langman, C.B.; Levin, A.; et al. KDIGO clinical practice guidelines for the prevention, diagnosis, evaluation, and treatment of Chronic Kidney Disease-Mineral and Bone Disorder (CKD-MBD). Kidney Int. Suppl. 2009, 76, S1–S130. [Google Scholar] [CrossRef]
- Valle, C.; Rodriguez, M.; Santamaría, R.; Almaden, Y.; Rodriguez, M.E.; Cañadillas, S.; Martin-Malo, A.; Aljama, P. Cinacalcet Reduces the Set Point of the PTH-Calcium Curve. J. Am. Soc. Nephrol. 2008, 19, 2430–2436. [Google Scholar] [CrossRef] [PubMed]
- Pereira, L.; Meng, C.; Marques, D.; Frazão, J.M. Old and new calcimimetics for treatment of secondary hyperparathyroidism: Impact on biochemical and relevant clinical outcomes. Clin. Kidney J. 2018, 11, 80–88. [Google Scholar] [CrossRef]
- EVOLVE Trial Investigators; Chertow, G.M.; Block, G.A.; Correa-Rotter, R.; Drüeke, T.B.; Floege, J.; Goodman, W.G.; Herzog, C.A.; Kubo, Y.; London, G.M.; et al. Effect of cinacalcet on cardiovascular disease in patients undergoing dialysis. N. Engl. J. Med. 2012, 367, 2482–2494. [Google Scholar]
- Block, G.A.; Martin, K.J.; de Francisco, A.L.; Turner, S.A.; Avram, M.M.; Suranyi, M.G.; Hercz, G.; Cunningham, J.; Abu-Alfa, A.K.; Messa, P.; et al. Cinacalcet for Secondary Hyperparathyroidism in Patients Receiving Hemodialysis. N. Engl. J. Med. 2004, 350, 1516–1525. [Google Scholar] [CrossRef]
- Raggi, P.; Chertow, G.M.; Torres, P.U.; Csiky, B.; Naso, A.; Nossuli, K.; Moustafa, M.; Goodman, W.G.; Lopez, N.; Downey, G.; et al. The ADVANCE study: A randomized study to evaluate the effects of cinacalcet plus low-dose vitamin D on vascular calcification in patients on hemodialysis. Nephrol. Dial. Transplant. 2011, 26, 1327–1339. [Google Scholar] [CrossRef]
- Block, G.A.; Bushinsky, D.A.; Cunningham, J.; Drueke, T.B.; Ketteler, M.; Kewalramani, R.; Martin, K.J.; Mix, T.C.; Moe, S.M.; Patel, U.D.; et al. Effect of etelcalcetide vs placebo on serum parathyroid hormone in patients receiving hemodialysis with secondary hyperparathyroidism: Two randomized clinical trials. JAMA J. Am. Med. Assoc. 2017, 317, 146–155. [Google Scholar] [CrossRef]
- Block, G.A.; Bushinsky, D.A.; Cheng, S.; Cunningham, J.; Dehmel, B.; Drueke, T.B.; Ketteler, M.; Kewalramani, R.; Martin, K.J.; Moe, S.M.; et al. Effect of etelcalcetide vs cinacalcet on serum parathyroid hormone in patients receiving hemodialysis with secondary hyperparathyroidism: A randomized clinical trial. JAMA J. Am. Med. Assoc. 2017, 317, 156–164. [Google Scholar] [CrossRef]
- Bellasi, A.; Cozzolino, M.; Malberti, F.; Cancarini, G.; Esposito, C.; Guastoni, C.M.; Ondei, P.; Pontoriero, G.; Teatini, U.; Vezzoli, G.; et al. New scenarios in secondary hyperparathyroidism: Etelcalcetide. Position paper of working group on CKD-MBD of the Italian Society of Nephrology. J. Nephrol. 2020, 33, 211–221. [Google Scholar] [CrossRef] [PubMed] [Green Version]
- Cozzolino, M.; Galassi, A.; Conte, F.; Mangano, M.; Di Lullo, L.; Bellasi, A. Treatment of secondary hyperparathyroidism: The clinical utility of etelcalcetide. Ther. Clin. Risk Manag. 2017, 13, 679–689. [Google Scholar] [CrossRef] [PubMed]
- Bushinsky, D.A.; Chertow, G.M.; Cheng, S.; Deng, H.; Kopyt, N.; Martin, K.J.; Rastogi, A.; Ureña-Torres, P.; Vervloet, M.; Block, G.A. One-year safety and efficacy of intravenous etelcalcetide in patients on hemodialysis with secondary hyperparathyroidism. Nephrol. Dial. Transplant. 2019, 35, 1769–1778. [Google Scholar] [CrossRef] [PubMed]
- Shigematsu, T.; Fukagawa, M.; Yokoyama, K.; Akiba, T.; Fujii, A.; Odani, M.; Akizawa, T.; ONO-5163 Study Group; Kukita, K.; Sunaoshi, K.; et al. Long-term effects of etelcalcetide as intravenous calcimimetic therapy in hemodialysis patients with secondary hyperparathyroidism. Clin. Exp. Nephrol. 2018, 22, 426–436. [Google Scholar] [CrossRef]
- Russo, D.; Tripepi, R.; Malberti, F.; Di Iorio, B.; Scognamiglio, B.; Di Lullo, L.; Paduano, I.G.; Tripepi, G.L.; Panuccio, V.A. Correction: Etelcalcetide in Patients on Hemodialysis with Severe Secondary Hyperparathyroidism. Multicenter Study in “Real Life”. J. Clin. Med. 2019, 8, 1066. J. Clin. Med. 2020, 9, 1224. [Google Scholar] [CrossRef]
- Cunningham, J.; Block, G.A.; Chertow, G.M.; Cooper, K.; Evenepoel, P.; Iles, J.; Sun, Y.; Ureña-Torres, P.; Bushinsky, D.A. Etelcalcetide Is Effective at All Levels of Severity of Secondary Hyperparathyroidism in Hemodialysis Patients. Kidney Int. Rep. 2019, 4, 987–994. [Google Scholar] [CrossRef]
- Block, G.; Do, T.P.; Collins, A.J.; Cooper, K.C.; Bradbury, B.D. Co-trending of parathyroid hormone and phosphate in patients receiving hemodialysis. Clin. Nephrol. 2016, 85, 142–151. [Google Scholar] [CrossRef]
- Almaden, Y.; Hernandez, A.; Torregrosa, V.; Canalejo, A.; Sabate, L.; Cruz, L.F.; Campistol, J.M.; Torres, A.; Rodriguez, M. High phosphate level directly stimulates parathyroid hormone secretion and synthesis by human parathyroid tissue in vitro. J. Am. Soc. Nephrol. 1998, 9, 1845–1852. [Google Scholar] [CrossRef]
- Li, J.; Molnar, M.Z.; Zaritsky, J.J.; Sim, J.J.; Streja, E.; Kovesdy, C.P.; Salusky, I.; Kalantar-Zadeh, K. Correlates of parathyroid hormone concentration in hemodialysis patients. Nephrol. Dial. Transplant. 2013, 28, 1516–1525. [Google Scholar] [CrossRef]
- Frazão, J.M.; Braun, J.; Messa, P.; Dehmel, B.; Mattin, C.; Wilkie, M. Is serum phosphorus control related to parathyroid hormone control in dialysis patients with secondary hyperparathyroidism? BMC Nephrol. 2012, 13, 76. [Google Scholar] [CrossRef]
- Block, G.A.; Klassen, P.S.; Lazarus, J.M.; Ofsthun, N.; Lowrie, E.G.; Chertow, G.M. Mineral Metabolism, Mortality, and Morbidity in Maintenance Hemodialysis. J. Am. Soc. Nephrol. 2004, 15, 2208–2218. [Google Scholar] [CrossRef] [PubMed] [Green Version]
- Tominaga, N.; Yonaha, T.; Yamanouchi, M.; Sumi, H.; Taki, Y.; Shibagaki, Y.; Shiizaki, K.; Yano, S. Bone responsiveness to parathyroid hormone is negatively associated with parathyroid hormone-lowering drug use in patients undergoing hemodialysis: A cross-sectional study. BMC Nephrol. 2021, 22, 1–13. [Google Scholar] [CrossRef]
- Ureña-Torres, P.A.; Vervloet, M.; Mazzaferro, S.; Oury, F.; Brandenburg, V.; Bover, J.; Cavalier, E.; Cohen-Solal, M.; Covic, A.; Drueke, T.B.; et al. Novel insights into parathyroid hormone: Report of The Parathyroid Day in Chronic Kidney Disease. Clin. Kidney J. 2018, 12, 269–280. [Google Scholar] [CrossRef] [PubMed]
- Duque, E.J.; Elias, R.M.; Moysés, R.M.A. Parathyroid Hormone: A Uremic Toxin. Toxins 2020, 12, 189. [Google Scholar] [CrossRef]
- Di Iorio, B.R.; Minutolo, R.; De Nicola, L.; Bellizzi, V.; Catapano, F.; Iodice, C.; Rubino, R.; Conte, G. Supplemented very low protein diet ameliorates responsiveness to erythropoietin in chronic renal failure. Kidney Int. 2003, 64, 1822–1828. [Google Scholar] [CrossRef]
- Hendy, G.; Hruska, K.; Mathew, S.; Goltzman, D. New insights into mineral and skeletal regulation by active forms of vitamin D. Kidney Int. 2006, 69, 218–223. [Google Scholar] [CrossRef] [Green Version]
Publisher’s Note: MDPI stays neutral with regard to jurisdictional claims in published maps and institutional affiliations. |
© 2022 by the authors. Licensee MDPI, Basel, Switzerland. This article is an open access article distributed under the terms and conditions of the Creative Commons Attribution (CC BY) license (https://creativecommons.org/licenses/by/4.0/).