Article

The Impact of Community Engagement with Vaccine-Hesitant Persons During the COVID-19 Pandemic

1
Institute for Vaccine Safety, Department of International Health, Johns Hopkins Bloomberg School of Public Health, 615 N Wolfe St, Baltimore, MD 21205, USA
2
Independent Researcher, Aiken, SC 29803, USA
3
Fairfax County Health Department, 10777 Main St., Fairfax, VA 22030, USA
4
Department of International Health, Johns Hopkins Bloomberg School of Public Health, 615 N Wolfe St., Baltimore, MD 21205, USA
5
Office of Health Equity, California Department of Public Health, Sacramento, CA 95814, USA
6
Aspen Trees Consulting, Charlottesville, VA 22910, USA
7
Department of Health, Behavior and Society, Johns Hopkins Bloomberg School of Public Health, 615 N Wolfe St., Baltimore, MD 21205, USA
*
Author to whom correspondence should be addressed.
Retired.
COVID 2026, 6(8), 144; https://doi.org/10.3390/covid6080144
Submission received: 30 June 2026 / Revised: 31 July 2026 / Accepted: 3 August 2026 / Published: 5 August 2026
(This article belongs to the Section COVID Public Health and Epidemiology)

Abstract

Introduction: Community engagement offers an approach to improve our understanding of vaccine hesitancy, yet some worry that public engagement centered around controversial and politicized topics such as COVID-19 vaccines carries a risk of increasing concerns. Methods: Respondents who reported hesitance to vaccinate against COVID-19 in a December 2020 national panel survey were recruited to participate in three interactive and respectful virtual community engagement meetings. A second survey in September 2021 resampled respondents to ascertain changes over time. Of the 291 respondents to both survey waves who had been willing to participate in community meetings, 94 (32%) participated. Multivariate linear and logistic regressions were used to assess the potential impact of meeting participation on outcomes of interest. Results: At follow-up, participants had nearly double the odds of vaccinating against COVID-19 (adjusted Odds Ratio: 1.88; 95% Confidence Interval: 1.06–3.34), about one-third the odds of contracting COVID-19 disease (aOR: 0.37; 95% CI: 0.14–0.96), and increased trust in the Centers for Disease Control and Prevention (CDC) (adjusted Regression Coefficient: 4.16; 95% CI: 0.37–7.94), compared to non-participants. Most participants found the meetings unbiased (89%) and trustworthy (90%). Conclusions: The design of our community meetings to focus on learning from and supporting the decision-maker (versus only promoting “shots in arms”) improved health outcomes and increased trust. Similar meetings could improve how public health engages communities.

1. Introduction

In December 2020, the first COVID-19 vaccines were authorized in the United States [1,2]. Vaccine uptake was initially limited by supply, and rates of COVID-19 cases and deaths peaked during the winter of 2021. As spring arrived, vaccine supply caught up with demand, and COVID-19 cases and deaths dropped precipitously as vaccine coverage increased [3]. However, vaccine uptake stalled in the summer of 2021 at about three-quarters of U.S. adults [4]. As the virus mutated to become more contagious, cases and deaths surged again, especially among the unvaccinated [5].
Surveys identified public concerns about the COVID-19 vaccine, including speed of development and authorization, their safety and effectiveness, and their reliance on new technology (e.g., mRNA vaccines) [4,6]. Surveys also detected significant declines in public trust in the Centers for Disease Control and Prevention (CDC) during the pandemic and demonstrated a strong association between trust in CDC and vaccine confidence and uptake [7,8,9]. While useful, surveys also have substantial limitations. Surveys can measure knowledge, attitudes, and behaviors, look for associations and monitor changes over time. Yet, surveys generally cannot determine why certain knowledge, attitudes, and behaviors exist, change, or interact.
The CDC defines community engagement as “the process of working collaboratively with groups of people who are affiliated by geographic proximity, special interests, or similar situations with respect to issues affecting their well-being” [10]. Community engagement offers an approach to gaining a deeper understanding of factors associated with vaccine hesitancy by exploring them qualitatively in a trusted group setting [11]. However, some worry that public engagement centered around controversial and politicized topics such as COVID-19 vaccines carries a risk of backfiring and actually increasing concerns among some participants, despite mixed results in the literature on the topic [12].
Herein we describe findings from two surveys conducted before and after a series of community meetings among vaccine-hesitant persons which aimed to help public health departments better understand prevalent vaccine concerns and factors in vaccine decision-making so they could share relevant information and reduce barriers to COVID-19 vaccination [13,14]. Through these meetings, we also strove to understand how and why public perspectives on COVID-19 vaccines evolved over time. While our goal was not to persuade participants to vaccinate, we did respond to questions about vaccine recommendations, science, and research. We now return to the data to explore whether these meetings impacted participants’ COVID-19-related attitudes and behaviors.

2. Materials and Methods

2.1. Survey Administration

We conducted an initial national panel survey in December 2020 (just prior to authorization of COVID-19 vaccines) to measure COVID-19 vaccine-related intentions, attitudes, values, and trust among 2525 U.S. adults [6]. A second national panel survey was conducted in September 2021 [4] both among a new sample of 2546 U.S. adults as well as a resample of 826 respondents to the initial December 2020 survey who had been hesitant to receive a COVID-19 vaccine once available. This resample included both meeting participants and others who were eligible to participate but did not (for comparison purposes). Both national panel surveys were administered in English and Spanish by Ipsos, a global leader in market research, using their KnowledgePanel [15], a probability-based web panel that provides a sample of adults (18+ years of age) representative of the U.S. population. Both surveys oversampled Black and Hispanic Americans by 50% to provide statistical power for racial/ethnic comparisons.

2.2. Survey Content

The content of the surveys was based on two frameworks: the Health Belief Model [16], which predicts health behaviors based on perceptions of susceptibility, severity, benefits, and barriers; and the Social Ecological Model [17], which examines how health behavior is influenced by both personal and social/environmental factors. The first survey measured intention to vaccinate against COVID-19, the second measured COVID-19 vaccination status. Both measured cumulative COVID-19 disease prevalence (ever having COVID-19 disease), perceived COVID-19 disease susceptibility and severity, specific concerns about COVID-19 vaccines, and the importance of COVID-19 vaccines in preventing infection and disease and controlling the pandemic. Both surveys measured trust in the CDC and local and state health departments (HDs) using two 14-question construct scales (Table S1) with response options following a 4-point Likert scale (strongly agree, agree, disagree, strongly disagree) based on the validated Trust in Public Health Authorities scale [18]. The second survey assessed perceptions of community meetings among participants. Standard sociodemographic characteristics were available for all panel members.

2.3. Meeting Recruitment

Potential community meeting participants were identified from the December 2020 national panel survey [6]. To be eligible to participate in community meetings, survey respondents had to report both hesitancy to vaccinate against COVID-19 and willingness to participate in the meetings. About half of the survey respondents reported intending to definitely or probably receive a COVID-19 vaccine as soon as possible (e.g., once vaccines were readily available to them). The other half reported intending either to probably vaccinate eventually (but not immediately upon availability), probably not vaccinate, or definitely not vaccinate (many citing concerns regarding the speed of development and authorization of COVID-19 vaccines, their safety and effectiveness, and their reliance on new technology); these respondents were considered vaccine-hesitant. About one-third (33%) of these hesitant respondents also reported being willing to participate in community meetings. Eligible survey respondents were randomly invited to participate until 40 from each of the four major regions of the U.S. (Northeast, South, Midwest, and West) had accepted. Further details on recruitment are illustrated in Figure S1.

2.4. Meeting Schedule and Structure

Recruited participants were split into two groups per region of 20 participants each. Each regional group participated in three meetings, led by a professional facilitator. The first wave of meetings was conducted 1–15 December 2020; the second wave was conducted between 26 January and 15 February 2021; and the third wave was conducted 4–18 May 2021. Subsequent sessions included participants from the previous session. Each meeting lasted 90–180 min. To avoid unnecessary COVID-19 transmission, meetings were held virtually via Zoom (advanced version) [19].
The facilitator followed a written discussion guide. As meetings began, the facilitator reminded participants that the meetings were not about persuading them to vaccinate but rather to better understand factors in their decision-making. To enable a rapid response to HDs, Wave 1 focused on participants’ pandemic experience, including impacts on themselves, their work, their families, and their communities; their perception of the potential benefits of vaccination; their concerns about vaccination; logistical factors (e.g., barriers); and their vaccination intent. Waves 2 and 3 further explored concerns identified during Wave 1; the vaccination decision-making process; sources of information about COVID-19 vaccines; if and how experiences and perceptions had changed; and updates to vaccination status/intent. Each session also included time for participants to ask vaccine questions of a non-governmental academic public health epidemiologist, who strove to answer questions in an accurate and unbiased fashion. To ensure fidelity across regions and groups, each regional meeting followed the same wave-specific guide, was led by the same facilitator, and included the same epidemiologist.
During meetings, participants were polled to quantitatively assess the sentiment of the group regarding COVID-19 vaccines (Figure S2). Results of polling questions were displayed to participants to generate discussion and elucidate the context behind the poll results. Extensive notes were taken during each meeting. Sessions were recorded and reviewed to confirm accuracy of expressed themes. All comments made in the chat during meetings were also reviewed. Issues and themes identified at each meeting were analyzed from meeting notes, recordings, and polling results.

2.5. Data Management

For the construct scales measuring trust in CDC and HDs, composite, linear scores were generated. Each of the 4-point Likert scale response options were given a numeric value between 0 and 3, so that the response indicating the lowest trust had a numeric value of 0 and the response indicating the highest trust had a numeric value of 3. The sum of all encoded scale responses was used to create the score numerator, and the total possible score (accounting for missing variables) was used as the score denominator, thus creating a scale ranging from 0 to 100 (0 indicating the lowest possible trust and 100 indicating the highest possible trust). Cronbach alpha coefficients for these scales were estimated to be between 0.87 and 0.93, indicating strong reliability.
To facilitate straightforward analyses and interpretation, Likert scale response options (strongly agree, agree, disagree, strongly disagree) were dichotomized to agree vs. disagree, and other scale response options (e.g., very important, important, not very important, not at all important) were similarly dichotomized to reflect affirmative vs. negative (e.g., important vs. not important).

2.6. Data Analysis

The primary outcome of interest in our analysis was COVID-19 vaccination status. Secondary outcomes of interest were chosen from the survey items assessed among the resample at both survey timepoints (December 2020 and September 2021) and included COVID-19 disease status, COVID-19-related attitudes (e.g., perceived susceptibility to and severity of COVID-19 disease, importance of COVID-19 vaccines), and trust in public health authorities (e.g., CDC, HDs). Tertiary outcomes of interest included participant perceptions of the meetings. Other exploratory variables included COVID-19 vaccine intentions and sociodemographic characteristics (e.g., gender, age, education, race/ethnicity, region, metro status, income, employment status, household size, political affiliation, physical health).
First, sociodemographic characteristics and COVID-19 vaccine intentions at baseline (i.e., as reported in the first survey) were cross-tabulated against meeting participation to identify any differences between participants and non-participants. Then, COVID-19 vaccination status at follow-up (i.e., as reported in the second survey) was cross-tabulated against participation and stratified by baseline vaccine intentions. Changes in mean trust scale scores and in the proportions of affirmative responses to repeat survey items assessing COVID-19-related attitudes and disease status were compared between participants and non-participants. Perceptions of meetings were cross-tabulated against baseline vaccine intentions and follow-up vaccination status. For all cross-tabulations and comparisons between timepoints, p-values were estimated using Pearson chi-squared proportion test at significance level of α = 0.05.
To assess the potential impact of meeting participation on COVID-19 vaccination, bivariate odds ratios were estimated using simple logistic regression, with a binary dependent variable indicating vaccination at follow-up and a binary independent variable indicating participation. Multivariate logistic regression was also used to adjust for U.S. region (which was used in recruitment for and associated with participation and thus is a potential confounder) via a dummy independent variable. To assess the potential impact of participation on COVID-19 disease status and attitudes, bivariate odds ratios were estimated using multivariate logistic regression with a binary dependent variable indicating affirmative responses to the selected survey item at follow-up and a binary independent variable indicating participation, as well as further independent variables to control for responses to the selected survey item at baseline and adjust for potential confounders (e.g., region, vaccination). To assess the potential impact of participation on trust in CDC and HDs, regression coefficients were estimated using multivariate linear regression with a continuous dependent variable for the selected trust scale score at follow-up and a binary independent variable indicating participation, as well as further independent variables to control for the selected trust scale score at baseline and adjust for potential confounders (e.g., region).
Data were analyzed using Stata, version 16 [20].

Data Availability

Deidentified individual participant data will not be made available to ensure participant confidentiality and align with the study protocol and informed consent.

3. Results

3.1. Sample

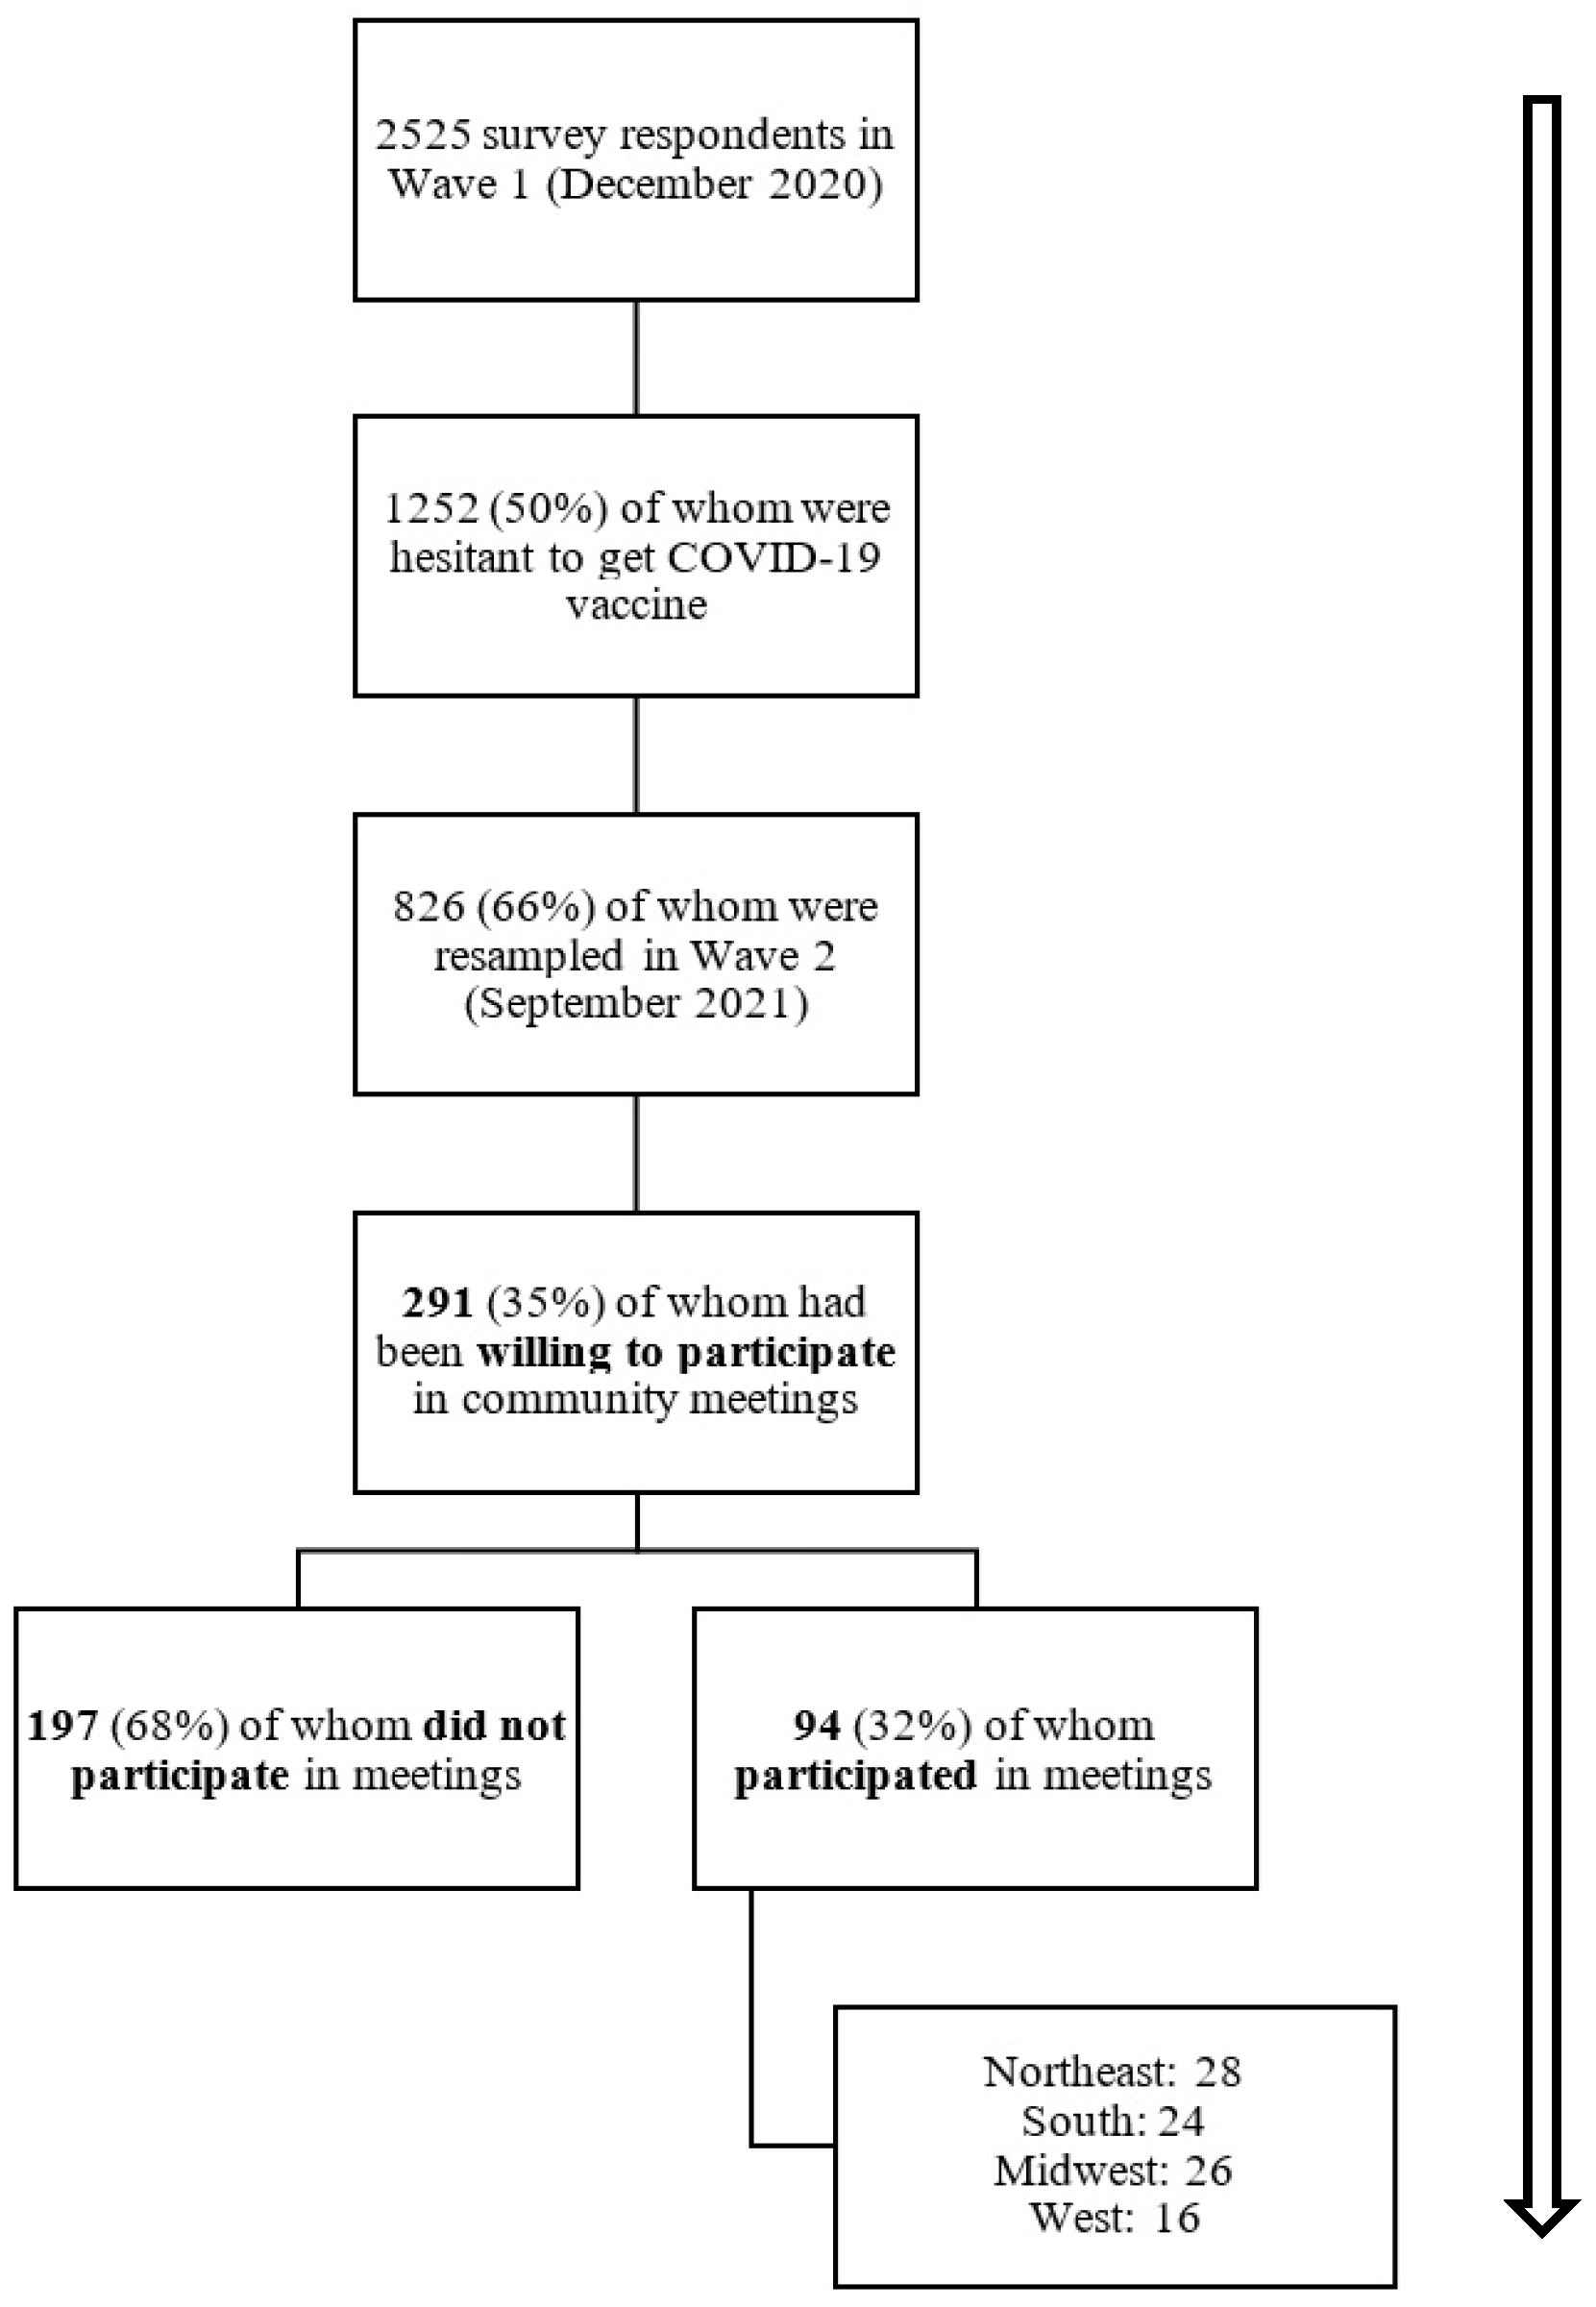
Of those responding to both the baseline and follow-up survey, 291 (35%) had been willing to participate in community meetings and were thus included in the sample for this analysis (Figure 1). Of those 291 respondents, 94 (32%) did participate. Sociodemographic characteristics and baseline COVID-19 vaccine intentions of the sample are presented in Table 1. The sample was diverse: 52% of the sample was male (versus 48% female); 35% was 45–59 years old (versus 14% 18–29 years old, 26% 30–44 years old, and 24% at least 65 years old); and 40% was non-Hispanic White (versus 35% non-Hispanic Black, 21% Hispanic, and 5% other). The only sociodemographic characteristic associated with meeting participation was U.S. region.

3.2. Perceptions of Community Meetings

Most community meeting participants found the information shared in the meetings to be unbiased (78/94, 89%) and trustworthy (80/94, 90%) (Table S2). Many reported their participation encouraged them to search for more information about COVID-19 vaccines (72/94, 81%), changed how they thought about COVID-19 vaccines (60/94, 67%), and increased their trust in their HD (53/94, 60%). Vaccination against COVID-19 was more likely among those who trusted the information shared in the meetings and reported increased trust in their HD than among those who did not (96% vs. 70% and 68% vs. 35%, respectively; p < 0.01).
Nearly all participants (87/94, 97%) perceived the purpose of the meetings was to find out what people think about COVID-19 vaccination (Table S2). Nearly three-quarters (66/94, 74%) perceived the purpose was also to give people information to help their vaccine decision-making. About one-third (32/94, 36%) perceived the purpose was to convince people to get vaccinated, a perception reported more frequently by those not intending to vaccinate at baseline compared to those intending to vaccinate eventually (p = 0.02).

3.3. Potential Effects of Meeting Participation

3.3.1. COVID-19 Vaccination

Three-quarters (70/94, 75%) of participants had vaccinated against COVID-19 by the follow-up survey, which was a far greater proportion than among non-participants (117/197, 61%) (p = 0.02) (Table 2). This equates to a near doubling of the odds of vaccination associated with participating (unadjusted Odds Ratio: 1.98; 95% Confidence Interval: 1.14–3.44), even after adjusting for region (adjusted OR: 1.88; 95% CI: 1.06–3.34). Among just those uncertain about vaccinating at baseline, 85% of participants had vaccinated, compared to 74% of non-participants (aOR: 2.04; 95% CI: 0.94–4.43; p = 0.06). No difference was found among those intending to definitely not vaccinate at baseline.

3.3.2. COVID-19 Disease and Vaccine Attitudes

Although an additional 15% of our sample reported having ever had COVID-19 disease in the follow-up survey compared to the baseline survey, only an additional 8% of participants reported contracting COVID-19 between surveys compared to 19% of non-participants (p = 0.03) (Table 3). This equates to a nearly two-thirds reduction in the odds of contracting COVID-19 disease among participants, even when controlling for region (aOR: 0.37; 95% CI: 0.14–0.96), though this reduction is mitigated slightly when controlling for COVID-19 vaccination as well (aOR: 0.42; 95% CI: 0.16–1.11). No impact of meeting participation on perceived COVID-19 disease susceptibility or severity or the importance of COVID-19 vaccination was found.

3.3.3. Trust in Public Health Authorities

Meeting participation was associated with increased trust in CDC using our construct scale, even when controlling for region (adjusted Regression Coefficient: 4.16; 95% CI: 0.37–7.94) (Table 3). Participation was not significantly associated with increased trust in local and state HDs using our construct scale (aRC: 1.27; 95% CI: −2.62–5.17). However, participation was significantly associated with individual items from both scales (Table S1).

4. Discussion

This analysis indicates a positive effect of community engagement with persons hesitant to receive COVID-19 vaccines. Participants in our community engagement sessions (compared to survey respondents of similar profile who did not participate) had higher rates of vaccination, were less likely to contract COVID-19, and experienced increased trust in CDC. This is an important finding, as much of the existing evidence for the effectiveness of community engagement in improving vaccination rates was collected prior to the COVID-19 pandemic and focused on childhood (not adult) vaccination [21].
Results were not the same across groups with different levels of hesitancy. No impact was seen among participants who intended to definitely not vaccinate. However, participants who were initially uncertain about vaccinating ended up more likely to vaccinate, less likely to experience COVID-19 disease, and more trusting of CDC. Although statistical significance was lost when stratifying by baseline intention, this is likely due to the loss of power inherent in stratification. This study implies that community engagement is one way to support decision-making for those who have not yet ruled out vaccinating.
The decreased likelihood of contracting COVID-19 disease among participants could be due to several factors. The clearest explanation is that, because participation increased the likelihood of vaccination and vaccination protects against disease, participation indirectly protected against disease through increasing vaccination. Indeed, when controlling for vaccination, the effect of participation on disease incidence was no longer statistically significant. However, the shift in odds was minimal. Assuming the effect remained and would have been statistically significant with a greater sample size, another potential explanation is that participants were either inherently more likely or, through their participation, became more likely to take other preventive measures (e.g., social distancing, masking). Our meetings took a holistic approach to disease prevention, going over the many ways to decrease the potential for spreading or contracting COVID-19 (including but not limited to vaccination), and emphasizing the agency of individual decision-makers to use as many of these strategies as they saw fit.
Though our community meetings were not affiliated with the CDC, we were responsive to questions regarding the rationale for CDC recommendations and their evolution over time, which may explain the apparent increase in trust in CDC experienced by meeting participants. Many participants also self-reported increased trust in HDs, and trust in HDs appeared to increase among participants versus non-participants, but statistical significance was not reached as it was for trust in CDC. This is likely due partly to limited power and partly to conversations about COVID-19 being much more likely to involve CDC than HDs, as CDC made national vaccine (and other pandemic-related) recommendations and was thus in the public eye throughout the pandemic. Since most participants also found the meetings themselves trustworthy, it is reasonable to expect similar meetings about public health recommendations to improve trust in both the sponsoring institution and the public health institution making the recommendations discussed, even if these are not the same.
It is impossible to disentangle the impact of community engagement itself from our deliberate meeting design, which did not intend to persuade participants and did not have the objective of achieving more “shots in arms.” The careful and intentional meeting design sought to understand the vaccine decision-making process while supporting the decision-maker’s agency and autonomy. Although we provided facts and corrected misunderstandings when prompted by participant questions, we also practiced active listening when participants expressed their concerns, and we tried to honor (rather than challenge) the underlying values expressed by participants and affirm their right and capacity to make their own decisions (even if at odds with current public health recommendations). The success of this design was reflected in how participants self-reported the trustworthiness of the meetings, which was almost certainly a meaningful factor in the corresponding increases in trust in public health and decisions to follow public health recommendations by vaccinating. COVID-19 vaccination was much more likely among participants who found the meetings trustworthy and/or reported an increase in their trust in HDs (compared to participants who did not). This suggests that our approach to community engagement may have increased vaccination indirectly simply by increasing trust in public health.
We thus advocate for public health to consider using respectful public engagement in the manner described above. Specifically, we recommend that meeting facilitators and public health representatives: (1) listen actively and respectfully to participants’ concerns; (2) honor and not challenge the underlying values expressed; (3) present factual and unbiased information without attempting to promote a behavior; (4) answer any specific questions as best and as objectively as possible; and (5) reaffirm each person’s right and capacity to make their own health decisions, even if at odds with current public health recommendations. This advice reflects the approach we took in our meetings, which may have played a role in their apparent impact. Even if not, we believe these factors are critical to building a lasting trusted relationship between public health agencies and the public, which should lead to both a better understanding by public health professionals of public values and concerns and increased compliance with public health recommendations.
Elements of shared decision-making and motivational interviewing (MI) permeate our recommendations above. Shared decision-making takes a collaborative approach to choosing between healthcare options [22,23], and MI incorporates many aspects of our meetings (e.g., asking open-ended questions, active listening, affirming autonomy, refraining from unsolicited advice) [24,25]. MI has been successfully used in clinical settings to support the decision-making of vaccine-hesitant individuals in a collaborative rather than paternalistic manner [26,27]. However, these approaches are certainly more readily applicable to clinical practice, in which healthcare providers are primarily concerned with the health and wellbeing of their individual patients and regularly meet with them in intimate settings, than public health practice, which generally aims to make positive health impacts on a population level. Thus, we recognize that our recommendations will pose challenges for public health practitioners and departments. Due to limited resources, public health tends to focus on the encouragement of behaviors that are widely recommended and known to improve population health (such as vaccination), often in unidirectional messaging campaigns. Nevertheless, given the effectiveness of community engagement not only in exploring the values underlying health behaviors but also transforming behaviors and building trust, further work must be done to identify settings and approaches to engagement that can be successfully deployed by public health on a large scale. While conducting community meetings online (as we did) has drawbacks when compared to traditional in-person meetings, a virtual approach allows far greater scalability with its reduced costs and travel requirements, and deserves further investigation.
This study has several limitations. The small sample size limits statistical power. The low response rate increases the risk of nonresponse bias, both in terms of meeting participation and follow-up survey responses. Although we limited the comparison group to those eligible to participate in meetings, checked for sociodemographic differences between respondents and non-respondents, and controlled for region to account for our recruitment process, it is impossible to say for certain whether the differences found between those who did and did not participate are reflective of the effects of the meetings or simply indicative of a preexisting difference in open-mindedness (i.e., self-selection bias). These biases threaten this study’s internal validity, though its external validity (for vaccine-hesitant adults in the U.S.) should remain strong, due to meeting recruitment being conducted among respondents to a nationally representative panel survey. Additionally, study participants were not followed beyond September 2021 (four months after the last meeting); further studies with longer-term follow-up at multiple timepoints would be needed to confirm the degree to which the effects of meeting participation are sustainable or transient.
Public health should not shy away from engaging the public on critical issues for fear of fueling concerns. Engagement, done well, helps rather than hurts [28]. Engagement can help public health practitioners learn about what is important to communities and how to best serve them while simultaneously increasing social cohesion [29].
However, how engagement is designed and implemented is critical, and this may take a paradigm shift. Public health authorities have scientific expertise and faithfully serve population health, but individuals also bring their values and lived experience to health decisions. Respecting these factors and individual agency creates a partnership between public health and the public. Designing engagement around bi-directional learning and decision-making support yields a more comfortable environment in which participants are not worried about being pressured. Done well, engagement requires public health to respect people who disagree.
Engagement should also acknowledge the full range of actions that can achieve a public health goal. Ostracizing individuals for not taking a particular protective action, even if that action has a clear health benefit, may decrease trust and engagement. For example, if someone does not currently want to vaccinate, there are also other responsible actions they can be encouraged to take to help protect themselves and their community from disease. Public health should strive to build durable relationships to support health-related decisions throughout each person’s lifetime. Ensuring that lines of communication stay open and relationship-building continues is essential. Such a public health approach is fundamentally more relational than transactional.
In conclusion, interactive and respectful community meetings with vaccine-hesitant persons were found to increase trust in public health and COVID-19 vaccination and reduce disease. Engagement that focuses on bi-directional learning and decision-making support instead of promoting specific behaviors can benefit public health.

Supplementary Materials

The following supporting information can be downloaded at: https://www.mdpi.com/article/10.3390/covid6080144/s1, Figure S1: Flow Diagram of Community Meeting Recruitment; Figure S2: Poll Questions Given During Community Meetings; Table S1: Changes in Individual Construct Scale Items Measuring Trust in Public Health Authorities Between December 2020 and September 2021 Among Eligible Sample Comparing Community Meeting Participants vs. Non-Participants, Adjusted for Region; Table S2: Perceptions of Community Meetings, Stratified by COVID-19 Vaccine Intentions Prior to Authorization and COVID-19 Vaccination Within Nine Months of Authorization.

Author Contributions

Conceptualization and study design, M.Z.D., J.B. and D.A.S.; designed data collection instruments, M.Z.D. and D.A.S.; data collection coordination and supervision, M.Z.D. and D.A.S.; formal analysis, M.Z.D.; writing—original draft preparation, M.Z.D.; writing—review and editing, M.Z.D., J.B., R.B., B.S., H.B.N., M.D.H., T.M.P. and D.A.S.; funding acquisition, D.A.S. All authors have read and agreed to the published version of the manuscript.

Funding

The project was funded by the Robert Wood Johnson Foundation and the Horizon Foundation and conducted in partnership with the National Association of County and City Health Officials (NACCHO), the Association of State and Territorial Health Officials (ASTHO), the National Indian Health Board (NIHB), and the Association of Immunization Managers (AIM).

Institutional Review Board Statement

This work was considered public health surveillance and thus not human subject research by the Institutional Review Board (IRB) at the Johns Hopkins Bloomberg School of Public Health (IRB number: 14734; date: 30 October 2020).

Informed Consent Statement

Survey respondents were members of the Ipsos KnowledgePanel and gave their consent to be surveyed. Those respondents who also participated in community meetings gave their consent to participate in advance of the meetings.

Data Availability Statement

Deidentified individual participant data will not be made available.

Conflicts of Interest

Matthew Dudley and Daniel Salmon have received funding from Merck and from the Vaccination Confidence Fund, which is jointly funded by Facebook and Merck. Daniel Salmon serves on advisory boards for Merck, Janssen, Sanofi and Moderna. All other authors declare that they have no known competing financial interests or personal relationships that could have appeared to influence the work reported in this paper.

Abbreviations

The following abbreviations are used in this manuscript:
CDCCenters for Disease Control and Prevention
HDHealth department
MIMotivational interviewing

References

  1. FDA Takes Key Action in Fight Against COVID-19 by Issuing Emergency Use Authorization for First COVID-19 Vaccine. 11 December 2020. Available online: https://www.prnewswire.com/news-releases/fda-takes-key-action-in-fight-against-covid-19-by-issuing-emergency-use-authorization-for-first-covid-19-vaccine-301191524.html (accessed on 27 October 2021).
  2. FDA Takes Additional Action in Fight Against COVID-19 by Issuing Emergency Use Authorization for Second COVID-19 Vaccine. 18 December 2020. Available online: https://www.prnewswire.com/news-releases/fda-takes-additional-action-in-fight-against-covid-19-by-issuing-emergency-use-authorization-for-second-covid-19-vaccine-301196303.html (accessed on 27 October 2021).
  3. Centers for Disease Control and Prevention. COVID Data Tracker. Available online: https://covid.cdc.gov/covid-data-tracker/ (accessed on 10 May 2022).
  4. Dudley, M.Z.; Schwartz, B.; Brewer, J.; Kan, L.; Bernier, R.; Gerber, J.E.; Ni, H.B.; Proveaux, T.M.; Rimal, R.N.; Salmon, D.A. COVID-19 Vaccination Status, Attitudes, and Values among US Adults in September 2021. J. Clin. Med. 2022, 11, 3734. [Google Scholar] [CrossRef] [PubMed]
  5. Centers for Disease Control and Prevention. Delta Variant: What We Know about the Science. Updated 26 August 2021. Available online: https://www.cdc.gov/coronavirus/2019-ncov/variants/delta-variant.html (accessed on 14 October 2021).
  6. Salmon, D.A.; Dudley, M.Z.; Brewer, J.; Kan, L.; Gerber, J.E.; Budigan, H.; Proveaux, T.M.; Bernier, R.; Rimal, R.; Schwartz, B. COVID-19 vaccination attitudes, values and intentions among United States adults prior to emergency use authorization. Vaccine 2021, 39, 2698–2711. [Google Scholar] [CrossRef] [PubMed]
  7. Dudley, M.Z.; Schuh, H.B.; Forr, A.; Shaw, J.; Salmon, D.A. Changes in vaccine attitudes and recommendations among US Healthcare Personnel during the COVID-19 pandemic. npj Vaccines 2024, 9, 49. [Google Scholar] [CrossRef] [PubMed]
  8. Garvey, K.; Salmon, D.A.; Dudley, M.Z.; Brewer, J.; Schuh, H.B. Associations between trust in public health, vaccine confidence, and COVID-19 vaccination among American adults. Vaccine 2025, 68, 127955. [Google Scholar] [CrossRef] [PubMed]
  9. Melchinger, H.; Omer, S.B.; Malik, A.A. Change in confidence in public health entities among US adults between 2020–2024. PLoS Glob. Public Health 2025, 5, e0004747. [Google Scholar] [CrossRef] [PubMed]
  10. Centers for Disease Control and Prevention. Principles of Community Engagement. 2011. Available online: https://stacks.cdc.gov/view/cdc/11699/cdc_11699_DS1.pdf (accessed on 20 February 2024).
  11. Schwartz, B.; Brewer, J.; Budigan, H.; Bernier, R.; Dudley, M.Z.; Kan, L.; Proveaux, T.M.; Roberts, R.; Tafoya, N.; Hamlin, M.D.; et al. Factors Affecting SARS-CoV-2 Vaccination Intent and Decision Making Among African American, Native American, and Hispanic Participants in a Qualitative Study. Public Health Rep. 2023, 138, 422–427. [Google Scholar] [CrossRef] [PubMed]
  12. Nyhan, B. Why the backfire effect does not explain the durability of political misperceptions. Proc. Natl. Acad. Sci. USA 2021, 118, e1912440117. [Google Scholar] [CrossRef] [PubMed]
  13. National Association of County & City Health Officials. Understanding Diverse Communities and Supporting Equitable and Informed COVID-19 Vaccination Decision-Making: Findings from Wave 2. 2021. 17 May 2021. Available online: https://www.naccho.org/uploads/downloadable-resources/Wave-2-Findings-Memo-Report-Final_corrected_5.17.21.pdf (accessed on 20 February 2024).
  14. National Association of County & City Health Officials. Understanding Diverse Communities and Supporting Equitable and Informed COVID-19 Vaccination Decision-Making: Findings from Wave 3. 2021. 8 June 2021. Available online: https://www.naccho.org/uploads/downloadable-resources/Wave-3-Findings-Memo-Report-Final.pdf (accessed on 20 February 2024).
  15. Ipsos. KnowledgePanel. Available online: https://www.ipsos.com/en-us/solutions/public-affairs/knowledgepanel (accessed on 20 January 2021).
  16. Rosenstock, I.M. Historical Origins of the Health Belief Model. Health Educ. Monogr. 1974, 2, 328–335. [Google Scholar] [CrossRef]
  17. Kumar, S.; Quinn, S.C.; Kim, K.H.; Musa, D.; Hilyard, K.M.; Freimuth, V.S. The Social Ecological Model as a Framework for Determinants of 2009 H1N1 Influenza Vaccine Uptake in the United States. Health Educ. Behav. 2012, 39, 229–243. [Google Scholar] [CrossRef] [PubMed]
  18. Holroyd, T.A.; Limaye, R.J.; Gerber, J.E.; Rimal, R.N.; Musci, R.J.; Brewer, J.; Sutherland, A.; Blunt, M.; Geller, G.; Salmon, D.A. Development of a Scale to Measure Trust in Public Health Authorities: Prevalence of Trust and Association with Vaccination. J. Health Commun. 2021, 26, 272–280. [Google Scholar] [CrossRef] [PubMed]
  19. Zoom Video Communications I. 4 February 2024, 2024. Available online: https://zoom.us/ (accessed on 20 February 2024).
  20. StataCorp LLC. STATA. Available online: https://www.stata.com/ (accessed on 20 January 2021).
  21. Xie, Y.J.; Liao, X.; Lin, M.; Yang, L.; Cheung, K.; Zhang, Q.; Li, Y.; Hao, C.; Wang, H.H.; Gao, Y.; et al. Community Engagement in Vaccination Promotion: Systematic Review and Meta-Analysis. JMIR Public Health Surveill. 2024, 10, e49695. [Google Scholar] [CrossRef] [PubMed]
  22. Montori, V.M.; Ruissen, M.M.; Hargraves, I.G.; Brito, J.P.; Kunneman, M. Shared decision-making as a method of care. BMJ Evid.-Based Med. 2023, 28, 213–217. [Google Scholar] [CrossRef] [PubMed]
  23. Stiggelbout, A.M.; van der Weijden, T.; De Wit, M.P.T.; Frosch, D.; Légaré, F.; Montori, V.M.; Trevena, L.; Elwyn, G. Shared decision making: Really putting patients at the centre of healthcare. BMJ 2012, 344, e256. [Google Scholar] [CrossRef] [PubMed]
  24. Miller, W.R.; Rollnick, S. Ten things that motivational interviewing is not. Behav. Cogn. Psychother. 2009, 37, 129–140. [Google Scholar] [CrossRef] [PubMed]
  25. Miller, W.R.; Rollnick, S. Motivational Interviewing: Preparing People for Change, 2nd ed.; The Guildford Press: New York, NY, USA, 2002. [Google Scholar]
  26. Gagneur, A.; Gosselin, V.; Dubé, È. Motivational interviewing: A promising tool to address vaccine hesitancy. Vaccine 2018, 36, 6553–6555. [Google Scholar] [CrossRef] [PubMed]
  27. Limaye, R.J.; Opel, D.J.; Dempsey, A.; Ellingson, M.; Spina, C.; Omer, S.B.; Dudley, M.Z.; Salmon, D.A.; O’Leary, S.T. Communicating with Vaccine-Hesitant Parents: A Narrative Review. Acad. Pediatr. 2021, 21, S24–S29. [Google Scholar] [CrossRef] [PubMed]
  28. Dietz, T.; Stern, P.C.; National Research Council (U.S.)—Panel on Public Participation in Environmental Assessment and Decision Making; National Research Council (U.S.); Committee on the Human Dimensions of Global Change. Public Participation in Environmental Assessment and Decision Making; National Academies Press: Washington, DC, USA, 2008; Volume 15, 305p. [Google Scholar]
  29. Orazani, S.N.; Reynolds, K.J.; Osborne, H. What works and why in interventions to strengthen social cohesion: A systematic review. J. Appl. Soc. Psychol. 2023, 53, 938–995. [Google Scholar] [CrossRef]
Figure 1. Flow Diagram of Sample.
Covid 06 00144 g001
Table 1. Sociodemographic Characteristics and Baseline COVID-19 Vaccine Intentions of Eligible Sample, Stratified by Community Meeting Participation.
Total,
N (%) a
Meeting Participation
No,
N (%) b
Yes,
N (%) b
p-Value c
All291 (100)197 (68)94 (32)
Intentions to Get COVID-19 Vaccine, December 2020 0.11
Probably vaccinate eventually, but not right away157 (54)98 (50)59 (63)
Probably not vaccinate63 (22)46 (23)17 (18)
Definitely not vaccinate71 (24)53 (27)18 (19)
Sociodemographic Characteristics
Gender 0.15
Female140 (48)89 (45)51 (54)
Male151 (52)108 (55)43 (46)
Age (years) 0.86
18–2941 (14)26 (13)15 (16)
30–4477 (26)53 (27)24 (26)
45–59103 (35)72 (37)31 (33)
65+70 (24)46 (23)24 (26)
Education (attained) 0.18
<High School18 (6)15 (8)3 (3)
High School67 (23)50 (25)17 (18)
Some College82 (28)54 (27)28 (30)
Bachelors or Higher124 (43)78 (40)46 (49)
Race/Ethnicity 0.33
White, non-Hispanic115 (40)76 (39)39 (41)
Black, non-Hispanic102 (35)75 (38)27 (29)
Hispanic60 (21)36 (18)24 (26)
Other, non-Hispanic14 (5)10 (5)4 (4)
Region <0.01
Northeast56 (19)28 (14)28 (30)
Midwest54 (19)28 (14)26 (28)
South134 (46)110 (56)24 (26)
West47 (16)31 (16)16 (17)
Metropolitan Statistical Area status (metro vs. non-metro) 0.98
Non-metro28 (10)19 (10)9 (10)
Metro263 (90)178 (90)85 (90)
Household income 0.18
<$50 k94 (32)69 (35)25 (27)
$50–84 k84 (29)60 (30)24 (26)
$85–149 k59 (20)35 (18)24 (26)
$150 k+54 (19)33 (17)21 (22)
Current employment status (working vs. not working) 0.98
Not Working87 (30)59 (30)28 (30)
Working204 (70)138 (70)66 (70)
Household size 0.14
166 (23)40 (20)26 (28)
284 (29)59 (30)25 (27)
349 (17)39 (20)10 (11)
4+92 (32)59 (30)33 (35)
Political affiliation 0.86
Republican62 (22)42 (21)20 (22)
Democrat111 (39)73 (37)38 (41)
Independent91 (32)65 (33)26 (28)
Something else24 (8)16 (8)8 (9)
Physical health 0.10
Excellent29 (10)16 (8)13 (14)
Very good91 (31)60 (30)31 (33)
Good123 (42)91 (46)32 (34)
Fair40 (14)27 (14)13 (14)
Poor8 (3)3 (2)5 (5)
a Column percentages of total study population (i.e., those responding to both survey waves who were willing and eligible to participate in community meetings) reporting the sociodemographic characteristic in each row, except for “All” row which contains row percentages. b Column percentages of community meeting non-participants versus participants reporting the sociodemographic characteristic in each row, except for “All” row which contains row percentages. c p-value calculated using the Pearson chi-square test at significance level of alpha = 5%.
Table 2. Odds of Vaccination Within Comparing Community Meeting Participants vs. Non-Participants, Stratified by Baseline Intentions and Adjusted for Region.
Total,
N (%) a
Community Meeting Participation
No
N (%) b
Yes
N (%) b
p-Value cOR (95% CI) daOR (95% CI) d
All29119794
Received COVID-19 Vaccine as of September 2021187 (65)117 (61)70 (75)0.021.98 (1.14–3.44)1.88 (1.06–3.34)
Among those uncertain about vaccinating at baseline (n = 220)168 (78)104 (74)64 (85)0.062.01 (0.96–4.24)2.04 (0.94–4.43)
Among those intending to probably vaccinate eventually (n = 157)131 (85)78 (81)53 (90)0.162.04 (0.76–5.47)2.17 (0.78–6.07)
Among those intending to probably not vaccinate (n = 63)37 (62)26 (59)11 (69)0.501.52 (0.45–5.14)1.96 (0.43–8.95)
Among those intending to definitely not vaccinate at baseline (n = 71)19 (27)13 (25)6 (33)0.471.54 (0.48–4.92)0.98 (0.27–3.49)
a Column percentages of study population (i.e., those responding to both survey waves who were willing and eligible to participate in community meetings) with specified baseline intentions reporting COVID-19 vaccination. b Column percentages of community meeting non-participants versus participants with specified baseline intentions reporting COVID-19 vaccination. c p-value calculated using the Pearson chi-square test at significance level of alpha = 5%. d OR = unadjusted Odds Ratio; aOR = adjusted Odds Ratio; 95% CI = 95% Confidence Interval; aOR includes additional independent variables in multivariate logistic regression to control for U.S. region (which was used in community meeting participation selection).
Table 3. Changes in Vaccine Attitudes and Trust in Public Health Authorities Between December 2020 and September 2021 Among Eligible Sample Comparing Community Meeting Participants vs. Non-Participants, Adjusted for Region and COVID-19 Vaccination.
Affirmative Responses to Survey Items aTotal
Change,
N (%) b
Community Meeting Participation
No,
N (%) c
Yes,
N (%) c
p-
value d
OR
(95% CI) e
aOR
(95% CI) e
(Region)
aOR
(95% CI) e
(Region and Vx)
Ever knowingly had COVID-19 disease+39
(+15)
+33
(+19)
+6
(+8)
0.030.36
(0.14–0.89)
0.37
(0.14–0.96)
0.42
(0.16–1.11)
Perceive it likely to get COVID-19 over the next year−34
(−12)
−26
(−13)
−8
(−10)
0.831.08
(0.53–2.22)
1.12
(0.54–2.33)
1.12
(0.53–2.40)
Perceive COVID-19 infection to be severe−38
(−13)
−25
(−13)
−13
(−15)
0.491.28
(0.63–2.60)
1.07
(0.50–2.27)
1.16
(0.53–2.54)
Perceive COVID-19 vaccines important to stopping the spread of infection in the US−9
(−3)
−7
(−3)
−2
(−2)
0.371.38
(0.69–2.77)
1.22
(0.59–2.53)
0.92
(0.37–2.27)
Construct Scales fTotal
Change, (x̄) g
No,
(x̄) h
Yes,
(x̄) h
p-
value i
RC
(95% CI) j
aRC
(95% CI) j
(Region)
aRC
(95% CI) j
(Region and Vx)
Trust in the Centers for Disease Control and Prevention (CDC)0.72−0.723.800.014.49
(0.89–8.09)
4.16
(0.37–7.94)
2.79
(−0.91–6.49)
Trust in local and state health departments (HDs)0.03−0.882.040.132.86
(−0.89–6.61)
1.27
(−2.62–5.17)
0.23
(−3.62–4.08)
a Response options dichotomized to reflect affirmative/negative, results for affirmative shown. b Changes in column percentages of total study population (i.e., those responding to both survey waves who were willing and eligible to participate in community meetings) reporting affirmative responses to survey items as indicated in each row. c Changes in column percentages of community meeting non-participants versus participants reporting affirmative responses to survey items as indicated in each row. d p-value calculated using the Pearson chi-square test at significance level of alpha = 5%. e OR = unadjusted Odds Ratio; aOR = adjusted Odds Ratio; 95% CI = 95% Confidence Interval; Vx = vaccination; aOR includes additional independent variables in multivariate logistic regression to control for U.S. region (which was used in community meeting participation selection), and in the final column COVID-19 vaccination (which was associated with community meeting participation in Exhibit 3) as well. f Construct scales combined scores for each relevant survey item (reversing negative items) and divided by maximum (e.g., 100 being complete trust and 0 being complete distrust); see Table S1. g Changes in mean construct scale scores (x̄) of total study population (i.e., those responding to both survey waves who were willing and eligible to participate in community meetings). h Changes in mean construct scale scores (x̄) of community meeting non-participants versus participants. i p-value calculated using simple linear regression at significance level of alpha = 5%. j RC = Regression Coefficient; aRC = adjusted Regression Coefficient; 95% CI = 95% Confidence Interval; aRC includes additional independent variables in multivariate linear regression to control for U.S. region (which was used in community meeting participation selection), and in the final column COVID-19 vaccination (which was associated with community meeting participation in Exhibit 3) as well.
Disclaimer/Publisher’s Note: The statements, opinions and data contained in all publications are solely those of the individual author(s) and contributor(s) and not of MDPI and/or the editor(s). MDPI and/or the editor(s) disclaim responsibility for any injury to people or property resulting from any ideas, methods, instructions or products referred to in the content.