1. Introduction
Since the World Health Organisation (WHO) declared a global public health emergency or pandemic due to the emergence of COVID-19, a novel infectious disease associated with significant morbidity and mortality, there has been a need to activate global response mechanisms to curb the COVID-19 coronavirus.
Infection with the new coronavirus (COVID-19) is notable for its global epidemiological impact and high pathogenicity, which causes gastrointestinal and respiratory symptoms. The latter is associated with hospitalization, mainly of immunosuppressed patients and those with comorbidities [
1]. It has also been observed that this disease does not have a fully described clinical spectrum or specific supportive pharmacological treatment [
2].
According to the Pan American Health Organization (PAHO), at the regional level, the USA ranks second (152,438,949) in confirmed cases compared to Europe (206,079,547), Asia (127,160,487), Africa (11,614,769) and Oceania (6,402,678) [
3]. Of the countries that make up the Americas, as of 17 April 2022, a total of 67.28 million cases of COVID-19 have been recorded in Latin America and the Caribbean. Brazil is the country most affected by this pandemic in the region, with around 30 million confirmed cases. Argentina ranks second, with approximately 9.05 million infected. Mexico, for its part, has recorded a total of 5.71 million cases. Among the countries most affected by the new type of coronavirus in Latin America are Colombia with 3.5 million cases, Peru with 3.5 million, Chile with 3.5 million, and Ecuador with 865,585 cases [
4].
In this context of marked clinical and epidemiological differences between cases in adults, children and pregnant women, early in the pandemic it was not yet clear whether children were less likely to become infected than adults or pregnant women, or whether they had fewer symptoms or a later onset of disease; this uncertainty has since been substantially clarified by subsequent research. After the disease, surveillance, spatial distribution and epidemiological information are tools for assessing the disease, reducing its spread and mitigating its effects. Throughout Peru, we can observe a total of 1,091,744 cases of infection and 213,044 deaths [
3]. The economic and social effects of COVID-19 around the world, and in Latin America, have been disastrous, causing lower economic growth of −5.3%, unemployment of 38 million people, the closure of more than 2 million businesses, family hardship due to the death of a spouse, and irreversible consequences due to complications causing family dependency [
4].
Epidemiological studies report that SARS-CoV-2 has an incubation period of 4 to 6 days, with 1.9 to 6.5 secondary cases generated by an infected patient within 5 to 8 days between successive infections. In addition, the epidemic doubles every 3 to 7 days. While all individuals are susceptible to SARS-CoV-2 infection, epidemiological evidence demonstrates that age, gender, and race significantly influence disease severity, hospitalisation rates, and mortality risk following infection. Children develop milder symptoms, with a better prognosis. However, there are cases that may subsequently develop multisystem inflammatory syndrome. The mortality risk of reported COVID-19 cases is 2 to 15%, higher in older age groups and in those with pre-existing conditions [
5,
6].
On the other hand, epidemiological criteria such as having resided or worked in an area at high risk of virus transmission: closed residential settings or humanitarian settings such as camps or similar structures for displaced persons; at any time during the 14-day period prior to the onset of symptoms; OR Having resided in or travelled to an area with community transmission at any time during the 14-day period prior to the onset of symptoms; OR Having worked in a healthcare setting, including healthcare facilities or in the community, at any time during the 14-day period prior to the onset of symptoms [
7].
Vulnerability to COVID-19 is another epidemiological criterion. The term “vulnerable” comes from the Latin “vulnerabilis”, meaning vulnerable to harm. The vulnerability of inhabitants to the potential effects of COVID-19 derives from the characteristics of individuals or groups in terms of morbidity, as well as the social, cultural, and economic conditions that influence their capacity to anticipate, cope with, resist and recover from the adverse effects of the coronavirus. Among the dimensions that can be considered are socio-demographic and health components [
8].
The socio-demographic component is associated with population characteristics that, due to the particularities of SARS-CoV-2 infection, may be factors that increase vulnerability. This dimension also considers the socio-cultural aspects of the population that hinder access to information resources to prevent infection, and factors that have been associated with reduced access to essential medical services once infection has been acquired. The socioeconomic dimension is composed of variables related to the well-being of a municipality’s population in terms of basic satisfiers, rights, and economic capacity. This dimension also includes the probability of exposure to the virus given the population characteristics that influence the degree of mobility and the structure of employment [
9].
On the other hand, the pandemic seriously affected all of this, and together with the resulting drop in household income, it has had very negative consequences on poverty and social inequality, with unemployment becoming a very common situation for millions of people, disrupting not only their personal finances but also their mental and physical health. In turn, various associated factors have emerged in the presence of the pandemic, such as fear of contracting the virus, frustration, lack of contact with friends, co-workers and family, lack of personal space, economic and family losses, which may also contribute to the health impact of the spread of COVID-19.
Despite this recognition, case studies on the population are still scarce, which highlights the need to analyse the spatial characterization of confirmed cases of COVID-19 and implement a system for reporting and recording their sociodemographic and epidemiological profile in our own reality, in this particular case, in the population of Tumbes.
According to data from the Ministry of Health, 27,482 confirmed cases were reported in the Tumbes region as of 17 April 2022, ranking second among all regions. Tumbes is a department (region) located on the northern coast of Peru, bordering Ecuador to the north, and is divided into three provinces: Tumbes (the capital province and city sharing the department’s name), Contralmirante Villar, and Zarumilla. The region had an estimated population of approximately 237,685 inhabitants in 2021. The city of Tumbes serves as the regional capital and concentrates the majority of the population and economic activity. It also has a fatality rate of 6.15%, with the 30–64 age group being the most exposed and the 65+ age group having the highest incidence of fatalities from the virus, mainly distributed in the central area of the city of Tumbes [
10].
These spatial inequalities could be a reflection of socioeconomic inequalities. These seem to translate into different geographical scales, from geographical variations within cities to variations within countries. However, other studies report higher mortality rates in areas of higher social and geographical status. The risk of death from COVID-19 appears to have a greater impact on socioeconomically vulnerable populations [
11].
Based on the preceding paragraphs, we propose an ecological study, characterized by its social approach, and we ask ourselves the following question: What is the social approach to the epidemiological characterisation of COVID-19 cases in the Tumbes region in 2022? The overall objective is to determine the social approach to the epidemiological characterisation of COVID-19 cases in the Tumbes region in 2022. This research is justified because the analysis of spatial and epidemiological characterisation allows for the implementation of information systems that have changed the way organisations operate today. Through this use, it has been possible to aid decision-making, such as providing information on the situation of COVID-19 cases in the population of Tumbes. This project seeks to provide scientific evidence that will guarantee quality attributes that meet the health needs of the population, improve data availability, and provide access to information on COVID-19 cases in the Tumbes region.
2. Method
The study was ecological in nature, characterised by its epidemiological approach [
12], of the three provinces of Tumbes, Contralmirante Villar, Tumbes and Zarumilla. It was based on epidemiological data on COVID-19 cases in the population of Tumbes for the period between March 2020 and December 2022 in the department of Tumbes.
Monthly registered COVID-19 deaths from the analytic dataset used in this study were compiled and provided as
Supplementary Materials to improve the temporal interpretation of mortality during 2020–2022 (see
Supplementary Tables S1–S3). It should be noted that monthly all-cause mortality data were not available through SISOVID or other regional sources for the study period; consequently, the supplementary tables present registered COVID-19 deaths and confirmed cases only. Readers are encouraged to interpret these figures alongside national all-cause mortality statistics published by INEI when available. Furthermore, monthly mortality data for the pre-pandemic years 2017–2019 were not obtainable from regional health registries, which precluded the establishment of formal seasonal mortality baselines. This limitation is discussed further in
Section 4.
This study focused on analysing COVID-19 cases in the provinces of Contralmirante, Villar, Tumbes and Zarumilla, in the department of Tumbes, located in the northern region of Peru, during the years 2020–2022, based on epidemiological data obtained from two primary sources: the Ministry of Health (MINSA) and the National Institute of Statistics, from the Intercensal Population Projections and Estimates file (INEI), corresponding to the population of each province [
13].
These territories were selected due to their epidemiological and geographical relevance in the context of the COVID-19 pandemic, as well as their diversity in terms of population characteristics and associated risk factors.
The study population consisted of 51,421 confirmed cases of COVID-19 in the period from March 2020 to December 2022 in the department of Tumbes, which were reported in the COVID-19 Surveillance Information System (SISOVID) of the Ministry of Health (MINSA) through the COVID-19 clinical epidemiological research form, data that was made available by the Regional Health Directorate of Tumbes, MINSA.
In order to select the 51,421 confirmed cases of COVID-19, it was necessary for the cases to meet the following inclusion and exclusion criteria: Inclusion criteria: Records of confirmed cases of COVID-19 residing in the provinces of Contralmirante Villar, Tumbes and Zarumilla in the department of Tumbes. Records of confirmed cases of COVID-19 reported in SISOVID between March 2020 and December 2022. Records of confirmed cases of COVID-19 in all age groups.
To avoid annual aggregation masking important short-term fluctuations in the dynamics of the pandemic, the monthly SISOVID data were reclassified into epidemic waves. The definition of these waves was based on national epidemiological reports and genomic surveillance data for Peru, including information from the CoVariants platform (Hodcroft EB. CoVariants: SARS-CoV-2 Mutations and Variants of Concern. Available at:
https://covariants.org/variants; accessed on 22 April 2023). In the Peru panel, ancestral lineages predominated throughout most of 2020, while the Lambda (C.37) and Gamma (P.1) variants became dominant during the first half of 2021. Delta variants prevailed in the second half of 2021 and were rapidly displaced by Omicron (BA.1/BA.2) from late 2021 onwards.
For the detailed temporal analysis, we examined monthly counts of registered COVID-19 deaths for the January–May periods of 2020, 2021 and 2022. To facilitate within-dataset temporal comparison, we calculated a descriptive observed-to-reference ratio using the overall mean monthly number of registered COVID-19 deaths across these 15 months as an internal reference value. For each month and epidemic wave, the observed monthly number of registered COVID-19 deaths was divided by this reference value. This procedure was intended only as a descriptive temporal indicator within the study dataset and should not be interpreted as a formal estimate of excess mortality, since monthly all-cause mortality data and pre-pandemic mortality baselines for 2017–2019 were not available. It is also important to acknowledge that seasonal fluctuations in background mortality (e.g., higher rates during colder months) could not be accounted for given the absence of pre-pandemic monthly mortality series for the Tumbes region. Consequently, any apparent peaks in the observed-to-reference ratios may partly reflect seasonal mortality patterns rather than COVID-19 impact alone. Moreover, the registered COVID-19 death counts used in this analysis likely underestimate the true mortality burden, given the documented limitations in testing access and possible misclassification of cause of death in Peru during the pandemic. These caveats are detailed in the Limitations section.
When information on hospital admission was available, we used the recorded year and epidemiological week of admission to approximate a calendar date and aggregated admissions at the monthly level. Monthly counts of hospitalised COVID-19 cases were analysed in parallel with registered COVID-19 mortality and observed-to-reference ratios. Because of gaps and potential inaccuracies in the hospitalisation records, these data are presented descriptively and used mainly to provide contextual information on the pressure exerted on local health services during the different epidemic waves.
For this study, secondary data were used, which were collected after the project was approved by the Ethics and Research Committee of the National University of Tumbes. The data used to develop the epidemiological profile were extracted from SISOVID and provided in a database by the Regional Health Directorate of Tumbes, Ministry of Health (MINSA).
Based on this data, an Excel database was created, in which data on the variables of interest were compiled, following a specific registration guide for the coding of these variables, prepared in accordance with the variables in the MINSA epidemiological file.
The sociodemographic data collected was also supplemented with information available on the web platform of the National Institute of Statistics and Informatics (INEI).
The data collection process was carried out by the principal investigator of the study, with the collaboration of a team specialising in epidemiological profiling. Descriptive statistics were then applied to characterise the sociodemographic and epidemiological profile, and the results were visualised using tables and graphs.
The project was submitted to the Ethics and Research Committee of the National University of Tumbes for evaluation and approval, in accordance with Law No. 29,784 or the Scientific Research Law, which establishes guidelines for research involving human subjects. It should be noted that formal ethics committee approval was obtained prior to the data extraction and analysis phase; however, given that data collection for this ecological study was based on pre-existing surveillance records from SISOVID and did not involve direct patient contact, the retrospective nature of the data use was acknowledged by the committee.
To ensure information security, the data was not stored in the cloud, and access to it was restricted exclusively to authorised researchers through appropriate authentication and encryption processes. In addition, data analysis was performed using tools such as RStudio, which provided secure integrations and support for the use of protected Application Programming Interface (API) keys.
The report is sent in aggregate form to the National University of Tumbes and the Regional Health Directorate of Tumbes via institutional email, in accordance with established ethical standards and bioethical principles.
4. Discussion
The incidence rate of confirmed COVID-19 cases in the Tumbes region shows a notable decrease between 2021 and 2022, from 78.4 to 57.2 new cases per 1000 inhabitants, representing a decrease from 7.8% to 5.7% of the affected population. This epidemiological behavior reflects a decrease in the spread of the virus, which may be linked to multiple factors that directly or indirectly influenced the evolution of the pandemic at the regional and national levels. In this regard, the decline in the incidence rate can be explained by the sustained progress of the COVID-19 vaccination process in Peru. This progress has been made possible thanks to the collective effort of the Peruvian population, which has actively participated in the immunization campaign since 9 February 2021, when COVID-19 vaccination began, marking a milestone in the fight against the pandemic. Likewise, according to data from the Social Health Insurance (EsSalud) [
14] at the end of 2022, vaccination coverage in the country reached 84.4% with two doses and 71% with three doses, which had a significant impact on reducing severe cases and new infections.
A study supports the finding of a decrease in the positivity and fatality rates for COVID-19 in Peru beginning in the second half of 2021, coinciding with the increase in vaccination coverage. The study found that the fatality rate for COVID-19 in vaccinated individuals was 17.5%, compared to 78.8% in unvaccinated individuals, and that the median survival time in vaccinated hospitalized patients was 42 days compared to 7 days in unvaccinated patients [
14], In addition, a study on COVID-19 mortality in the regions of Peru between the first and fifth pandemic waves found that coastal regions, including Tumbes, showed a faster recovery, probably due to moderate population density and greater accessibility to health services [
12]. Another relevant factor to consider is the possible immunity acquired by the population through previous infections, especially during the most aggressive waves of infection in 2020 and early 2021. Research indicates that a high percentage of the Peruvian population may have developed antibodies against SARS-CoV-2, thus contributing to lower collective susceptibility to new infections [
13].
However, it is important to note that the decrease in incidence could also be influenced by reduced access to or demand for diagnostic tests in 2022, which could have led to underreporting of cases. This phenomenon has already been documented in the epidemiological bulletin of the National Institute of Health-MINSA, which warns that in areas with a lower perception of risk, people tend not to report mild symptoms or to go to health centers [
14]. This study found an increase in confirmed cases of COVID-19 per 1000 inhabitants in the Tumbes region, from 153 cases in 2021 to 198 cases in 2022. This increase reflects a greater spread of the virus in the population during the second year. Likewise, the cumulative case rate rose from 15% to 20%, indicating that a significant proportion of the population was affected by the disease in 2022. This epidemiological behavior may be related to various factors. According to the 2022 Health Situation Analysis for the Tumbes Region, prepared by the Regional Health Directorate, 14,449 confirmed cases of COVID-19 were reported during that year, representing an increase over the previous year. This increase is attributed, in part, to the emergence of new variants of SARS-CoV-2, such as Omicron, and to the population’s failure to comply with prevention measures [
15].
At the national level, MINSA reported that during 2022 there was an increase in the COVID-19 attack rate in different age groups, including adults, young people, and older adults, which coincides with the trend observed in Tumbes [
16]. In addition, a study highlights that between March 2020 and November 2022, the average monthly number of people vaccinated with two doses rose to 237,211 nationwide, while the average number of people recovered was 128,562. These data reflect a sustained effort in the immunization campaign, which helped to mitigate severe cases and deaths, although it did not necessarily prevent an increase in infections, especially in the presence of more transmissible variants [
17].
However, it is important to note that the increase in confirmed cases and cumulative case rates may also have been influenced by greater diagnostic capacity and improved epidemiological surveillance in the Tumbes region, which allowed for the identification and reporting of more cases than in the previous year. Expanding access to rapid and molecular tests, as well as strengthening information systems, were key to achieving greater detection of COVID-19 [
18].
An important methodological consideration is that the monthly observed-to-reference analysis presented in this study was based exclusively on registered COVID-19 deaths from the SISOVID database and on an internal reference derived from the same study period. Therefore, it should not be interpreted as a formal excess-mortality analysis. A true excess-mortality approach would require monthly all-cause mortality data and historical pre-pandemic baselines to account for expected seasonal fluctuations. In addition, the reported COVID-19 deaths may underestimate the real mortality burden due to underdiagnosis, limited testing access in some periods, and possible misclassification of cause of death. Consequently, the mortality findings reported here should be interpreted as patterns of registered COVID-19 mortality within the surveillance system [
19].
The refined temporal analysis of the January–May periods of 2020–2022, combined with national genomic surveillance data from CoVariants, provides a detailed picture of how successive SARS-CoV-2 variants translated into different mortality patterns in Tumbes. The first wave, dominated by ancestral lineages, produced a very sharp and concentrated peak in May 2020, with an O/E ratio of 6.25, indicating a six-fold increase relative to the internal study-period reference value. The second wave, associated with the dominance of Lambda and Gamma variants in Peru, recorded the highest number of hospital admissions, but with a more prolonged and less explosive profile than the first wave.
In contrast, during the early Omicron wave in January–February 2022, O/E ratios were consistently below 1.0 and both deaths and hospital admissions were markedly reduced, despite ongoing viral circulation. This decoupling between transmission and severe outcomes is consistent with reports from other settings, and probably reflects a combination of lower intrinsic severity of Omicron and the accumulation of population immunity through previous infection and vaccination. Nevertheless, variant information was obtained from national-level genomic data rather than individual sequencing in Tumbes, and hospitalisation data were incomplete. As a result, the observed correlations between epidemic waves, dominant variants, excess mortality and hospital admissions should be interpreted as ecological and hypothesis-generating rather than causal.
These three waves in Tumbes coincide with the periods in which ancestral lineages, Lambda/Gamma and Omicron, respectively, were dominant at the national level, as shown by the CoVariants Peru panel. Moreover, the comparison of monthly registered COVID-19 deaths against the internal reference value suggested that mortality was particularly concentrated in the second wave were below unity, and hospital admissions were also much lower, reinforcing the interpretation of reduced clinical severity in a context of increasing population immunity.
During the early years of the pandemic, older adults (aged 60 and over) were the group most affected in terms of mortality. However, in 2022, there was a significant reduction in mortality in this group, from 35.26% to 3.13%, coinciding with the progress of mass vaccination in the country. According to one study, vaccination was key to this improvement, consistent with the vaccinated-versus-unvaccinated fatality difference already noted above. In addition, regions with higher vaccination coverage, such as some on the Peruvian coast, recorded more marked reductions in excess mortality, confirming the positive impact of immunization in protecting the most vulnerable groups [
20].
Furthermore, the strengthening of prevention and control measures, such as the use of masks, physical distancing, and mobility restrictions, helped to reduce virus transmission and, consequently, associated mortality. These actions, together with improvements in diagnostic capacity and healthcare services, enabled a more efficient response to the health crisis [
12].
The evolution of COVID-19 mortality in people over 60 years of age in the Tumbes region reflects a trend that coincides with observations made in other parts of the country and the world. In 2021, the highest mortality rate in this age group was reached, with 155 deaths per 10,000 inhabitants, corresponding to the peak of the pandemic and the saturation of health services. This figure was closely followed by the 150 deaths recorded in 2020, the first year of the pandemic, while in 2022, the mortality rate decreased significantly, with only 23 deaths, which may indicate a positive impact of health interventions such as vaccination and control measures.
A key factor in the mortality of older adults was the presence of comorbidities. In the case of Tumbes, heart disease stood out as the most frequent comorbidity, closely associated with the highest number of deaths in the three years analyzed. This finding is consistent with national studies showing high mortality in people with cardiovascular disease during the pandemic. According to a 2022 report by the Ministry of Health, people with comorbidities, especially heart disease, diabetes, and obesity, were found to be at greater risk of developing severe forms of COVID-19 and dying from complications related to the virus [
21].
Another study found that, in adults over 60 years of age, the presence of comorbidities such as cardiovascular disease, obesity, diabetes, and chronic lung disease significantly increased the risk of mortality from COVID-19. Heart disease, in particular, is a determining factor, along with other chronic conditions, in the poor prognosis of hospitalized patients, highlighting the need for prevention strategies and differentiated management in this vulnerable population [
22].
Furthermore, in this study, comorbidities such as diabetes, obesity, and kidney disease were also factors associated with higher mortality, but a reduction in cases of these conditions was observed in 2022, which could be related to better control of chronic diseases due to increased public awareness of the importance of healthcare during the pandemic. The progress of vaccination may also have played an important role in reducing the severity of the disease in people with these comorbidities, as recent studies have shown that immunization is effective in reducing mortality in older adults with pre- existing conditions [
23].
These results are consistent with the trend observed at the national level. A study conducted in 2024 found that people over the age of 60 with chronic comorbidities had a significantly higher risk of dying from COVID-19 [
23]. Wave analysis confirmed that the population aged 60 and over with chronic diseases (heart disease, diabetes, obesity, and kidney disease) had the highest risk of death, especially during the second wave. In this phase, mortality rates in older adults were significantly higher than those observed in the first and, especially, in the third wave. In the latter, although older people remained more vulnerable, the decline in the number of deaths and the frequency of associated comorbidities is related to the expansion of vaccination in this age group and the immunity acquired in previous waves. In this regard, the proper control and management of comorbidities remain crucial to reducing mortality, not only from COVID-19, but also from future pandemics or infectious outbreaks. A population-based cohort analysis study similarly showed that vaccination against COVID-19 significantly reduced the risk of mortality in older adults, corroborating the fatality-rate difference reported earlier. Scientific evidence highlights the importance of vaccination policies and the proper management of comorbidities in older adults to reduce COVID-19 mortality and improve the response to future health crises [
14].
With regard to the evolution of the COVID-19 case fatality rate in the department of Tumbes during the period 2020–2022, there is a downward trend that reflects progress in controlling the pandemic and improvements in the response capacity of the regional health system. According to
Table 8, the fatality rate peaked in 2021 at 3.28%, exceeding even the 2020 rate of 2.73%, despite both years having a similar number of confirmed cases. This situation suggests that in 2021, the pandemic reached a critical stage in Tumbes, possibly due to the circulation of more virulent variants, such as the Gamma variant (P.1), in addition to the saturation of health services [
23]. These findings show that grouping data by year can obscure critical differences between waves that are short but have a major impact on health. Incorporating the wave and variant approach into epidemiological surveillance makes it possible to identify periods of greatest risk for vulnerable groups more accurately and to adjust prevention, diagnosis, and care strategies in a timely manner. In contexts such as Tumbes, with high mobility and social heterogeneity, a detailed analysis of the timing of waves contributes to the design of more targeted interventions and strengthens the health system’s preparedness for future emergencies.
However, in 2022, there was a significant decrease in the case fatality rate, which fell to 0.58%. This change can be attributed to multiple factors. First, the progress of vaccination played a crucial role. According to data from the Ministry of Health, two-dose vaccination coverage in older adults exceeded 80% by the end of 2022, which was associated with a reduction in hospitalizations and deaths in the most vulnerable groups [
24]. A national study in 2024 revealed that the average monthly number of people vaccinated with two doses was 237,211, which had a direct impact on reducing the severity of cases. Likewise, improvements in clinical management strategies and the strengthening of care services, both at the hospital and primary care levels, allowed for more timely intervention. This was reflected in greater availability of medical oxygen, the implementation of intermediate care units, and better training of medical staff, factors that were highlighted by the Tumbes Regional Health Directorate in 2020 [
23].
Another relevant aspect is the expansion of diagnostic capacity in the region, which allowed for the detection of more confirmed cases than in 2020 and 2021, which may have contributed to reducing the denominator in the calculation of case fatality rate. This expansion of diagnostic testing was driven by the strengthening of the laboratory network and the use of antigen and molecular tests on a larger scale [
23]. The national trend also showed a sustained decline in case fatality rates. According to Peru’s Epidemiological Bulletin No. 52 in 2022, the national case fatality rate was 8.49% in 2020, fell slightly to 8.25% in 2021, and dropped dramatically to 0.46% in 2022. This pattern is indicative of a structural improvement in disease care and prevention throughout the country [
24].
With regard to life expectancy and excess mortality compared to previous years,
Table 9 reveals that, during the period 2020–2022 in the department of Tumbes, COVID-19 fatality rates were significantly higher in people over 60 years of age, especially in men with comorbidities (7.32%), followed by men without comorbidities (6.28%) and women with comorbidities (5.16%). These findings underscore the decisive influence of age, sex, and the presence of chronic diseases on the severity and lethality of COVID-19. This trend is consistent with a study conducted in Lima and Callao, which found that older adults had the highest mortality rate (63.7%) compared to adults (27.1%) and young people (8.5%). Furthermore, regardless of age group, the presence of diseases such as chronic neurological, renal, and hepatic diseases and cancer was associated with an increased risk of mortality. Similarly, it has been observed that males are associated with a higher case fatality rate from COVID-19 [
23]. A study conducted in Peru found that although men and women have a similar risk of SARS-CoV-2 infection, men have a higher risk of mortality and case fatality rate from COVID-19. This pattern could be related to biological, behavioral, and social differences that affect immune response and access to health services [
25].
In terms of comorbidities, diseases such as obesity, diabetes, cardiovascular disease, and chronic lung disease have been identified as significant risk factors for COVID-19 mortality in Peruvian adults. The presence of these conditions can exacerbate the inflammatory response to the virus and complicate the clinical course of the disease [
22]. The temporal analysis was refined from calendar years to epidemic waves defined based on the circulation of dominant variants, which allowed us to identify that the mortality burden was particularly concentrated in the second wave (Gamma/Lambda) and decreased significantly in the Omicron wave.
The socio-demographic distribution of confirmed COVID-19 cases in the Tumbes region between 2020 and 2022, as shown in
Table 10, reveals patterns consistent with the findings of studies conducted in other regions of the country and internationally. Firstly, the almost equal distribution between women (50.7%) and men (49.3%) coincides with research showing a similar incidence between both sexes. A study conducted in the Cajamarca region reported a distribution of 52% men and 48% women among confirmed cases [
26]. However, although the infection affects both sexes equally, studies indicate that mortality and severity tend to be higher in men, possibly due to biological factors, such as immune response, and social factors, such as exposure to occupational hazards [
26].
In terms of age, the highest number of cases in the 30–59 age group (50.2%), followed by the 18–29 age group (24%), reflects the impact of the pandemic on the economically active population. This trend has been documented in various studies, which attribute this higher incidence to mobility and the need to continue working in person during lockdown, which increases the chances of infection [
26].
With regard to occupation, the fact that 85.4% of cases correspond to people with employment, and that the majority of these belong to “other sectors” (93.2%), suggests that community transmission has been more related to non-medical and non-agricultural activities. Although the health sector accounts for only 5.3% of cases, one study warns that this group has faced a significant risk of mortality due to its constant exposure to the virus and the initial precarious conditions of personal protection [
27].
The predominance of mestizo people (93.9%) among cases may reflect the demographic composition of the region, although it also raises questions about the statistical underrepresentation of Afro-descendant and Andean communities. These figures could be influenced by both population distribution factors and barriers to access to diagnosis and medical care.
Finally, the geographical concentration of cases in the province of Tumbes (80.7%) is in line with the concentration of population and economic activities. The higher urban density, centralization of services and greater mobility in this province partly explain the territorial distribution of infections. Studies conducted in other regions of the country, such as Metropolitan Lima, have also shown that urban areas have higher infection rates due to these same variables [
28].
With regard to the distribution of healthcare professionals infected with COVID-19 in the Tumbes region between 2020 and 2022, presented in
Table 11, it shows that nurses were the most affected group, with a total of 407 cases (29%), followed by nursing technicians (358 cases, 25%) and doctors (294 cases, 21%). In fourth place were obstetricians with 192 cases (13%), and finally, laboratory technicians with 172 cases (12%). This pattern reveals that professionals with direct and prolonged contact with patients, especially during 2021, faced the highest risk of infection.
This trend has been confirmed by a cross-sectional study in three public hospitals in Metropolitan Lima, which reported a prevalence of COVID-19 infection of 47.3% among healthcare personnel, with nursing staff being the most affected group due to their direct and continuous exposure to positive patients [
29]. Similarly, the National Maternal Perinatal Institute reported that 77.8% of infected workers were healthcare personnel, mostly women between the ages of 30 and 59 [
23].
In the specific context of Tumbes, a qualitative study in 2022 identified that the main causes of infection among healthcare professionals were insufficient personal protective equipment (PPE), prolonged exposure in hospital environments, and a lack of adequate training on biosafety protocols [
30]. In addition, the emotional impact on healthcare personnel has been considerable. According to a study conducted in 2023, which developed a scale to measure concern about infection among Peruvian healthcare workers, high levels of anxiety were observed, especially among those working in COVID areas or critical care units [
31].
In this context, the data from Tumbes are consistent with national evidence and underscore the need to improve the working conditions of healthcare personnel, including the continuous provision of PPE, technical training, emotional support, and active surveillance. These actions are essential to protect those on the front lines during health emergencies such as the COVID-19 pandemic.
Another point is that the clinical and epidemiological characterization of confirmed COVID-19 cases in the Tumbes region between 2020 and 2022 reveals patterns consistent with the findings reported in other scientific studies conducted in Peru. First, in terms of diagnosis, there is a predominant use of serological tests (43.62%), followed by antigen tests (29.94%) and molecular tests (26.36%). This trend is attributed to the greater availability and lower cost of serological tests, factors that favored their widespread use, especially during the initial phase of the COVID-19 pandemic. However, several studies have warned that, although these tests are useful for seroprevalence studies, they are not recommended for the diagnosis of active cases due to their low sensitivity in the early stages of the disease. Indeed, evidence from a systematic review indicates that serological tests have a sensitivity of less than 40% during the first seven days after the onset of symptoms, reaching acceptable levels only after two weeks. This limitation significantly compromised their diagnostic usefulness in the early stages of infection [
31]. In contrast, one study supports the use of molecular tests as the gold standard due to their high sensitivity and specificity for detecting active SARS-CoV-2 infections [
32].
In terms of clinical characteristics, 60.1% of cases in Tumbes presented more than one symptom, while 26.5% were asymptomatic. This distribution coincides with that described in another study conducted in a pediatric hospital in Lima, where the most common symptoms were fever, cough, general malaise, and respiratory distress. The high proportion of symptomatic cases reinforces the importance of maintaining effective clinical surveillance mechanisms for timely detection. Furthermore, the identification of asymptomatic patients remains a challenge for controlling community transmission, given their ability to spread the virus inadvertently [
33].
With regard to the presence of comorbidities, data from Tumbes indicate that 71.7% of confirmed cases had no chronic conditions, while 5.6% had one comorbidity and 0.7% had multiple comorbidities. This distribution reflects a relatively low burden of chronic diseases among those infected but does not minimize the clinical impact of comorbidities when they are present. It is noteworthy that pregnant women with comorbidities in Tumbes, such as obesity or hypertension, had higher rates of complications associated with COVID-19. These findings underscore the need to strengthen prevention strategies in vulnerable populations [
34].
Finally, the case fatality rate reported in this study group was 2.3%, which, although a moderate proportion, highlights the importance of continuously improving healthcare systems, especially in high-demand contexts such as during a pandemic. Taken together, these data provide a better understanding of the dynamics of COVID-19 in Tumbes and offer key evidence to guide more effective public health policies in future health emergencies [
35].
The distribution of comorbidities in confirmed cases of COVID-19 in the Tumbes region between 2020 and 2022 reveals a significant difference according to gender. High blood pressure stands out as the most prevalent comorbidity in women, accounting for 60% of all cases with this condition, compared to 40% in men, which is in line with findings observed in other studies conducted in Peru [
36]. This trend has been reported in a study on comorbidities and outcomes in patients with COVID-19 hospitalized in Metropolitan Lima, which found a higher burden of hypertension and obesity in women hospitalized for COVID-19 in Lima, which directly influences the clinical evolution of the disease [
21]. Hypertension was clearly more prevalent in women (60%) than in men (40%), indicating a higher burden in the female population with COVID-19. As for chronic heart disease, although the distribution was more balanced, there was a slight predominance in women (50.3%), and it represented the most frequent comorbidity, with 1287 cases. This correlation has been evidenced by a study that indicates that type 2 diabetes mellitus and cardiovascular conditions are key risk factors for the development of complications from COVID-19 in Peruvian adults, with no marked differences by sex, but with an impact on mortality [
37].
Obesity, although slightly more prevalent in women at 50.8%, is also a relevant factor in patient prognosis. A study on factors associated with the development of severe COVID-19 in obese patients in coastal areas of Peru highlights the relationship between obesity and increased risk of hospitalisation and severity in COVID-19 cases in coastal regions of Peru, such as Tumbes and Piura. This relationship is critical because obesity, in addition to being a pro-inflammatory factor, has been associated with a lower immune response to SARS-CoV-2 [
38].
In contrast, chronic kidney disease showed a higher prevalence in men (62%) in line with a study on clinical characteristics and factors associated with COVID-19 mortality in patients with chronic kidney disease, which identified that men with this condition are at higher risk of mortality from COVID-19. This difference can be explained by the higher number of cardiovascular risk factors in men and lower access to chronic disease management [
39,
40].
Asthma, on the other hand, showed a more equitable distribution, although with a slight female predominance (57%). This coincides with the findings of a study on clinical characteristics and progression in patients in northern Peru, which evaluated the burden of respiratory disease in patients with COVID-19 in hospitals in northern Peru and observed that asthma does not always translate into greater severity, but it does translate into greater outpatient care requirements [
41].
Taken together, these results suggest that the response to SARS-CoV-2 infection was strongly influenced by the presence of pre-existing comorbidities, the distribution of which varied according to sex. This highlights the need to implement gender- differentiated surveillance and control strategies for non-communicable diseases, especially in pandemic contexts.
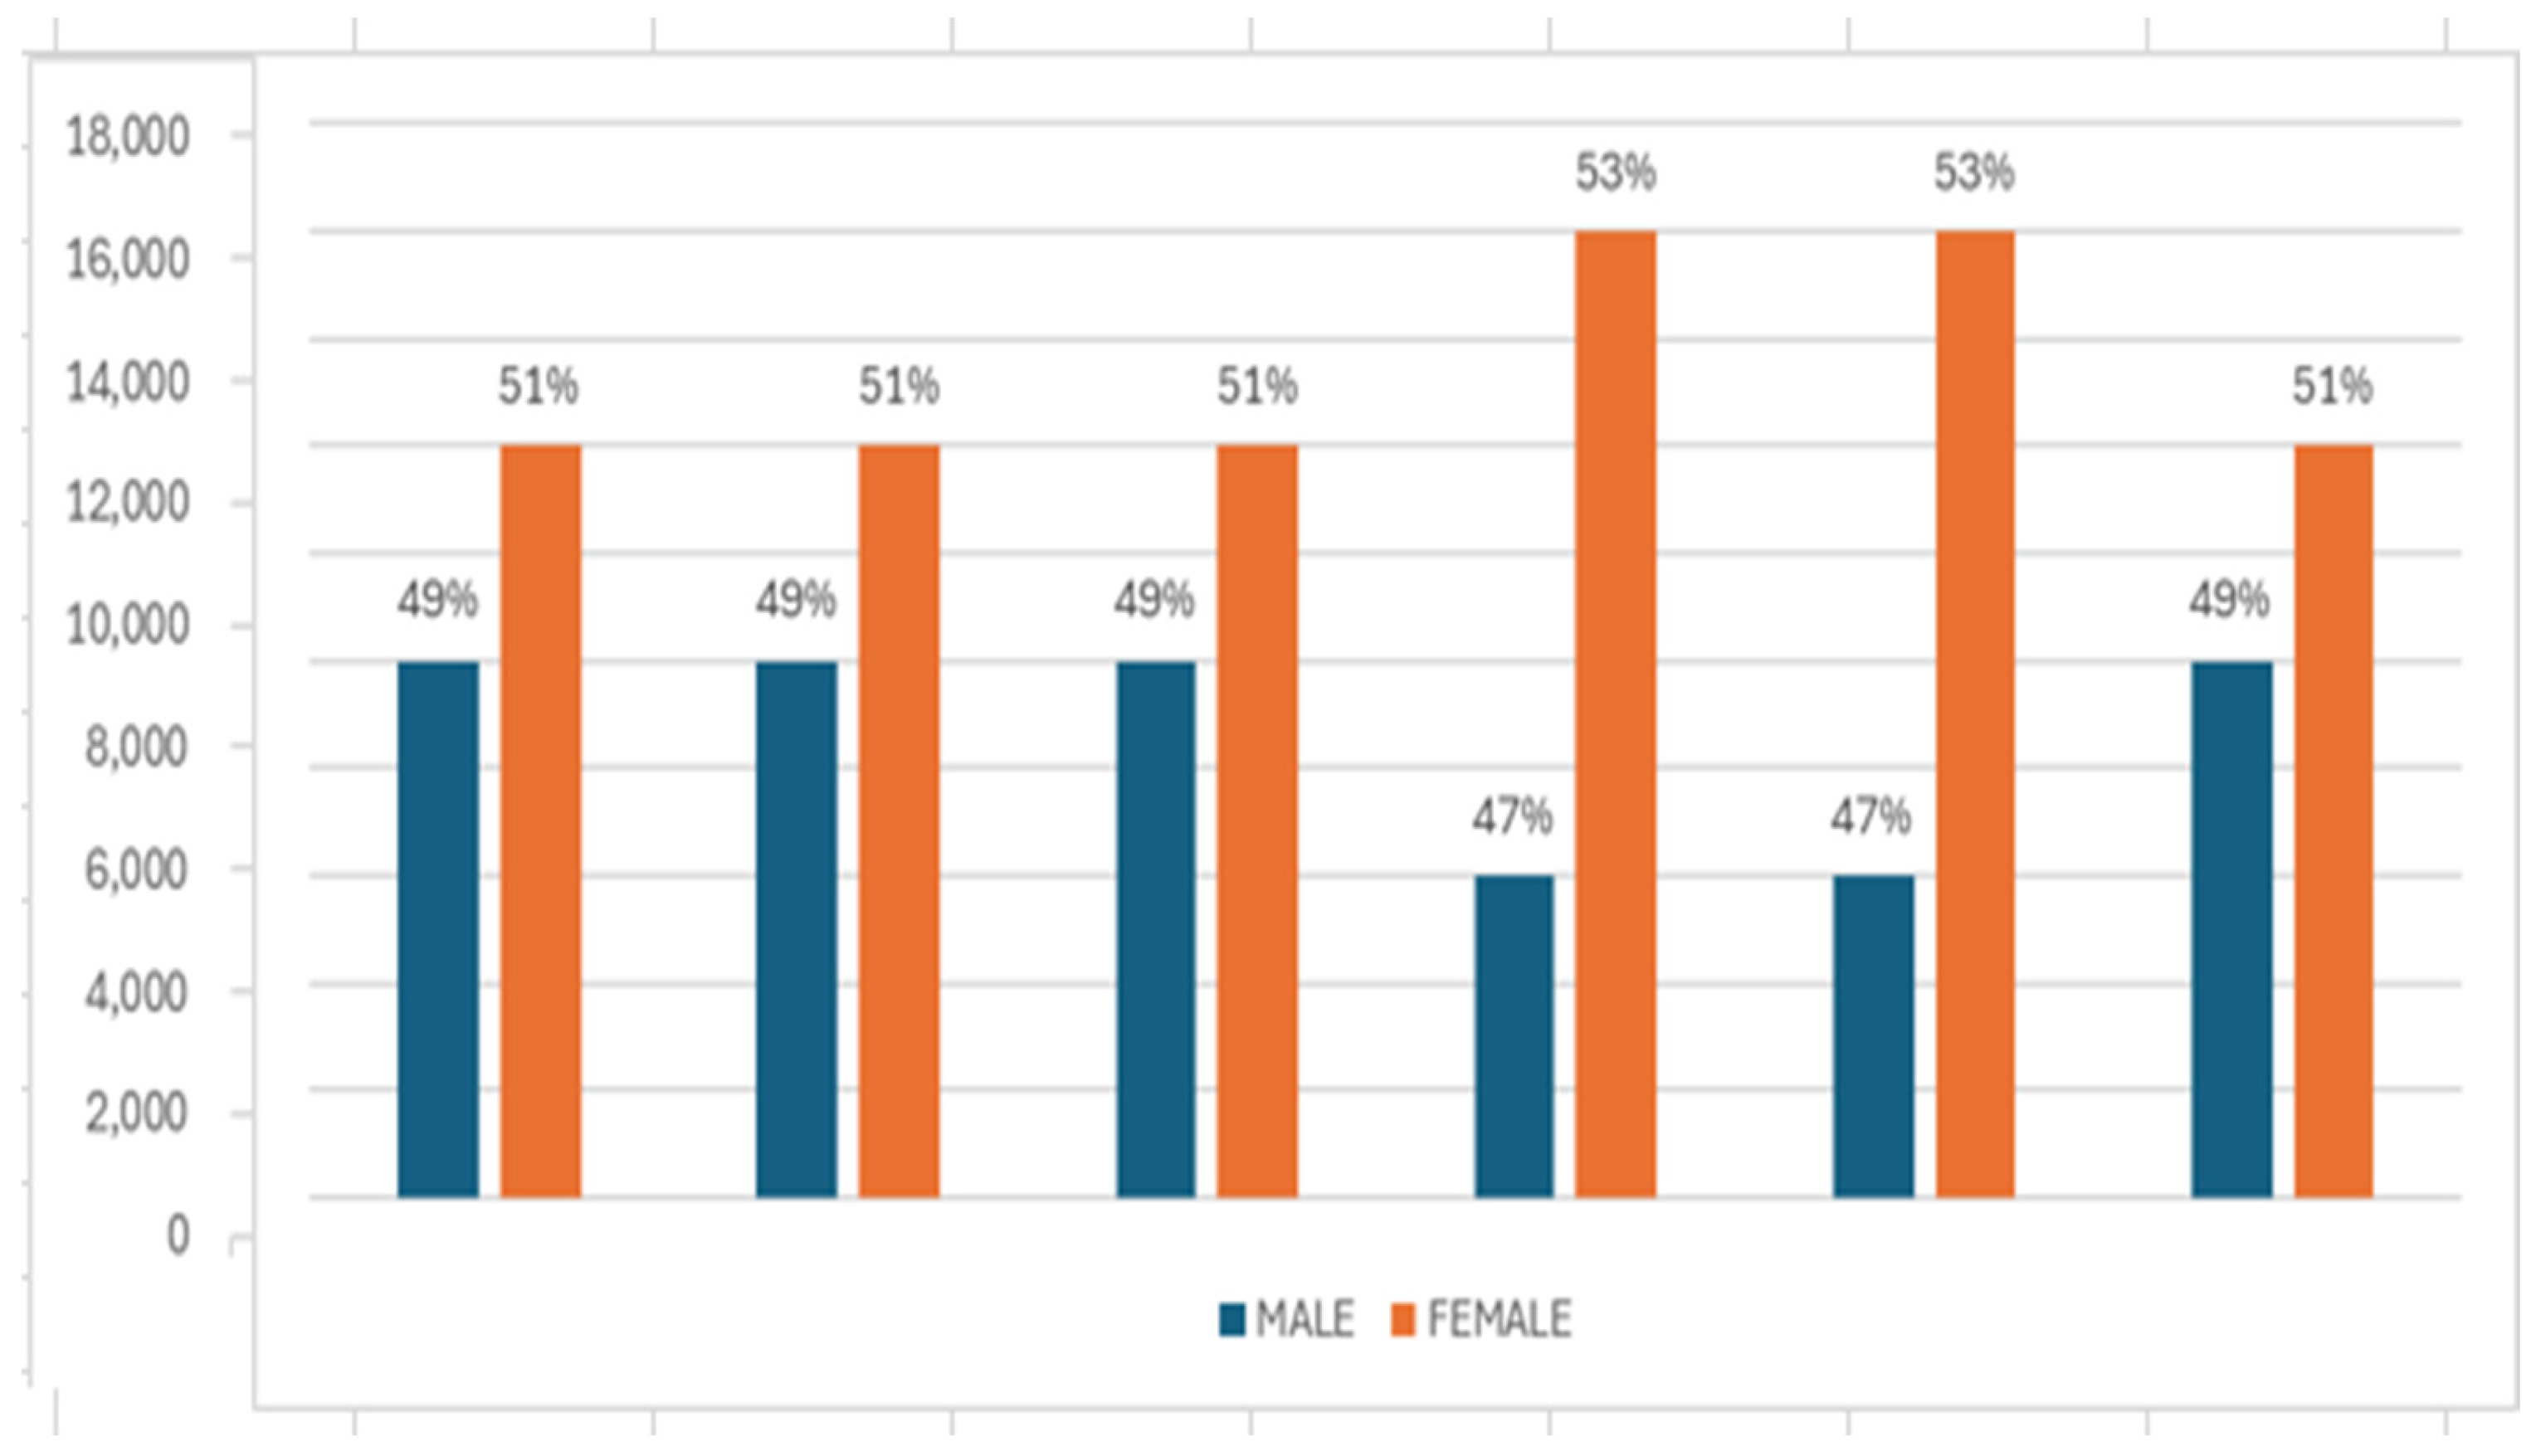
With regard to the distribution of symptoms by gender in confirmed cases of COVID-19 in the Tumbes region between 2020 and 2022, there is a slight predominance of women in the clinical manifestation of the disease. According to the data in Graph 1, women reported a higher number of symptoms such as sore throat, cough, general malaise, headache, nasal congestion, and fever, exceeding men by an average of 2%. This finding coincides with a national study, which documented a higher frequency of mild or moderate symptoms in women, in contrast to a higher proportion of severe cases and mortality in men [
23].
In absolute terms, women had higher numbers of symptoms such as sore throat (14,979 cases), cough (12,630 cases), and general malaise (11,392 cases), which could be related to a greater tendency to report symptoms or greater occupational exposure in essential sectors, such as health or informal trade, where female participation is considerable. In contrast, men reported a higher incidence of chills (51%), which could be due to physiological or immunological differences between the sexes, as suggested by recent research on the differential immune response to SARS-CoV-2 [
42].
Similarly, a study by the INS in 2021 indicated that, although women may present more symptoms at the onset, men tend to develop complications more frequently, which is consistent with the hospitalisation and mortality data observed in different regions of the country [
43]. The slight difference in the proportion of reported symptoms may also be influenced by psychosocial factors and access to diagnosis, as it has been shown that women tend to have greater access to diagnostic tests because they seek health services earlier.



 ,
,