1. Introduction
Since its initial emergence in Wuhan, China, the Coronavirus disease 2019 (COVID-19), caused by SARS-CoV-2, rapidly spread across international borders, affecting all inhabited continents within months. In response to its swift global dissemination, the World Health Organization declared COVID-19 a Public Health Emergency of International Concern on 30 January 2020 and subsequently classified it as a pandemic on March 11 of the same year. With case fatality rates varying greatly according to age, comorbidities, and geographical location, SARS-CoV-2 had infected over 777 million individuals and caused more than 7 million deaths by April 2025, with new cases continuing to be reported worldwide [
1].
The SARS-CoV-2 genome encodes four structural proteins: spike (S), nucleocapsid (N), membrane (M), and envelope (E) [
2]. The spike protein, essential for viral entry, forms a homotrimeric structure comprising two functionally distinct subunits: the S1 subunit, responsible for host cell receptor recognition, and the S2 subunit, which facilitates membrane fusion [
2,
3,
4,
5]. Reverse transcription quantitative polymerase chain reaction (RT-qPCR) was the first diagnostic tool adopted and remains the gold standard for detecting SARS-CoV-2 RNA. However, RT-qPCR is labor-intensive, time-consuming, and dependent on specialized personnel and infrastructure—limitations that are particularly restrictive in resource-limited settings. Furthermore, the sensitivity of RT-qPCR may decline over time as viral load decreases, increasing the risk of false-negative results [
6].
Serological assays, such as enzyme-linked immunosorbent assays (ELISAs), offer several operational advantages. They are faster, more cost-effective, and less reliant on complex laboratory infrastructure [
7,
8]. In this context, we report the development, optimization, and validation of ELISA assays using recombinant S1 and S2 antigens for the detection of SARS-CoV-2-specific IgG antibodies.
2. Materials and Methods
2.1. Study Design and Sample Collection
Sample size was calculated using the Buderer’s formula [
9], ensuring statistical robustness with at least 173 positive and 62 negative samples (considering an expected sensitivity of 90%, expected specificity of 85%, 95% confidence interval (95% CI), with precision within 10%, and an expected disease prevalence of 20%). In order to ensure robustness of the results, a total of 691 serum samples were analyzed. Of these, 354 were obtained from 128 individuals hospitalized with COVID-19 between March and October 2020 in Salvador, Brazil, and the surrounding areas (Aliança and Aeroporto hospitals). Peripheral blood (9 mL) was collected using clot-activator tubes with gel separators (Vacuplast, Brazil) in collaboration with hospital clinical teams. After a 30 min clotting period at room temperature, samples were centrifuged at 3000×
g for 10 min. Serum was aliquoted into cryotubes, transported to the Gonçalo Moniz Institute (Fiocruz-BA), and stored at −20 °C until analysis. These samples were stratified by days post-symptom onset (PSO): 0–7 days (n = 147), 8–14 days (n = 133), 15–21 days (n = 31), and >22 days (n = 43).
Additionally, 337 pre-pandemic serum samples collected before December 2019 from healthy blood donors were obtained from the Bahia State Blood Bank Foundation (HEMOBA). All COVID-19 cases were confirmed by RT-qPCR and had documented clinical symptoms. Samples were further evaluated using three commercial assays: GOLD ELISA COVID-19 IgG+IgM (REM Diagnóstica, São Paulo, Brazil), Anti-SARS-CoV-2 NCP ELISA IgG (EUROIMMUN Medizinische Labordiagnostika AG, Lübeck, Germany), and Anti-SARS-CoV-2 NCP ELISA IgM (EUROIMMUN Medizinische Labordiagnostika AG, Lübeck, Germany).
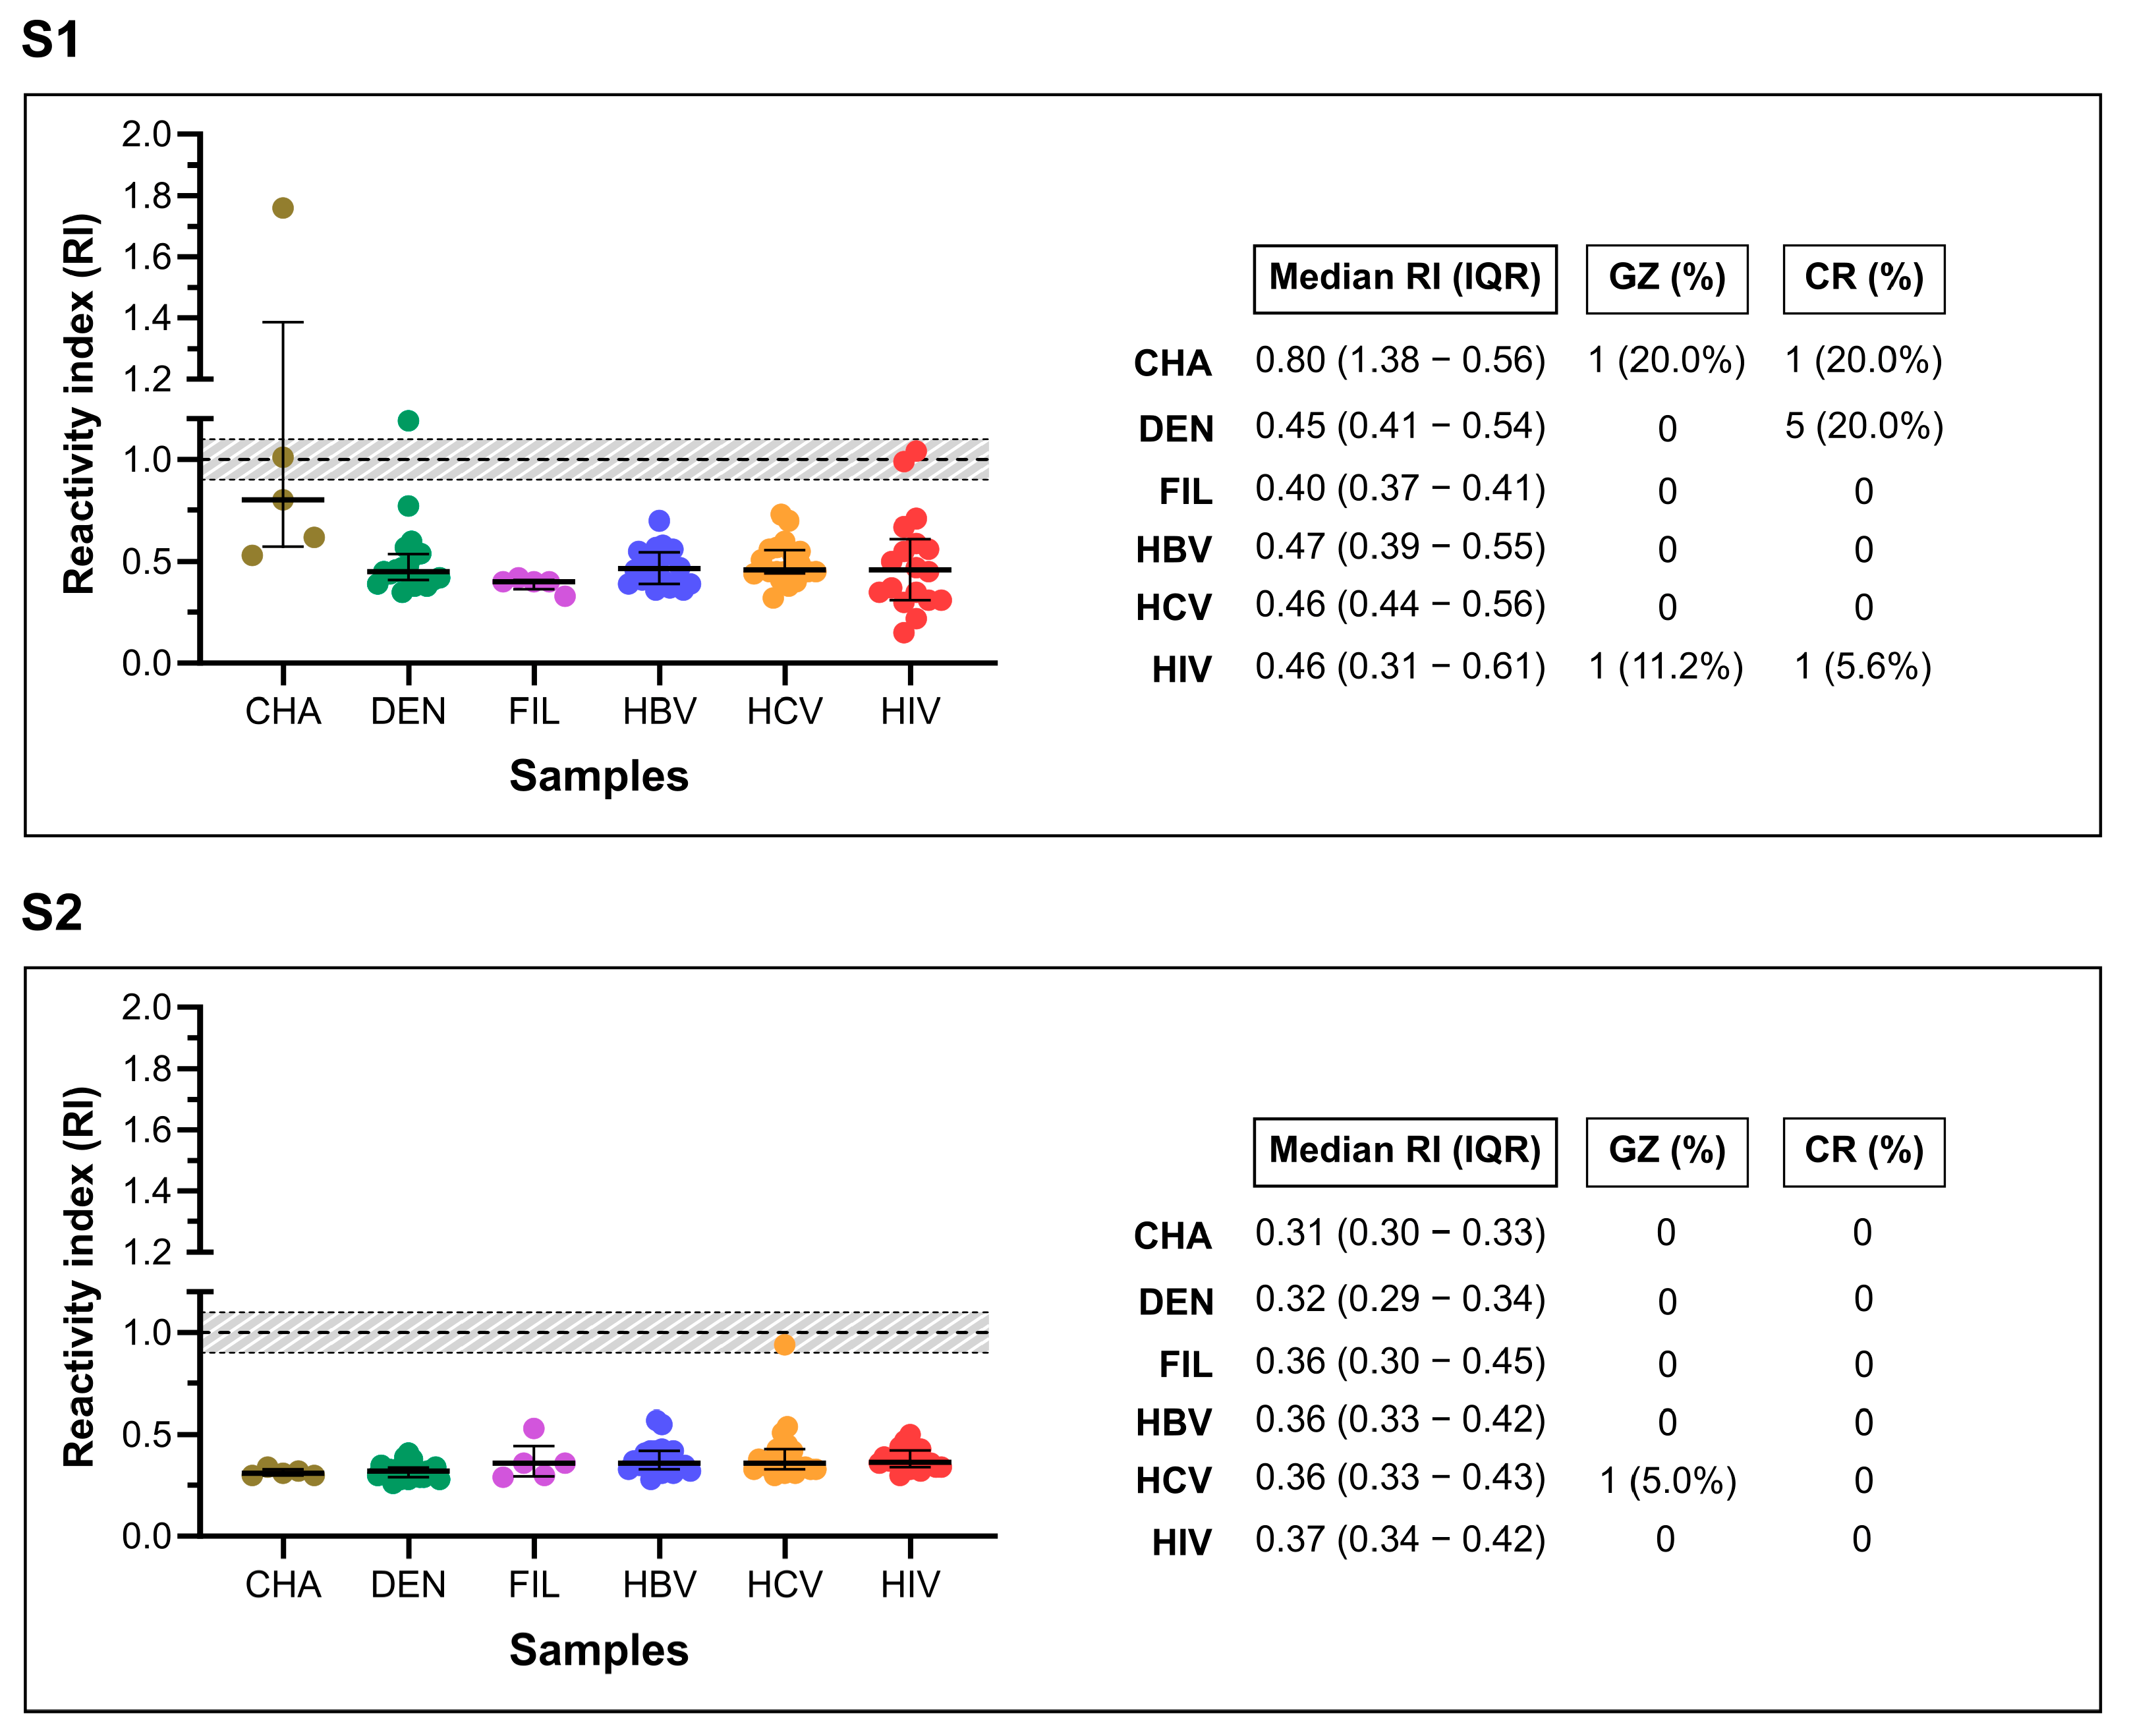
A separate panel of 88 pre-pandemic samples from individuals with other infectious or parasitic diseases was used to assess cross-reactivity: Chagas disease (n = 5), dengue (n = 20), filariasis (n = 5), hepatitis B (HBV, n = 20), hepatitis C (HCV, n = 20), and HIV-1/2 (n = 18).
2.2. Antigen Selection
Recombinant SARS-CoV-2 S1 and S2 spike protein subunits were purchased from Creative Diagnostics (Shirley, NY, USA). The truncated S1 antigen (ref. DAGC157) was expressed in Escherichia coli, while the S2 antigen (ref. DAGC153), corresponding to residues Ser686–Pro1213 of the spike protein (NCBI ref. YP_009724390.1), was expressed in insect cells. The selection of S1 and S2 as target antigens was based on their essential roles in viral entry and their strong immunogenic potential. Expression systems were chosen according to the structural complexity of each subunit: S1, with fewer post-translational modifications, was suitably expressed in E. coli, while the more structurally intricate S2 subunit required expression in eukaryotic insect cells.
2.3. S1 and S2 Enzyme-Linked Immunosorbent Assay
Optimal dilutions for antigen coating, serum samples, and enzyme-conjugated antibodies were determined by checkerboard titration. Flat-bottom 96-well polystyrene microplates (Corning® Costar, Glendale, AZ, USA) were coated overnight at 4 °C with either 200 ng/well of S1 or 100 ng/well of S2 antigens, diluted in 100 µL carbonate–bicarbonate buffer (pH 9.6). Plates were then blocked with 100 µL of WellChampion™ synthetic blocking buffer (Ken-En-Tec Diagnostics A/S, Taastrup, Denmark) for 90 min at room temperature, following the manufacturer’s instructions. Serum samples were diluted to 1:25 for the S1-ELISA and 1:200 for the S2-ELISA in 100 µL of PBS containing 0.05% Tween-20 (PBS-T, pH 7.4) and incubated at 37 °C for 1 h. Plates were washed five times with 250 µL of PBS-T, followed by the addition of 100 µL of horseradish peroxidase (HRP)-conjugated goat anti-human antibodies (Bio-Manguinhos, Fiocruz/RJ, Brazil) diluted 1:40,000 in PBS-T. After a 30 min incubation at room temperature, plates were washed again five times with 250 µL of PBS-T. Color development was achieved by adding 100 µL of TMB Plus substrate (Ken-En-Tec Diagnostics A/S) to each well and incubating the plates for 15 min at room temperature in the dark. The reaction was stopped with 50 µL of 0.3 M sulfuric acid (H2SO4), and absorbance was measured at 450 nm using a microplate reader (SPECTRAmax 340PC®, San José, CA, USA).
2.4. Statistical Analysis
Descriptive statistics, including geometric means, confidence intervals (CIs), and p-values, were calculated to summarize the data. Statistical significance was defined as p < 0.05 or non-overlapping 95% CIs. All analyses were conducted using GraphPad Prism v9.5.1 (GraphPad Software Inc., Chicago, IL, USA) and MedCalc v20.110 (MedCalc Software Ltd., Ostend, Belgium).
Cut-off (CO) values were established using two approaches: for the S1-ELISA, CO was determined by receiver operating characteristic (ROC) curve analysis; for the S2-ELISA, CO was calculated as twice the mean optical density (OD) of the negative control samples. To standardize results across different runs, a reactivity index (RI) was calculated as the ratio of the sample’s OD to the CO value. Samples were classified as positive (RI ≥ 1.0), negative (RI < 0.9), or inconclusive (RI 0.9–1.1), with the latter considered a “gray zone” (±10% around the CO).
Diagnostic performance metrics included sensitivity (Sen), specificity (Spe), accuracy (Acc), positive likelihood ratio (LR
+), negative likelihood ratio (LR
−), and diagnostic odds ratio (DOR). ROC curves were generated, and the area under the curve (AUC) was calculated to evaluate discriminatory power, interpreted as low (0.51–0.61), moderate (0.62–0.81), high (0.82–0.99), or outstanding (1.0) [
10]. Agreement between in-house and commercial assays was assessed using Cohen’s kappa coefficient (κ), interpretated as: almost perfect (κ = 1.00–0.81), substantial (0.80–0.61), moderate (0.60–0.41), fair (0.40–0.21), slight (0.20–0.00), and poor (<0.00) [
11]. Differences between paired proportions were evaluated using McNemar’s test, with
p < 0.05 indicating statistical significance.
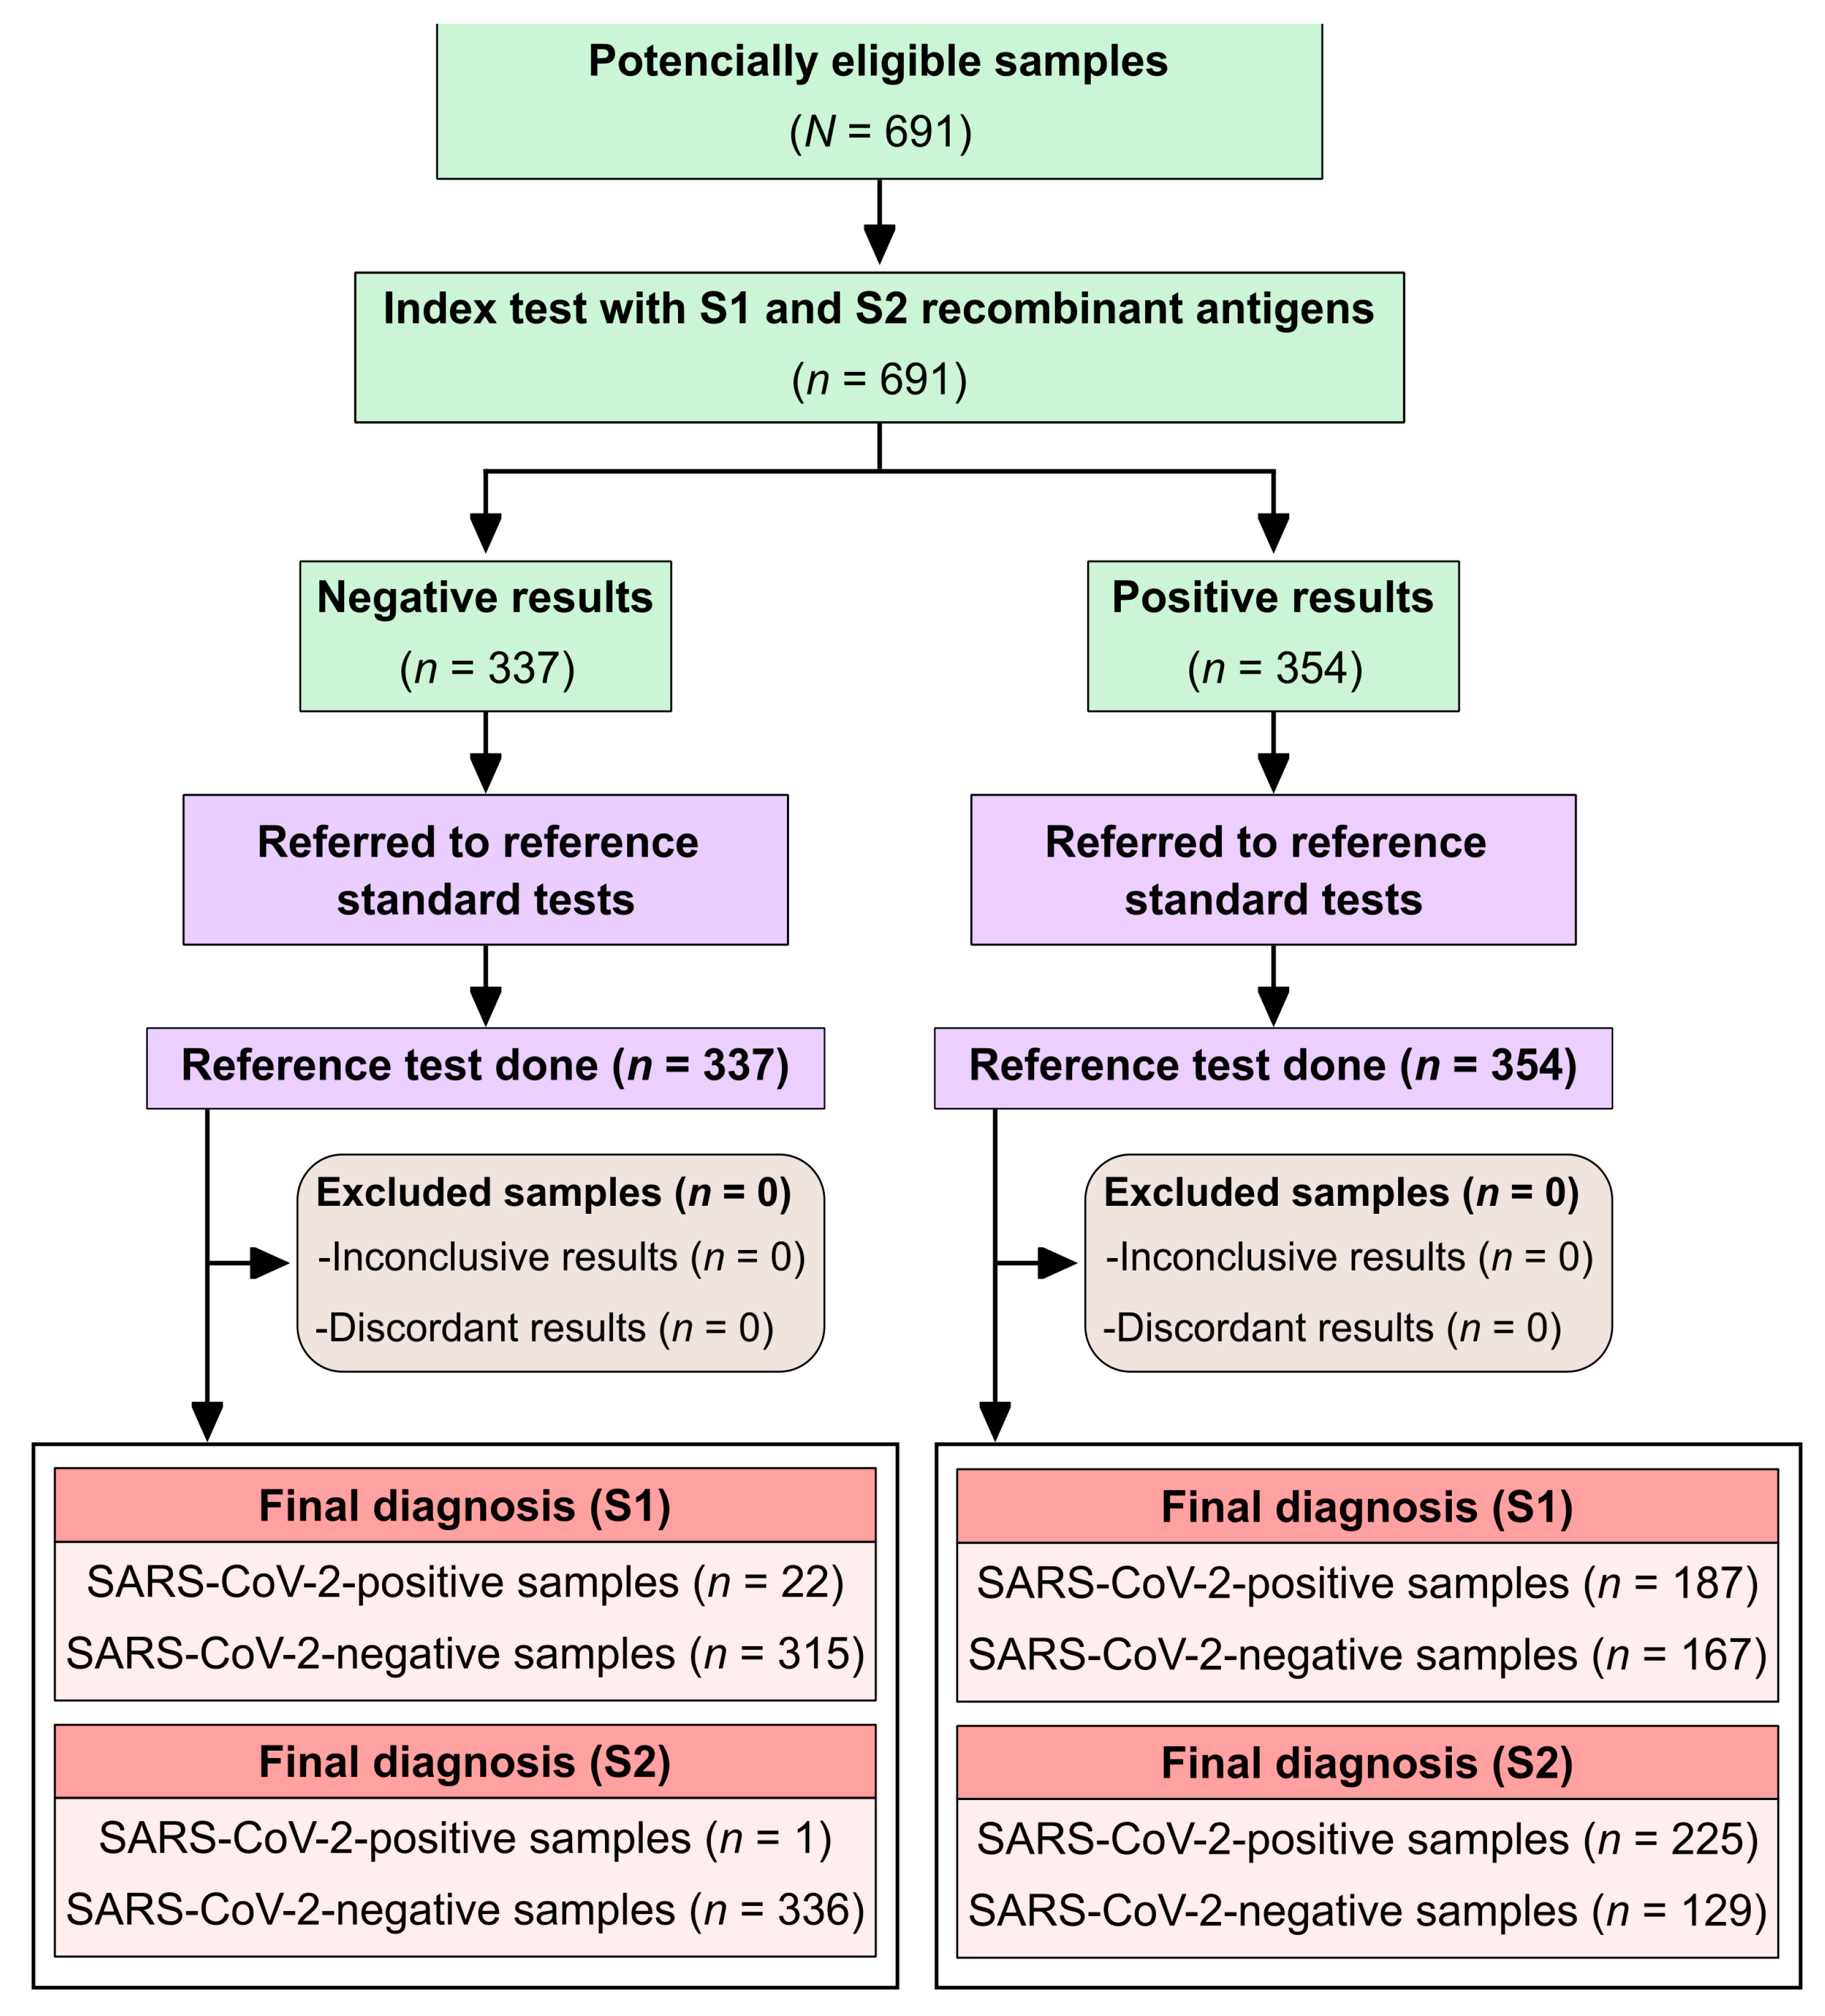
To comply with STARD (Standards for Reporting of Diagnostic Accuracy Studies) guidelines [
12], a study flowchart was included (
Figure 1).
3. Results
A total of 691 serum samples were analyzed. Among the 128 individuals with confirmed SARS-CoV-2 infection, the median age was 45 years (interquartile range [IQR]: 32.5–66.0), and the female-to-male ratio was 0.85:1. Of these, 82 individuals (64%) were admitted to an intensive care unit (ICU). Clinical outcomes were available for 122 individuals: 18 (14.8%) died, while 104 (85.2%) recovered and were discharged. The most commonly reported symptoms included fever in 57.1% (64/112), cough in 70.8% (75/106), and dyspnea in 58.7% (64/109). No age information was available for the SARS-CoV-2-negative group (n = 354), which had a female-to-male ratio of 1:1.6. All blood donors were residents of the state of Bahia, Brazil.
The in-house S1-ELISA detected anti-SARS-CoV-2 antibodies in 187 of the 354 positive samples (
Figure 2), corresponding to a sensitivity of 52.8% (95% CI: 47.6–58.0%). Among the 337 negative samples, 22 were false positives, resulting in a specificity of 93.5% (95% CI: 90.3–95.6%). The area under the ROC curve (AUC) was 71.6% (95% CI: 67.5–75.6%), indicating moderate diagnostic performance. Overall accuracy was 72.6% (95% CI: 69.2–75.8%), and the Cohen’s kappa coefficient was 0.46 (95% CI: 0.39–0.52), indicating moderate agreement. The diagnostic odds ratio (DOR) was 16.0 (95% CI: 9.9–25.9).
The S2-ELISA detected antibodies in 225 of the 354 positive samples (
Figure 2), yielding a sensitivity of 63.7% (95% CI: 58.6–68.6%) and only 1 false-positive result among the 337 negative samples, resulting in a specificity of 99.7% (95% CI: 98.3–99.9%). The AUC was 83.1% (95% CI: 79.9–86.4%), indicating high diagnostic performance. Overall accuracy reached 81.3% (95% CI: 78.2–84.0%), and the Cohen’s kappa coefficient was 0.63 (95% CI: 0.57–0.69), reflecting substantial agreement. The DOR was 590.6 (95% CI: 82.0–4255.9). No statistically significant difference in diagnostic performance was observed between the S1-ELISA and the S2-ELISA (
p = 0.1078; OR = 1.42; 95% CI: 0.93–2.17).
As summarized in
Table 1, the sensitivity of the S2-ELISA surpassed that of the commercial assays, except for the GOLD ELISA, where overlapping confidence intervals were observed. All assays demonstrated specificities above 90%. In terms of accuracy, the in-house ELISAs outperformed the commercial kits, although the confidence intervals of S1-ELISA and the GOLD ELISA overlapped.
McNemar’s test was used to compare performance. The S1-IgG ELISA showed no significant difference compared to the GOLD ELISA (p = 0.5962; OR = 1.19; 95% CI: 0.69–2.09) but significantly outperformed EURO IgG (p = 0.0001; OR = 0.32; 95% CI: 0.20–0.52) and EURO IgM assays (p = 0.0015; OR = 0.51; 95% CI: 0.33–0.78). The S2-IgG ELISA demonstrated statistically better performance than all commercial assays: GOLD ELISA (p = 0.0043; OR = 0.40; 95% CI: 0.20–0.76), EURO IgG (p = 0.0001; OR = 0.11; 95% CI: 0.05–0.22), and EURO IgM (p = 0.0001; OR = 0.23; 95% CI: 0.13–0.38).
A time-stratified analysis of sensitivity (
Table 2) revealed a consistent pattern across all assays: sensitivity increased with time after symptom onset, peaking at 15–21 days PSO, followed by a slight decline beyond 22 days. The lowest sensitivities were observed in the 0–7–day interval. Notably, the EURO IgM assay showed the most pronounced reduction in sensitivity beyond 22 days PSO.
To evaluate cross-reactivity, the in-house assays were tested against 88 pre-pandemic samples from individuals with unrelated infections (
Figure 3). The S1-ELISA produced two false-positive results, one from a dengue-positive individual (1/20) and one from an HIV-positive individual (1/18), indicating limited cross-reactivity. In contrast, the S2-ELISA showed no cross-reactivity, with all 88 samples testing negative, confirming 100% specificity within this panel.
4. Discussion
In this study, we developed and validated two in-house ELISAs targeting the spike (S) protein subunits S1 and S2 for the detection of anti-SARS-CoV-2 IgG antibodies. Among these, the S2-based assay demonstrated superior diagnostic performance compared to three commercial kits. Specifically, the S2-ELISA exhibited high specificity, favorable sensitivity over time, and an exceptional diagnostic odds ratio (DOR), underscoring its potential as an antigenic target for serodiagnosis.
The S2-ELISA achieved a sensitivity of 63.7%, specificity of 99.7%, and an AUC of 83.1%, resulting in a DOR of 590.6. Remarkably, the assay showed no cross-reactivity with a panel of 88 pre-pandemic sera from individuals with other infectious diseases. In contrast, the S1-based ELISA showed lower sensitivity (52.5%) and two false-positive results (from dengue and HIV-positive samples), yielding a specificity of 93.8%. These differences reflect the distinct immunogenic and structural properties of the S1 and S2 subunits, with the more conserved and less glycosylated S2 domain likely contributing to its enhanced specificity.
Temporal analysis confirmed a common serological pattern: all assays showed limited sensitivity during the early phase (0–7 days post-symptom onset), followed by increased sensitivity peaking between 15 and 21 days. This trend, consistent with prior reports [
13], reflects the dynamics of the humoral immune response. After 22 days, IgG-based assays, especially the S2-ELISA, retained high sensitivity, while IgM assays, such as the EURO IgM, showed a marked decline, reinforcing the use of IgG detection for retrospective diagnosis and seroepidemiological studies.
A key factor influencing assay performance is the antigenic composition and isotype specificity of the commercial comparators. The GOLD ELISA, which detects both IgG and IgM against a mixture of S1, S2, and nucleocapsid (N) antigens, was designed for enhanced sensitivity. Nonetheless, it yielded a sensitivity of only 57.6% and a lower specificity than the S2-ELISA. These findings demonstrate that, even without IgM detection or N antigen inclusion, the S2-ELISA not only matched but exceeded the performance of this broader-spectrum commercial test, highlighting its efficiency and diagnostic value.
Compared to other targets such as N or S1, the S2 domain appears particularly well-suited for serological testing. While N-based assays may be advantageous early in infection, they often show reduced specificity and increased cross-reactivity [
14,
15]. Conversely, spike-based assays, particularly those incorporating the S2 domain or receptor-binding domain (RBD), tend to achieve higher specificity and sustained performance, making them more appropriate for serosurveillance, vaccine response monitoring, and post-acute diagnosis [
16,
17].
It is important to contextualize these findings within the diagnostic landscape in Brazil between March and October 2020, when the comparator assays were in widespread clinical use. Although additional international commercial kits could offer further comparisons, our study focused on assays that were available and relevant within the Brazilian public health context. This pragmatic approach strengthens the relevance of our findings for low-resource and decentralized settings, where access, affordability, and simplicity are key operational priorities.
This study has limitations. First, the sensitivity estimates were predominantly from hospitalized individuals with moderate-to-severe COVID-19. As disease severity is known to influence the magnitude and kinetics of antibody responses, our results may overestimate assay sensitivity in mild or asymptomatic cases. Individuals with milder illness may produce lower antibody titers or exhibit delayed seroconversion. Therefore, further studies evaluating S2-ELISA performance in community-based cohorts are essential for assessing its full diagnostic utility. Second, while our cross-reactivity panel was diverse, the sample size was modest; expanded validation in larger and geographically diverse populations is needed. Third, we did not assess the neutralizing activity of detected antibodies. Although our focus was on diagnostic accuracy, characterizing the functional relevance of anti-S2 responses could provide valuable insights for immunological studies.
The development of accurate, affordable, and easy-to-implement serological assays remains a global priority, not only to support ongoing surveillance of SARS-CoV-2 circulation and population-level immunity but also to prepare for future waves or emerging variants of concern. In settings with limited access to molecular diagnostics, validated serological tools are indispensable for tracking virus circulation, estimating population-level immunity, and informing public health strategies. The performance of the S2-ELISA, coupled with its operational simplicity, supports its potential deployment in resource-limited environments and underscores its broader relevance for pandemic preparedness. Future work will include external validation using independent sample cohorts to assess generalizability and reinforce the assay’s applicability across different epidemiological settings.


 ,
, 


