Article

Geographical Mapping of COVID-19 Testing Rates in St. Louis: Influence of the Socioeconomic Index and Race on Testing in the Early Phase and Peak of the COVID-19 Pandemic

1
St. John’s Episcopal Hospital, Queens, NY 11691, USA
2
Washington University, St. Louis, MO 63130, USA
3
Department of Geography, University of Bonn, 53113 Bonn, Germany
4
Cleveland Clinic, Cleveland, OH 44195, USA
5
Department of Cardio-Oncology, University of Texas, San Antonio, TX 78229, USA
6
Harvard T.H. Chan School of Public Health, Harvard University, Boston, MA 02138, USA
*
Author to whom correspondence should be addressed.
COVID 2024, 4(9), 1463-1475; https://doi.org/10.3390/covid4090103
Submission received: 27 August 2024 / Revised: 9 September 2024 / Accepted: 10 September 2024 / Published: 15 September 2024

Abstract

:
Purpose: This study aimed to explore how race and the socioeconomic index (SES) of residential zip codes influenced COVID-19 testing rates in St. Louis during the early and peak phases of the pandemic. Method: An ecological study was conducted using COVID-19 testing data from March to November 2020 in St. Louis City, including 16,915 tests from 30 residential zip codes. Geographical mapping identified areas lacking testing, descriptive statistics characterized testing rates by race and SES, and robust linear regression modeled the association between testing rates and race, controlling for SES. Results: The overall testing rate was 303.97 per 10,000 population. Testing rates among Blacks, Whites, American Indians/Alaskan Natives, and Asians were 374.26, 247.77, 360.63, and 242.41 per 10,000, respectively. Higher rates were observed in low- and middle-SES zip codes compared with high-SES areas. Adjusted for SES, testing rates per 10,000 were higher by 125 (1.25%), 448 (4.48%), and 32 (0.32%) among Blacks, American Indians/Alaskan Natives, and Asians compared with Whites. Testing rates decreased by 56 (0.56%) per unit SES improvement. There was statistically significant SES finding and that of the difference between American Indians/Alaskan Natives and Whites. Geographical mapping showed higher rates in the inner core and lower rates in the periphery of St. Louis. Conclusions: Race and SES influence testing rates. Targeted interventions are needed in areas with low testing rates in St. Louis.

1. Introduction

Background

The COVID-19 pandemic has had a globally devastating effect on many sectors of human life, such as health, economic, and social systems. Though the toll continues to be seen and felt, this was especially so in the early and peak phases of the pandemic. Over 500 million cases and 6 million deaths have been reported globally [1]. In the United States (US), there are well over 80 million cases and 950,000 reported deaths [2,3]. At a more disaggregated, granular level, there appears to be a disproportionate burden of COVID-19 morbidity and mortality among racial minorities in the US [4].
A review of current literature shows that research on COVID-19 around racial disparities is increasing [5]. However, the majority of published studies focus on clinical outcomes, such as morbidity—often quantified by hospitalizations—and COVID-19-related mortality [5,6]. While some studies have explored COVID-19 testing rates, these are fewer in number, despite testing being a crucial factor that can help explain the mechanisms behind these disparities [7,8,9,10,11,12,13,14].
Access to testing and testing behaviors are essential factors to contain any pandemic, especially in the early and peak phases where there are limited and restricted testing resources. Testing can serve as a proxy measure that provides crucial insights into access to health care and its delivery, mainly because, prior to COVID-19 testing becoming more readily available, there was limited/restricted access to testing in the early part of the pandemic [15]. Hence, a careful analysis of testing data may reveal patterns and trends that allude to disparities in healthcare access.
Secondly, determinants of health such as socioeconomic status, education, healthcare insurance, and others may shape access to testing. Low testing trends may partly provide insights into why there are disparities in communities of color. Additionally, insights from testing patterns can inform targeted interventions and programs to improve access to testing and other healthcare services for disadvantaged groups. Several studies have explored the relationship among race, SES, and COVID-19 testing [7,8,9,10,11,12,13,14]. For instance, a study in the San Francisco Bay Area found that individuals with higher social vulnerability were less likely to get tested [8]. Similarly, research in New York and the city of Chicago showed that predominantly white neighborhoods had significantly higher testing rates [9]. A nationwide study in the US found that people with lower SES were at greater risk of COVID-19 exposure and worse outcomes [10]. Another study reported that racial minorities, particularly Black and Latino populations, faced significant barriers to testing, worsened by socioeconomic disadvantages [11]. Additional studies in cities such as Chicago, New York City, and Seattle and across Texas indicated that white-majority neighborhoods had higher COVID-19 testing rates, while minority communities had lower rates [9,12,13,14].
Despite these findings, no study has examined the geographical and socioeconomic factors influencing testing patterns in the diverse metropolitan of the St. Louis region, a city that has historically suffered from racial segregation and resultant health disparities as a corollary effect [16,17]. This study aims to fill this gap by evaluating the influence of race and socioeconomic status on COVID-19 testing rates and identifying geographical clusters with insufficient testing for targeted public health interventions.
Specifically, this study seeks to answer the following questions:
  • How do race and socioeconomic status influence COVID-19 testing rates in St. Louis?
  • Are there geographical clusters of low testing rates within specific zip codes?
  • What are the implications of these findings for public health interventions?
Understanding the disparities in COVID-19 testing is crucial for several reasons. First, it helps identify barriers to healthcare access and delivery that contribute to broader health disparities. Second, it provides a basis for targeted public health interventions aimed at improving testing access in underserved communities. Finally, this study contributes to the literature by addressing a gap in the understanding of non-clinical factors influencing COVID-19 disparities, thus offering insights that can inform future pandemic responses and public health strategies.
This study focuses on the St. Louis region, which, as of 2021, had a demographic composition of 45.5% White (non-Hispanic), 43.9% Black (non-Hispanic), 4.4% Hispanic, and 3.5% Asian (non-Hispanic), with all other racial and ethnic groups constituting 2.7% [18]. The region’s history of racial segregation, epitomized by the “Delmar Divide” [19,20], has led to significant disparities in health outcomes, access to services, and overall quality of life [21,22,23,24,25]. By examining the interplay among race, socioeconomic status, and testing rates, this study aims to provide actionable insights that can mitigate these disparities and enhance public health response in St. Louis and similar urban areas.
The first confirmed COVID-19 case in St. Louis was reported on 7 March 2020 [26,27], with the first death occurring on 22 March 2020 [28]. As of November 2022, there have been 58,807 confirmed cases, translating to 19,499 cases per 100,000 people, and 801 confirmed deaths, equivalent to 265.6 deaths per 100,000 people [29]. This study’s findings will be contextualized within this timeline and demographic framework to provide a comprehensive understanding of the factors influencing COVID-19 testing rates in St. Louis.

2. Materials and Methods

2.1. Data

We conducted an ecological study using COVID-19 testing data from the City of St. Louis Department of Health COVID-19 database. The Department received and collated data from hospitals and testing centers within the city limits. The data included in this analysis were from March to November 2020. There were 16,915 individual COVID-19 tests performed within this period. Variables selected for this study included race and the socioeconomic index (SES) of residential zip codes in St. Louis City. Race had 5 categories including White, Black/African American, Asian, a combined category of American Indian/Alaskan Native, and other, representing all other races or people of a mixed race. However, our analysis limited the race variable to White, Black/African American, Asian, and American Indian/Alaskan. We excluded the “other” level in the race category because we did not know which races were aggregated as “other”. We excluded zip codes outside the limit of St. Louis City. Other variables in the City of St. Louis Department of Health COVID-19 database included age, gender, test result (defined as positive, negative, indeterminate), test type (defined as PCR, etc.), test date, etc. However, since this was an ecological study, where we analyzed aggregated data at the ZIP code level, we could only include variables for which population sizes were known at this level. Unfortunately, apart from race, variables such as gender and age did not have their population sizes provided at the ZIP code level. We assumed that a further breakdown into gender, age groups, and race would result in population sizes that were too small and narrow, falling below the threshold for data sharing. Therefore, we only included the race variable in our study, as it was the only variable for which we could estimate the testing rate.
We extracted the test month from the stated test date as the month in which the COVID-19 testing was performed. We defined the socioeconomic index (SES) from the socioeconomic deprivation scores variable of the Missouri Health Rankings Project, utilizing data from the Washington University School of Medicine and Hospital Industry Data Institute [30], whose source data are from census-based zip code-level data and primary data from hospital discharges at the zip code level in St. Louis. The socioeconomic deprivation index scores considered factors such as low education, high school education, college education, childhood poverty, unemployment, household size, median home value, Medicaid, uninsured, non-English speakers, median household income, racial income inequality, renter-occupied housing, single-parent households, unmarried adults, and blue-collar workers, making it an excellent approximate measure for socioeconomic status at the zip code level. The socioeconomic deprivation scores generally ranged from −6 to 3, with residential zip codes with higher deprivation scores being worse off in socioeconomic standards than those with lower deprivation scores. The residential zip codes included in our study had deprivation scores that ranged from −4.91 to 2.12. To ensure a straightforward interpretation of our results, we defined our socioeconomic index scores to be 3.12—deprivation index scores; that way, the maximum deprivation score became our minimum socioeconomic index score of 1, and the minimum deprivation score of −4.91 became our maximum socioeconomic index score of 8.03. Thus, an increase in the socioeconomic index (SES) represents an improvement in the socioeconomic standards of residential zip codes.
The outcome variable was COVID-19 tests performed within the period, and the testing rate was estimated as the individual COVID-19 tests performed in each zip code divided by the population size in that zip code. We estimated the testing rate of each race at the zip code as the tests performed by each race divided by the racial population size at that zip code. The data on racial population size and percentage racial distribution for each zip code were extracted from Think Health St. Louis, a web-based population data and community health information data source for community assessment, strategic planning, advocacy, etc., for policymakers and community members of St. Louis City and County. More details on this data source can be found at www.ThinkHealthSTL.org (accessed on 20 February 2022). A total of 30 zip codes met our inclusion criteria within the city limits of St. Louis. See Figure 1 for the inclusion and exclusion criteria.

2.2. Statistical Analysis

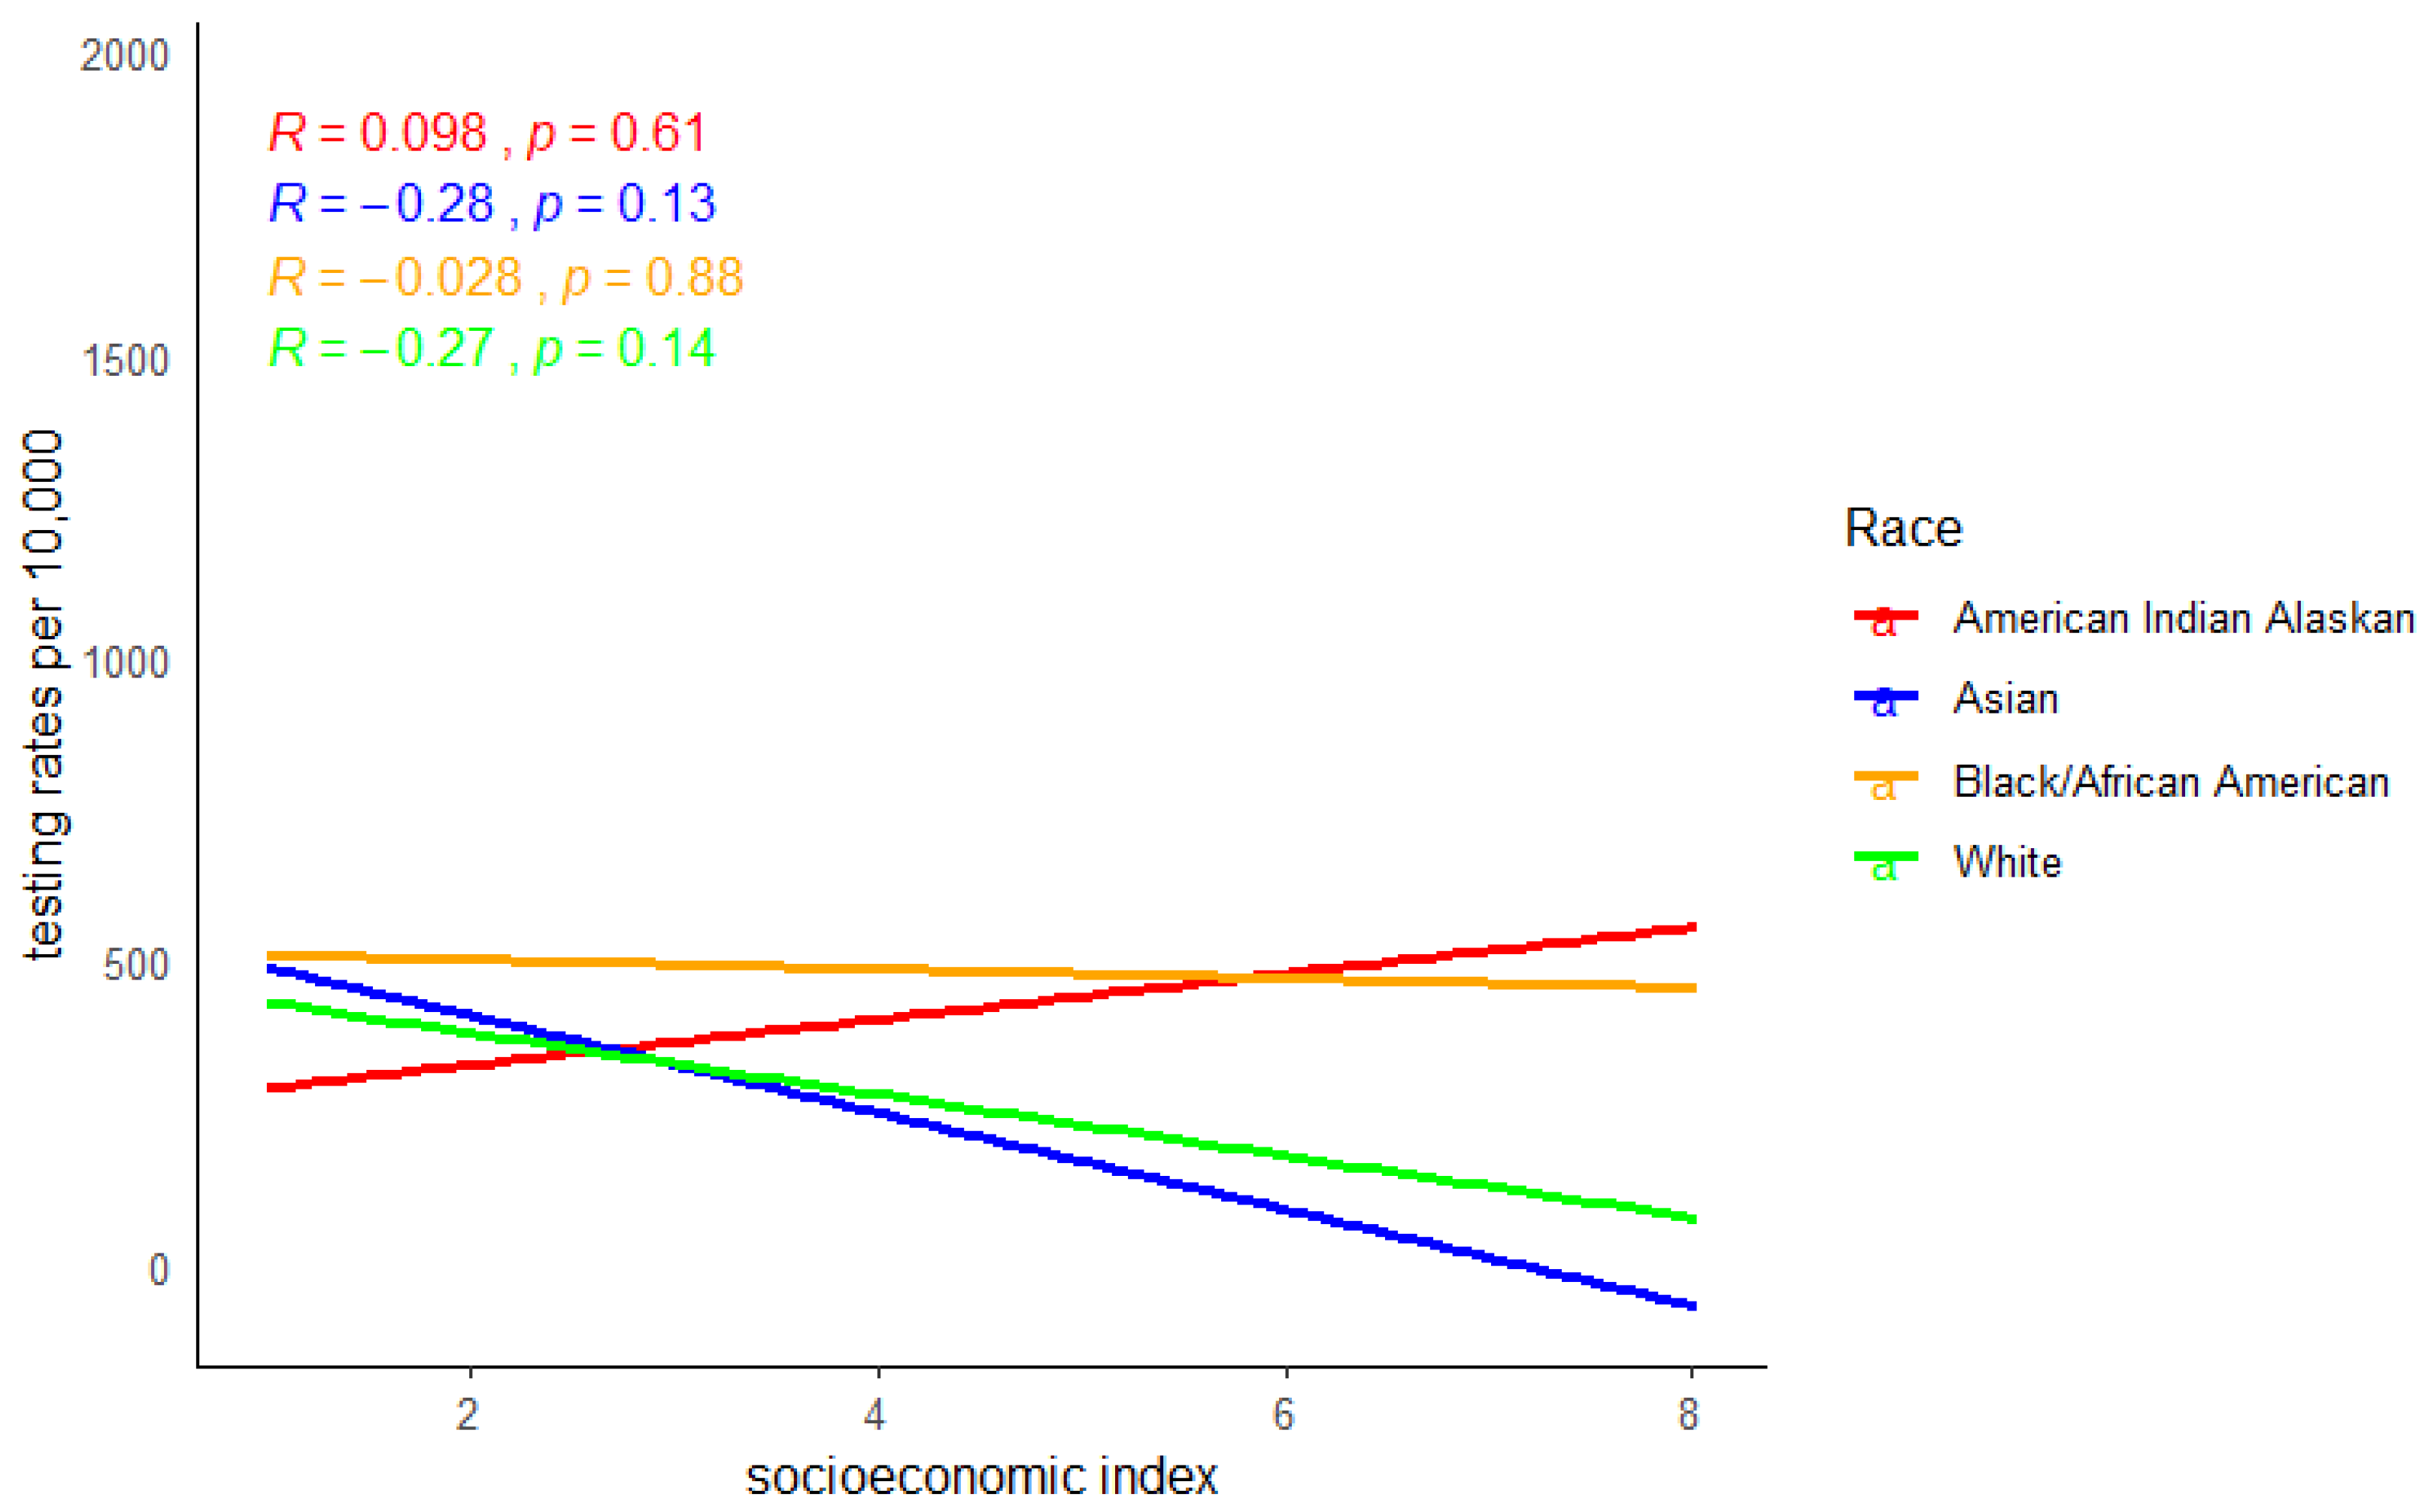
We ran a Pearson correlation analysis between testing rates per 10,000 populations in St. Louis and the socioeconomic index of residential zip codes stratified by race. We used the rlm function in the MASS library to perform a robust linear regression using an M estimator to model the relationship between testing rates per 10,000 population and race, controlling for the socioeconomic index of zip codes [31]. We also looked at the trend in testing over the study period stratified by race and the socioeconomic index and mapped testing rates in different zip codes in St. Louis City using the Geographic Information System software called Quantum GIS (QGIS). All statistical analyses were performed in R 4.2.0, [32] except mapping, for which we used QGIS. Visualization of the COVID-19 testing rate per 10,000 population and race, the socioeconomic index, and the population distribution of the various races in St. Louis City was performed using choropleth maps (color maps). Choropleth maps are widely used because they form a visual representation of a given statistical data type [33,34]. In our study, the choropleth maps were used to represent and enhance visual comparison of the COVID-19 testing rate and the socioeconomic index among the selected Zip codes in St. Louis City. To create choropleth maps, the equal intervals method was employed in the QGIS environment. The COVID-19 testing rate was categorized into five classes, while SES was categorized into three classes (low, medium, and high).

3. Results

Overall testing rates in St. Louis were 303.97 per 10,000 population. Blacks/African Americans and American Indian/Alaskan Natives tested the highest at 374.26 and 360.63 per 10,000, respectively, followed by Whites and Asians, who tested at 247.77 and 242.41 per 10,000, respectively. See Table 1.
There was generally a weak association and a lack of statistical significance between testing rates and the socioeconomic index. However, the direction of the association indicated that race modified the relationship between testing rates and the socioeconomic index of residential zip codes. For all races, testing rates decreased as the socioeconomic index of residential zip codes improved, except for American Indian/Alaskan Natives, whose testing rates increased slightly as the socioeconomic index improved. See Figure 2.
For every 10,000 population, compared with the White population, the number of tests was higher by 125 (1.25%), 448 (4.48%), and 32 (0.32%) among Blacks/African Americans, American Indians/Alaskan Natives, and Asians, respectively, when controlling for the socioeconomic index of residential zip codes. Additionally, for every 10,000 population, the number of tests decreased by 56 (0.56%) for every unit improvement in the socioeconomic index of the residential zip codes. This finding was statistically significant, as was the difference in testing rates between American Indians/Alaskan Natives and Whites. However, while Blacks/African Americans and Asians tested more frequently than Whites, the difference in testing rates was not statistically significant. See Table 2.
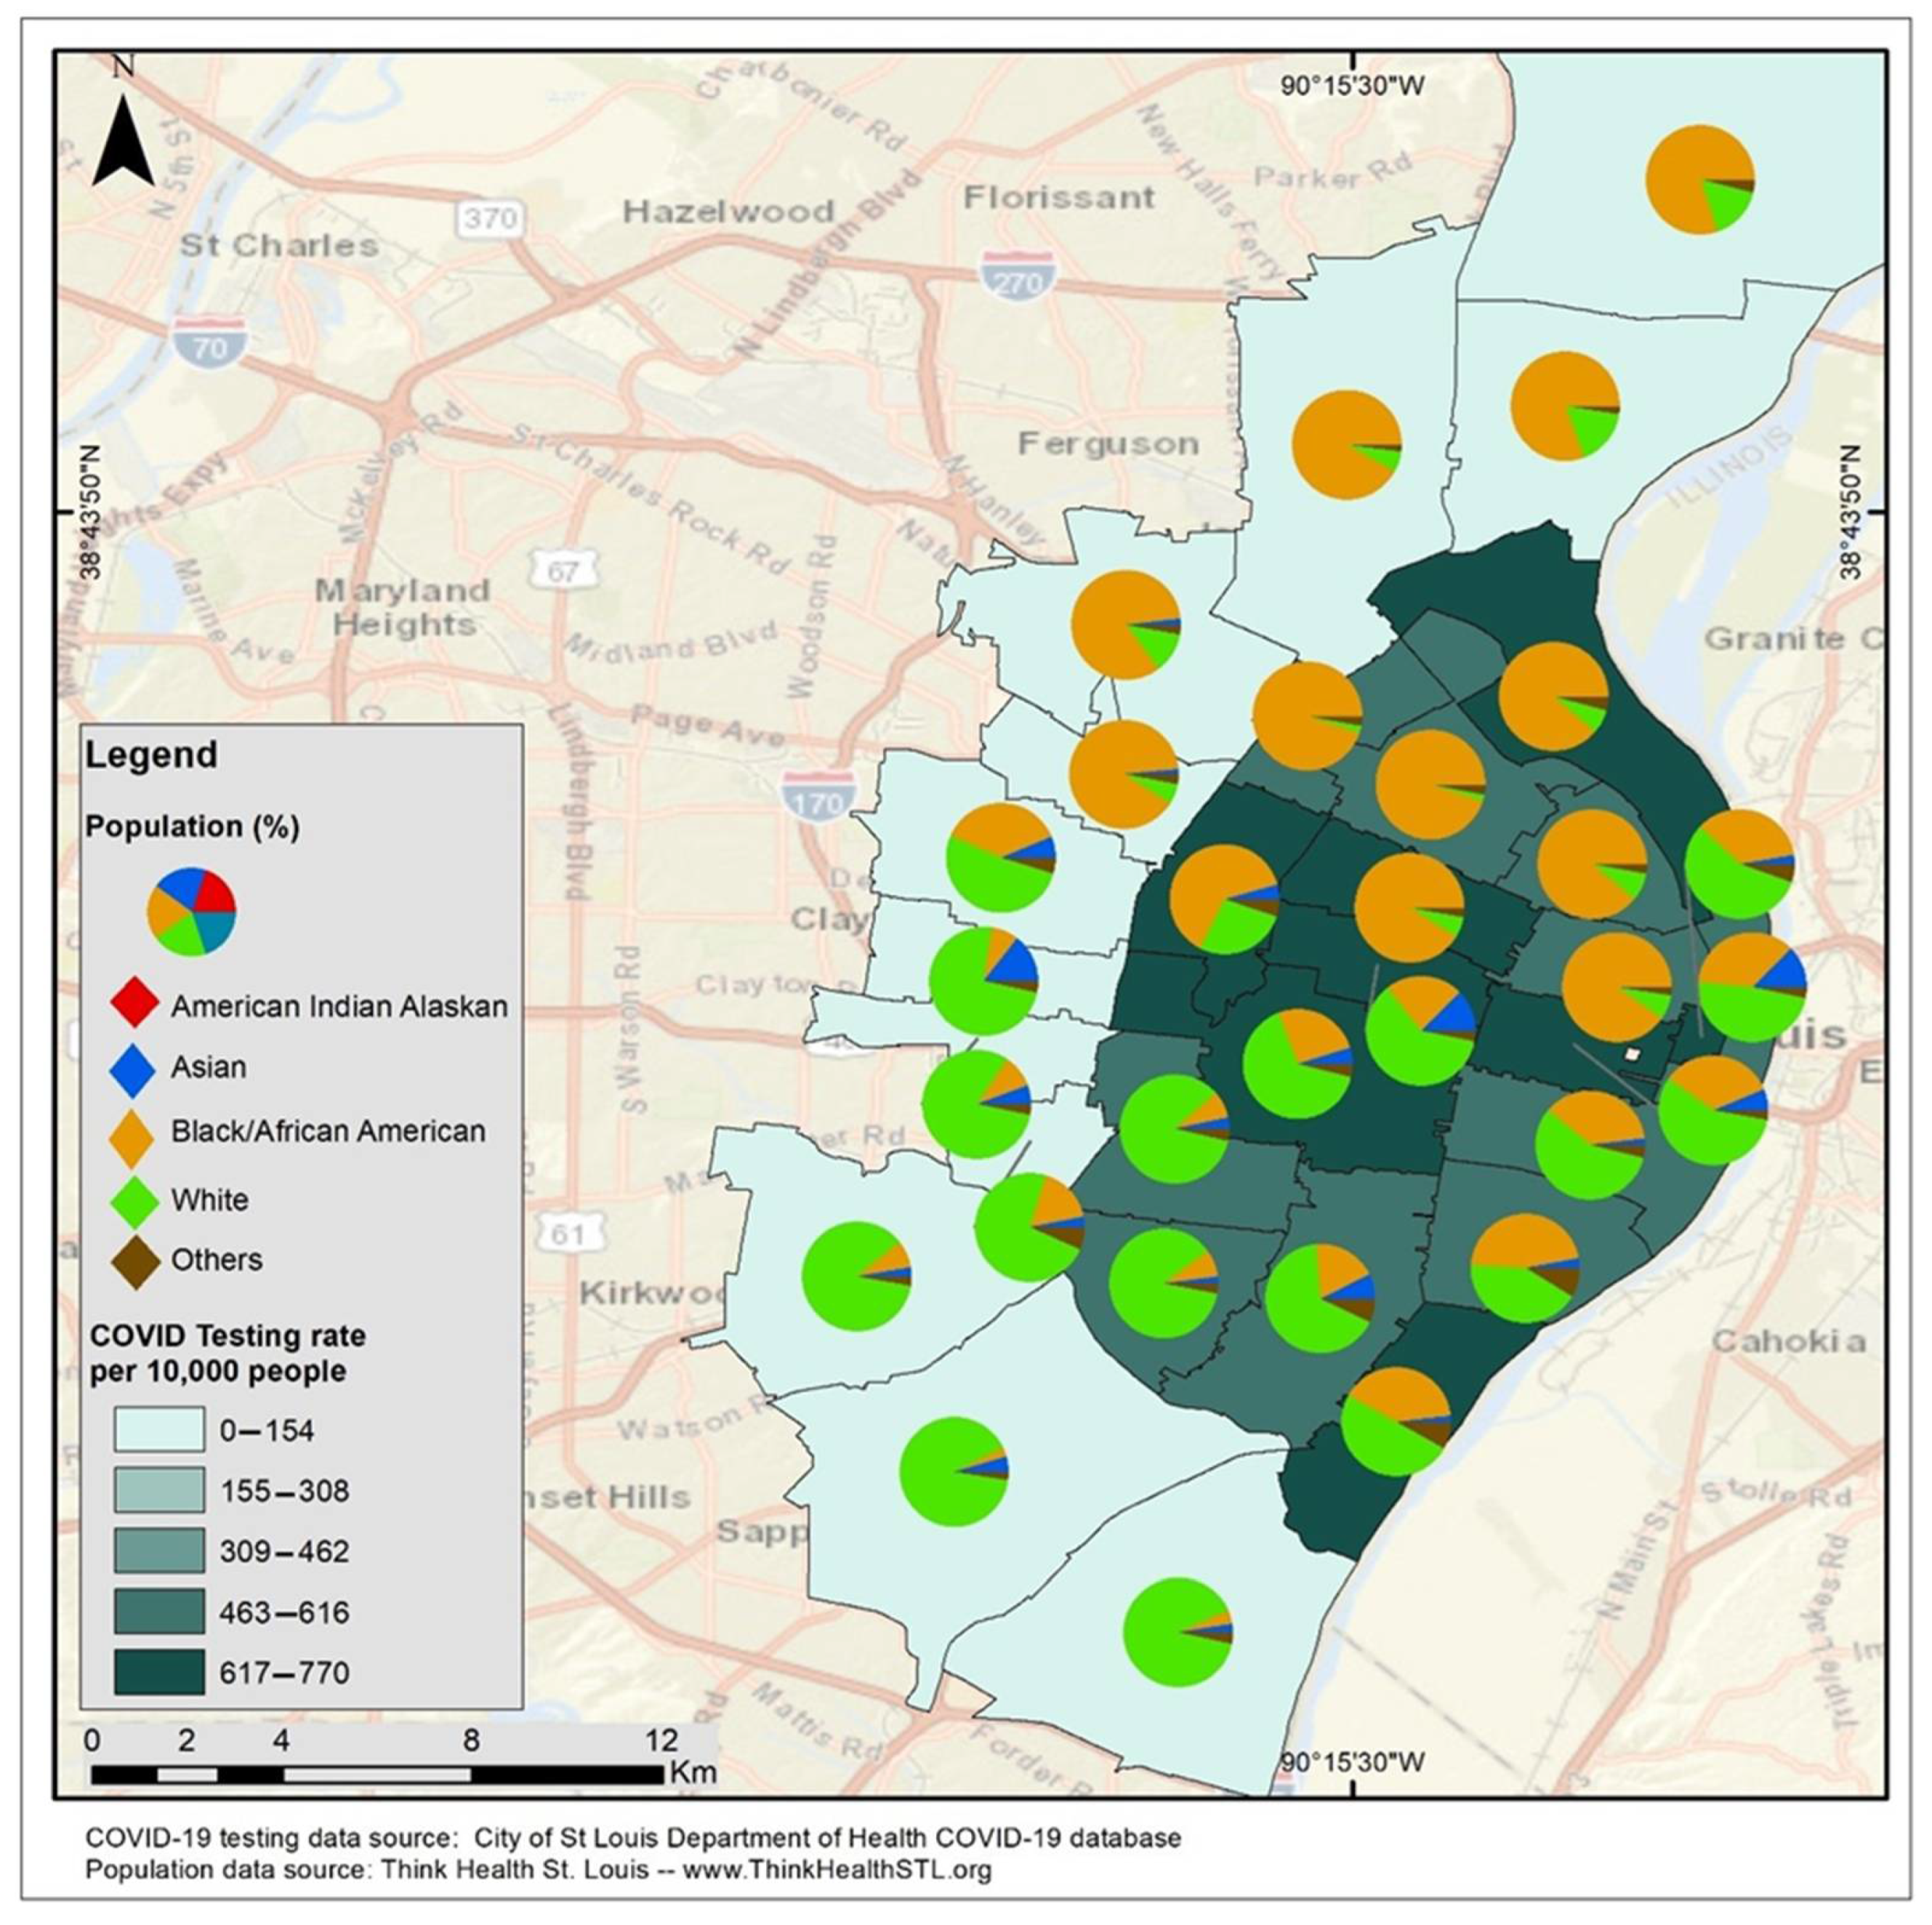
Residential zip codes in the inner core of St. Louis City generally had higher testing rates regardless of their socioeconomic index. In contrast, the zip codes in the periphery of St. Louis City had lower testing rates independent of their socioeconomic indexes. See Figure 3.
The racial population distribution had less influence on the testing rates in St. Louis City, as the zip codes with predominantly Black or White populations in the inner core of St. Louis City had higher testing rates, whereas the zip codes in the periphery of St. Louis City with predominantly Black or White populations had lower testing rates. See Figure 4.
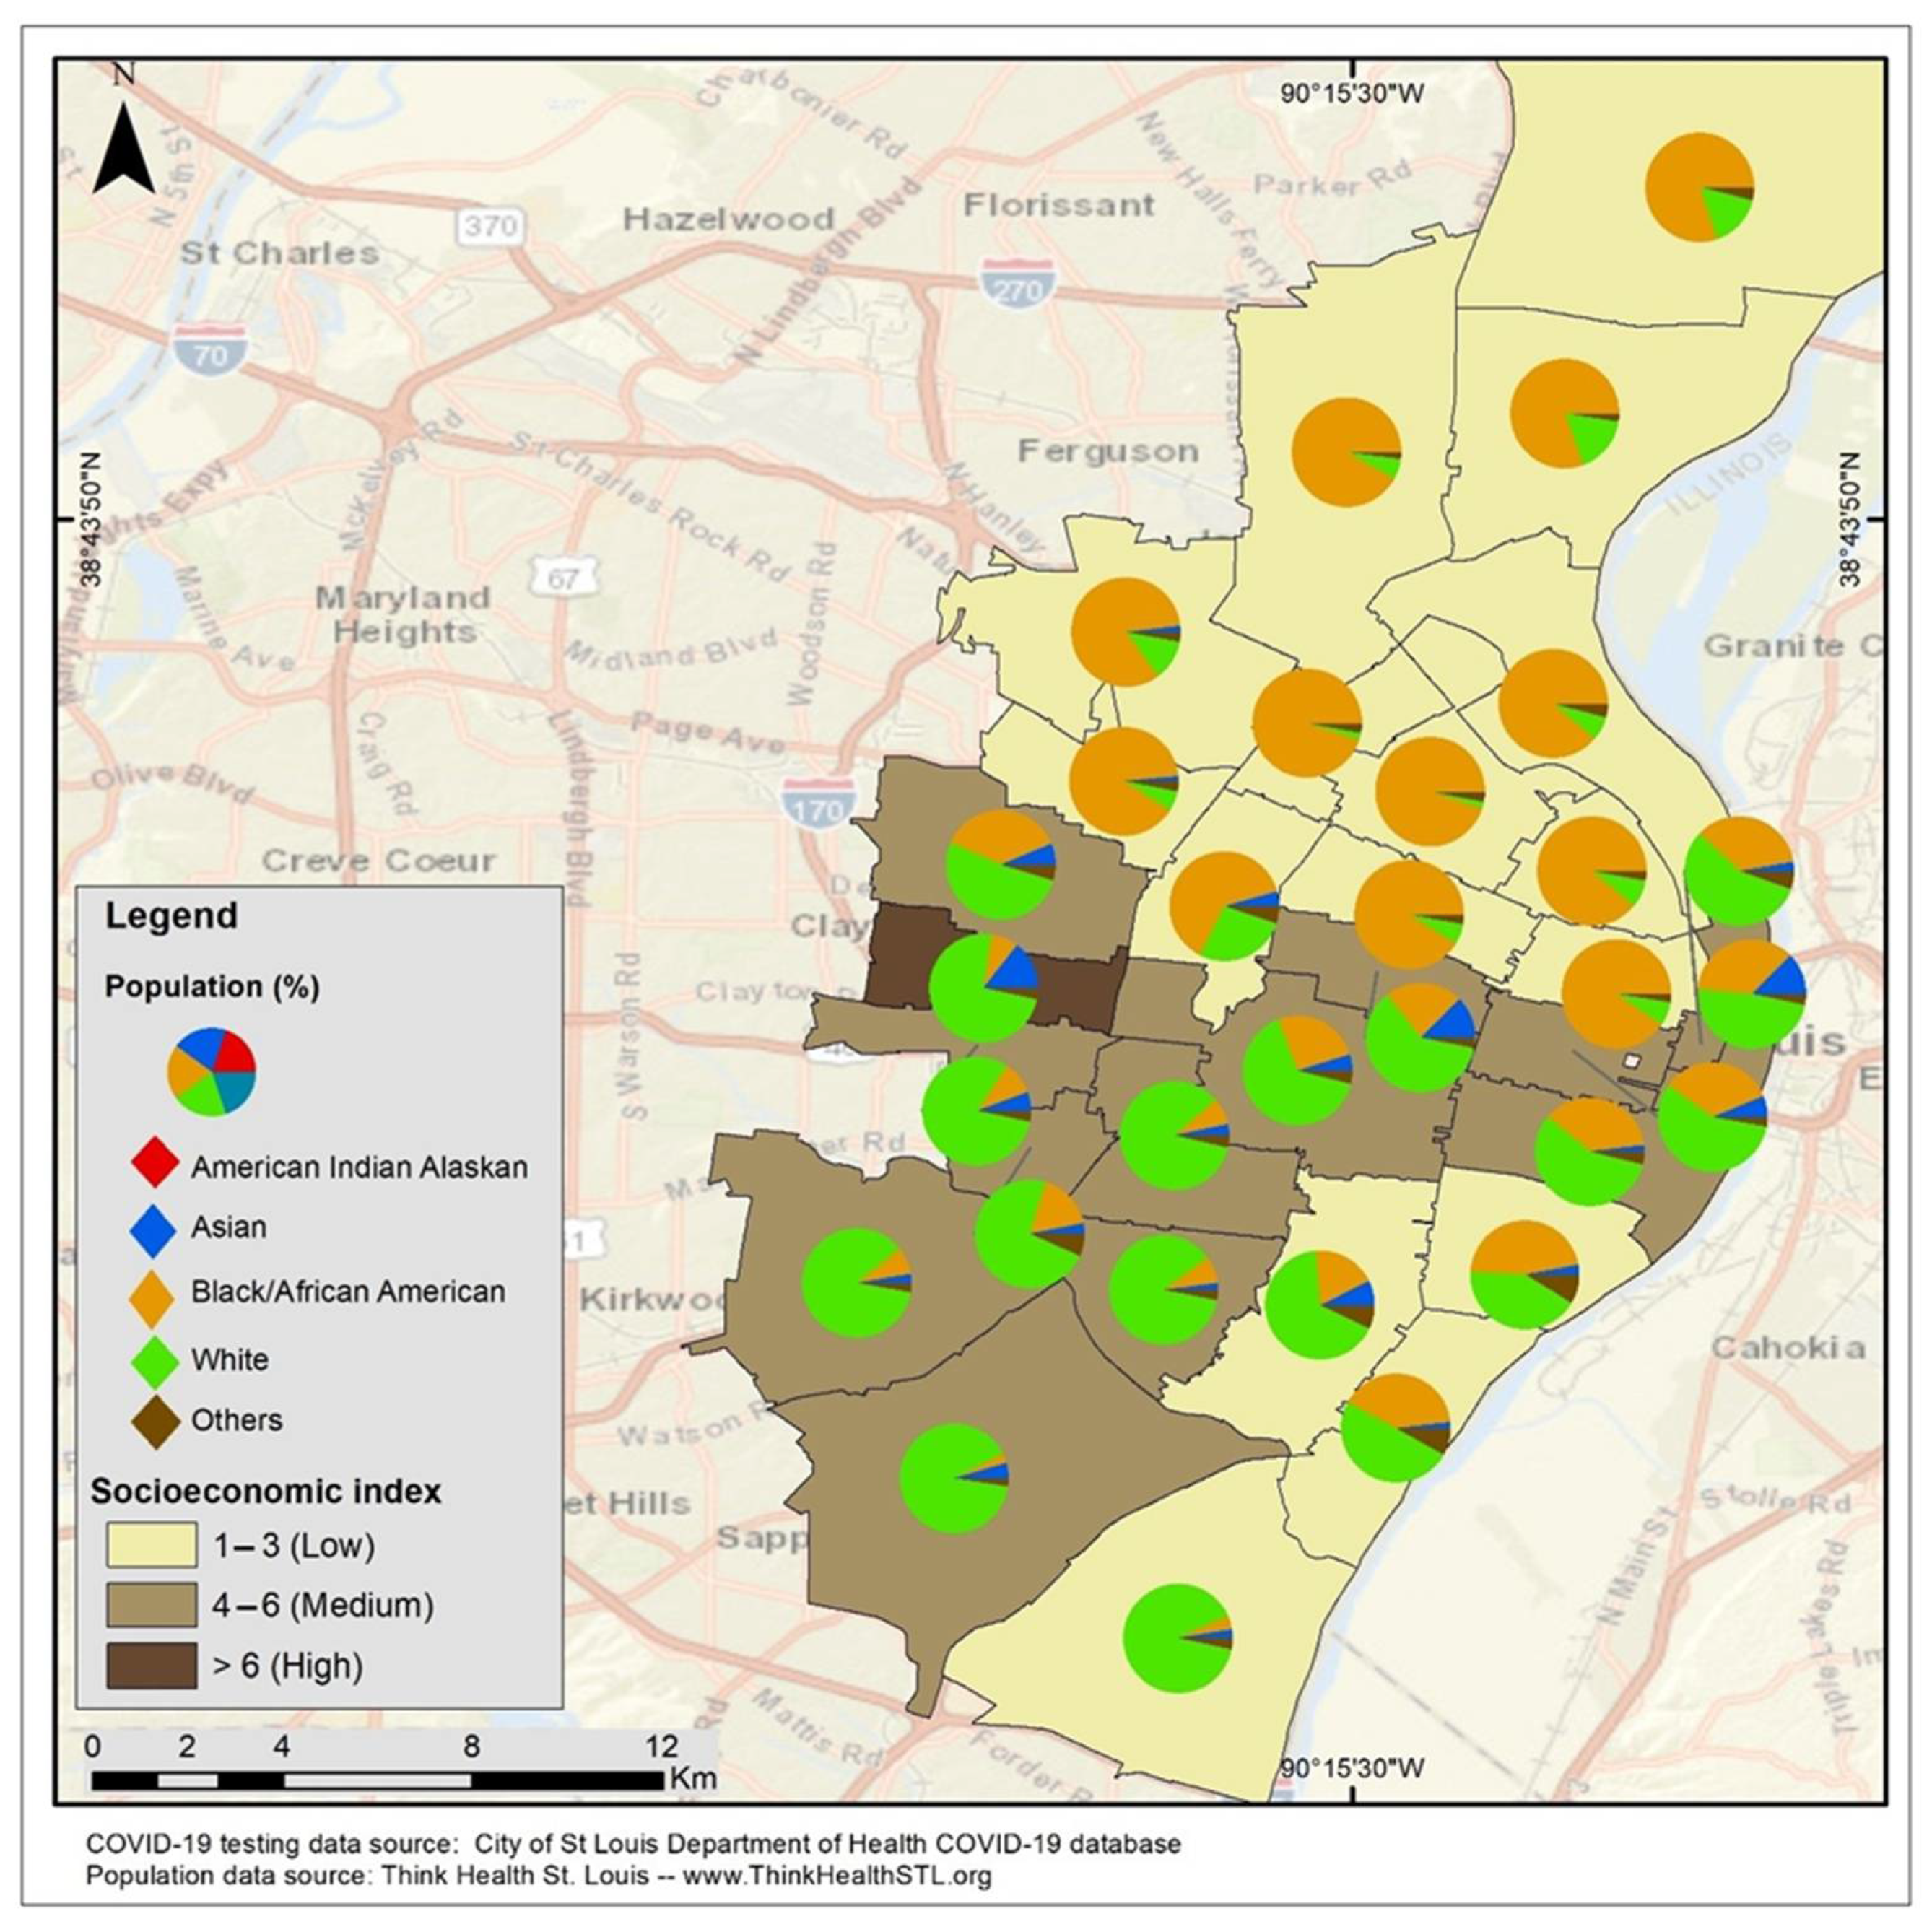
Largely, zip codes with predominantly White populations in St. Louis City were of a higher socioeconomic index, whereas those with mostly Black populations were of a lower socioeconomic index. See Figure 5.
There was a general increase in testing rates over the study period. Testing rates were highest among American Indian/Alaskan Natives in March, June, July, August, September, October, and November, while Asians had the highest rates in May. Overall, testing rates were higher among minorities compared with Whites and were highest in October across all racial groups, except for the Asian ethnicity. See Figure 6.
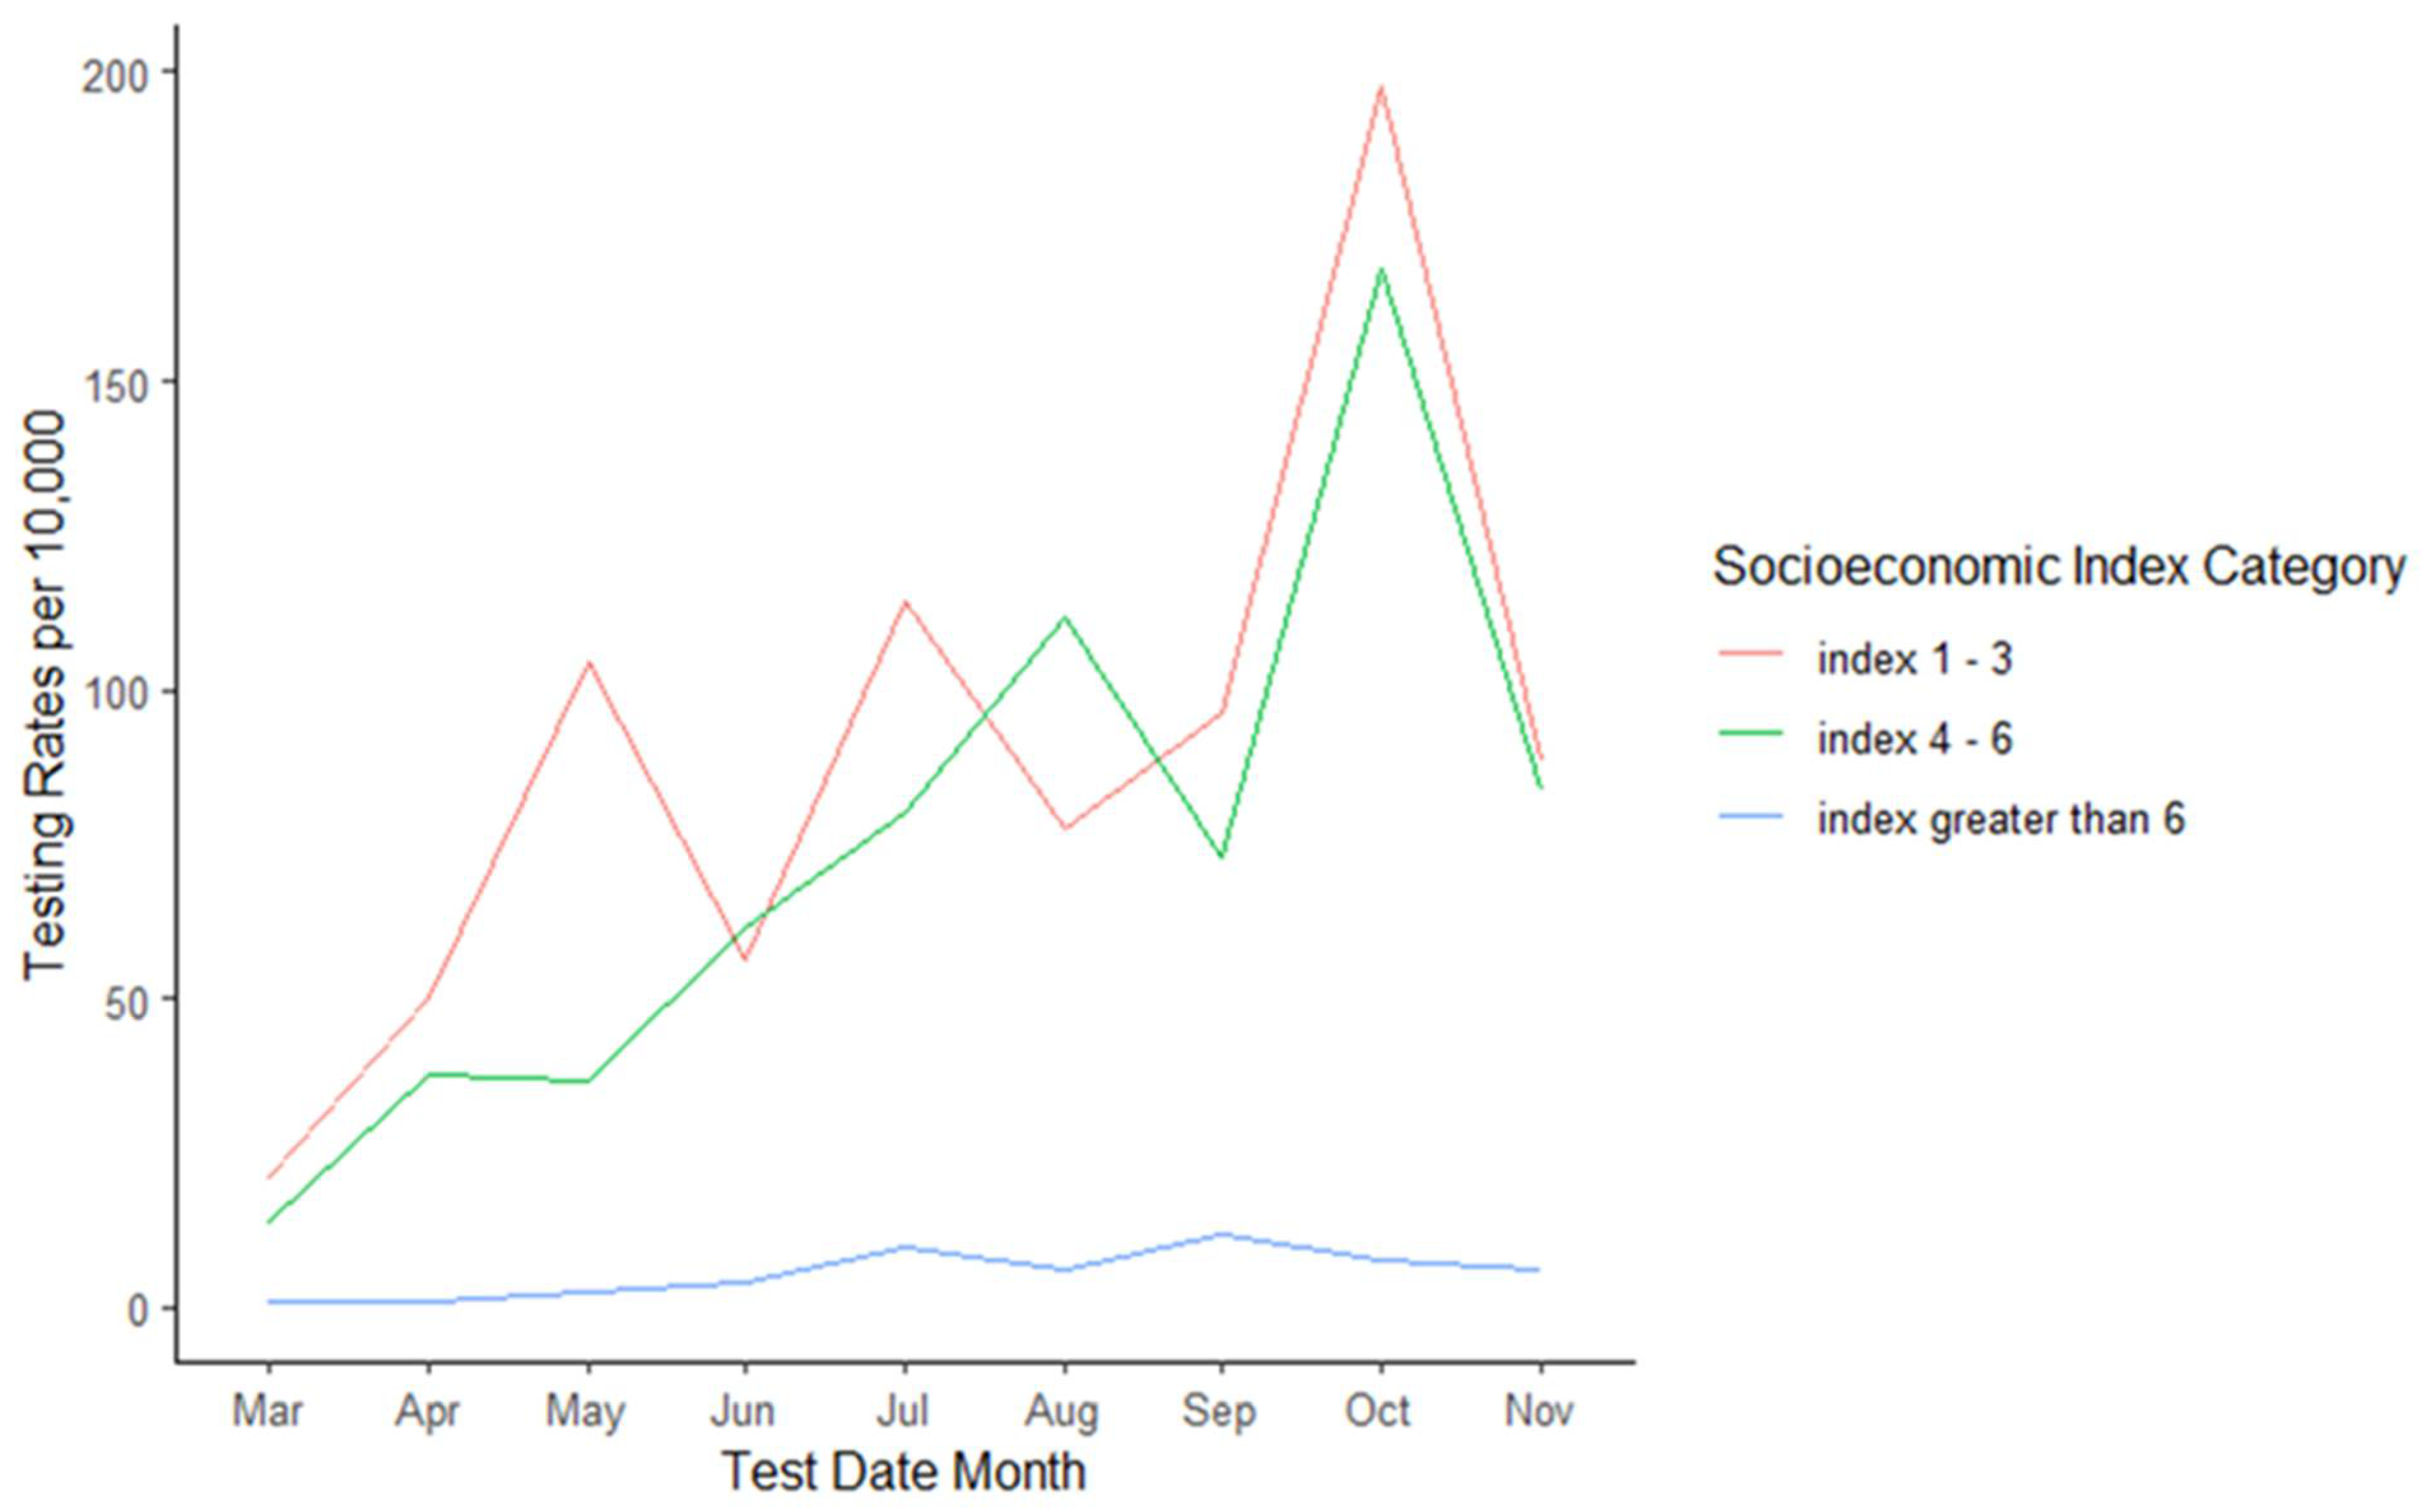
Testing rates were generally highest in low socioeconomic zip codes, followed by middle socioeconomic zip codes, and lowest in high socioeconomic zip codes. See Figure 7.

4. Discussion

Our study found that, mainly, racial minorities and, generally, populations in the lower socioeconomic index tested more than those in the higher socioeconomic index. This disparity may be attributed to factors such as larger household sizes and overcrowded living conditions in low-income and minority communities, which increase the likelihood of exposure and reduce opportunities for isolation if exposed to COVID-19 [35,36]. Additionally, individuals in these communities are more likely to be essential workers, making remote work less feasible and further increasing their exposure risk [37,38,39,40].
A key finding from our study is the successful intervention by the St. Louis City Department of Health (DOH), which established testing sites in socioeconomically deprived areas. By targeting areas with higher concentrations of lower SES populations, St. Louis effectively reduced the testing disparity between racial minority groups and the predominantly White population. This approach, which was recognized nationally for its equity-focused strategy, highlights the potential for public health policies anchored in equity to address disparities and improve outcomes during public health crises like the COVID-19 pandemic [41,42].
The results from St. Louis differ from findings in other studies, such as Brandt et al. (2021) [43], which identified significant disparities in testing access in North Carolina, particularly among Latinx and non-Latinx Black populations, as well as in several other jurisdictions where minorities, in general, had lower COVID-19 testing rates compared with the White population [7,8,9,10,11,12,13,14]. This variation underscores the fact that public health responses can differ significantly across regions, influenced by local policies and interventions. The St. Louis experience demonstrates that deliberate, equity-driven policy decisions can effectively mitigate disparities in testing rates. For future pandemics, adopting similar strategies—such as placing testing resources in underserved areas—could help achieve more equitable outcomes nationwide. Such interventions are crucial in reducing disparities and ensuring that all communities have access to essential health resources.
Furthermore, our study observed that testing rates increased over time, likely because of rising COVID-19 prevalence and improved availability of testing kits. Peaks in testing rates around October might also be linked to increased testing before Thanksgiving gatherings.
Geographical analysis of testing rates in St. Louis showed that areas with lower testing rates were often on the periphery of the city, while the inner core had higher testing rates. This spatial pattern did not correlate with SES or the racial distribution. Future research should explore additional factors contributing to this geographic disparity and consider targeted interventions in areas with historically lower testing rates.
Overall, the St. Louis case illustrates the effectiveness of equity-focused public health policies and provides a model for addressing disparities in future public health emergencies. Implementing similar strategies nationally could bridge gaps in testing access and improve health outcomes for marginalized communities.

5. Conclusions

Race, socioeconomic status (SES), and geographical location can influence COVID-19 testing rates. These factors must be considered in policymaking to increase testing rates effectively. Our study highlights areas in the St. Louis region where testing access was limited, which can inform efforts to improve testing availability in those areas. We found that lower SES areas had higher average testing rates than higher SES areas. This may be due to local policies in St. Louis aimed at increasing testing access in low-access areas and the fact that residents of lower SES areas are more likely to work in essential jobs and cannot work remotely, making them more susceptible to COVID-19 exposure.
Additionally, minority groups such as Black, Asian, and American Indian/Alaskan Native individuals tested more frequently than the predominantly White population in St. Louis. This suggests that targeted policy interventions can effectively address testing access disparities among minorities.
An interesting finding of this study is that the inner core of St. Louis had higher testing rates regardless of socioeconomic status and racial composition, whereas peripheral areas had lower testing rates irrespective of these factors. This suggests that efforts to increase testing should focus more on the periphery of St. Louis, and policymakers should explore strategies to achieve this. Additionally, geographical mapping can be used in other jurisdictions to identify areas with poor COVID-19 testing access, allowing for the implementation of intentional, equity-focused public health policies to bridge disparities in testing access and improve health outcomes for marginalized communities during future health emergencies, as demonstrated in St. Louis.
Our results may not be generalizable as we only used data from St. Louis City. Additionally, our findings should be interpreted cautiously to avoid ecological fallacy, as this was an ecological study that did not account for individual-level factors such as comorbidity, religious and socio-political affiliations, etc.
Furthermore, demographic data such as race were poorly collected in the early days of the pandemic, which may have impacted our findings. A significant limitation was the inability to analyze testing rates for the Hispanic/Latino population in St. Louis City, as the data aggregated smaller racial populations under the category “other”. Future studies in the Midwest should consider this level of racial categorization, particularly given the significant burden of COVID-19 morbidity and mortality among Hispanics/Latinos in the US [44,45,46,47].
Lastly, the population sizes extracted for the estimation of our testing rates were from 2022. The population size at each zip code in 2020 may likely vary from what we used for our analysis. Therefore, our testing rates are only a rough estimate of the COVID-19 testing rates during 2020. Also, we could not access the population sizes for our study from the US Census Bureau because of the granular nature of our research. Thus, some of our racial population sizes were likely below the threshold that the US Census Bureau could share data.
Future studies should consider examining this testing behavior at the individual level to see how both geographical and individual level characteristics contribute to the testing patterns in the St. Louis area. This will also ensure that a larger sample size is generated to include more variables or factors both at the individual and geographic levels to examine which of those variables or factors are statistically significantly associated with testing in St. Louis or similar urban areas.

Author Contributions

Conceptualization, S.B.G., W.O.E., M.B.U., N.T.T. and P.O.; Methodology, S.B.G., W.O.E., J.N., M.B.U., N.T.T. and P.O.; Formal analysis, S.B.G., W.O.E. and J.N.; Data curation, S.B.G. and W.O.E.; Writing-original draft, S.B.G., W.O.E., J.N., C.N.O.N., V.V., H.S., M.B.U., N.T.T. and P.O.; Writing- review & editing, S.B.G., W.O.E., J.N., C.N.O.N., V.V, H.S., M.B.U., N.T.T. and P.O.; Visualization, S.B.G. and J.N.; Supervision, N.T.T. and P.O. All authors have read and agreed to the published version of the manuscript.

Funding

This research received no external funding.

Institutional Review Board Statement

This study does not involve human subjects. The data used for this research is publicly available from the St. Louis City Department of Health and does not involve any direct interaction with individuals or their personal information. As such, it is exempt from Institutional Review Board (IRB) review.

Informed Consent Statement

Not applicable. As this study does not involve human subjects, informed consent is not required.

Data Availability Statement

The publicly available dataset analyzed in this study are referenced in the Section 2 of this paper. The testing data used in this study is publicly available from the St. Louis City Department of Health. The specific dataset and access instructions can be found on their official website.

Conflicts of Interest

The authors declare no conflict of interest.

References

  1. WHO Coronavirus (COVID-19) Dashboard. Available online: https://covid19.who.int (accessed on 20 February 2022).
  2. COVID-19 Map. Johns Hopkins Coronavirus Resource Center. Available online: https://coronavirus.jhu.edu/map.html (accessed on 29 October 2020).
  3. CDC. COVID Data Tracker. Centers for Disease Control and Prevention. Published 28 March 2020. Available online: https://covid.cdc.gov/covid-data-tracker (accessed on 6 March 2021).
  4. Tai, D.B.G.; Shah, A.; Doubeni, C.A.; Sia, I.G.; Wieland, M.L. The Disproportionate Impact of COVID-19 on Racial and Ethnic Minorities in the United States. Clin. Infect. Dis. 2021, 72, 703–706. [Google Scholar] [CrossRef] [PubMed]
  5. Sze, S.; Pan, D.; Nevill, C.R.; Gray, L.J.; Martin, C.A.; Nazareth, J.; Minhas, J.S.; Divall, P.; Khunti, K.; Abrams, K.R.; et al. Ethnicity and clinical outcomes in COVID-19: A systematic review and meta-analysis. EClinicalMedicine 2020, 29, 100630. [Google Scholar] [CrossRef] [PubMed]
  6. CDC. Cases, Data, and Surveillance. Centers for Disease Control and Prevention. Published 11 February 2020. Available online: https://archive.cdc.gov/#/details?url=https://www.cdc.gov/coronavirus/2019-ncov/covid-data/investigations-discovery/hospitalization-death-by-race-ethnicity.html (accessed on 6 March 2021).
  7. Dalva-Baird, N.P.; Alobuia, W.M.; Bendavid, E.; Bhattacharya, J. Racial and Ethnic Inequities in the Early Distribution of U.S. COVID-19 Testing Sites and Mortality. Eur. J. Clin. Investig. 2021, 51, e13669. [Google Scholar] [CrossRef] [PubMed]
  8. Cho, W.K.T.; Hwang, D.G. Differential Effects of Race/Ethnicity and Social Vulnerability on COVID-19 Positivity, Hospitalization, and Death in the San Francisco Bay Area. J. Racial Ethn. Health Disparities 2023, 10, 834–843. [Google Scholar] [CrossRef] [PubMed]
  9. Credit, K. Neighbourhood Inequity: Exploring the Factors Underlying Racial and Ethnic Disparities in COVID-19 Testing and Infection Rates Using ZIP Code Data in Chicago and New York. Reg. Sci. Policy Pract. 2020, 12, 1249–1272. [Google Scholar] [CrossRef]
  10. Capasso, A.; Kim, S.; Ali, S.H.; Jones, A.M.; DiClemente, R.J.; Tozan, Y. Socioeconomic Predictors of COVID-19-Related Health Disparities among United States Workers: A Structural Equation Modeling Study. PLoS Glob. Public Health 2022, 2, e0000117. [Google Scholar] [CrossRef]
  11. Hsiao, C.J.; Patel, A.G.M.; Fasanya, H.O.; Stoffel, M.R.; Beal, S.G.; Winston-McPherson, G.N.; Campbell, S.T.; Cotten, S.W.; Crews, B.O.; Kuan, K.; et al. The Lines That Held Us: Assessing Racial and Socioeconomic Disparities in SARS-CoV-2 Testing. J. Appl. Lab. Med. 2021, 6, 1143–1154. [Google Scholar] [CrossRef]
  12. Seto, E.; Min, E.; Ingram, C.; Cummings, B.; Farquhar, S.A. Community-Level Factors Associated with COVID-19 Cases and Testing Equity in King County, Washington. Int. J. Environ. Res. Public Health 2020, 17, 9516. [Google Scholar] [CrossRef]
  13. Lieberman-Cribbin, W.; Tuminello, S.; Flores, R.M.; Taioli, E. Disparities in COVID-19 Testing and Positivity in New York City. Am. J. Prev. Med. 2020, 59, 326–332. [Google Scholar] [CrossRef]
  14. National Public Radio (NPR). In Large Texas Cities, Access to Coronavirus Testing May Depend on Where You Live. Available online: https://www.npr.org/sections/health-shots/2020/05/27/862215848/across-texas-black-and-hispanic-neighborhoods-have-fewer-coronavirus-testing-sit (accessed on 3 September 2024).
  15. The Lost Month: How a Failure to Test Blinded the U.S. to COVID-19. Aggressive Screening Might Have Helped Contain the Coronavirus in the United States. But Technical Flaws, Regulatory Hurdles and Lapses in Leadership Let It Spread Undetected for Weeks. New York Times. Available online: https://www.nytimes.com/2020/03/28/us/testing-coronaviruspandemic.htmlextracted (accessed on 11 July 2022).
  16. Farley, J.E. Black-White Housing Segregation in the City of St. Louis: A 1988 Update. Urban Aff. Q. 1991, 26, 442–450. [Google Scholar] [CrossRef]
  17. The COVID Racial Data Tracker. The COVID Tracking Project. Available online: https://covidtracking.com/race (accessed on 28 October 2020).
  18. Available online: https://usafacts.org/data/topics/people-society/population-and-demographics/our-changing-population/state/missouri/county/st-louis-city?endDate=2021-01-01&startDate=2010-01-01 (accessed on 22 September 2022).
  19. Logan, J.R. The Persistence of Segregation in the 21st Century Metropolis. City Community 2013, 12, 160–168. [Google Scholar] [CrossRef] [PubMed]
  20. Available online: https://www.bbc.com/news/ay/magazine-17361995 (accessed on 22 September 2022).
  21. Divided Cities Lead to Differences in Health. Available online: https://forthesakeofall.files.wordpress.com/2013/11/policy-brief-4.pdf (accessed on 22 September 2022).
  22. Block, J.P.; Scribner, R.A.; DeSalvo, K.B. Fast food, race/ethnicity, and income: A geographic analysis. Am. J. Prev. Med. 2004, 27, 211–217. [Google Scholar]
  23. Acevedo-Garcia, D.; Lochner, K.A.; Osypuk, T.L.; Subramanian, S.V. Future directions in residential segregation and health research: A multilevel approach. Am. J. Public Health 2003, 93, 215. [Google Scholar] [CrossRef] [PubMed]
  24. Goodman, M.S.; Gaskin, D.J.; Si, X.; Stafford, J.D.; Lachance, C.; Kaphingst, K.A. Self-reported segregation experience throughout the life course and its association with adequate health literacy. Health Place 2012, 18, 1115–1121. [Google Scholar] [CrossRef]
  25. Kaphingst, K.A.; Goodman, M.; Pyke, O.; Stafford, J.; Lachance, C. Relationship between self-reported racial composition of high school and health literacy among community health center patients. Health Educ. Behav. 2012, 39, 35–44. [Google Scholar] [CrossRef] [PubMed]
  26. Available online: https://medicine.wustl.edu/news/early-covid-19-shutdowns-helped-st-louis-area-avoid-thousands-of-deaths/ (accessed on 23 September 2022).
  27. Available online: https://www.ksdk.com/article/news/health/coronavirus/st-louis-county-coronavirus-timeline-travel-quarantine/63-f81d92d8-dd20-4557-a487-101ce826418f (accessed on 23 September 2022).
  28. Available online: https://www.stlouis-mo.gov/government/departments/health/news/first-death-related-covid-19-city-of-st-louis.cfm (accessed on 27 September 2022).
  29. Available online: https://www.stlouis-mo.gov/covid-19/data/ (accessed on 27 September 2022).
  30. Available online: https://exploremohealth.org/reports/zip-health-report/ (accessed on 26 September 2022).
  31. Venables, W.N.; Ripley, B.D. Modern Applied Statistics with S, 4th ed.; Springer: New York, NY, USA, 2002; ISBN 0-387-95457-0. [Google Scholar]
  32. R Core Team. R: A Language and Environment for Statistical Computing; R Foundation for Statistical Computing: Vienna, Austria, 2022; Available online: https://www.R-project.org/ (accessed on 2 January 2023).
  33. Palsky, G. Connections and exchanges in European thematic cartography. The case of 19th century choropleth maps. Rev. Belg. Géogr. 2008, 3–4, 413–426. [Google Scholar] [CrossRef]
  34. Al-Ghamdi, A.M. Optimising the Selection of a Number of Choropleth Map Classes. In Thematic Cartography for the Society; Bandrova, T., Konecny, M., Zlatanova, S., Eds.; Lecture Notes in Geoinformation and Cartography; Springer: Cham, Switzerland, 2014. [Google Scholar] [CrossRef]
  35. Martin, C.A.; Jenkins, D.R.; Minhas, J.S. Socio-demographic heterogeneity in the prevalence of COVID-19 during lockdown is associated with ethnicity and household size: Results from an observational cohort study. EClinicalMedicine 2020, 25, 100466. [Google Scholar] [CrossRef]
  36. Jing, Q.-L.; Liu, M.-J.; Zhang, Z.-B. Household secondary attack rate of COVID-19 and associated determinants in Guangzhou, China: A retrospective cohort study. Lancet Infect. Dis. 2020, 20, 1141–1150. [Google Scholar] [CrossRef]
  37. Hawkins, D. Differential occupational risk for COVID-19 and other infection exposure according to race and ethnicity. Am. J. Ind. Med. 2020, 63, 817–820. [Google Scholar] [CrossRef]
  38. McClure, E.S.; Vasudevan, P.; Bailey, Z.; Patel, S.; Robinson, W.R. Racial Capitalism within Public Health—How Occupational Settings Drive COVID-19 Disparities. Am. J. Epidemiol. 2020, 189, 1244–1253. [Google Scholar] [CrossRef]
  39. Do, D.P.; Frank, R. Using Race- and Age-Specific COVID-19 Case Data to Investigate the Determinants of the Excess COVID-19 Mortality Burden among Hispanic Americans. Demogr. Res. 2021, 44, 699–718. [Google Scholar] [CrossRef]
  40. Gaitens, J.; Condon, M.; Fernandes, E.; McDiarmid, M. COVID-19 and Essential Workers: A Narrative Review of Health Outcomes and Moral Injury. Int. J. Environ. Res. Public Health 2021, 18, 1446. [Google Scholar] [CrossRef] [PubMed]
  41. Available online: https://www.stlouis-mo.gov/government/departments/health/communicable-disease/COVID-19/documents/upload/COVID-19-One-Year-Report-City-of-St-Louis.pdf (accessed on 26 September 2022).
  42. Post-Dispatch Article. Available online: https://www.stltoday.com/lifestyles/health-med-fit/coronavirus/what-s-working-in-public-health-cdcdirector-finds-reason-for-hope-in-st-louis/article_9ae68eba-4fe8-55d6-be7a-1e7ee44f7bee.html (accessed on 23 October 2022).
  43. Brandt, K.; Goel, V.; Keeler, C.; Bell, G.J.; Aiello, A.E.; Corbie-Smith, G.; Wilson, E.; Fleischauer, A.; Emch, M.; Boyce, R.M. SARS-CoV-2 Testing in North Carolina: Racial, Ethnic, and Geographic Disparities. Health Place 2021, 69, 102576. [Google Scholar] [CrossRef] [PubMed]
  44. Rentsch, C.T.; Kidwai-Khan, F.; Tate, J.P.; Park, L.S.; King Jr, J.T.; Skanderson, M.; Justice, A.C. Patterns of COVID-19 testing and mortality by race and ethnicity among United States veterans: A nationwide cohort study. PLoS Med. 2020, 17, e1003379. [Google Scholar] [CrossRef] [PubMed]
  45. Baquero, B.; Gonzalez, C.; Ramirez, M.; Chavez Santos, E.; Ornelas, I.J. Understanding and Addressing Latinx COVID-19 Disparities in Washington State. Health Educ. Behav. 2020, 47, 845–849. [Google Scholar] [CrossRef]
  46. Gil, M.R.; Marcelin, J.R.; Zuniga-Blanco, B.; Marquez, C.; Mathew, T.; Piggott, D.A. COVID-19 Pandemic: Disparate Health Impact on the Hispanic/Latinx Population in the United States. J. Infect. Dis. 2020, 222, 1592–1595. [Google Scholar] [CrossRef]
  47. New York Fatalities COVID-19 by Race/Ethnicity. New York Department of Health. Published 2020. Available online: https://www1.nyc.gov/assets/doh/downloads/pdf/imm/covid-19-deaths-race-ethnicity-05142020-1.pdf (accessed on 11 July 2022).
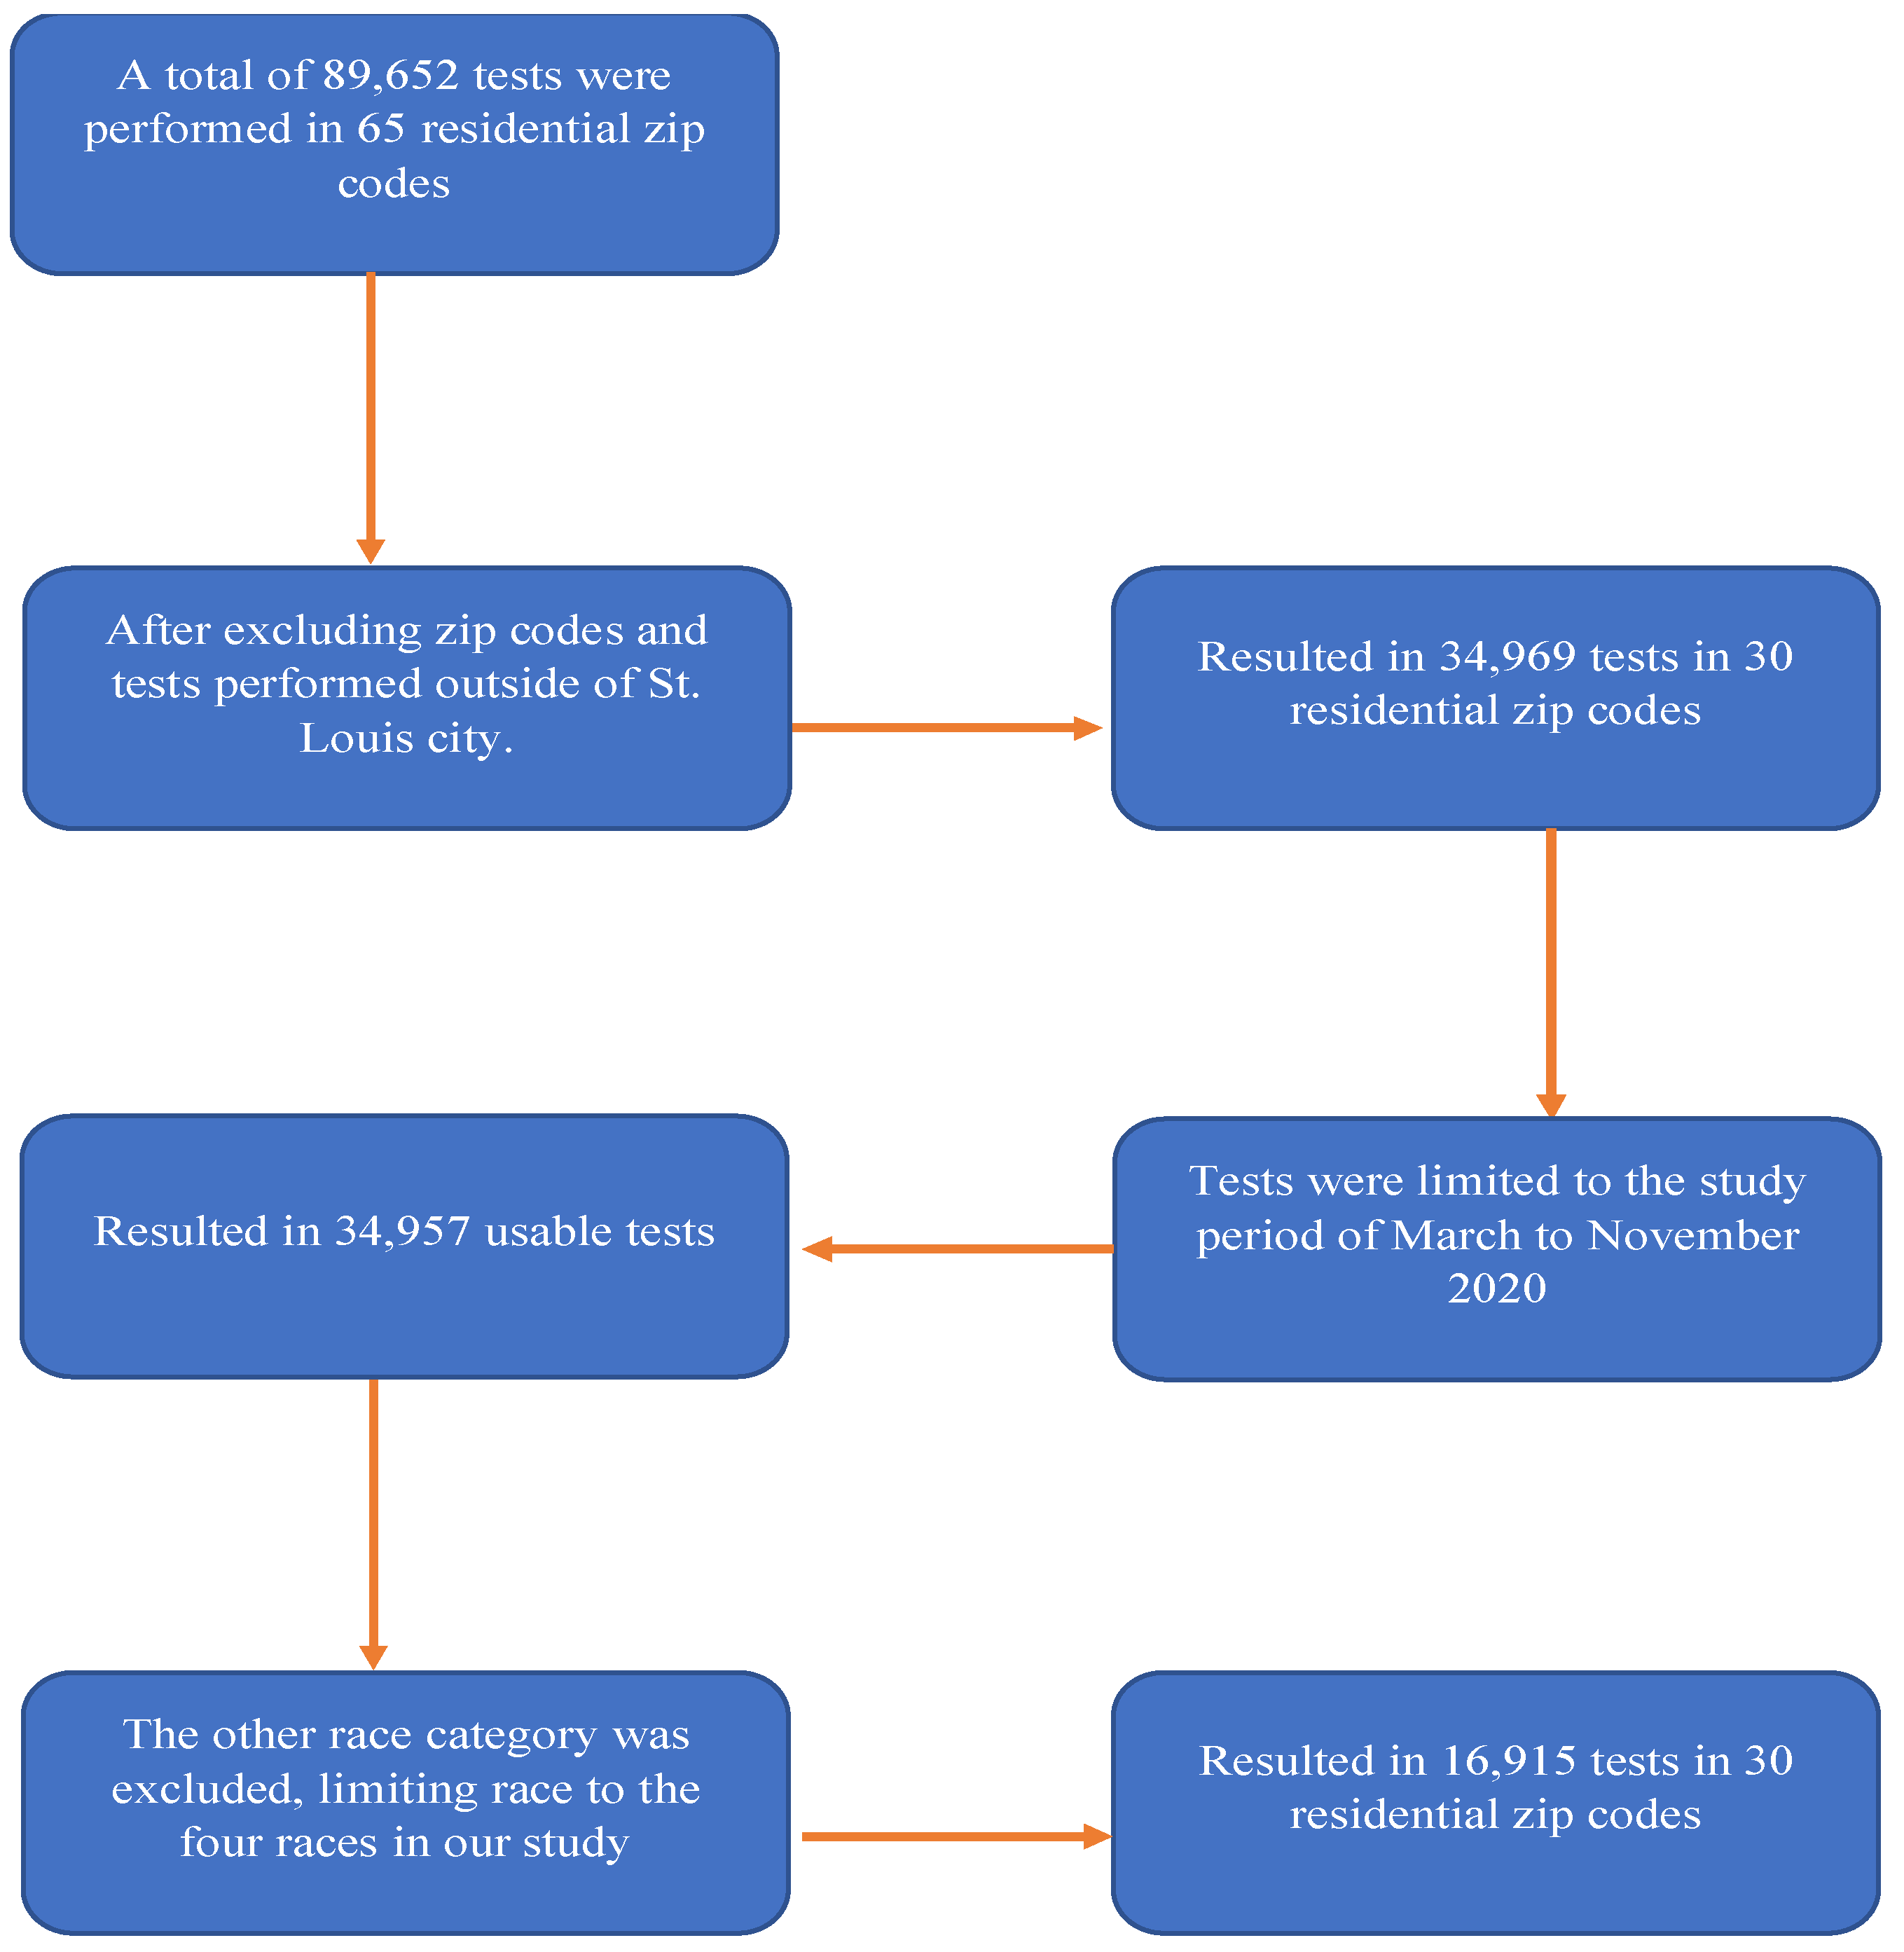
Figure 1. Study attrition diagram showing our inclusion and exclusion criteria.
Covid 04 00103 g001
Figure 2. Pearson correlation between testing rates and the socioeconomic index of zip codes stratified by race.
Covid 04 00103 g002
Figure 3. Map showing the COVID-19 testing rates and the socioeconomic index of St. Louis City in the USA.
Covid 04 00103 g003
Figure 4. Map showing the distribution of the racial population over COVID-19 testing rates in St. Louis City in the USA. www.ThinkHealthSTL.org (accessed on 20 February 2022).
Covid 04 00103 g004
Figure 5. Map showing the distribution of the racial population over the socioeconomic index of St. Louis City in the USA. www.ThinkHealthSTL.org (accessed on 20 February 2022).
Covid 04 00103 g005
Figure 6. Trend in testing rates over time stratified by race.
Covid 04 00103 g006
Figure 7. Trend in testing rates over time stratified by socioeconomic index categories.
Covid 04 00103 g007
Table 1. Descriptive statistics of testing rates in St. Louis with results aggregated over n = 30 zip codes.
CovariatesAverage Testing Rates Per 10,000 (sd)
Overall Testing in St. Louis303.97 (57.28)
Race
American Indian/Alaskan native360.63 (12.14)
Asian242.41 (3.52)
Blacks/African Americans374.26 (34.94)
White247.77 (4.14)
Socioeconomic Index Category
Index 1–3 (low SES)363.23 (17.20)
Index 4–6 (medium SES)259.53 (14.69)
Index > 6 (high SES)33.57 (51.56)
Table 2. Association between testing rates and race, controlling for the socioeconomic index.
CharacteristicsBetaCI (95%)p-Value
Intercept538318, 7590.000
Race
Whiterefrefref
American Indian Alaskan448188, 7070.000
Asian32−184, 2470.773
Black/African American125−75, 3250.222
Socioeconomic index−56−110, −2.40.040
Disclaimer/Publisher’s Note: The statements, opinions and data contained in all publications are solely those of the individual author(s) and contributor(s) and not of MDPI and/or the editor(s). MDPI and/or the editor(s) disclaim responsibility for any injury to people or property resulting from any ideas, methods, instructions or products referred to in the content.